



Abstract
Research on the relation of gender inequality and subjective well-being (SWB) has produced inconsistent results. We suggest that culture moderates this relation such that inequality has a greater adverse effect in liberal than in conservative societies. The present studies, using aggregate data from 86 countries (Study 1) and 145,975 individuals’ data from 69 countries (Study 2), support this notion. Among liberal countries, inequality was negatively related to SWB for both men and women; there was some evidence that this relation was stronger for women. In conservative countries, the relation was not significant. Previously, the same liberal–conservative continuum moderated the relation between income inequality and SWB for groups with both high and low socioeconomic status (SES) but particularly for the low-SES group. The similarity in results across two different studies strongly supports the notion that the relation between inequality and SWB is contingent on where specific cultures are located on the liberal–conservative continuum.
There is ample evidence that women get a smaller share of resources and opportunities than men do. For example, across the globe in 2018, women were less likely to participate in the labor force than men (48.5% vs. 74.5%, respectively; The World Bank, 2021a), and when they did have a job, women were paid on average 10% to 30% less than men (The World Bank, 2013). These disparities were used as explanations for a number of gender differences, including women’s greater susceptibility to depression (Nolen-Hoeksema, 2001) and indications of lower self-esteem (Kling et al., 1999). Relatedly, it was also expected that greater gender inequality would be associated with lower subjective well-being (SWB) for women both on their own and relative to men (e.g., Nolen-Hoeksema, 2001). The rationale was that women with fewer rights and resources cannot adequately satisfy their needs and that this will negatively affect their SWB (Tay & Diener, 2011).
This prediction was not supported. For example, Stevenson and Wolfers (2009) noted that since the 1970s, women’s lives in the United States have improved while their happiness has decreased. Several cross-national comparisons, designed to establish a relation between gender equality and women’s SWB, produced null or conflicting results (e.g., Graham & Chattopadhyay, 2013; Meisenberg & Woodley, 2015). A recent meta-analysis of 281 effect sizes (Batz-Barbarich et al., 2018) also showed that greater national gender inequality did not predict gender differences in SWB.
We proposed that gender equality may elicit different psychological reactions, including SWB, in conservative and liberal societies. Rather than viewing inequality as anathema and equality as an ideal, psychologists have noted that people view social groups featuring equality as fair but also chaotic and unstable; hierarchical social groups are perceived as not fair but structured and stable (Friesen et al., 2014). Functionality of hierarchical social structures explains their prevalence in human societies (Halevy et al., 2011; Sidanius & Pratto, 1999). This formulation also suggests that hierarchy and equality are constantly in a tug of war, which, in turn, raises the question of what determines which of the two is more preferable in a given society. Li et al. (2019) proposed that the determining factor is whether the societies tend to be liberal or conservative.
As a political ideology, liberalism espouses freedom for individuals and equality across groups, two components that, according to Duckitt (2001), must exist for social democracy to emerge. Lack of freedom implies restriction of individuals’ rights, and inequality implies disparities in entitlements, both in opposition to liberal ideology (Giddens, 1998; Jost et al., 2003). Political conservatism, on the other hand, promotes tradition and hierarchy and, therefore, favors inequalities as the natural order. As put forward by Jost et al. (2003), “The core ideology of conservatism stresses resistance to change and justification of inequality” (p. 339). Where societies are located on the liberal–conservative continuum can determine whether they are more or less liberal compared with each other.
Cultural values such as the liberal–conservative continuum provide a general guide for what is important in life and for the type of societal conditions that are fitting and appropriate (Suh & Oishi, 2002). Research on cultural fit has shown that individuals benefit when their personal characteristics match such frameworks (e.g., Stephens et al., 2012). Relatedly, we suggest that, on average, people also benefit from a match between cultural values and the social reality in which they live. A better fit implies that societal conditions of people’s lives are generally in line with a planned and orderly scheme that cultural values prescribe. Conversely, a greater degree of mismatch suggests that things might be amiss as they deviate from what people are taught to expect. This rationale has direct implications for how gender inequality might affect SWB.
Equal opportunities for education and professional development as well as flexible social roles (as opposed to traditional sex roles) help to facilitate individual freedom and enhance equality—the two liberal components; however, equal opportunities and flexible roles also challenge traditional family and societal order, thus undermining conservative values. Conversely, disparate gender roles and unequal division of educational and professional resources oppose liberal values. These considerations lead to our prediction: The degree of fit between how equal men and women are in a given society and whether the society is liberal or conservative indicates whether social reality is what it should be, leading both men and women to a sense of content or dissatisfaction. It follows that greater gender equality should enhance SWB in liberal cultures but reduce it in conservative cultures.
Statement of Relevance
Gender inequality is at the forefront of feminist concerns. Thus, the failure to find consistent relations between indices of inequality and subjective well-being (SWB) is perplexing. Our research offers a solution that has broad societal implications. We suggest that gender inequality, which is measured with objective criteria such as job-participation rate, may elicit different psychological reactions in liberal and conservative societies. In liberal societies, which encourage liberty and equality for everyone regardless of gender and race, women and men benefit from greater gender equality. In conservative cultures, which justify hierarchical social structures and value traditional roles, greater gender equality may not benefit, and may even do damage to, people’s SWB. We found that gender equality indeed improves people’s SWB, especially for women, in liberal but not in conservative countries. Our findings imply that the implications of gender inequality should be evaluated through the prism of the cultural context.
For additional thoughts on some of the psychological issues of societal importance considered in this research, see the invited Further Reflections piece authored by Markus, available online at https://doi.org/10.1177/09567976211018206 and on pages 952 to 954 of this issue.
The moderator effect of cultural liberalism should work for all members of society but might be truer for women. The rationale is that women are generally the disadvantaged party, and a disadvantage is more of a reason for concern and preoccupation than an advantage. Thus, whether the system justifies or condemns the disadvantage may also carry greater weight for women.
There is already some evidence that culture moderates reactions to gender inequality. Kinias and Kim (2012) found that Hong Kong Chinese women saw gender inequality as less unjust and were less angered because of it than European American women. Tesch-Römer et al. (2008) reported that in countries rejecting women’s participation in the work force, less participation was related to greater well-being in women relative to men; in countries accepting women’s participation, the corresponding relation was reversed. Neither effect was significant, but the moderator effect of culture (the difference between effects) was. Unfortunately, the data set available to these authors was underpowered (the number of countries in each group ranged from 11 to 32). In addition, both gender inequality and liberalism were defined only in terms of participation in the work force, limiting the generalizability of the results.
Like gender inequality, and contrary to expectation, income inequality is not related consistently to SWB (for a review, see Schneider, 2016; for a meta-analysis, see Ngamaba et al., 2017). Li et al. (2019) showed that this relation is also contingent on the cultural context. They found that in conservative countries (but not in liberal countries), inequality was beneficial to everyone but more so for individuals with low socioeconomic status (SES). Note the parallel in results between the two lines of research. The model predicts that culture on the liberal–conservative continuum moderates the relation between inequality (gender inequality or income inequality) and SWB for the entire population but more so for the disadvantaged (women or low-SES groups).
The Present Studies
The model posits that the relation between gender equality and SWB should be moderated by whether the culture is liberal or conservative. Specifically, the model predicted that the moderator effect would apply to both men and women but might be greater for women. The prediction of a moderator effect (i.e., an Inequality × Liberalism interaction) can take a strong or weak form. The strong prediction is that the relation between inequality and SWB is negative in liberal countries and positive in conservative countries. The weak prediction is that only one of these relations will materialize. We tested this model with aggregate data from the Gallup World Poll (Study 1) and with individual data from Waves 5 and 6 of the World Value Survey (WVS; Study 2). In both studies, we used multiple additional sources of data that were necessary for testing our predictions.
Study 1
Method
We obtained indices of SWB from the 2005 to 2009 Gallup World Poll. 1 The objective was to predict SWB from (a) gender inequality indices of world countries, (b) cultural values representing the liberal–conservative continuum, and (c) the interaction between these two variables. Li et al. (2019), who also used the Gallup poll data, found an average effect size (r) of .49 for the Income Inequality × Liberalism interaction. Using this effect size, we found that the power for the 86 countries that had all the variables used in the analysis was .99; for an average effect size (r = .30), the power was .81 (for the list of countries, see Table S1 in the Supplemental Material available online).
Subjective well-being
The 2005 to 2009 Gallup World Poll was administered to representative samples of individuals 16 years or older from each of 151 countries (data necessary for analyses from Gallup as well as from other sources were available for 86 countries). Primary sampling units were stratified by population size or geography. Random-route procedures were used to sample households. Surveys were conducted by phone in countries with high telephone coverage (more than 80% of the population) or in person in countries with less coverage. SWB comprised three components: life satisfaction, positive emotions, and negative emotions. Life satisfaction was measured with Cantril’s (1965) 11-step ladder scale. Participants were asked to choose on which step, from the worst (lowest step) to the best (highest step) possible life, they feel they stand at the present time. Diener et al. (2010) reported a .82 correlation between the Gallup national ladder scores and life-satisfaction scores assessed by the non-Gallup survey with a 4-point Likert-type scale. Positive and negative emotions were measured by asking participants whether or not they experienced (an emotion) a lot during the previous day (1 = yes, 2 = no). After we reversed the individual scores, the positive- and negative-emotion scores were, respectively, the averages across positive-emotion scores (smile/laugh, experience enjoyment; α = .62) and across negative-emotion scores (worry, sadness, depression, anger; α = .68); higher averages indicated more positivity for the positive emotions and more negativity for the negative emotions. The analyses were conducted for each SWB component.
Gender-equality index
The index was obtained from the World Economic Forum’s Global Gender Gap Report. (Bekhouche et al., 2013, 2014; Hausmann et al., 2006, 2007, 2008, 2009, 2010, 2011, 2012). The index is based on the average of three separate equality scores for education, economy, and politics (a fourth score, health, was not included because we deemed it too close in content to SWB; however, analyses with the three-variable and four-variable indices produced essentially identical results). In each domain, the score is the average of a number of variables (e.g., in economy, the score is based on the ratio of women’s earned income to that of men, the ratio of women in technical and professional positions to that of men, etc.). The overall score ranged from 0 to 1.0; higher scores indicate greater gender equality. Index scores were obtained for the years in which the SWB data were collected and then averaged across these years (for the scores, see Table S1).
Liberalism
In line with Duckitt’s (2001; see also Duckitt & Sibley, 2009) seminal review, there is now a wide consensus that the liberal–conservative continuum includes two factors: right-wing authoritarianism, or social conservatism, and social-dominance orientation, or economic conservativism. At the individual level, these two dimensions similarly generate a host of conservative behaviors and ideologies, albeit for different motivational reasons. Those include right-wing politics, discrimination, inequality, ethnocentrism, and militarism. As noted earlier, at the aggregate level, both factors must be at their liberal end in order for social democracy to emerge.
Duckitt (2001; Duckitt & Sibley, 2009) posited that two of Hofstede’s six cultural dimensions (see the Country Comparison Tool at https://www.hofstede-insights.com) represent the liberal–conservative dimension. First, higher levels on the power-distance dimension (endowing greater legitimacy to power inequality) represent economic conservatism. Second, the collectivism end of the individualism–collectivism dimension (elevating the nation/group over both individuals and other nations/groups or promoting nationalism over universalism) represents social conservatism.
High power distance implies hierarchical structure, a hallmark of conservatism and a marker of inequality. Members of collectivistic societies are bound by their relational concerns and social obligations to social groups (Markus & Kitayama, 1991), a feature that can limit individual freedom and lead to a higher degree of susceptibility to social influence and conformity (Bond & Smith, 1996). These personal-value or interpersonal processes are characteristics of conservative individuals and groups (for a review, see Jost et al., 2018). A direct relation between collectivistic and conservative values was reported by Cukur et al. (2004). Thus, lower power distance and lower collectivism (high individualism) represent, respectively, equality and freedom—the two key elements of liberalism.
Hofstede (1980) already noted that collectivistic countries are likely to be high in power distance. In the current data set, a factor analysis of Hofstede’s six dimensions yielded three factors (eigenvalues > 1). Power distance and collectivism had a loading of more than .78 on the first factor, accounting for 32% of the variance (higher power distance had a correlation of .66 with greater collectivism); cross loadings by other values on this factor and by power distance and collectivism on other factors were less than .32. We, therefore, reverse-scored power distance and combined it with individualism to create a liberalism composite; higher scores indicated higher liberalism (for power-distance and individualism scores and their composites after standardization, see Table S1).
Control variables
We controlled for three variables that were shown to have an association with SWB: gross domestic product (GDP), income inequality, and religiosity. Previous research has shown that people from wealthier countries tend to report higher life satisfaction (Diener & Oishi, 2000). Income inequality is related to SWB, although the relation depends on cultural context. Finally, people from more religious countries report greater SWB (Diener et al., 2011).
Gross domestic product
GDP per capita was collected from the CIA World Factbook (2021), covering the years 2009 to 2012. The values were in U.S. dollars. They were log transformed because of skewness.
Income inequality
Inequality was measured by the Gini index of family income; the index can range from 0 to 1 (higher values indicate higher inequality). The data were obtained from The World Bank (2021c) for the years 2005 to 2014.
Religiosity
Relevant data were collected by the Gallup World Poll (2005–2009) and published by Diener et al. (2011, Table 4). For each country, Diener et al. presented the percentage of respondents in each country who answered yes to the question, “Is religion an important part of your life?”
Results
Correlations among all country-level variables, including the SWB measures, are presented in Table S2 in the Supplemental Material. In the main analyses, means of men and women for each SWB component were examined in a two-level multilevel regression model, with gender nested in countries. Level 1 (gender) accounted for 1% of total variance for life satisfaction, 3% of total variance for positive emotions, and 19% of total variance for negative emotions. At Level 1, we estimated the intercept and effect of gender (men = −.5, women = .5; the intercept represents the mean for the population). Gender was specified as a random effect, so that every country gets the best-fitting gender effect. At Level 2, we estimated the effects of liberalism, gender equality, and their interaction, adjusting for three control variables. Each of these variables was centered at the grand mean. The questions of interest were, first, whether liberalism moderates the effect of gender equality in the general population (Gender Equality × Liberalism interaction) and, second, whether this moderator effect is itself moderated by gender (Gender Equality × Liberalism × Gender). All Level 1 and Level 2 data were standardized to obtain estimates that represent standardized coefficients.
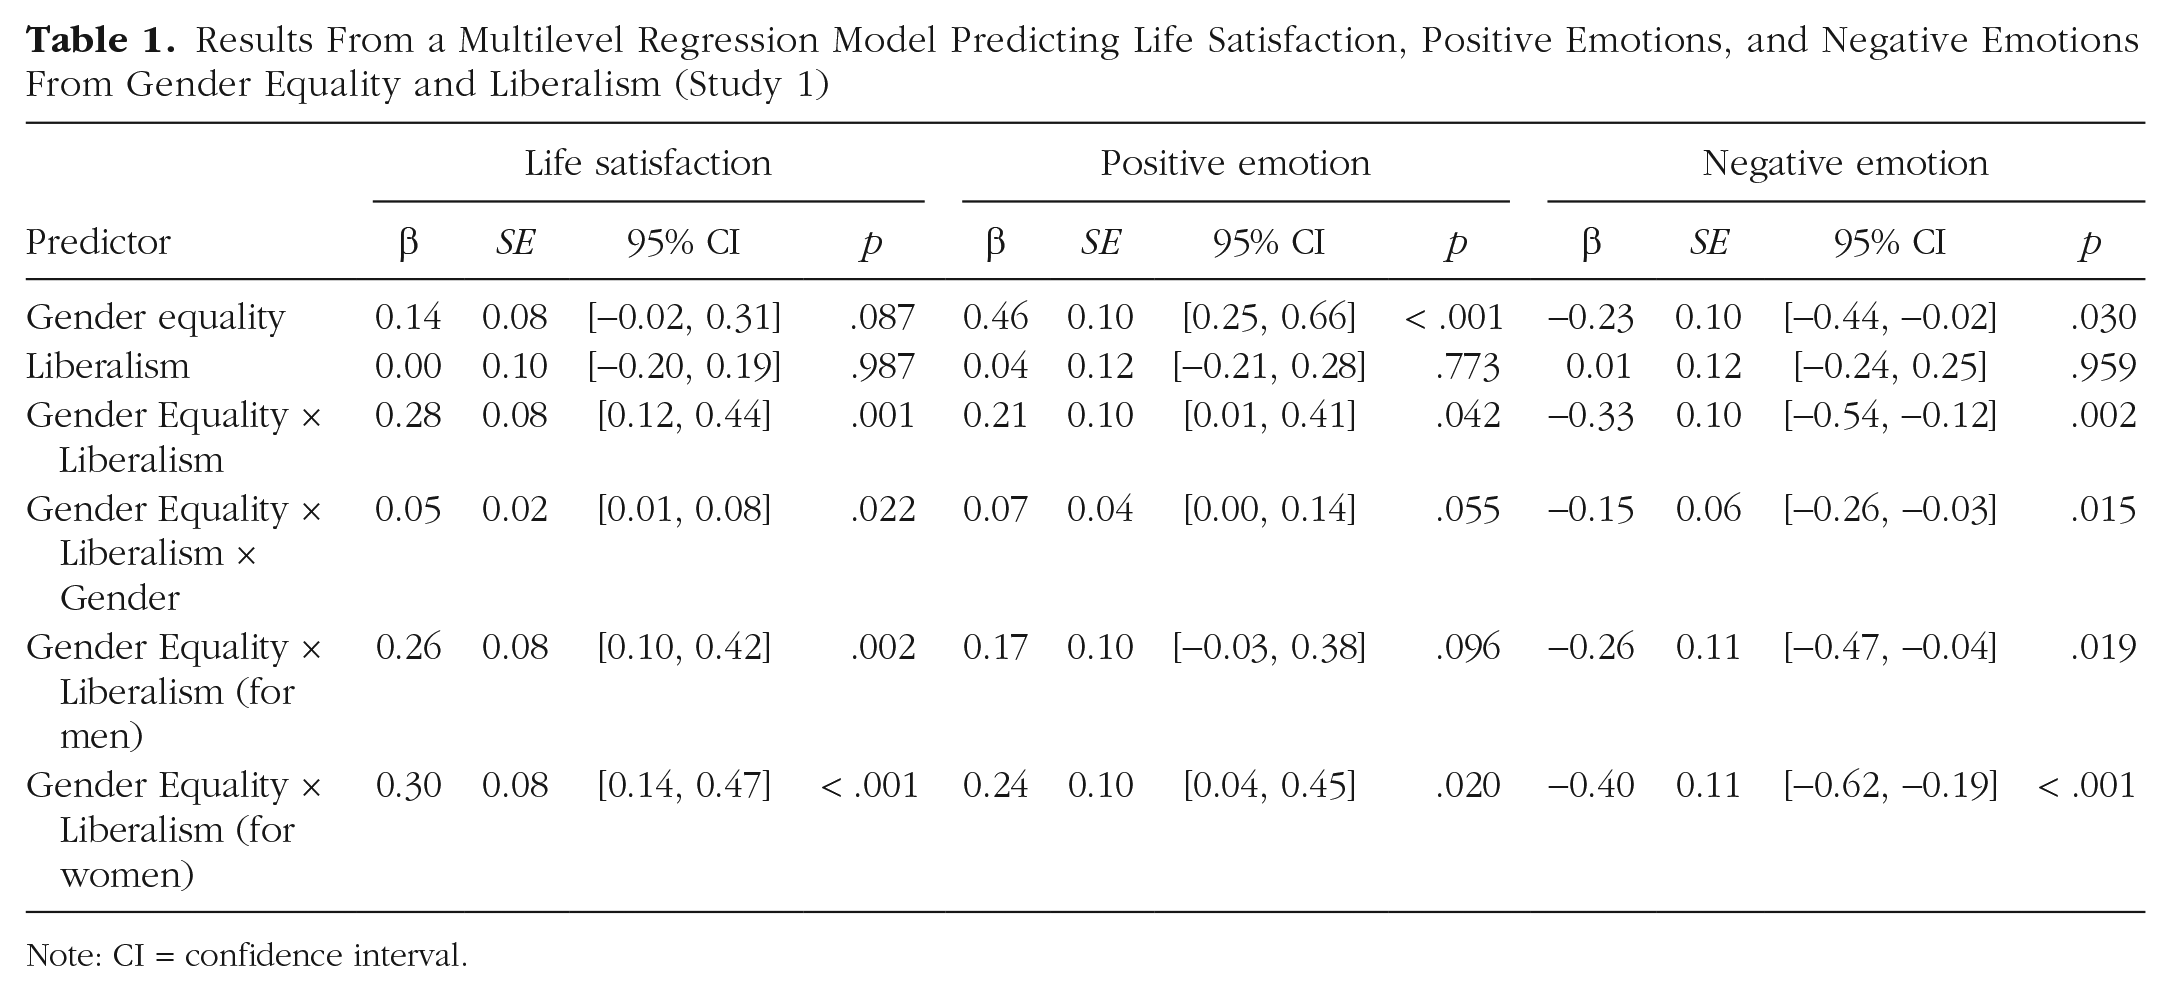
The results for the variables of interest are shown in Table 1 and Figure 1 (for full results, see Table S3 in the Supplemental Material). As seen in Table 1, greater gender equality was related to more life satisfaction (marginally), more positive emotions, and fewer negative emotions for the general population. Cultural liberalism was not related to any of the three SWB components. The Gender Equality × Liberalism interaction was significant for all three SWB components (ps < .05). The average effect size (r) was .31, generally viewed as a medium effect. Simple-slopes analyses, centering liberalism at low (−1 SD) and high (+1 SD) levels, showed that at low liberalism, gender equality was not related to life satisfaction, positive emotions, or negative emotions (ps > .12); at high liberalism, higher gender equality was related to greater life satisfaction (β = 0.42, SE = 0.10, 95% confidence interval [CI] = [0.22, 0.63], p < .001), more positive emotions (β = 0.66, SE = 0.13, 95% CI = [0.41, 0.91], p < .001), and fewer negative emotions (β = −0.56, SE = 0.13, 95% CI = [−0.81, −0.31], p < .001). Simple-slopes analyses comparing different levels of liberalism at high and low equality are reported in Section A in the Supplemental Material.
Results From a Multilevel Regression Model Predicting Life Satisfaction, Positive Emotions, and Negative Emotions From Gender Equality and Liberalism (Study 1)
Note: CI = confidence interval.
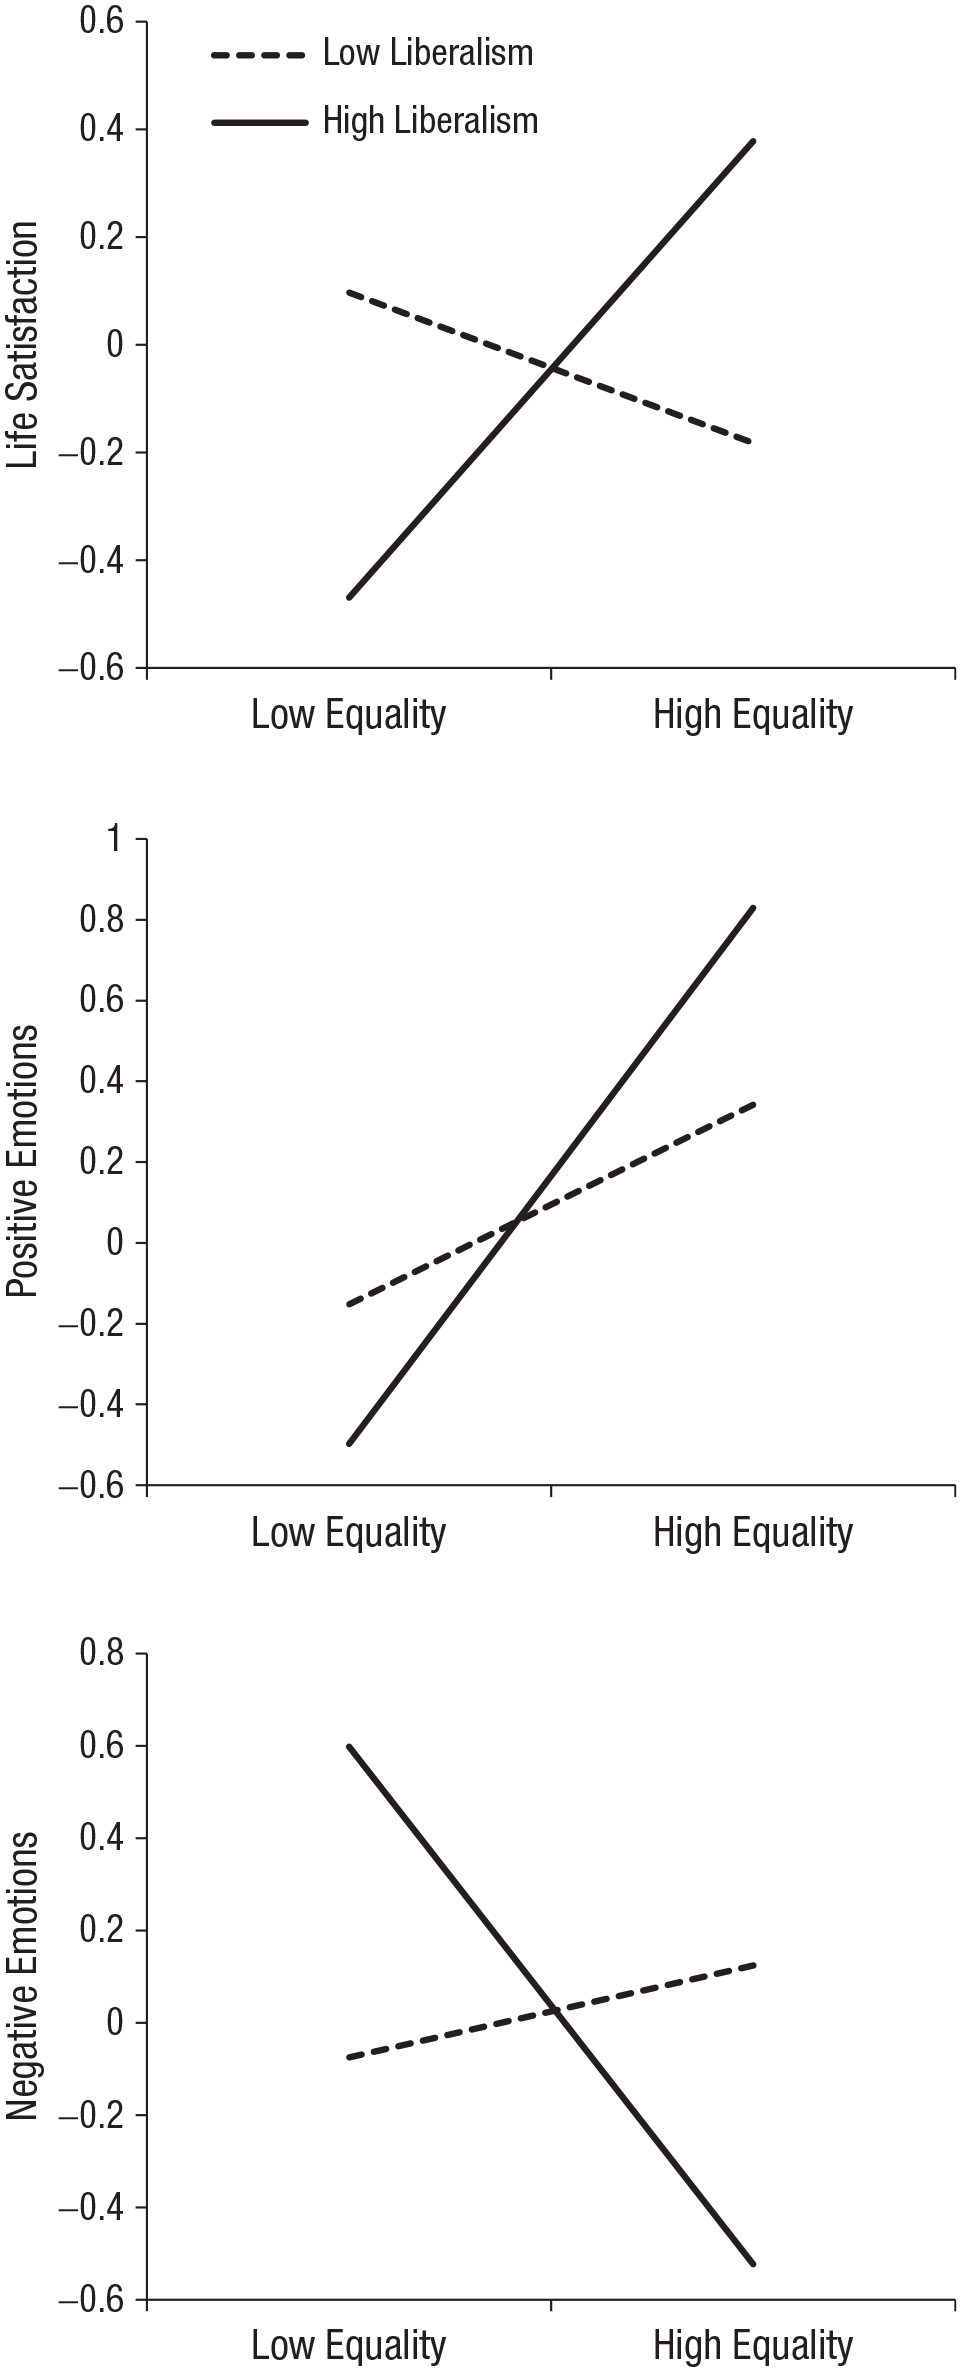
Overall predicted life satisfaction (top), positive emotions (middle), and negative emotions (bottom) as a function of gender equality and liberalism (Study 1).
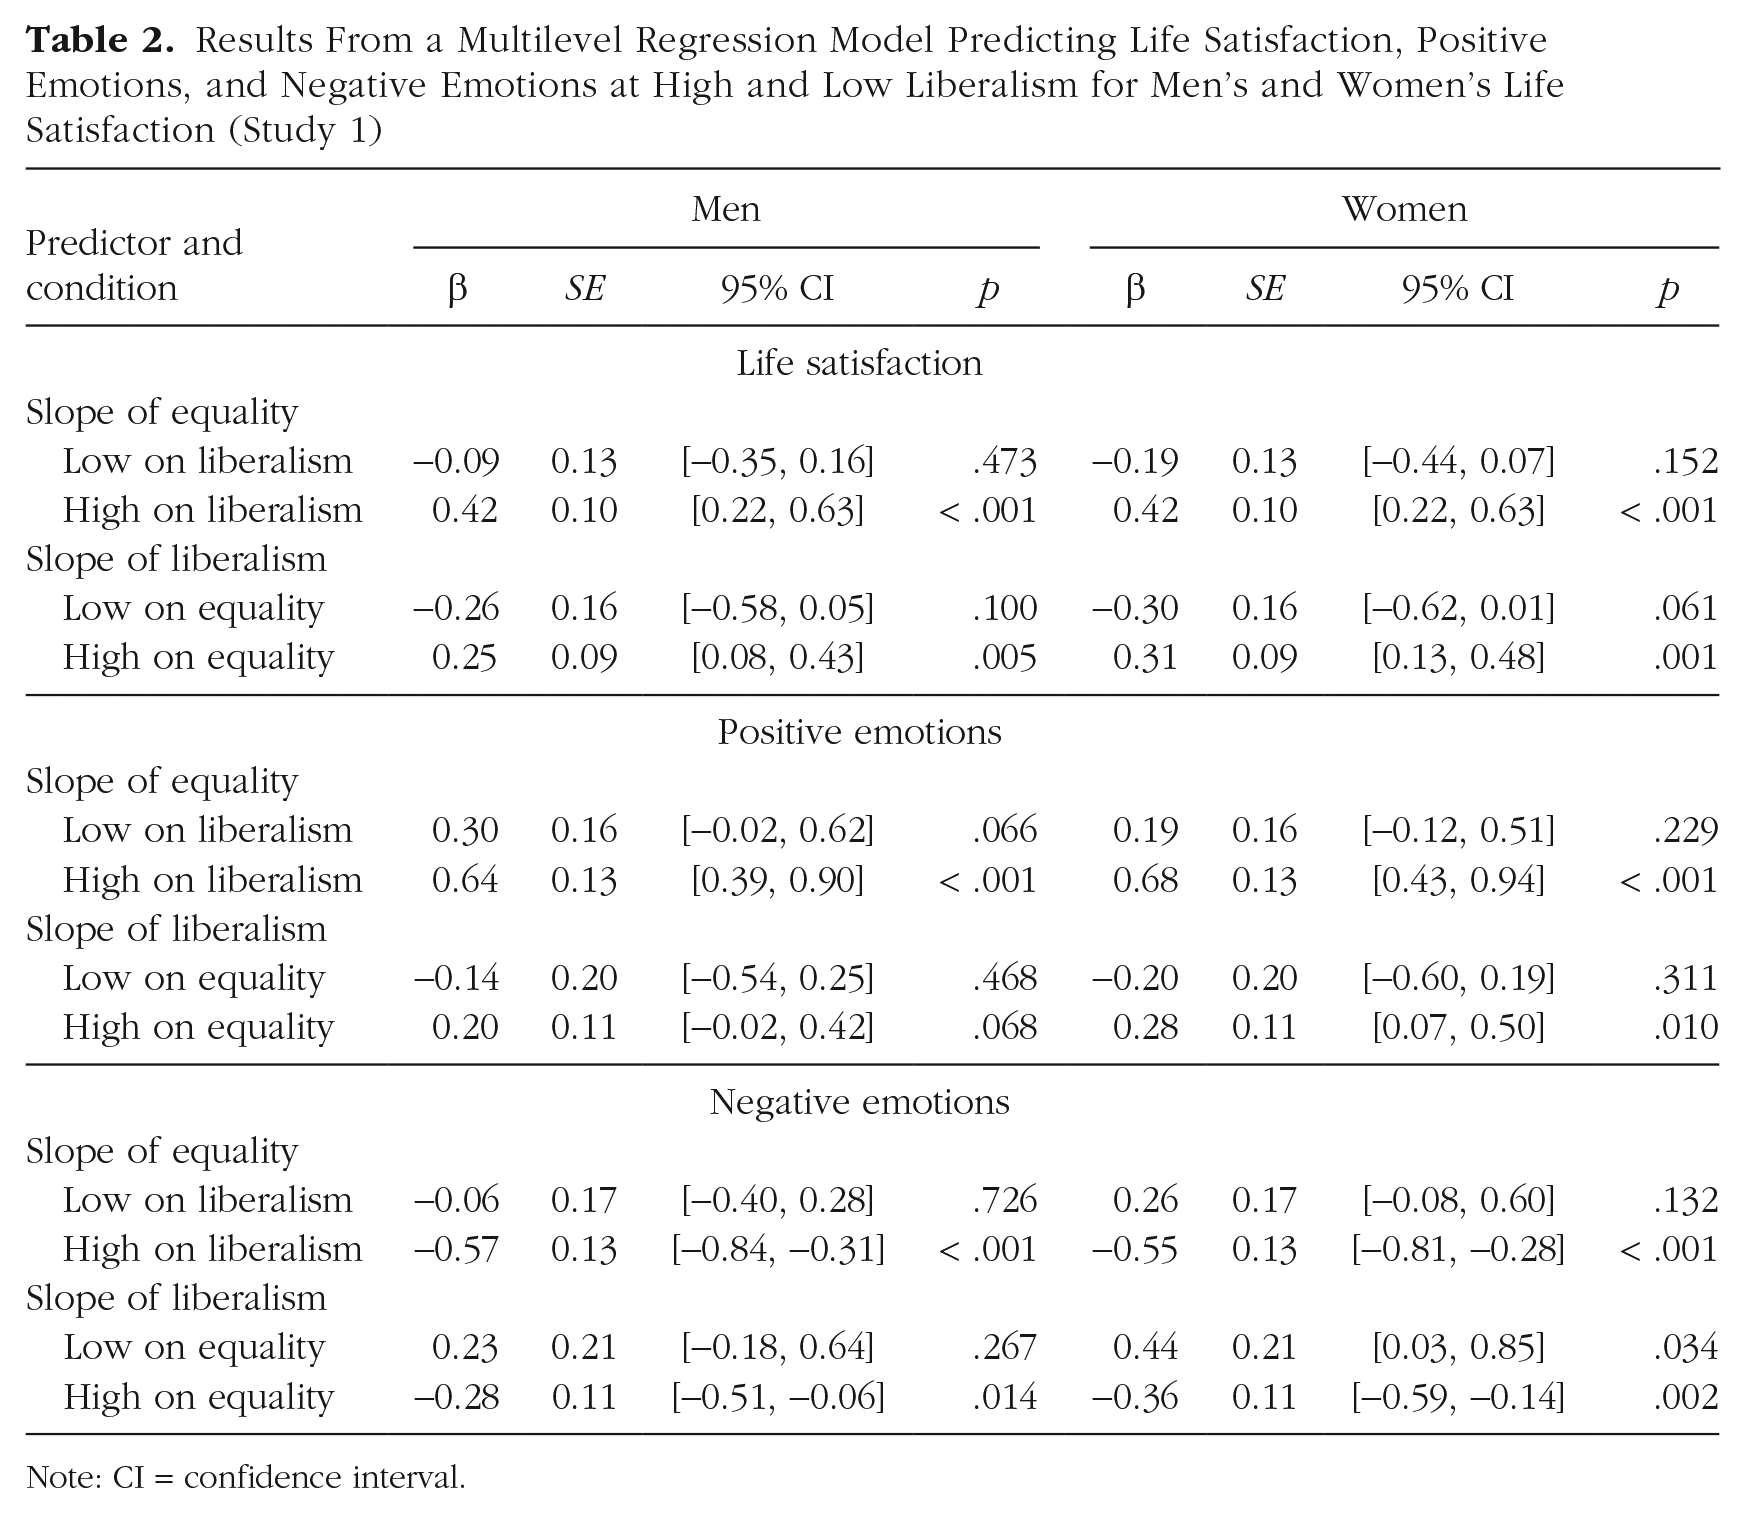
The moderator effect of liberalism was itself moderated by gender. Table 1 shows a significant Gender Equality × Liberalism × Gender interaction for life satisfaction and negative emotions and a marginally significant Gender Equality × Liberalism × Gender interaction (p < .055) for positive emotions. As seen in Figure 2 and in Table 1 (bottom two rows), both men and women showed the same two-way interaction pattern, although the effect size was greater for women than for men. Additional, more fine-grained simple-slopes analyses (see Table 2) showed that at low liberalism, gender equality was associated with marginally more positive emotions for men but not women; gender equality was not associated significantly with either life satisfaction or negative emotions for both men and women. At high liberalism, greater equality was associated with greater SWB for both men and women with regard to all SWB components. Additional simple-slopes analyses, comparing different levels of liberalism at high and low levels of equality, are reported in Section B in the Supplemental Material. 2
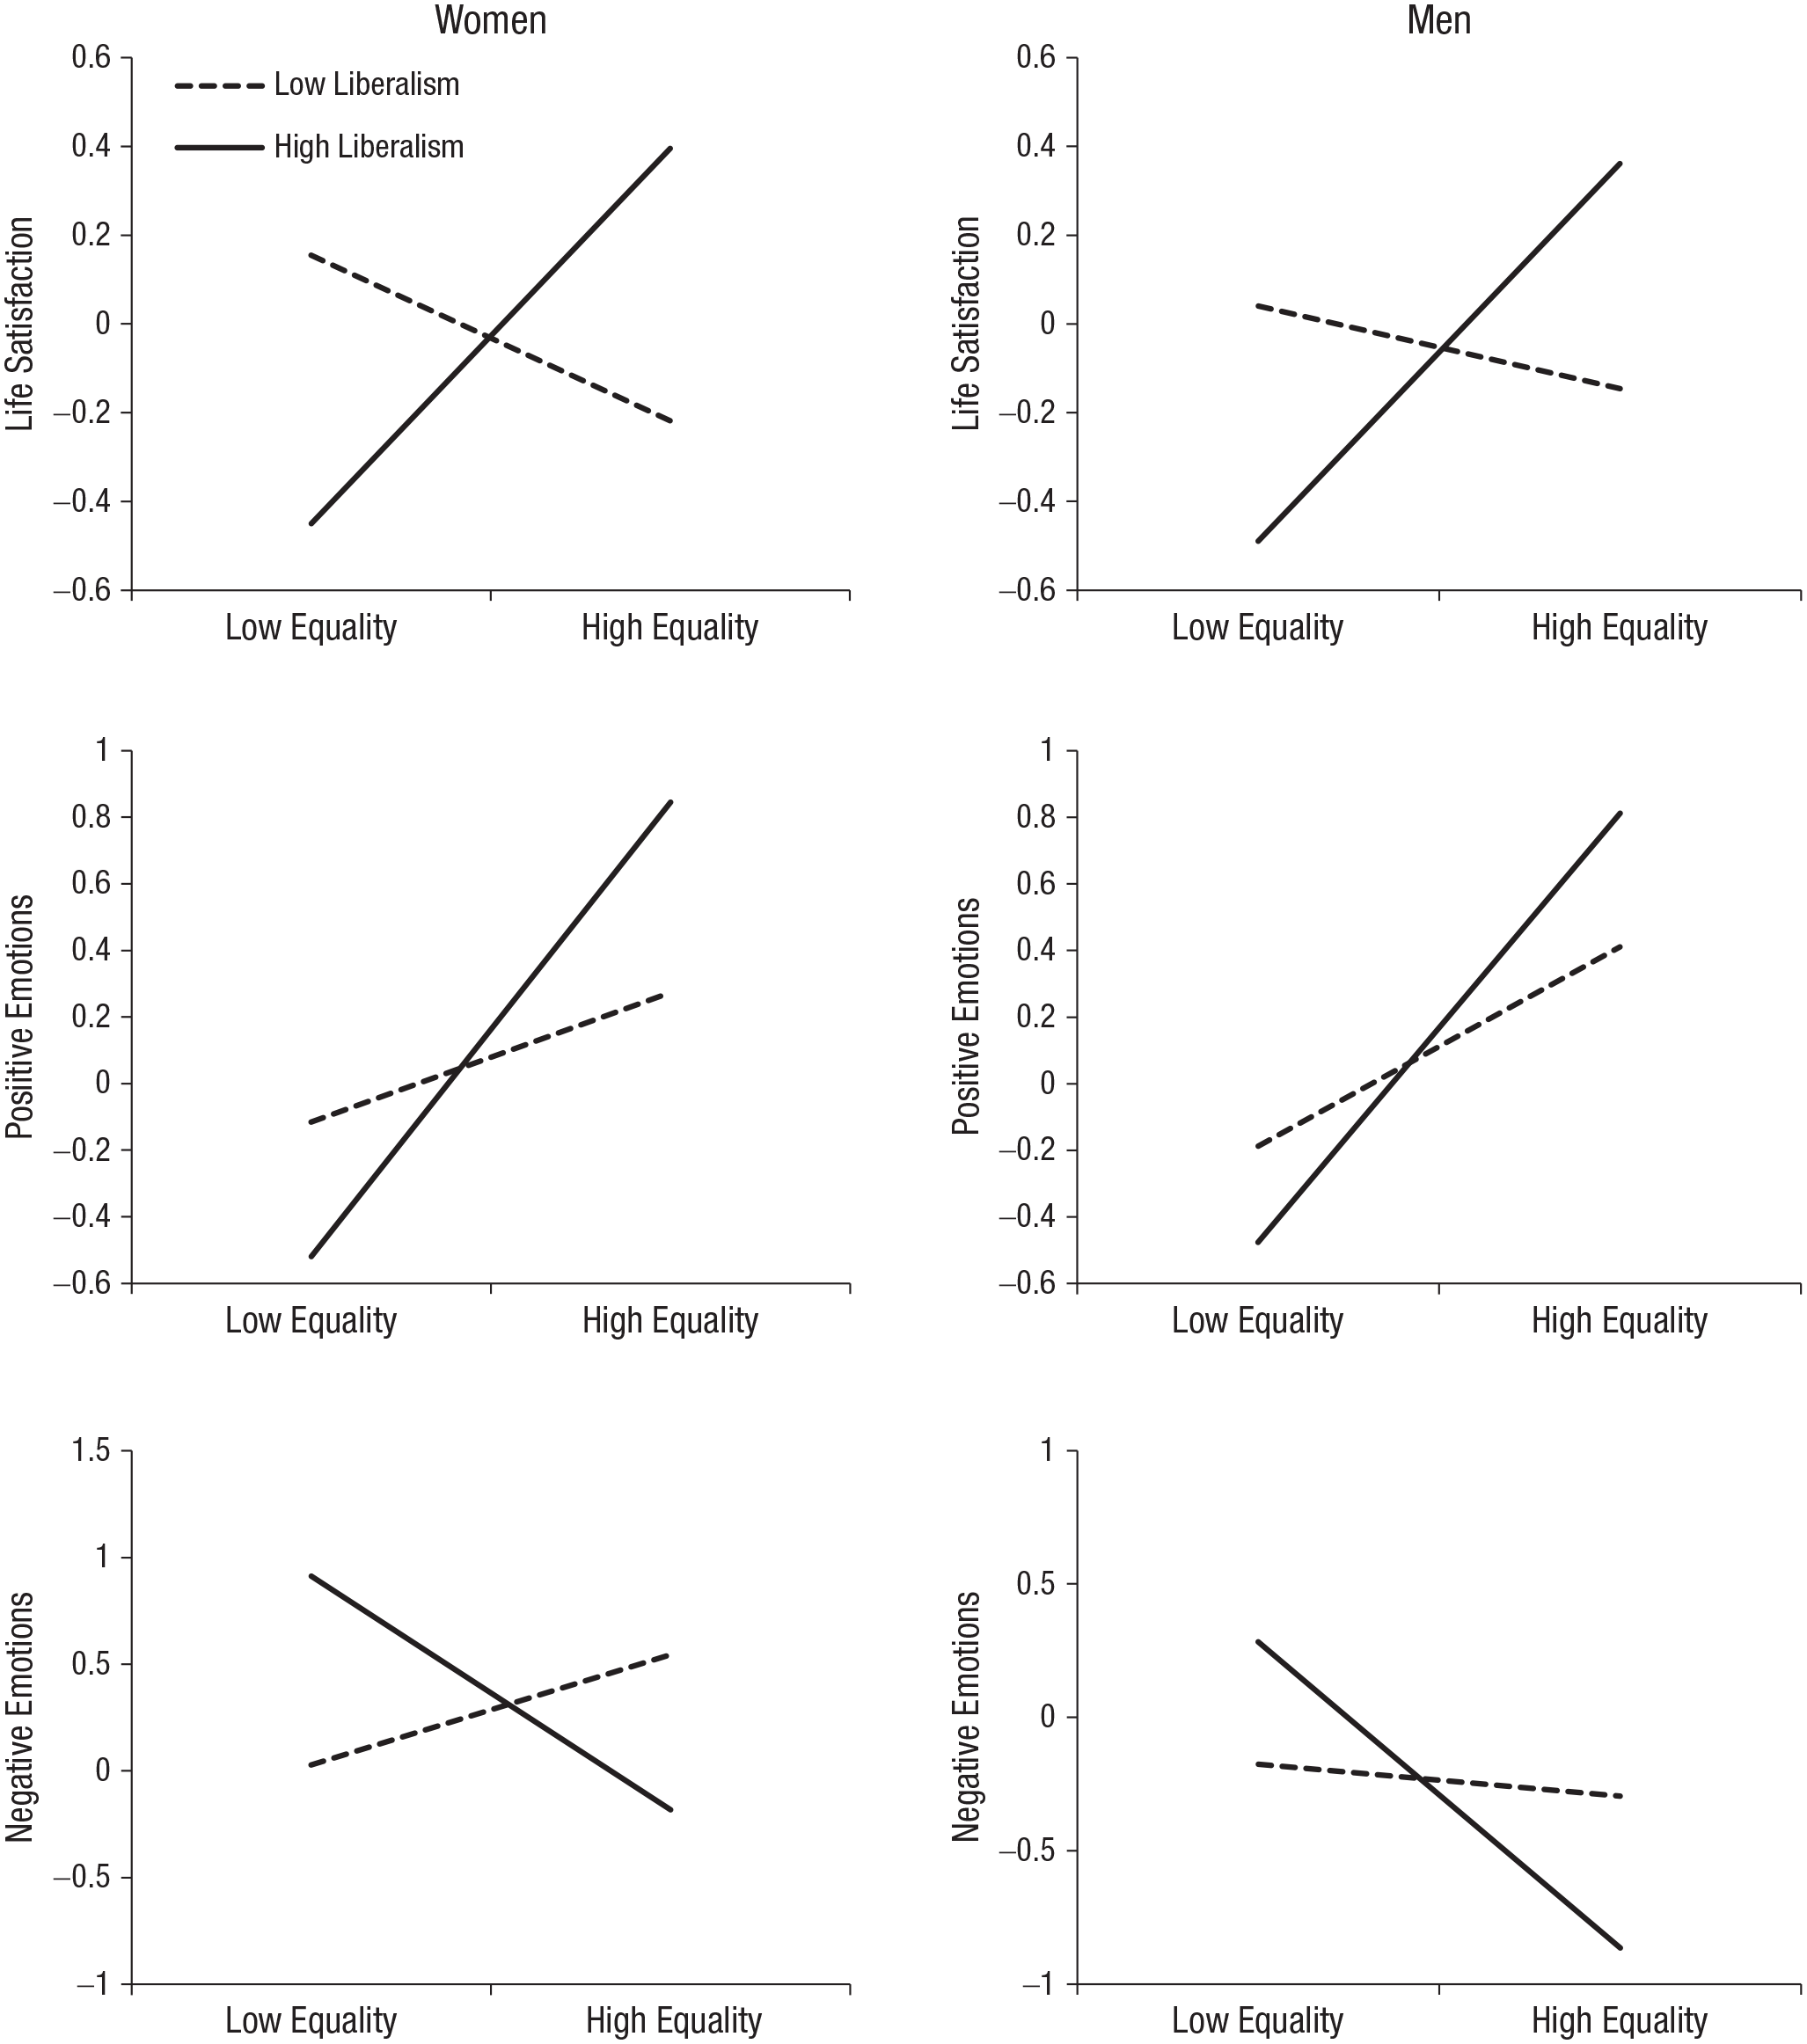
Overall predicted life satisfaction (top row), positive emotions (middle row), and negative emotions (bottom row) as a function of gender equality and liberalism, separately for women and men (Study 1).
Results From a Multilevel Regression Model Predicting Life Satisfaction, Positive Emotions, and Negative Emotions at High and Low Liberalism for Men’s and Women’s Life Satisfaction (Study 1)
Note: CI = confidence interval.
Overall, the results suggest that the liberal–conservative continuum moderates the relation between gender inequality and SWB for both men and women, but the moderating effects are stronger for women. These findings are based on analyses of aggregate data. Study 2 replicated these effects with individual data.
Study 2
Study 2 was designed to test the same model with individual data. Study 2 also employed two different operational definitions of liberalism, which were intended to increase the robustness of the results.
Method
The data were obtained from Waves 5 and 6 of the WVS (Inglehart et al., 2014a, 2014b). These waves were administered in 2005 to 2014, almost the exact years for which we could obtain gender-equality data (2006–2014). The samples surveyed in the WVS were representative of all people at age 18 years or older in each country (either full probability or a combination of probability and stratified methods were used). Most interviews were conducted face to face. Data were available for 145,975 participants from 69 countries (age: M = 42.0 years, SD = 16.64; 52.4% women; for the list of countries and their demographics, see Table S5 in the Supplemental Material). Given an effect size similar to what was obtained in Study 1, the power for the country-level analysis would be .72.
Subjective well-being
Two components of SWB, life satisfaction and positive emotion, were included in the WVS. Life satisfaction was measured using a single 10-point scale: “All things considered, how satisfied are you with your life as a whole these days? 1 = completely satisfied, 10 = completely dissatisfied.” Happiness was measured using a single 4-point scale: “Taking all things together, would you say you are . . .” Response options ranged from 1 (very happy) to 4 (not at all happy). The WVS did not include a measure of negative emotion but included a 4-point scale of subjective health: “How would you describe your state of health these days?” Response options ranged from 1 (very good) to 4 (poor). This measure was included as a component of SWB in the current analyses because it predicts actual health (Jylhä, 2009), and both actual and perceived health can be viewed as part of well-being. Because each SWB component was measured with a single item, and to ensure acceptable reliability, we standardized and combined them (after reverse-scoring happiness and perceived health; α = .66).
Gender-equality index
Equality values were again obtained from the Global Gender Gap Report computed by the World Economic Forum. The equality scores for education, economy, and politics were averaged and combined for the years 2006 (the first year the index was created) to 2009 (index for Wave 5) and 2010 to 2014 (index for Wave 6; for average equality scores, see Table S5).
Liberalism
The WVS provided an opportunity to test the model with an alternative measure, albeit one that appears to represent the social aspect of liberalism. Specifically, the survey measures attitudes toward three topics that elicit more favorable attitudes from liberals than from conservatives: homosexuality (e.g., Haidt & Hersh, 2001; Sherkat et al., 2011), abortion (e.g., Hess & Rueb, 2005; Strickler & Danigelis, 2002), and divorce (Swift, 2016). For each of these topics, participants rated whether the behavior in question (e.g., abortion) was justifiable (1 = never justifiable, 10 = always justifiable). Mean scores for this composite (α = .82), calculated for each country separately for Waves 5 and 6, served as a social-issues measure of liberalism (for mean scores for the three social-issues questions and their composite, after standardization, see Table S5). Li et al. (2019) reported that when they controlled for demographic variables, participants in the United States who identified themselves as Democrats scored higher on this measure (r = .45) than participants who identified as Republicans.
We also analyzed the results with the same liberalism measure that was used in Study 1, a composite of Hofstede’s power distance and collectivism. These analyses are presented in detail in the Supplemental Material and summarized only briefly in the text. The social-issues index was correlated (r = .70) with the Hofstede-based measure of liberalism.
Control variables: country level
We used the same three control variables as in Study 1. Data for religiosity were obtained from the WVS, whereas data for GDP and income inequality were obtained from The World Bank (2021b, 2021c), which has the information for all the necessary years (2005–2014).
Control variables: individual level
The analyses included a number of measures administered by the WVS and known to be related to SWB (Myers & Diener, 1995). These were age, relationship status (single or in a stable relationship), number of children (0 = no children, 3 = three or more children), religiosity, and SES. Religiosity was a composite (α = .75) of three questions (responses were standardized): “How important is religion in your life?” (1 = very important, 4 = not at all important); “How often do you attend religious services these days?” (1 = more than once a week, 8 = practically never); and “Would you say you are . . .” (1 = a religious person, 2 = not a religious person, 3 = a convinced atheist). SES was a composite (α = .63) of three questions (responses were standardized) about education level (scale from 1 to 9), family income (scale from 1 to 10 steps), and social class (scale from 1 to 5).
Results
Analyses with the social-issues-based measure of liberalism
Correlations among country-level variables, including the SWB measure, are presented in Table S6 in the Supplemental Material; parallel correlations among individual variables are presented in Table S7 in the Supplemental Material. In the main analyses, the data were examined in multilevel regression analysis with individuals nested within waves and waves nested within countries, resulting in a three-level model: individual variables at Level 1, wave variables at Level 2, and country variables at Level 3. Level 1 variables included gender and all the individual control variables. Each of these variables was grand-mean centered, and all the effects were specified as random effects. Level 2 variables included wave (centered at Wave 5) and all the country control variables plus gender equality and liberalism at each wave. Each of these variables was centered at each country’s mean. Level 3 variables included country mean gender equality, liberalism, and their interaction, in addition to all the control variables. Each of these variables was centered at the grand mean. All the data were standardized. As in Study 1, the questions of interest concerned the Gender Equality × Liberalism and the Gender Equality × Liberalism × Gender interactions.
The fully unconditional model without predictors showed that 85.25% of the variance in SWB was at Level 1 (individual level), 3.45% of the variance was at Level 2 (wave level), and 11.28% of the variance was at Level 3 (country level).
At the wave level, Wave 5 and Wave 6 did not significantly differ (β = 0.01, SE = 0.08, 95% CI = [–0.15, 0.16], p = .918). Differences between waves in liberalism, gender equality, and their interaction did not predict shifts in SWB (ps > .309) and thus were not included in further analyses.
The results of interest at the country level are presented in Table 3 (for full results, see Table S8 in the Supplemental Material). Neither gender nor liberalism was significantly related to SWB. The Gender Equality × Liberalism interaction was significant (see Fig. 3). The effect size (r) was .36, slightly higher than the corresponding effect size in Study 1. Simple-slopes analyses centering liberalism at high (+1 SD) and low (−1 SD) levels showed that, in liberal countries, gender equality positively predicted SWB (β = 0.14, SE = 0.05, 95% CI = [0.03, 0.24], p = .010); in conservative countries, gender equality was not associated with SWB (β = −0.05, SE = 0.05, 95% CI = [−0.14, 0.05], p = .315). This pattern is identical to the one found in Study 1. In additional simple-slopes analyses, we centered gender equality at high and low levels. At both levels, the relation between liberalism and SWB was not significant (high equality: β = 0.05, SE = 0.06, 95% CI = [−0.07, 0.18], p = .417; low equality: β = −0.13, SE = 0.08, 95% CI = [−0.29, 0.03], p = .108).
Results From a Multilevel Regression Model Predicting Subjective Well-Being From Gender Equality and Social-Issues Liberalism (Study 2)

Note: CI = confidence interval.

Overall predicted subjective well-being as a function of gender equality and liberalism (Study 2).
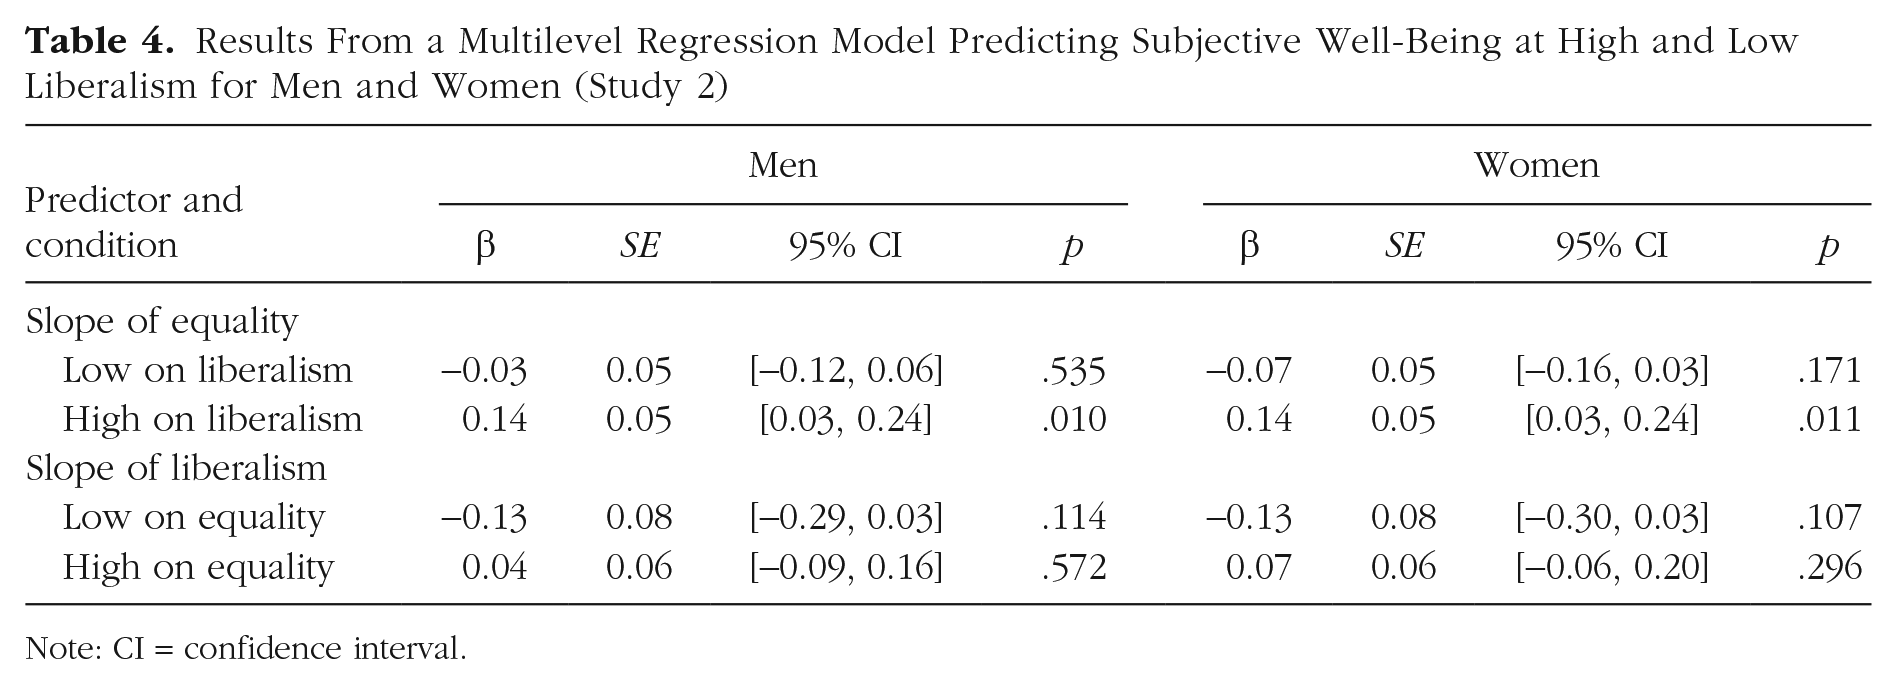
The interaction between liberalism and gender equality was more salient for women than for men (see Social-Issues Liberalism × Gender Equality × Gender interaction in Table 3). Simple-slopes analyses showed that the two-way interaction was significant for both men and women, but women showed a bigger effect (see Table 3 and Fig. 4). More fine-grained simple-slopes analyses (see Table 4) indicated very similar effects for both men and women.
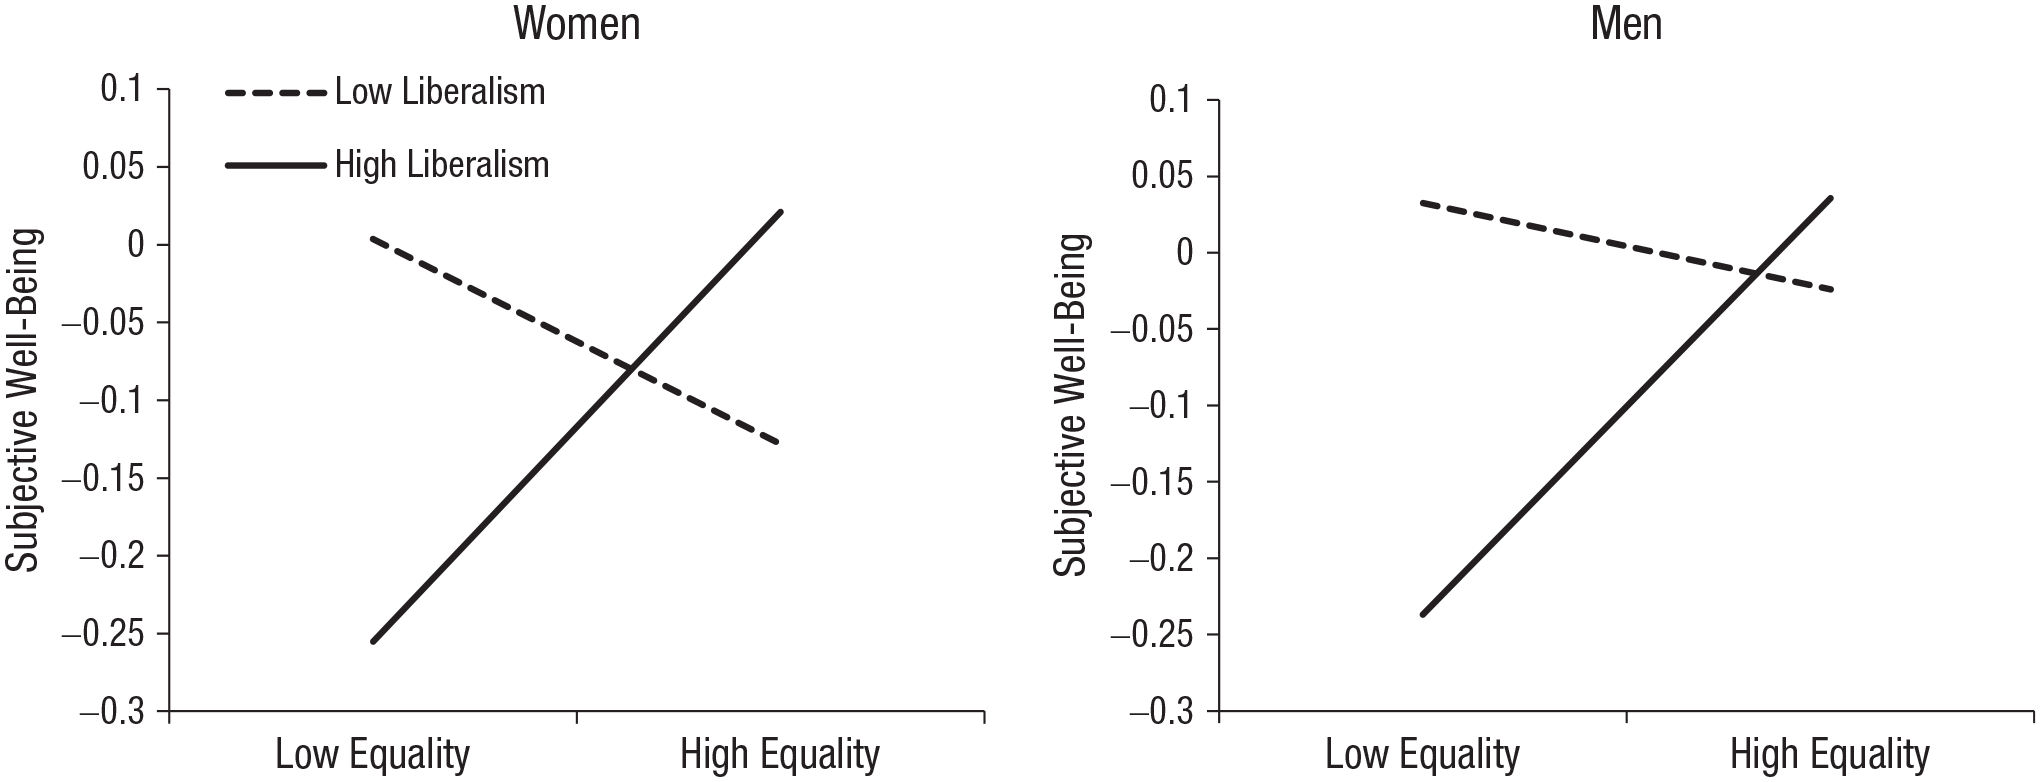
Overall predicted subjective well-being as a function of gender equality and liberalism, separately for women and men (Study 2).
Results From a Multilevel Regression Model Predicting Subjective Well-Being at High and Low Liberalism for Men and Women (Study 2)
Note: CI = confidence interval.
Analyses with Hofstede-based measure of liberalism
The analyses were repeated with liberalism measured by the composite of Hofstede’s power distance and collectivism (for details, see Section C in the Supplemental Material). Unfortunately, the number of countries available declined from 69 to 54 (for the list of countries and their power-distance and individualism scores, see Table C3 in the Supplemental Material). Still, the results showed a significant Gender Equality × Liberalism interaction (β = 0.09, SE = 0.04, 95% CI = [0.004, 0.18], p = .039), and the subsequent simple-slopes analyses produced a pattern identical to what was obtained with the social-issues measure of liberalism and in Study 1 (see Section C). The Gender Equality × Liberalism × Gender interaction was also significant (β = 0.03, SE = 0.01, 95% CI = [0.003, 0.06], p = .029), indicating that the Gender Equality × Liberalism interaction was more true for women than for men. Simple-slopes analyses showed that the Gender Equality × Liberalism interaction was significant for women (p < .02) and approached significance for men (p = .08). 3 In general, these results replicated the findings from Study 1.
Discussion
Across two different samples and using two different operational definitions of liberalism, we found indications that culture moderates the relation between gender inequality and SWB. The moderator effect (Gender Inequality × Liberalism) was similar to the moderator effect that was found with regard to income inequality (Li et al., 2019). Both studies showed that liberalism moderated the effects of inequality for everyone (women and men here; low and high SES before), but this was truer for the disenfranchised group (in some analyses in the present Study 2, this latter effect was only marginally significant).
Although the moderator effect of culture was the same, the simple-slopes analyses produced different patterns. Greater gender inequality was related to lower SWB in liberal countries; in conservative countries, the parallel relation was not significant. In contrast, greater income inequality was related to better SWB in conservative countries; in liberal countries, the relation was not significant. It is of interest to consider the implications of these results. That income inequality (but not gender inequality) was related to SWB in conservative countries might imply that conservatism more strongly promotes income inequality; that gender inequality (but not income inequality) was related to SWB in liberal countries might imply that liberalism more strongly promotes gender equality. But perhaps we are reading too much into these differences. We are dealing with two phenomena that share a major component—both are indices of inequality—but are also distinct conceptually and psychometrically. A number of unknown factors may account for the difference in results.
On the other hand, the commonality in results (the Inequality × Liberalism interaction) across two different types of inequality provides support for the theoretical model and (indirectly) for its underlying assumption. Our central supposition was that people use cultural standards to evaluate whether social conditions are satisfactory. Furthermore, we suggest that people feel better when reality matches what the culture stipulates. SWB, in this approach, depends not only on how people fare according to some objective criteria but also on whether objective conditions match cultural values. Dissatisfaction, therefore, can follow not only a change in social conditions but also a cultural change signaling that conditions that were considered adequate yesterday are not adequate today. Although the current discussion focuses on what culture prescribes with regard to inequality, the model can be extended to any social, economic, or political matter that can be evaluated as fitting or inconsistent with the cultural system.
The model also can be extended to another form of inequality—the disparity between ethnic groups and races. In the United States, the disparity between African Americans and Whites is a fact of life (e.g., Wilson & Rodgers, 2016), but it does not clearly translate to the SWB of African Americans (Stevenson & Wolfers, 2013). Culture may again moderate the relation of the disparity with SWB, but because of racial prejudice and because Whites are socially distant from African Americans, these moderator effects may apply to African Americans but not to Whites.
The present work has a number of limitations. First, the liberalism measure based on Hofstede’s dimensions predates the time of data collection for Study 1 (2005–2009) and Study 2 (2005–2014). Note, however, that it has a correlation of .70 with the social-issues measure of liberalism, which was administered (along with the SWB) in the WVS. Second, Study 1 was based on aggregate data (SWB composites for each country), reducing confidence in the results and raising the question of whether they can be replicated with individual data. Study 2 corrected this problem, but our main conclusions remained at the aggregate level. The findings accounted for some variation in SWB at the country level and provided a possible solution as to why previous research showed a lack of correspondence between gender inequality (and, previously, income inequality) and SWB. We suspect, however, that this approach accounts for very little variation in SWB at the individual level. Thus, the importance of our findings carries weight in well-defined but also fairly limited areas.
Supplemental Material
sj-docx-1-pss-10.1177_0956797620972492 – Supplemental material for Culture Moderates the Relation Between Gender Inequality and Well-Being
Supplemental material, sj-docx-1-pss-10.1177_0956797620972492 for Culture Moderates the Relation Between Gender Inequality and Well-Being by Chen Li, Miron Zuckerman and Ed Diener in Psychological Science
Footnotes
Transparency
Action Editor: Paul Jose
Editor: Patricia J. Bauer
Author Contributions
C. Li developed the theoretical rationale for the study. All the authors contributed to data collection. C. Li and M. Zuckerman analyzed the data and wrote the manuscript. E. Diener provided comments on the first draft. All the authors approved the final manuscript for submission.

Notes
References
Supplementary Material
Please find the following supplemental material available below.
For Open Access articles published under a Creative Commons License, all supplemental material carries the same license as the article it is associated with.
For non-Open Access articles published, all supplemental material carries a non-exclusive license, and permission requests for re-use of supplemental material or any part of supplemental material shall be sent directly to the copyright owner as specified in the copyright notice associated with the article.
