



Abstract
Many governments have introduced sugary-drink excise taxes to reduce purchasing and consumption of such drinks; however, they do not typically stipulate how such taxes should be communicated at the point of purchase. Historical, field, and experimental data consisting of more than 225,000 purchase decisions indicated that introducing a $0.01-per-ounce sugar-sweetened beverage (SSB) tax—without making it salient on price tags—had no significant effect on purchasing (−1.26%, p = .28). However, when the phrase “includes sugary drink tax” was added to tax-inclusive price tags, SSB purchasing was lower than (a) in the pretax period (−9.78%, p < .001), (b) in a posttax period when drinks did not bear price tags (−5.04%, p < .001), and (c) in a posttax period when drinks bore tax-inclusive price tags that did not mention the tax (−3.83%, p = .002). Making the tax’s beneficiary (student programs) salient on price tags had no added effect. Two follow-up studies suggested that tax salience was effective partly because consumers overestimated the tax amount, leading to reduced purchase intentions.
Consumption of sugar-sweetened beverages (SSBs) has been linked to serious health problems, including obesity (Malik et al., 2013), diabetes (Imamura et al., 2015), and heart disease (Xi et al., 2015). To reduce the purchasing and consumption of such drinks, governments have implemented SSB excise taxes—taxes levied on distributors and typically passed on to consumers, increasing the shelf price of SSBs relative to the price of other beverages. By the end of 2020, 44 countries and seven U.S. cities had implemented such taxes—and in the United States, this tax ranges from $0.01 to $0.02 per ounce (Global Food Research Program, 2020).
Studies pointing to the effectiveness of these taxes (e.g., Lee et al., 2019; Roberto et al., 2019; Silver et al., 2017) have focused on comparing the presence of such a tax with its absence. Roberto et al. (2019) found SSB purchasing to be lower within a taxed region than outside of it; similarly, other researchers have found SSB purchasing (Silver et al., 2017) and self-reported SSB consumption (Lee et al., 2019; Silver et al., 2017) to be lower after the tax introduction compared with pretax periods. Here, we focused on how such a tax is conveyed on shelf price tags, which currently varies considerably across retailers—not surprisingly, as firms have discretion in how they inform customers of the tax. In a recent evaluation of Philadelphia’s tax, for example (Roberto et al., 2019), some price tags conveyed that the price included an SSB tax (e.g., “$1.12, includes sugary drink tax”), whereas others made no mention of the tax. We surmised that the way such a tax is communicated at point of purchase can impact its capacity to decrease SSB purchasing.
We suggest that making an excise tax salient on price tags—noting that the price of the drink includes an SSB tax without necessarily conveying the amount of that tax—can affect buying. Research indicates that explicitly denoting that a price included an “unhealthy food surcharge” reduced buying of unhealthy items relative to the surcharge alone (Shah et al., 2014). Interestingly, this prior work avoided the word “tax”; the price increase was conveyed using an equivalent, though arguably less charged, term—“surcharge.” Yet given that at least in the United States, the word “tax” has negative connotations (Sussman & Olivola, 2011), price tags explicitly denoting that prices include an SSB tax might reduce buying—beyond the effect of the tax (i.e., the price increase) itself. Consistent with this idea, and akin to the idea that a surcharge may be less evocative than a tax, a “tax-free” promotion was more effective at spurring sales relative to when the equivalent savings were described as discounts (Sussman & Olivola, 2011).
Consumers are generally averse to taxes (Kessler & Norton, 2016), and they particularly dislike paying taxes on hedonic items (e.g., alcohol, tobacco). In several states, taxes levied on hedonic products have been met with public opposition (Kotler, 2017) and industry contention, sparking political controversy (Jacobs, 2019). Emblematic of this opposition, commissioners in Cook County, Illinois, voted 15 to 1 to repeal the county SSB tax just 2 months after it had been implemented (Dewey, 2017). 1 Perhaps as a result of the negative sentiment toward taxes, policymakers have tried to make SSB taxes more palatable by highlighting their beneficiaries. Some authors have attributed Philadelphia’s successful passing of its SSB excise tax to the fact that its proceeds were pledged to pre-K education (Purtle et al., 2018). Similarly, the cities of Boulder, Colorado, and Seattle, Washington, dedicated tax proceeds to social programs (City of Boulder, 2016; City of Seattle, 2017). Therefore, in addition to testing whether tax-salient price tags decrease SSB purchasing, we also tested the effect of adding the tax’s beneficiary to such tags.
Overview of Studies
Study 1 was a field study in which we tested whether making an SSB tax salient decreased purchasing of such drinks. The study employed an 8-week sequential design that began with a control condition in which drinks simply bore tax-inclusive price tags. Next came a period in which we made the tax salient by adding the phrase “Includes SF Sugary Drink Tax” to the price tags (SF stood for “San Francisco,” where the study was conducted). In the final period, we added mention of the tax’s beneficiary (in this case, student programs) to the price tags. To contextualize the effects of our intervention, we also obtained historical sales data from two periods that preceded the intervention—one before tax and one after tax. Next, we conducted two online experiments. Study 2 tested whether a tax-salient price tag might reduce SSB purchasing because people tend to overestimate the tax amount. Study 3 conceptually replicated Study 1 and provided convergent evidence for the underlying process.
Statement of Relevance
Consumption of sugary drinks, such as soda, is a leading contributor to serious health problems, including obesity, diabetes, and heart disease. Many governments have introduced sugary-drink excise taxes to reduce purchasing and consumption of sugary drinks; however, they do not typically stipulate how these taxes should be communicated at the point of purchase. In this research, we assessed how sugary-drink purchasing is influenced by the labeling of a sugary-drink tax. We found that introducing a sugary-drink tax without making the tax salient on price tags did not reduce purchasing of sugary drinks. However, making the tax salient by adding the phrase “includes sugary drink tax” to a price tag significantly reduced purchasing of sugary drinks. These results suggest that sugary-drink taxes may be ineffective at reducing the purchasing of sugary drinks if they are not made directly salient on price tags.
Stimuli and data for all three studies are posted on OSF at https://osf.io/684uy/. All studies were preregistered (Study 1: https://aspredicted.org/da2ez.pdf; Study 2: https://aspredicted.org/ri3iy.pdf; Study 3: https://aspredicted.org/3qn8r.pdf).
Study 1: Field Study
Method
Setting
The study took place in two convenience stores on a university campus in San Francisco where a $0.01-per-ounce SSB excise tax had been implemented on January 1, 2018. At that time, the university had 29,586 students (47.03% female; 17.36% White). In accordance with the SSB excise-tax policy, vendors paid this tax on all SSB sales and could pass it on to customers in commensurate price increases. Both of our field sites elected to do so, as is common (Roberto et al., 2019). From January 1, 2018, through the study period, in-store posters informed patrons of the tax (see Fig. S2 in the Supplemental Material available online).
The study was conducted over an 8-week period (September–November 2018) on weekdays (the stores were closed on weekends). We prespecified this time period on the basis of a power analysis informed by historical sales data from September to November 2017 (using matched calendar weeks from the year prior) with the following parameters: 95% power (β = 0.05), a Type I error rate of 5% (α = .05), and a small effect size (Cohen’s d = 0.20), as determined using a Fisher’s exact statistical test.
Treatment
We varied the price tags placed on SSBs and measured SSB buying. We tested three different versions of SSB price tags (described below); price tags on non-SSBs were held constant throughout the study period (these simply stated the price, which of course did not include an SSB tax). We defined SSBs in accordance with the San Francisco sugary-drink ordinance (Proposition V) that was in effect during the study, which considered SSBs to be drinks that have 25 or more calories per 12 oz, excluding milk and 100% fruit juice. All price tags were 3.5 in. by 1 in. in size and were hung directly underneath each drink. (See Fig. S3 in the Supplemental Material for a photograph depicting the drinks with price tags on them in one of the store’s refrigerators.)
In the control condition, the price tags stated only the SSB tax-inclusive price. Two sequential treatments tested the impact of additional text placed on the price tags. In the tax-salient condition, the text “Includes SF Sugary Drink Tax” was added (SF referred to San Francisco). In the recipient-salient condition, the price tag also conveyed who would receive the proceeds of the tax—specifically, “[Name of store] matches and donates proceeds to [university] student programs.” 2 The recipient-salient condition offered a test of whether it is wise to indicate a (benevolent) beneficiary of the tax, as was done in Philadelphia. Thus, we chose a beneficiary—student programs—that we assumed was likely to resonate with patrons, given that most patrons were students. And because this tag was slightly more complex than the others, we pretested it to ensure it was comprehensible. This pretest (N = 450; see Table S1 in the Supplemental Material) demonstrated that 93.2% of respondents correctly understood the imposer of the tax (San Francisco) and its beneficiary (student programs).
Each price tag was tested for a 2-week period. The price tags are depicted in Table 1, and the study timeline is depicted in Figure 1. To prevent possible spillover effects, we followed both the tax-salient and recipient-salient conditions with a 1-week washout period, during which we reverted to the control tags (cf. Bleich et al., 2014; Donnelly et al., 2018).
Price Tags for Sugar-Sweetened and Non-Sugar-Sweetened Beverages in Study 1

Note: The prices shown here were for a 12-oz drink at the time of the study. SF = San Francisco.
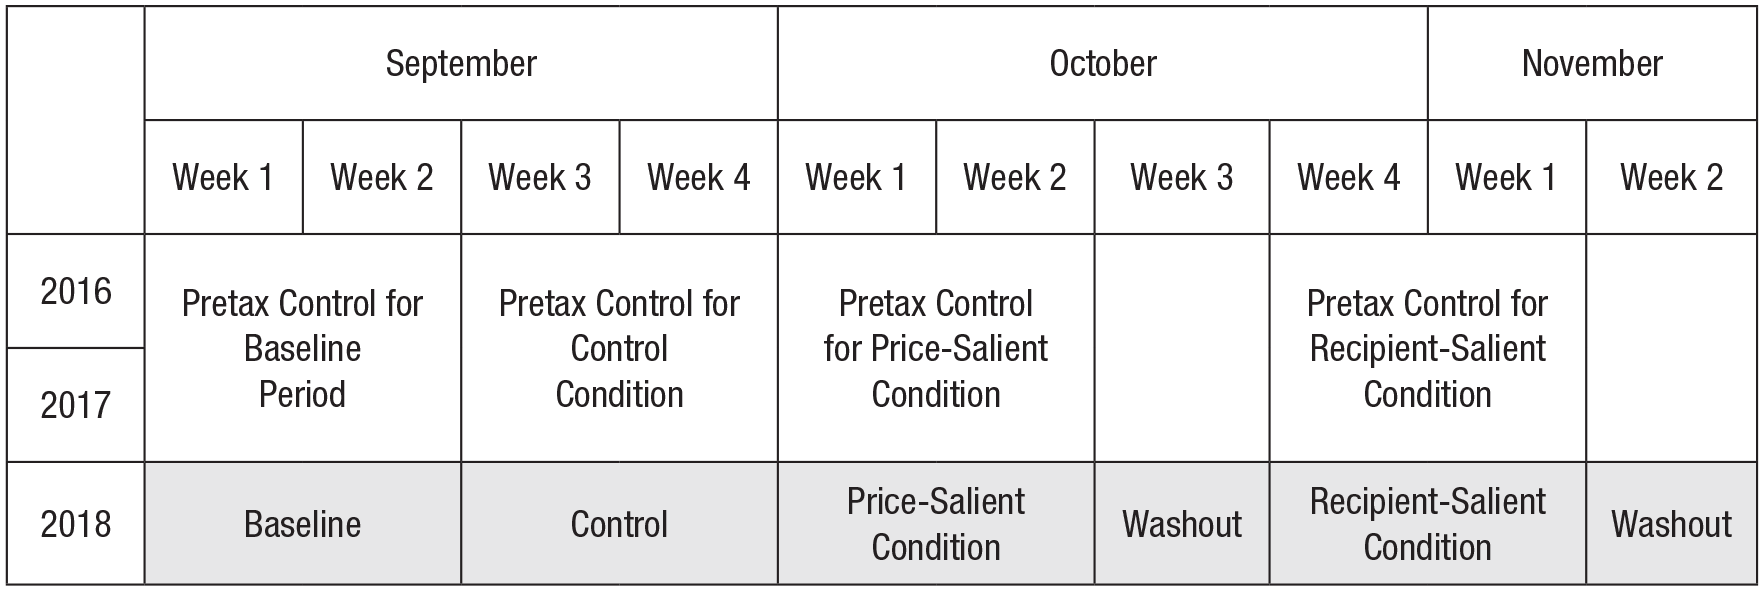
Timeline of Study 1. Throughout the entire study period (2018), a $0.01-per-ounce sugary-drink tax was in effect, and all drinks bore tax-inclusive price tags.
Historical data
Prior to our study, drinks did not bear price tags. Thus, our control condition, in which we placed tax-inclusive price tags on drinks, could itself be considered an intervention because it made the prices—including the price difference between an SSB (e.g., Coke) and its non-SSB equivalent (e.g., Diet Coke)—salient. Therefore, we obtained sales data from the 2 weeks immediately preceding the study period. During this baseline period, the SSB tax was in effect, but there were no price tags on any drinks. We also obtained sales data from 2016 and 2017—the 2 years preceding the SSB tax. These data enabled us to disentangle the effect of making a tax salient from that of the tax itself. And, as described in our analysis plan, the historical data also helped us to ensure that the observed effects of our intervention were not simply a by-product of cyclical weekly changes in drinking habits that happened to coincide with our treatment.
Outcome measures
Our primary interest was whether the information on price tags shifted consumers away from buying SSBs. Therefore, our primary outcome measure was the proportion of SSBs bought (i.e., the number of SSB units purchased divided by the number of drink units purchased; cf. Bleich et al., 2012; Donnelly et al., 2018; VanEpps et al., 2016). For secondary outcomes, we assessed absolute changes in drink sales, drink calories sold, and share of bottled water bought.
Analysis plan
For our primary analysis, we conducted Fisher’s exact tests to compare the proportion of SSBs bought as a function of the different periods (cf. Donnelly et al., 2018). Pairwise comparisons of SSB purchasing between periods allowed us to address the following questions: (a) Does the tax itself impact purchasing? (before tax vs. baseline), (b) does adding tax-inclusive price tags impact purchasing? (baseline vs. control), (c) do tax-salient price tags impact purchasing? (control vs. tax salient; our focal comparison), and (d) does making the beneficiary of the tax salient further impact purchasing? (tax salient vs. recipient salient).
Given that calendar-week confounds are possible in sequential designs, we also compared SSB sales during each 2018 period (baseline, control, tax salient, recipient salient) with its matched calendar week from each of the 2 years prior to the instatement of the tax (i.e., 2016 and 2017). To facilitate this analysis, we first compared the share of SSBs bought in 2016 relative to 2017 to ascertain that there was no difference: baseline-matched weeks: p = .92, d = 0.00, 95% confidence interval (CI) = [−0.03, 0.03]; control-matched weeks: p = .78, d = 0.00, 95% CI = [−0.02, 0.03]; tax-salient-matched weeks: p = .12, d = 0.02, 95% CI = [−0.01, 0.05]; and recipient-salient-matched weeks: p = .54, d = 0.01, 95% CI = [−0.02, 0.04]. Therefore, we collapsed across 2016 and 2017, treating these years as a pretax period to compare matched pretax-period calendar weeks with the baseline weeks and with each condition. The mapping of the 2018 period to the pretax periods is depicted in the study timeline (Fig. 1).
In supplementary analyses, we also considered the possible effects of temperature and humidity. Note that weather affects the volume of drinks sold but is less likely to affect the mix of drinks sold (i.e., whether people buy SSBs or non-SSBs; see Donnelly et al., 2018). Nonetheless, we conducted a multivariable linear regression in which the dependent variable was the proportion of SSBs purchased, and there were dichotomous independent variables for each of the three price-tag interventions. The omitted category in the regression was the baseline period, so coefficients on each of the dichotomous independent variables indicated differences relative to baseline. We also included independent variables indicating the daily average temperature and daily average humidity. We ran the same regression predicting the average calories per drink bought. To assess possible substitution effects—whether reduced SSB buying might have been offset by a corresponding increase in water buying—we conducted Fisher’s exact tests to assess the proportion of bottled water bought in each condition. We also conducted Fisher’s exact tests to draw comparisons of the proportion of SSBs purchased as a function of the price-tag intervention from historical data.
Results
Descriptive statistics
Across the study period, an average of 7,582 (SD = 681.67) drinks were bought weekly (no significant difference between weeks); 45.5% (SD = 1.2%) of those drinks were SSBs (Table 2).
Purchases of Sugar-Sweetened Beverages During the Intervention Period (2018) in Study 1 and During Pretax Comparison Periods (2016, 2017)
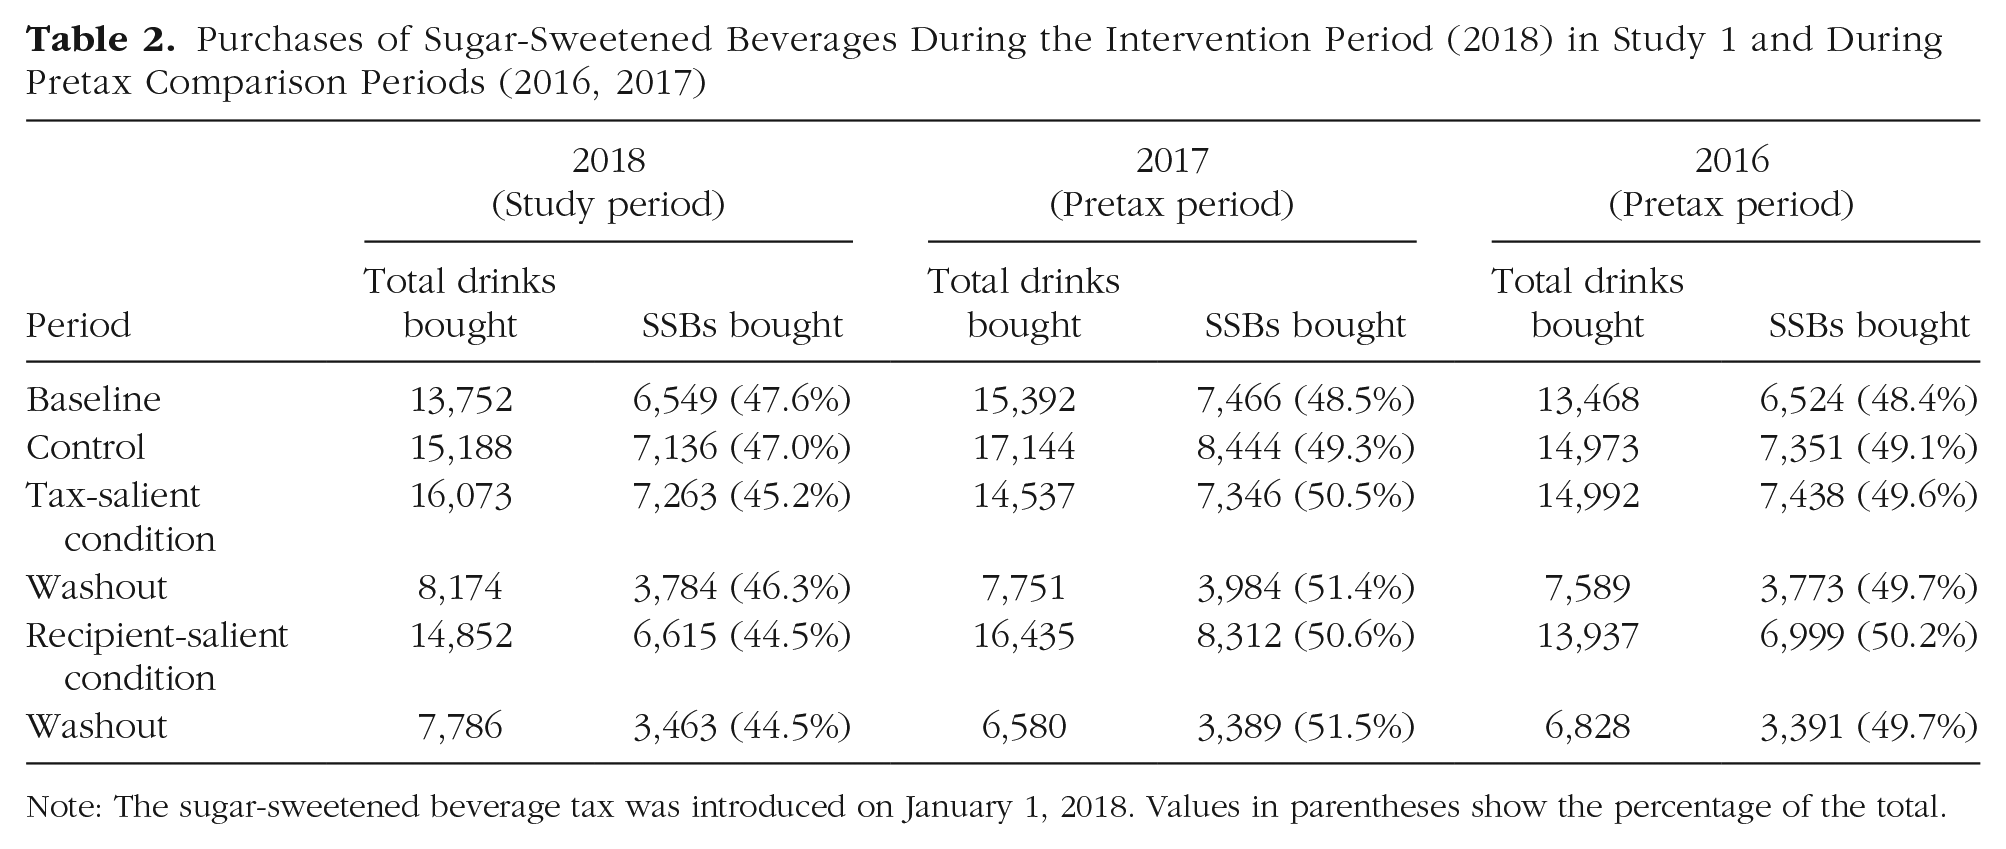
Note: The sugar-sweetened beverage tax was introduced on January 1, 2018. Values in parentheses show the percentage of the total.
Share of SSBs bought
The percentage of SSBs bought in each period is plotted in Figure 2; the number of SSBs bought in each period is listed in Table 2. As described in the analysis plan, we first assessed whether fewer SSBs were bought after the tax had been introduced. The share of SSBs bought in the baseline period was not different from that bought in the pretax-period-matched calendar weeks from 2016 and 2017 (a 1.79% reduction; p = .10, d = 0.02, 95% CI = [−0.01, 0.05]; see Fig. 2, first pair of bars). In other words, the tax itself did not correspond to a decrease in SSB purchasing.

Share of sugar-sweetened beverages bought in each condition of Study 1 (patterned bars), alongside matched calendar-week historical controls (white bars). Historical controls are the share of sugary drinks bought, averaged across 2016 and 2017 (i.e., the pretax period), in calendar weeks matched to the intervention period. Error bars represent standard errors.
Second, we assessed the effect of introducing tax-inclusive price tags. The share of SSBs bought in the control condition (47.0%), when drinks bore tax-inclusive price tags, was not different from the share bought in the 2-week baseline period immediately preceding it (47.6%; a 1.26% reduction, p = .28, d = 0.01, 95% CI = [−0.01, 0.04]), during which drinks did not bear price tags. However, the share of SSBs bought in the control condition was lower relative to its matched pretax-period calendar weeks (47.0% vs. 49.2%; a 4.47% reduction, p < .001, d = 0.05, 95% CI = [0.03, 0.08]; see Fig. 2, second pair of bars).
Third, we assessed our question of primary interest: whether tax-salient price tags decreased purchasing. The share of SSBs bought in the tax-salient condition (45.2%) was lower than both the baseline period (47.6%; a 5.04% reduction, p < .001, d = 0.06, 95% CI = [0.03, 0.09]) and the control condition (47.0%; a 3.83% reduction, p = .002, d = 0.02, 95% CI = [0.01, 0.04])—differences that also translated into significantly fewer drink calories bought (tax salient: M = 96.45 calories, SD = 101.55; baseline: M = 105.83 calories, SD = 104.65, p < .001, d = 0.09, 95% CI = [0.07, 0.11]; control: M = 102.97 calories, SD = 104.23, p < .001, d = 0.06, 95% CI = [0.04, 0.09]; see Fig. S1). These effects were robust to daily heat index, daily humidity, and store (Table 3; see also Table S2 in the Supplemental Material). 3 Moreover, the share of SSBs bought in the tax-salient condition was also lower relative to those bought in the matched pretax-period calendar weeks (45.2% vs. 50.1%; a 9.80% reduction; p < .001, d = 0.12, 95% CI = [0.09, 0.14]; see Fig. 2, third pair of bars).
Effect of Tax-Salient Conditions on the Share of Sugar-Sweetened Beverages Bought in Study 1, Controlling for Store, Humidity, and Heat Index

Note: The model accounted for a considerable amount of variance (adjusted R2 = .901). The omitted intervention period was the control condition; therefore, coefficients on each of the dichotomous treatment variables indicate differences relative to the control condition.
Fourth, we assessed whether making the beneficiary of the tax salient further impacted purchasing. The share of SSBs bought during the recipient-salient condition (44.5%) was not statistically different from that bought in the tax-salient condition (a 1.15% reduction, p = .243, d = 0.018, 95% CI = [−0.01, 0.05]); the average calories purchased was also equivalent (recipient salient: M = 94.85 calories, SD = 101.31; tax salient: M = 96.45 calories, SD = 101.55, p = .17, d = 0.01, 95% CI = [−0.01, 0.04]). These results suggest that noting the tax’s beneficiary does not affect SSB buying beyond making the tax salient. The share of SSBs bought in the recipient-salient condition was also lower relative to its matched pretax-period calendar weeks (44.5% vs. 50.5%; a 11.70% reduction; p < .001, d = 0.14, 95% CI = [0.12, 0.17]; see Fig. 2, fourth pair of bars).
Substitution analysis
The substitution analysis indicated that during tax salience, water buying increased relative to pretax levels (7.93% increase; p < .001, d = 0.06, 95% CI = [0.04, 0.09]), baseline levels (9.80% increase; p < .001, d = 0.08, 95% CI = [0.05, 0.11]), and control levels (6.94% increase; p < .001, d = 0.06, 95% CI = [0.03, 0.09]) and was similar to recipient-salient levels (2.90% decrease; p = .10, d = 0.02, 95% CI = [−0.01, 0.05]). Similarly, diet-soda buying increased relative to pretax levels (36.03% increase; p < .001, d = 0.13, 95% CI = [0.09, 0.17]) and baseline levels (15.71% increase; p < .001, d = 0.06, 95% CI = [0.01, 0.12]) but was similar to control levels (7.09% increase; p = .31, d = 0.03, 95% CI = [−0.03, 0.09]) and recipient-salient levels (3.31% increase; p = .64, d = 0.01, 95% CI = [−0.04, 0.07]). Purchasing of other non-SSBs (milk, juice, unsweetened tea, and coffee) did not show a clear pattern as a function of study period (see Section A3 in the Supplemental Material).
To summarize, Study 1 indicated that introducing a $0.01-per-ounce SSB tax—without making it salient on price tags—had no effect on purchasing. However, making the tax salient by adding “Includes SF Sugary Drink Tax” to tax-inclusive price tags decreased SSB purchasing by 9.78% relative to matching calendar weeks from pretax periods, by 5.04% relative to a baseline period in which the SSB tax was in effect but drinks did not bear price tags, and by 3.83% relative to the control condition in which drinks bore tax-inclusive price tags but made no mention of the SSB tax. Results of the substitution analysis suggested that tax salience led some consumers to buy water and diet soda in lieu of SSBs.
A recipient-salient price tag (which conveyed that the tax proceeds would go to student programs) was just as effective at reducing SSB purchasing as the tax-salient price tag. We surmise that we did not observe a licensing effect (in which the charitable donation makes people feel entitled to behave unhealthfully, spurring SSB purchasing; Khan & Dhar, 2006) because a countervailing effect—tax aversion (i.e., the desire to avoid taxes; Sussman & Olivola, 2011)—may have been stronger (Blanken et al., 2015). We investigated this idea further in Study 2.
Study 2: Overestimating the Tax Amount
Given that people are generally averse to taxes (Sussman & Olivola, 2011), in Study 2, we evaluated whether the effect of the tax-salient price tag was driven by a tendency to overestimate the tax amount. In a simulated shopping task, participants indicated their willingness to buy an SSB. We manipulated the price tags between subjects: Half of the participants were shown a control price tag that simply displayed the tax-inclusive price; the other half were shown a tax-salient tag (akin to those used in Study 1). We predicted that the results would replicate those of Study 1; specifically, purchase interest would be lower in the tax-salient condition relative to the control condition. Moreover, we predicted that this effect would be driven by participants’ inferences of the tax amount.
Method
In our preregistration, we specified a sample size of 400 respondents on the basis of a power analysis with the following parameters: 90% power (β = 0.10), a Type I error rate of 5% (α = .05), and a small effect size (Cohen’s d = 0.30). This analysis suggested that we would need 380 participants; to be conservative, we decided a priori to recruit 400.
We recruited participants from Amazon’s Mechanical Turk who reported regularly drinking SSBs (N = 400; mean age = 39.10 years, SD = 11.95; 49.5% female; 78.8% White; see Table 4 for full demographic information, including a comparison with the latest U.S. census data; U.S. Census Bureau, 2018). To do so, we followed the procedures of Donnelly et al. (2018): Participants were asked, “Do you drink soda?” Participants who responded “no” were told that they did not qualify for the survey. If participants responded “yes,” they continued to the next question, which asked, “When you drink soda, do you usually drink regular, full calorie soda (e.g., Coke, Pepsi) or diet, no-calorie soda (e.g., Diet Coke, Coke Zero, Diet Pepsi)?” Participants who responded “diet, no-calorie soda” were told they did not qualify for the survey. If the participants responded “full calorie soda,” they continued to the rest of the survey. At the end of the survey we also asked participants, “How often do you drink sugary drinks? (e.g., regular soda, sports drinks, sweetened teas, juice drinks. Do not include diet or sugar-free drinks).” Participants were given nine response options: (a) never, (b) 1 time per month, (c) 2–3 times per month, (d) 1–2 times per week, (e) 3–4 times per week, (f) 5–6 times per week, (g) 1 time per day, (h) 2 times per day, or (i) 3 or more times per day. As specified in our preregistration, participants who responded “never” were excluded from our analyses.
Characteristics of the Samples in Studies 1 and 3, Compared With U.S. Census Data

Note: For attributes for which U.S. census data are available, the percentage-point deviation is given between our sample and that of the latest U.S. census data (U.S. Census Bureau, 2018). Demographic data were not collected in Study 1.
Participants imagined that they were at a convenience store and considering buying a sugary drink. Participants reported their preferred SSB and were presented with an image depicting a 12-oz can of it. We manipulated the price tags between subjects: In the control condition, participants viewed the control as in Study 1 (e.g., “Coca-Cola, $1.52”). In the experimental condition, participants viewed the tax-salient price tag as in Study 1 (e.g., “Coca-Cola, $1.52, includes sugary beverage tax”). Participants rated their purchase interest on a scale ranging from −3, definitely not buy, to 3, definitely buy. Participants also provided an SSB tax estimate; they were asked, “If you had to guess, how much of this $1.52 is a sugary beverage tax? Please indicate a dollar amount between $0.00 and $1.52 in the space below”; participants recorded their answers in a text box. The order of these two measures was counterbalanced. The study concluded with basic demographic questions.
Results
Purchase intentions were lower in the tax-salient condition (M = 0.44, SD = 1.90) relative to the control condition (M = 1.02, SD = 1.84), t(398) = 3.06, p = .002, d = 0.31, 95% CI = [0.11, 0.50]. Interestingly, in both conditions, tax estimates were significantly higher than $0.12—the amount of the San Francisco tax on a 12-oz drink—tax salient: M = $0.40, SD = $0.27, t(200) = 14.64, p < .001, d = 1.01, 95% CI = [0.86, 1.20]; control: M = $0.34, SD = $0.27, t(198) = 11.27, p < .001, d = 0.80, 95% CI = [0.64, 0.96]. Importantly, however, and as predicted, tax estimates were higher in the tax-salient condition relative to the control condition, t(398) = 2.44, p = .015, d = 0.24, 95% CI = [0.05, 0.44]. The hypothesized mediation was found: Tax-salient price tags increased tax estimates, in turn reducing purchase intentions, b = −0.09, SE = 0.046, 95% CI = [−0.19, −0.02] (SPSS PROCESS macro, Model 4; Hayes & Preacher, 2014). See Figure 3.
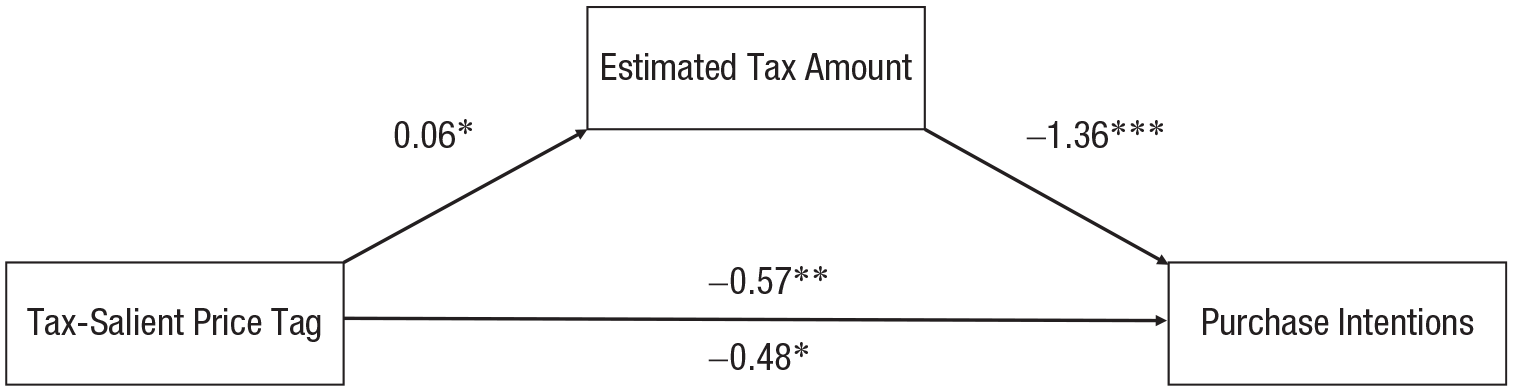
Mediation model showing the effect of tax-salient price tags on purchasing intentions, as mediated by estimated tax amount (Study 2). Path coefficients are standardized regression weights. On the path from tax-salient price tag to purchase intentions, the coefficient above the arrow represents the direct effect without the mediator in the model, and the coefficient below the arrow represents the direct effect with the mediator in the model. Asterisks indicate significant paths (*p < .05, **p < .01, ***p < .001).
Stemming from the notion that taxes evoke disdain, Study 2’s results suggest that tax-salient price tags were effective partly because consumers overestimated the tax amount, which in turn reduced purchase intentions. In support of this process account, results showed that the tax-salient tag led to higher tax estimates relative to the control condition. As further support for this mechanism, a correlational version of this study pointed to the same conclusion (see Section B1 in the Supplemental Material).
Study 3: High Versus Low Tax
Method
In Study 3, we sought to conceptually replicate Study 1 and, building on Study 2, we sought to provide convergent evidence of underlying process. Specifically, in Study 3, we compared the performance of the tax-salient tag (which mentioned the presence of a tax but not its amount) with three key comparators. First, to conceptually replicate Study 1, we compared it with a control tag, which listed the tax-inclusive price but made no mention of tax (as in Study 1). Second, to provide convergent evidence of underlying process, we compared the tax-salient tag with two different tags that indicated the specific amount of the tax: a low-tax-revealed condition, which revealed that the price included a relatively small ($0.01) SSB tax per ounce, and a high-tax-revealed condition, which revealed that the price included a much higher ($0.033) tax per ounce. We reasoned that if the tax-salient tag is effective because people overestimate the tax amount, then it should produce purchase interest or disinterest similar to that in the high-tax-revealed condition.
We recruited participants from Amazon’s Mechanical Turk who reported regularly drinking SSBs (N = 809; mean age = 37.90 years, SD = 11.76; 52.9% female; 78.0% White; see Table 4 for full demographic information, including a comparison with the latest U.S. census data). The screening procedure was the same as that used in Study 2. In our preregistration, we specified a sample size of 200 respondents per condition on the basis of recent thinking about sample sizes (Simmons et al., 2011).
Participants imagined that they were at a convenience store and considering buying an SSB. Participants reported their preferred SSB and were presented with an image depicting a 12-oz can of it. We manipulated the tax information that was on the price tags between subjects; each participant was randomly assigned to one of four conditions. In the control condition, participants viewed the control price tag as in Studies 1 and 2 (e.g., “Coca-Cola, $1.52”). In each of the other three conditions, we added text to this base tag. As in Study 2, in the tax-salient condition, we added “Includes Sugary Beverage Tax.” In the low-tax-revealed condition, we added “Includes $0.12 Sugary Beverage Tax”—a $0.01 tax per ounce. In the high-tax-revealed condition, we added “Includes $0.40 Sugary Beverage Tax”—a $0.033 tax per ounce, the average estimate from Study 2’s tax-salient condition. Participants rated their purchase intention on a scale ranging from −3, definitely not buy, to 3, definitely buy. The study concluded with basic demographic questions.
Results
Planned contrasts revealed that, as predicted, relative to the control condition (M = 0.82, SD = 1.83), purchase interest was reduced in both the tax-salient condition (M = 0.42, SD = 1.89), t(805) = 2.11, p = .036, d = 0.21, 95% CI = [0.01, 0.41], and the high-tax-revealed condition (M = 0.21, SD = 1.99), t(805) = 3.27, p = .001, d = 0.32, 95% CI = [0.13, 0.52]. Purchase interest was just as high in the low-tax-revealed condition (M = 0.78, SD = 1.82) as in the control condition, t(805) = 0.19, p = .85, d = 0.02, 95% CI = [−0.18, 0.21] (see Fig. 4). In further support of our account, results showed that purchase interest in the tax-salient condition was more similar to that in the high-tax-revealed condition, t(805) = 1.15, p = .25, d = 0.11, 95% CI = [−0.08, 0.31], than to that in the low-tax-revealed condition, t(805) = −1.91, p = .056, d = 0.19, 95% CI = [−0.39, 0.00].
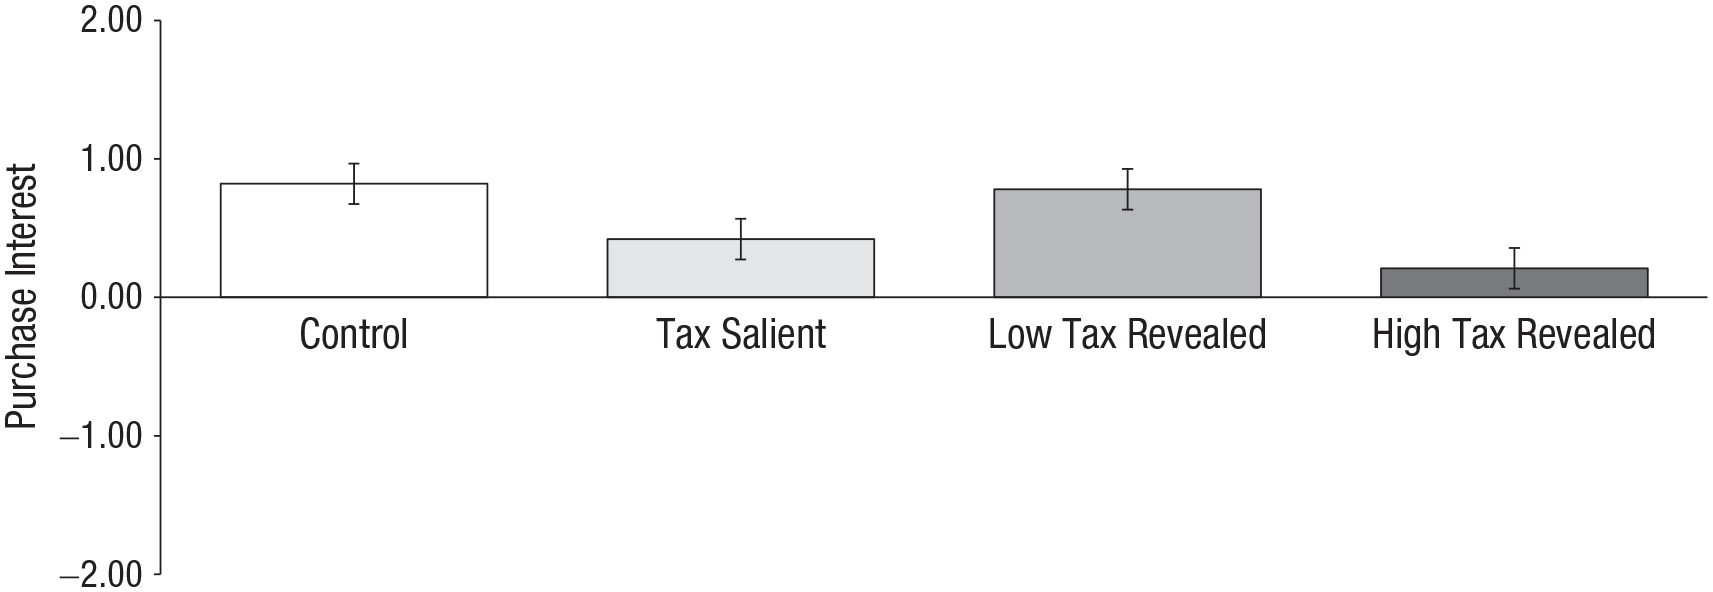
Interest in purchasing a sugar-sweetened beverage in each condition of Study 3. Purchase interest was measured on a scale ranging from −3, definitely not buy, to 3, definitely buy. Error bars represent ±1 SEM.
In sum, price tags that denoted the presence of an SSB tax, but not its amount, suppressed purchase interest to a similar degree as price tags that denoted a tax of $0.033 per ounce. By contrast, price tags that denoted a much lower tax amount ($0.01 per ounce) did not suppress purchase interest relative to a control condition in which no mention was made of the tax. Thus, this study provides further evidence of our process account, namely that Study 1’s tax-salient tag was effective partly because people overestimated the tax amount. As further support for this mechanism, a conceptual replication of this study pointed to the same conclusion (see Section B2 in the Supplemental Material). Taken together, these results imply that making an SSB tax salient on price tags can decrease SSB buying, though this effect may be reduced or eliminated when the tax amount is low and stipulated on the price tag.
General Discussion
A recent commentary concluded that “the effect of an excise tax on sugar-sweetened beverage consumption depends on two factors: the extent to which the tax is ‘passed through’ to consumers . . . and consumers’ responsiveness to the increased price” (Powell & Maciejewski, 2018, p. 229). The present research points to an additional consequential factor: whether the tax is made salient on price tags. In fact, as observed in Study 1, it was only when the tax was made salient on price tags that it reduced SSB buying. Moreover, this reduction was offset by increased purchasing of water and diet soda (as opposed to reducing drink purchasing overall), which bodes well for eliciting retailers’ cooperation in implementation. The results of Studies 2 and 3 suggest that the effect of the tax-salient tags might be driven by overestimation of the tax amount.
Our results are consistent with those of a prior study showing that making taxes salient on price tags can decrease purchasing of everyday household items (Chetty et al., 2009). However, in this previous work, the amount of the tax was conveyed on the price tags. By contrast, we show that tax salience can be effective without showcasing the tax amount. Moreover, our results suggest that when the tax amount is low, price tags that denote the specific amount of the tax can be less effective than those that do not. Further, the present research helps to explain prior work, which has found that SSB purchasing decreased after the introduction of an SSB tax (Roberto et al., 2019). This work aggregates sales data across stores that varied in how the tax was conveyed at point of purchase. Our work suggests that the observed decrease in SSB purchasing may have been driven by the stores that made the SSB tax salient directly on price tags. Future research could explore whether this reduction translates into improved health outcomes, such as weight loss. In this regard, it is promising that the decrement in SSB purchasing corresponded with a reduction in average caloric content of purchased drinks, as well as an increase in water buying.
With respect to study design, testing our interventions in the field enabled us to evaluate the impact of price-tag labeling on SSB buying, but the quasiexperimental nature of our design does not allow us to account for ordering effects of our interventions or how these effects may be moderated by shopping frequency. For example, it is possible that repeat customers experienced more than one intervention and that their buying decisions may have been influenced by a previous intervention, or an accumulation of more than one intervention. We sought to minimize the possibility of such carryover effects by including washout periods, as in prior work (Bleich et al., 2014; Donnelly et al., 2018). Following previous research evaluating SSB taxes, we tested the effects of our intervention over a relatively short time span (Blake et al., 2018; Zhong et al., 2018). Longitudinal studies, combined with shopper-intercept studies, could assess the longer-term effectiveness of our intervention. We also used convenience samples in Studies 2 and 3 that were not perfectly nationally representative (see Table 4 for a comparison of our sample characteristics with those of the latest U.S. census data). Further, our field location was a college campus; therefore, future research should assess the generalizability of our findings across more representative samples and also evaluate whether race, ethnicity, or other demographic variables moderate our results.
Practically, our results provide preliminary guidance on how to communicate SSB taxes at point of purchase for maximal impact. Our results suggest that when the tax is higher than consumers’ intuitions, price tags that denote the specific amount of the tax will be more effective at curbing SSB buying than those that do not. What about when the tax is lower than consumers’ intuitions? At present, arguably all SSB taxes in the United States fall into this category (they are all far lower than our respondents’ typical estimates of the tax amount), 4 so this question is particularly relevant. But the prescription in this case is murkier. Our results suggest that not stating the exact tax amount would be more likely than stating it to curb SSB buying. However, such a prescription raises new questions: Is it right or fair to hide the amount of the tax? Over time, might hiding the tax backfire? Indeed, prior work indicates that when people feel as though information has been hidden from them, trust is undermined (John et al., 2016).
Future work is needed to better understand the effects of revealing specific tax amounts on purchasing. For example, whether the tax amount is simply reflected in a higher price (relative to nontaxed items) or explicitly spelled out could affect whether the tax is perceived as large or small (Dehaene, 1992). Moreover, our results hint that such relationships could be moderated by the size of the tax: Small taxes may be perceived as essentially zero when price tags reveal their exact amount (as opposed to simply displaying the tax-inclusive price; see Reyna & Brainerd, 1995). Such relationships could also be moderated by product placement: Placing SSBs next to their non-SSB counterparts could facilitate comparative processes, whereas grouping all SSBs together, away from their non-SSB counterparts, could inhibit such processes (Hsee et al., 1999). More research is needed to answer such questions.
Conclusion
This field study is the first to test how the labeling of an SSB excise tax impacts SSB buying. Taken together, our studies suggest that to have their intended impact, such taxes should be made salient on price tags.
Supplemental Material
sj-docx-1-pss-10.1177_09567976211017022 – Supplemental material for A Salient Sugar Tax Decreases Sugary-Drink Buying
Supplemental material, sj-docx-1-pss-10.1177_09567976211017022 for A Salient Sugar Tax Decreases Sugary-Drink Buying by Grant E. Donnelly, Paige M. Guge, Ryan T. Howell and Leslie K. John in Psychological Science
Footnotes
Transparency
Action Editor: Sachiko Kinoshita
Editor: Patricia J. Bauer
Author Contributions
G. E. Donnelly, P. M. Guge, R. T. Howell, and L. K. John designed the research. P. M. Guge performed the research, and G. E. Donnelly, P. M. Guge, and R. T. Howell analyzed the data. All the authors wrote the article and approved the final version for submission.

Notes
References
Supplementary Material
Please find the following supplemental material available below.
For Open Access articles published under a Creative Commons License, all supplemental material carries the same license as the article it is associated with.
For non-Open Access articles published, all supplemental material carries a non-exclusive license, and permission requests for re-use of supplemental material or any part of supplemental material shall be sent directly to the copyright owner as specified in the copyright notice associated with the article.
