



Abstract
Although much is known about cooperation, the internal decision rules that regulate motivations to initiate and maintain cooperative relationships have not been thoroughly explored. Here, we focus on how acts of benefit delivery and perceptions of social value inform gratitude, an emotion that promotes cooperation. We evaluated alternate information-processing models to determine which inputs and internal representations best account for the intensity with which people report experiencing gratitude. Across two experiments (Ns = 257 and 208), we tested 10 models that consider multiple variables: the magnitude of benefits conferred on beneficiaries, the magnitude of costs incurred by benefactors, beneficiaries’ perception of how much benefactors value their welfare, and beneficiaries’ value for the welfare of their benefactors. Across both studies, only beneficiaries’ change in social valuation for their benefactors consistently predicted gratitude. Results point to the need for further research and contribute to the growing literature linking cooperation, social emotions, and social valuation.
Keywords
Humans have a remarkable capacity for tracking who is likely to cooperate or compete across heterogeneous social situations (Maynard Smith, 1982). A growing body of work supports the claim that this capacity is supported by cognitive systems that assign individuals a social value to help guide perceivers’ decisions of whether and how to engage with those individuals (McClintock & Allison, 1989; Messick & McClintock, 1968; Pletzer et al., 2018; Tooby et al., 2008). Naturally, the outcome of each interaction feeds back into social-value estimates, which, in turn, update judgments and decision-making strategies. Here, we focus on how people process cooperative interactions—in particular, how the emotion of gratitude relates to social value and motivates people to reinforce cooperation.
Gratitude is well established as an emotion linked to the development of cooperative relationships (Algoe & Haidt, 2009; Bar-Tal et al., 1977; Bartlett et al., 2012; DeSteno et al., 2010; Emmons & McCullough, 2003; Lim, 2012; Nowak & Roch, 2006; Tesser et al., 1968). But what inputs and decision rules compose the mental software that generates the affective state that we label gratitude? Tesser et al. (1968) were among the first to develop a causal model of gratitude based on the benefits to the receiver, the costs to the benefactor, and the benefactor’s intentions—findings that have been reinforced by several subsequent investigations (e.g., Bartlett & DeSteno, 2006; Forster et al., 2017; McCullough et al., 2001, 2004; Tsang, 2006; Yu et al., 2018).
More recently, Tooby and Cosmides (2008) proposed a model of gratitude that incorporates an index of social value, dubbed a welfare trade-off ratio (WTR), “which regulates the extent to which the actor is intrinsically disposed to trade off his or her own welfare against that of [another] individual” (p. 130). Clearly, such a variable would directly impact one’s willingness to incur costs to provide benefits to another person. Consequently, the observed costs and benefits associated with an act should be indicative of one’s WTR for another. According to Tooby and Cosmides (2008), “Gratitude is triggered by new information indicating that another [person] places a higher value on one’s welfare than one’s system had previously estimated” (p. 134) and that gratitude functions to increase one’s WTR toward benefactors. In other words, gratitude is a consequence of perceived changes in the benefactor’s WTR for the recipient (perceived ΔWTRother→self) and is antecedent to, or perhaps concurrent with, the recipient’s own changes in WTR for the benefactor (experienced ΔWTRself→other).
One plausible alternative model is that changes in recipients’ WTRs for benefactors (experienced ΔWTRself→other) predict recipients’ emotional responses. Some scholars have argued and found evidence that gratitude functions to communicate the positive change in experienced social value and motivations to cooperate (Peng et al., 2018; Smith et al., 2017). Indeed, evidence from research examining the effects of receiving thanks on benefactors’ prosociality suggests that recipients’ expressions are sufficient to facilitate continued cooperation from benefactors (Grant & Gino, 2010). This is telling because cooperation can ensue without the need for the recipient to infer what, if any, change occurred in the benefactor’s mind (perceived ΔWTRother→self). It is therefore possible that changes in WTRself→other suffice to account for reports of gratitude; specifically, one’s gratitude promotes communication of increased value and one’s WTR motivates cooperative versus exploitative behavior, as WTRs are alleged to do across all social interactions (Tooby & Cosmides, 2008; Tooby et al., 2008).
We know of no data that unambiguously delineate whether gratitude causes changes in WTRself→other, whether changes in WTRself→other cause gratitude, or whether they are one and the same (i.e., that feelings of gratitude incidentally correspond to changes in WTRself→other). Because the focus of our investigation here is to understand what causes gratitude, we present alternative models in terms of causal antecedents of gratitude, even when alternative causal directions are equally plausible given the data.
Though social-value-based models of gratitude have received some empirical attention (e.g., Bar-Tal et al., 1977; Forster et al., 2017; Lim, 2012; Smith et al., 2017), previous efforts have been limited in various ways. Three reports, though comprehensive in their use of scenarios that teased apart various causal components, were limited because of their reliance on responses to hypothetical scenarios in which no benefits were actually exchanged at the time of measurement (Bar-Tal et al., 1977; Forster et al., 2017; Lim, 2012). In one experiment in which subjects believed that their earnings were affected by others’ decisions within the study, Smith et al. (2017) found a strong link between how much recipients’ WTRs toward benefactors increased and their reported feelings of gratitude, but they did not measure recipients’ perceptions of benefactors’ WTRs toward themselves, nor did they vary the magnitude of costs and benefits.
Statement of Relevance
Gratitude is a positive emotion that results when one receives costly, intentionally delivered benefits from another, and it plays a key role in forming and maintaining relationships. Research has also shown that gratitude may have important mental and physical health benefits. However, in a deeper sense, we do not yet know how and why gratitude functions the way that it does. Understanding how gratitude works can help illuminate the ultimate functions that gratitude has evolved to perform, thus paving the way for society to better understand and cultivate this important emotion. Our results here suggest that gratitude corresponds to positive changes in how much we value others as a result of actions they have taken to benefit us. Such a dynamic sets the stage for downstream cooperation and the building of long-term cooperative relationships, and it also suggests that interventions aimed at cultivating gratitude toward other people could help boost cooperation.
The Current Experiments
We conducted two preregistered experiments (https://osf.io/a95kv/) 1 to begin adjudicating between 10 information-processing models of gratitude (supplemental material, including analysis scripts, is available at https://osf.io/a95kv/). In each experiment, we manipulated social interactions and obtained subjects’ WTRs for others and subjects’ beliefs about the WTRs that others hold for the subjects. In our experiments, we considered that social value may affect how costs and benefits relate to gratitude. If WTRs track the degree to which people view their own welfare as interdependent with another’s, then people should experience benefits and costs indirectly through the benefits and costs taken on by others. Such an observation poses an interesting theoretical challenge to previous accounts of the roles that WTRs play in facilitating emotional and behavioral responses—for instance, when benefactors pay greater costs for the same benefit, they are simultaneously conveying greater social value and providing a relatively lower net benefit to the recipient, insofar as the cost incurred by the benefactor is also indirectly incurred by the recipient. To incorporate this possibility, we sought to design a comprehensive procedure for testing various plausible causes of gratitude—one in which subjects receive a tangible benefit from another person that could be understood in terms of its costs to the benefactor, its direct benefits to the recipient, the social value revealed by the act, and the social information that could be derived from these components (e.g., direct benefits discounted by indirect costs). With this in mind, we systematically tested each of the competing models described below (and in Table 1) to zero in on the computational architecture of gratitude.
Models of Gratitude Tested in Experiments 1 and 2
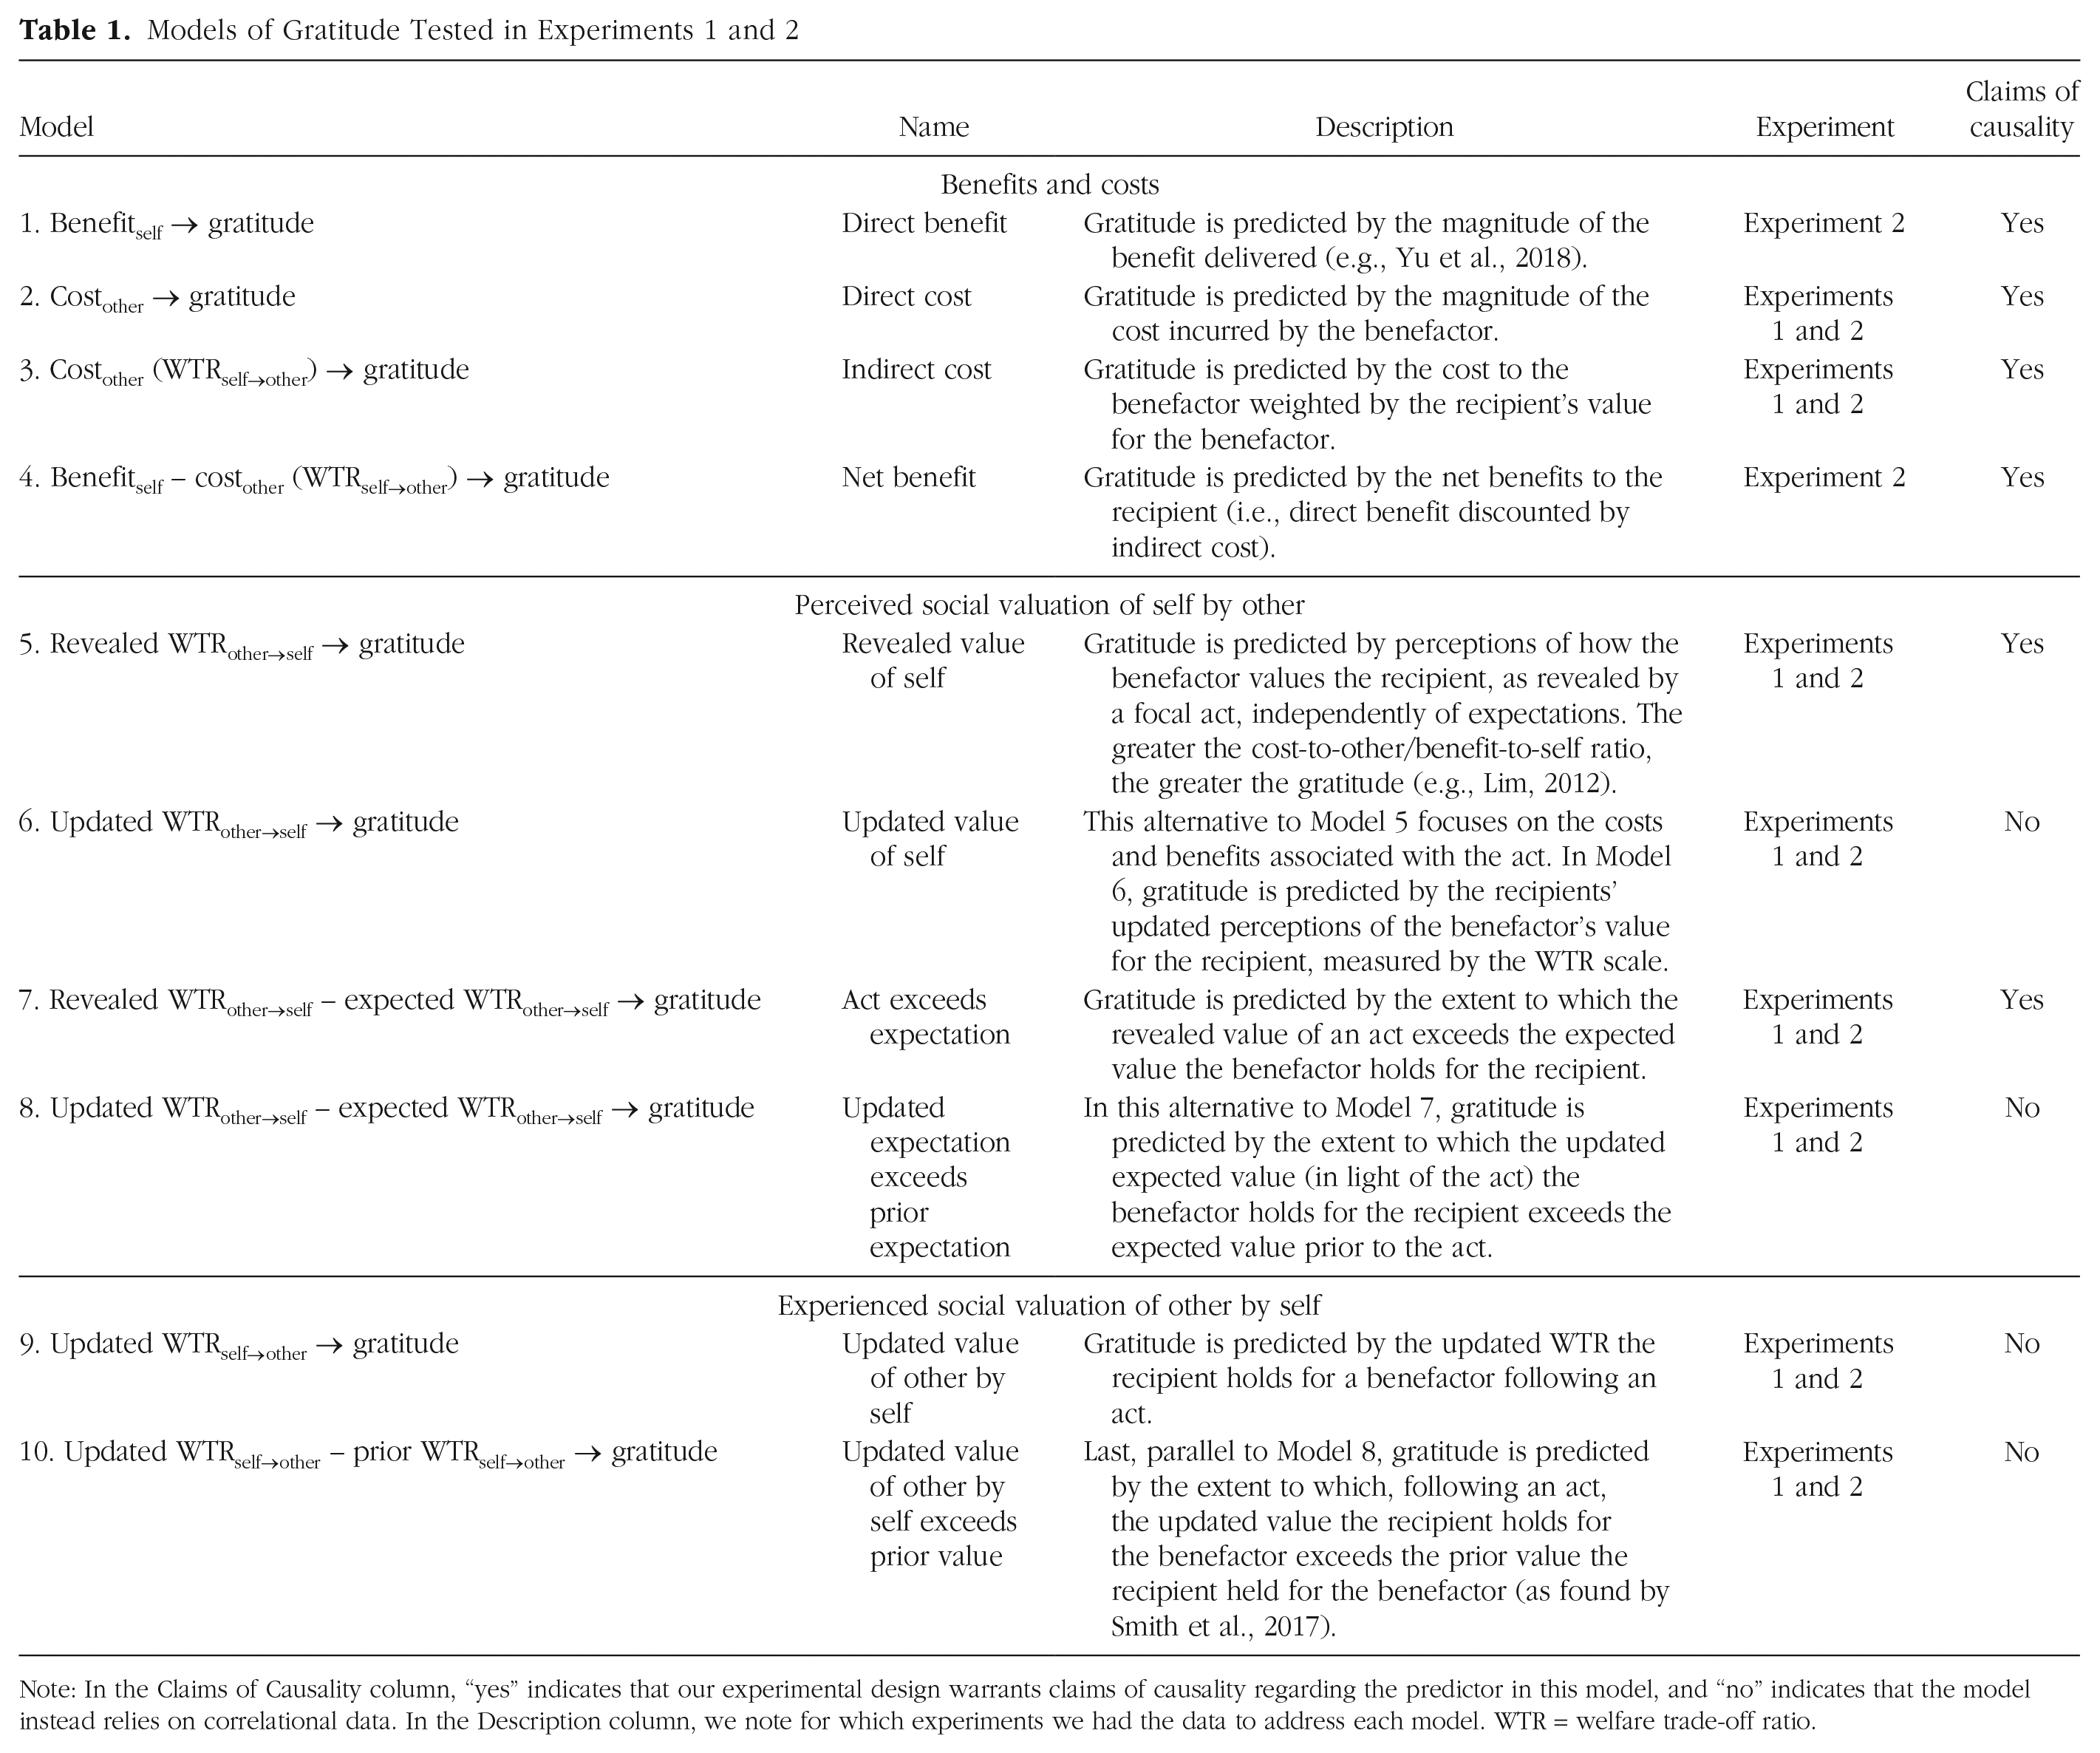
Note: In the Claims of Causality column, “yes” indicates that our experimental design warrants claims of causality regarding the predictor in this model, and “no” indicates that the model instead relies on correlational data. In the Description column, we note for which experiments we had the data to address each model. WTR = welfare trade-off ratio.
Experiment 1
Method
Subjects
Following our preregistration, we planned to recruit at least 500 nonsuspicious subjects. Because these analyses include only one of two conditions from the larger sample, we sought to collect 250 nonsuspicious subjects for the data reported here. The sample size was not based on an a priori power analysis but rather on our understanding that such a sample size would be considered large for this area of research. Subjects were 311 workers from Amazon’s Mechanical Turk (145 female; age range = 18–69 years, M = 32.22, SD = 9.73) who participated for $1.00 in base pay and an opportunity to earn bonus money throughout the experiment. At the end of the experiment, subjects received a bonus between $2.50 and $2.75 (randomly generated for each subject 2 ), for an average total earning of $3.63 per subject. Following our preregistration, we excluded suspicious subjects (n = 54) for a final sample of 257 subjects (121 female; age range = 19–69 years, M = 32.49, SD = 9.90; analyses with suspicious subjects included are available at https://osf.io/a95kv/ and do not reveal any substantive differences). All methods were approved by the University of Miami Institutional Review Board.
Materials and procedure
We programmed the experiment using Software Platform for Human Interaction Experiments (SoPHIE; Hendriks, 2012), which enables subjects to interact in real time. At the beginning of the experiment, subjects were paired in a virtual waiting room. Once paired, dyads participated in an unguided chat for 2 min. By engaging in an authentic real-time chat with another person, subjects (a) understood that others were present in the session and that interactions would be real and (b) had the opportunity to form an initial impression of the other person, which was meant to reduce the uncertainty of WTRs and create some natural variability in baseline WTRother→self and WTRself→other estimates. All interactions following the chat were staged.
Baseline WTRs
After the chat, subjects were asked to complete measures of social discounting (Jones & Rachlin, 2006), modifications of which have been used to measure WTRs (Delton, 2010; Lim, 2012). Subjects were asked to make several hypothetical trade-offs between a varying amount of money for themselves (descending from $85 to $0) and a fixed amount of money for their interaction partner ($75). Typically, subjects began the task by allocating money for themselves (for subjects, $85 for themselves was more valuable than $75 for their interaction partners), but eventually they encountered a trade-off in which the money available for the other person was subjectively more desirable than the money available for themselves (e.g., for subjects, $5 for themselves may have been less valuable than $75 for the interaction partner). When subjects decided to switch from allocating money to themselves, they confirmed their decision, and their point of indifference was used to calculate a baseline WTR (WTRself→other) by dividing the indifference point by 75. Possible WTR values from this scale range from 0 ($0 for oneself preferred over $75 for partner) to 1.13 ($85 forgone in favor of $75 for partner). 3
After we familiarized subjects with the WTRself→other measure, and before the experimental manipulation, we asked subjects to provide their expectations of how their partner would treat them (WTRother→self). The format of this task was identical to the WTRself→other task, but here subjects were asked to take the perspective of their interaction partner and respond to each of the items by allocating either a varying amount to the interaction partner (descending from $85 to $0) or a fixed amount to themselves ($75). Again, values ranged from 0 to 1.13.
Manipulation of benefit delivery
After both measures of WTR, which involved hypothetical monetary decisions, we told subjects they would participate in an economic game for real money. At this point, we gave subjects $1.00 in bonus earnings and told them this amount could be affected by the decisions in the upcoming task. Next, subjects were told that they and their social partner would be assigned to play either the role of decision maker or the role of recipient in an economic game in which the decision maker decides on a payout for both players and the recipient passively receives the payout selected. All subjects were assigned to the role of recipient and were told to wait for the decision maker.
While waiting for the decision, subjects could see that the decision maker was given three options, each with different economic outcomes for the decision maker and recipient: The first option provided a benefit to the recipient at a cost to the decision maker, the second option provided no cost or benefit to either the decision maker or recipient, and the third option provided a benefit to the decision maker at a cost to the recipient (see Fig. 1). The magnitude of the effect on the recipient was always $0.93, so when the recipient received a benefit it was +$0.93, and when the recipient incurred a cost it was –$0.93. We randomly varied the magnitude of the cost or benefit to the decision maker to be between $0.01 and $0.93. To illustrate the extremes, consider that the decision maker could incur a cost of $0.01 to provide the recipient with $0.93 (revealed WTR ≥ 0.01), earn a benefit of $0.01 at a cost of $0.93 to the recipient (revealed WTR ≤ 0.01), or do nothing (revealed WTR = 0.01, given that the decision maker’s preference fell between the other two options). At the other extreme, the decision maker could incur a cost of $0.93 to provide the recipient with $0.93 (revealed WTR ≥ 1.00), earn a benefit of $0.93 at a cost to the recipient of $0.93 (revealed WTR ≤ 1), or do nothing (revealed WTR = 1). Therefore, our experimental manipulation was a simultaneous manipulation of two pieces of social information: the direct costs to the benefactor for carrying out the act (i.e., the deduction of an amount between $0.01 and $0.93 to deliver a $0.93 benefit) and the opportunity costs to the benefactor (i.e., forgoing $0.93 to prevent the recipient from paying between $0.01 and $0.93).
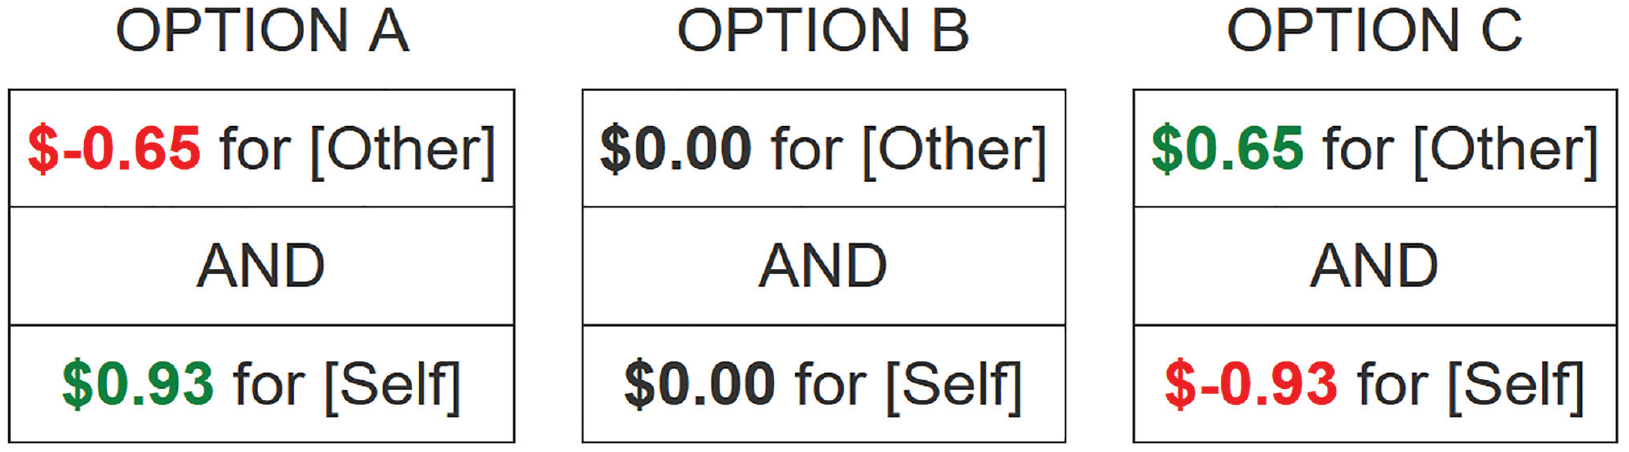
Example of the stimulus shown to subjects outlining the options available to benefactors in Experiments 1 and 2. While subjects were awaiting the benefactor’s decision, they were presented with the three options for allocating money that the benefactor was purportedly considering. “Other” and “self” were filled in by the computer program with the initials of the subjects. Costs to the benefactor and benefit to the subject varied depending on the experiment. After a choice was ostensibly made by the benefactor, the option was highlighted, and the monetary outcomes to both subjects (i.e., their resulting total funds) were also displayed on the screen.
After 30 s had elapsed, the screen showed the decision maker’s decision by highlighting their selection and displaying the resulting payoffs. The decision maker’s decision always benefited the subject at a cost to the decision maker.
Gratitude assessment
After the manipulation of benefit delivery, subjects provided responses to three gratitude items (“How [thankful/grateful/appreciative] do you feel toward [the decision-maker]?”) on a 6-point ordinal scale (0 = not at all, 5 = extremely), among nine other emotion items that served as distractors (see the experiment file in supplemental materials: https://osf.io/93t2q/). Subjects’ responses to these items were used to specify a latent variable under the graded response model (Samejima, 1969) to represent gratitude (λgrateful = .945, λthankful = .934, λappreciative = .918; MacDonald’s ω = .99).
Follow-up WTR
Finally, after responding to self-report measures of emotions, subjects repeated the same WTRother→self and WTRself→other assessments to provide updated values following the interaction. Subjects were given the same instructions they received for baseline WTRs.
Suspicion probes and debriefing
After completing all follow-up WTR measures, subjects responded to a series of questions in a funnel debriefing procedure. We used subjects’ responses to determine whether they were suspicious of the protocol’s authenticity (see supplemental materials for the coding procedure: https://osf.io/a95kv/). Here, we report results with nonsuspicious subjects only (per our preregistered analysis plan), but we also provide analyses including all suspicious subjects at https://osf.io/a95kv/. None of the results we report here were influenced by whether subjects reported suspicion.
Model selection and analysis plan
We identified a set of causal models to explore on the basis of a combination of our experimental design, in which we directly manipulated aspects of the cooperative interaction, and from prior empirical and theoretical investigations, which outlined previously identified influences of gratitude. To ensure greater coherence among the models we tested, we used structural equation modeling to make our causal assumptions clear. See Table 1 for all models and more detailed descriptions. We present these models under three categories: benefits and costs, perceived social value, and experienced social value.
Results
Bivariate correlations between all variables used to compute and predict other variables are displayed above the diagonal in Table 2. Analyses were conducted using Mplus (Version 7; Muthén & Muthén, 2012). To evaluate the 10 models we consider here, we compared the explanatory power of the variables using standard null-hypothesis significance testing. All models are structural equation models in which our latent measure of gratitude was regressed on the predictors described in the models above. See Table 3 for a summary of all model results. Of the models tested, only two (Models 9 and 10) were statistically significant at the predetermined threshold (α = .05).
Correlation Coefficients for All Variables Tested in Experiments 1 and 2
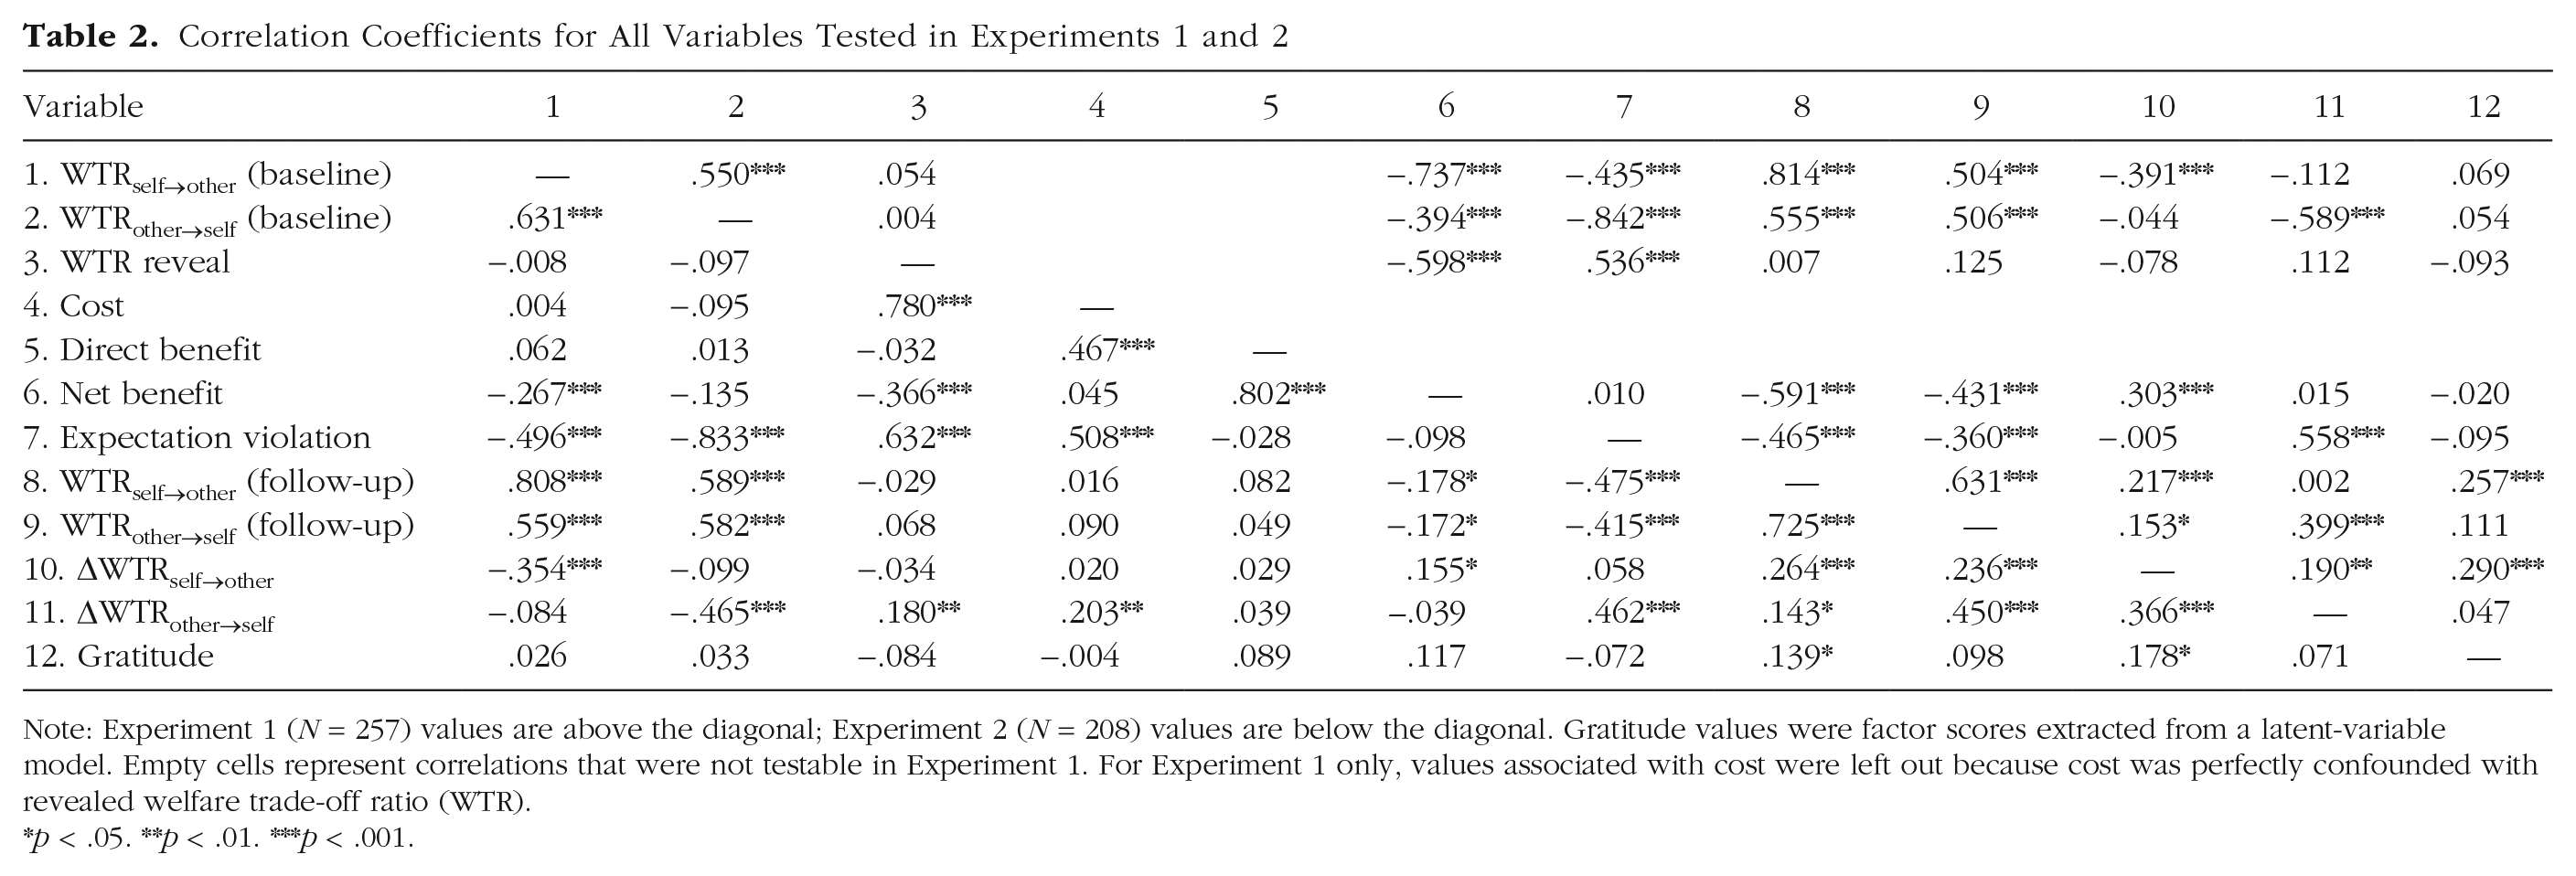
Note: Experiment 1 (N = 257) values are above the diagonal; Experiment 2 (N = 208) values are below the diagonal. Gratitude values were factor scores extracted from a latent-variable model. Empty cells represent correlations that were not testable in Experiment 1. For Experiment 1 only, values associated with cost were left out because cost was perfectly confounded with revealed welfare trade-off ratio (WTR).
p < .05. **p < .01. ***p < .001.
Model Results for Experiments 1 and 2

Note: R2 values represent the proportion of variance of the latent variable “gratitude” explained by the model. CI = confidence interval; WTR = welfare trade-off ratio.
For Experiment 1, this model was invariant.
For Experiment 1, results for this model were confounded with those of Model 3.
For Experiment 1, results for this model were confounded with those of Model 2. dFor Experiment 1, R2 = .18; for Experiment 2, R2 = .05.
Model 9
We regressed gratitude on subjects’ WTRs for the benefactor after benefit delivery (Model 9); gratitude was explained by subjects’ updated WTR, b = 0.735, SE = 0.178, z = 4.141, p < .001, 95% confidence interval (CI) = [0.386, 1.082], R2 = .083.
Model 10
We regressed gratitude on subjects’ changes in their WTR for the benefactor, subtracting their updated WTR from their prior WTR, ΔWTRself→other (Model 10); gratitude was predicted by this change in WTR, b = 1.588, SE = 0.266, z = 5.982, p < .001, 95% CI = [1.067, 2.110], R2 = .145, which replicates the findings of Smith et al. (2017).
Adjudicating between Models 9 and 10
We found that both updated WTR (Model 9) and change in WTR (Model 10) were related to gratitude. On the surface, the positive change in WTR appears to be a stronger predictor of gratitude, explaining 14.5% of variance on its own, compared with the 8.3% of variance explained by updated WTR alone. One might argue that directly testing these predictors simultaneously could reveal which variable is a better predictor of gratitude. However, testing these predictors in the same model would be disingenuous because the variable “change in WTR” incorporates information from the variable “updated WTR.” Fortunately, we can also reinterpret our computation of “change in WTR,” which we treated as a single difference between two components, as two components in a regression model: “prior WTR” and “updated WTR.” Including both predictors in the model revealed that updated WTRself→other was positively related to gratitude when the model controlled for prior WTRself→other, b = 1.961, SE = 0.284, z = 6.927, p < .001, 95% CI = [1.405, 2.517]. Meanwhile, prior WTRself→other was negatively related to gratitude when the model controlled for updated WTRself→other, b = −1.399, SE = 0.281, z = −4.997, p < .001, 95% CI = [−1.949, −0.849]. The direction of these effects, respectively positive and negative, reflects a decomposition of the process with which we computed change scores in Model 10: updated WTR – prior WTR. Modeling WTR change in this way improved our model fit, yielding explained variance of 18.1% and further corroborating that change in WTR yields the best interpretation of how gratitude operates, at least with respect to our data and the models we tested.
Discussion
In Experiment 1, gratitude was unrelated to how much people expect to receive from others or the costs that benefactors incur to confer a benefit (see Lim, 2012). However, we found a large effect indicating that the degree to which people increase their own regard for their benefactor (WTRself→other) explained gratitude, replicating the findings of Smith et al. (2017). However, our initial attempt to understand how social valuation relates to gratitude left our task of evaluating information-processing models of gratitude incomplete. By constraining the benefits that subjects received, we could not evaluate a model in which gratitude is explained by direct benefits. Also, by limiting the benefits that subjects received to a single value, which was rather high when considering the amount of money subjects handled in the experiment, we potentially caused little variability in gratitude. Without much variability in our target construct, we may have set too high a bar for our predictors to achieve. We conducted a second experiment to address these limitations.
Experiment 2
Method
Subjects
Subjects were 383 workers from Amazon’s Mechanical Turk (168 female; age: M = 32.67 years, SD = 10.79). Data from 70 subjects were removed because there were technical issues regarding certain features of the experiment. As in Experiment 1, subjects participated for the promise of $1.00 and an opportunity to earn additional bonuses based on their decisions during the experiment. In reality, all subjects received a random bonus between $2.50 and $2.75 (average = $2.62). We included restrictions to ensure that nobody who participated in Experiment 1 was able to participate in this experiment. As in Experiment 1, we removed suspicious subjects from analyses (n = 105), which resulted in a final sample of 208 subjects for analysis (86 female; age: M = 32.22 years, SD = 10.19). Analyses conducted with suspicious subjects are available at https://osf.io/a95kv/. None of our conclusions would have been changed by the inclusion of suspicious subjects.
Procedure
In Experiment 2, we used the exact design from Experiment 1. However, rather than receiving a fixed benefit of $0.93, subjects received a random benefit between $0.10 and $1.00. To be clear, the presentation of the decision maker’s decision was identical to that in Experiment 1—decision makers could deliver a benefit at a cost to themselves, receive a benefit at a cost to the recipient (the subject), or do nothing (see Fig. 1). The proportion of the effect on the decision maker (i.e., the revealed WTR of the act) was either .10 or .70 (rounded to the nearest hundredth) of the effect on the subject in order to keep our conditions relatively simple. For example, if the randomly generated benefit to the subject was $0.50, subjects who experienced a revealed WTR of 0.10 or more would see a decision maker decide between incurring a cost of $0.05 to benefit the subject $0.50, receiving a benefit of $0.05 while costing the subject $0.50, or doing nothing. However, subjects who experienced a revealed WTR of .70 or more in the same benefit condition would see the decision maker decide between incurring a cost of $0.35 to benefit the subject $0.50, receiving a benefit of $0.35 while costing the subject $0.50, or doing nothing.
These modifications allowed us to test the same models as those from Experiment 1. However, we were also able to test whether variation in direct benefits explained variation in gratitude (see Forster et al., 2017) and deconfound other models that could not be properly distinguished in Experiment 1.
Results
Bivariate correlations between all variables used to compute and predict other variables are displayed below the diagonal in Table 2. As in Experiment 1, we compared the explanatory power of the variables using standard null-hypothesis significance testing. All models are simple structural equation models, analyzed using Mplus (Version 7; Muthén & Muthén, 2012), in which our latent measure of gratitude was regressed on the predictors described in the models above. Table 3 summarizes the findings for each model. As in Experiment 1, only Models 9 and 10 were statistically significant at the predetermined threshold (α = .05).
As in Experiment 1, we found that both updated WTR (Model 9) and change in WTR (Model 10) were related to gratitude. Also as in Experiment 1, positive change in WTR appeared to be a stronger predictor of gratitude, explaining 4.2% of variance on its own, compared with the 2.6% of variance explained by updated WTR alone. Although the magnitudes of these effects were substantially larger in Experiment 1 than Experiment 2, the pattern is the same.
Again, using the same procedure to clarify which of these models was best, we reassessed Model 10 using prior WTR and updated WTR as separate predictors rather than the single change score. In doing so, we found that when we controlled for prior WTRself→other, updated WTRself→other was positively related to gratitude, b = 0.961, SE = 0.293, z = 3.284, p = .001, 95% CI = [0.386, 1.535]. Meanwhile, when we controlled for updated WTRself→other, prior WTRself→other was negatively related to gratitude, b = −0.687, SE = 0.299, z = −2.307, p = .021, 95% CI = [−1.273, −0.102]. The direction of these effects, respectively positive and negative, reflect a decomposition of our process with which we computed change scores: updated WTR – prior WTR. Modeling WTR change in this way improved our model fit, yielding explained variance of 5.3% and further corroborating that change in WTR yields the best interpretation of how gratitude operates, at least with respect to these models and data.
Discussion
In Experiment 2, we sought to replicate the findings in Experiment 1 and extend our analyses to include the effects of direct benefits, which enabled us to deconfound several predictors that were perfectly collinear, or nonexistent, in Experiment 1. As in Experiment 1, both updated WTRself→other (Model 9) and change in WTRself→other (Model 10) were viable predictors of gratitude. However, after reconceptualizing our model of change in WTRself→other as two components—prior WTR and updated WTR (from Model 9)—we established that change in WTRself→other was the best model for gratitude with these data.
We also sought to increase variability in self-reported gratitude, which exhibited something of a ceiling effect in Experiment 1. We attributed this ceiling effect in Experiment 1 to the fact that everyone received a large benefit relative to their endowment, which we sought to ameliorate by introducing a greater range of benefit values; however, the variability we introduced in the magnitude of benefit delivery did not reduce the apparent ceiling effect, representing further evidence that differences in raw benefit value hold a tenuous link, if any, to gratitude in these scenarios. Additionally, to ensure that our results were robust to issues possibly stemming from a ceiling effect, we reran all models in censored regressions (see supplemental materials: https://osf.io/a95kv/), which did not differ qualitatively from the analyses reported in the main text.
General Discussion
We conducted two experiments to test the effects of benefit delivery and social value on gratitude. In both experiments and across 10 models, our results favored a model in which gratitude is predicted by a positive change in recipients’ value toward their benefactors following an interaction (i.e., ΔWTRself→other), which replicates findings from Smith et al. (2017). In contrast, we found no compelling evidence to suggest that the costs or benefits associated with an act directly predicted gratitude, findings that run counter to prior research (e.g., DeSteno et al., 2010; Emmons & McCullough, 2003; Forster et al., 2017; Tesser et al., 1968; Yu et al., 2018). However, it should be noted that our design included costly benefit delivery in all cases, which we systematically varied. Thus, these null results do not imply that the presence of a cost or benefit is not an important prerequisite of gratitude, but rather that we found no evidence in our design that the magnitude of costs and benefits predicted the magnitude of gratitude felt.
The model for which we found evidence—in which gratitude is predicted by positive changes in a recipient’s value for a benefactor—also runs counter in some ways to the model put forth by Tooby and Cosmides (2008), which posits that gratitude occurs when a benefactor is perceived to value the recipient more than previously expected. However, across four alternative conceptualizations of perceived-social-value models (Models 5–8 in Table 1), we found no evidence in favor of the expectation-violation model. Nevertheless, our favored model is consistent with one aspect of Tooby and Cosmides’s model in that gratitude is related to an increase in value for benefactors. Whereas the Tooby and Cosmides model suggests that expectation violations lead to gratitude and increases in the recipient’s value for the benefactor (either in sequence or concurrently), our model is equally consistent with the reverse: that increases in the recipient’s value for the benefactor lead to gratitude. The direction of causality is a matter for future work, which can now benefit from the sequence of models tested here.
A first step toward understanding the causal direction between WTR change and gratitude would be to understand what social information causes either of these variables to change. In our investigation, the only predictor that was significantly correlated with ΔWTRself→other was net benefits to the recipient, benefitself – costother (WTRself→other)—Experiment 1: r = .303, p < .001; Experiment 2: r = .155, p < .05 (Table 2)—which may have been because both variables were computed using prior WTRself→other. Though we did not find a robust effect (p = .093) of net benefits directly predicting gratitude, as tested by Model 4 in Experiment 2, it remains plausible that net benefits cause changes in WTR, which in turn cause gratitude. Of course, changes in WTR may also be caused by variables we did not capture here, including any number of individual differences that relate to variability in WTRs.
Despite the challenges that lie ahead in uncovering a more detailed picture of the computational procedures that generate feelings of gratitude and regulate cooperative behavior, our investigation stands out as one of the few to examine how gratitude is impacted by costs, benefits, and social value when people receive a benefit in real time. Though we stand by our design for its unique ability to disentangle multiple models of gratitude, there is plenty of room for improvement for future research. First, we evaluated various models using only a few variables derived from people’s responses to receiving money. With respect to other relevant variables, we did not measure people’s feelings of indebtedness, which Peng et al. (2018) recently argued should be measured in any investigation of gratitude because such feelings may have unique effects on promoting reciprocity. With respect to using only money as a stimulus, which has the advantage of presenting an unambiguous value, monetary value also provides a very narrow window into all the ways people send and receive benefits; instead, researchers may consider manipulating time investments or subjective measures of value. Along these lines, researchers in future work should also consider a wider range of benefits than the low range we analyzed here ($0.01 to $1.00).
In addition to measuring additional variables and manipulating costs and benefits through different stimuli, this research program would also benefit from manipulating the social history between recipients and benefactors, which may be accomplished with a closeness-induction paradigm (Aron et al., 1997) and could produce more meaningful variability in people’s prior expectations. To further our understanding of how welfare valuations influence social interactions, researchers will need to develop methods for assessing uncertainty in these estimates and employ appropriate modeling tools for evaluating effects on uncertainty. Despite the general reliability of measures that assess WTRs (e.g., Delton, 2010), these tools provide an incomplete picture of the cognitive processes they are designed to evaluate. For instance, a stranger conferring a benefit might cause the recipient to raise their WTR for the stranger, but this one act will be associated with a large margin of error—that is, a large uncertainty in how that same stranger will regard the recipient in the future. Repeated interactions may tighten up the confidence window, and well-established relationships (e.g., kinship) may yield WTRs of the highest certainty (at any value along the WTR continuum).
Conclusions
Social emotions play a crucial role in driving our motivations to engage or avoid potential social partners (Keltner & Haidt, 1999; Sznycer et al., 2017; Tooby & Cosmides, 1990). By examining social emotions through the lens of social value, we were able to evaluate multiple models of gratitude, the emotion commonly experienced when we receive benefits and the emotion thought to facilitate long-term cooperative relationships. Moving forward, positing and adjudicating between alternate information-processing systems governing gratitude and other social emotions will help clarify how relationship building, maintenance, and decay play out in both short- and long-term relationships.
Footnotes
Transparency
Action Editor: Steven W. Gangestad
Editor: Patricia J. Bauer
Author Contributions
D. E. Forster and E. J. Pedersen contributed equally to this research. D. E. Forster, E. J. Pedersen, M. E. McCullough, and D. Lieberman conceived of the study. D. E. Forster and E. J. Pedersen managed data collection, analyzed the data, interpreted the results, and drafted the manuscript. M. E. McCullough and D. Lieberman revised the manuscript. All authors approved the final manuscript for submission.
