



Abstract
Visual illusions have been studied extensively, but their time course has not. Here we show, in a sample of more than 550 people, that unrestricted presentation times—as opposed to presentations lasting only a single second—weaken the Ebbinghaus illusion, strengthen lightness contrast with double increments, and do not alter lightness contrast with double decrements. When presentation time is unrestricted, these illusions are affected in the same way (decrease, increase, no change) by how long observers look at them. Our results imply that differences in illusion magnitude between individuals or groups are confounded with differences in inspection time, no matter whether stimuli are evaluated in matching, adjustment, or untimed comparison tasks. We offer an explanation for why these three illusions progress differently, and we spell out how our findings challenge theories of lightness, theories of global-local processing, and the interpretation of all research that has investigated visual illusions, or used them as tools, without considering inspection time.
Keywords
It takes a little bit of time to build up an image of what surrounds us—and a tad more to make sense of it (Hegdé, 2008; Ögmen & Breitmeyer, 2006; Piaget, 1969; van Zoest et al., 2010). In the interpretation of details, taking into account the rest of the scene tends to produce remarkable benefits but also minor inconveniences, such as visual illusions. These emerge very quickly—typically within a few tens of milliseconds—and some of them continue to develop over the next several hundred milliseconds, suggesting an increasingly sophisticated integration between the element that is being judged and its context (de Brouwer et al., 2014; Schmidt & Haberkamp, 2016; van Zoest & Hunt, 2011). Indeed, some size effects—such as the Ebbinghaus (Schmidt et al., 2016) and Delboeuf (Oyama & Morikawa, 1985) illusions—actually reverse when seen too briefly for contextual integration to take place.
Whereas appreciable attention has been paid to the microgenesis of visual illusions—that is, their progress on extremely short timescales—to our knowledge no studies have explored how illusions unfold over exposure times of several seconds (the only exception being Bressan & Kramer, 2013). Yet one may expect that longer inspection times influence the observer’s opportunity to attentionally discard, or disengage from, the task-irrelevant context that induces the illusion in the first place.
In the Ebbinghaus illusion, for example, a disk surrounded by small contextual disks looks larger than a physically identical disk surrounded by large ones (Fig. 1, left). To appreciate that the two central disks are actually the same size, one has to compare them directly and disregard the context. This should be easier to do when one inspects the figure at length rather than for less than a second or so (see also Hegdé, 2008), and the illusion does, in fact, diminish over the course of several seconds (Bressan & Kramer, 2013).
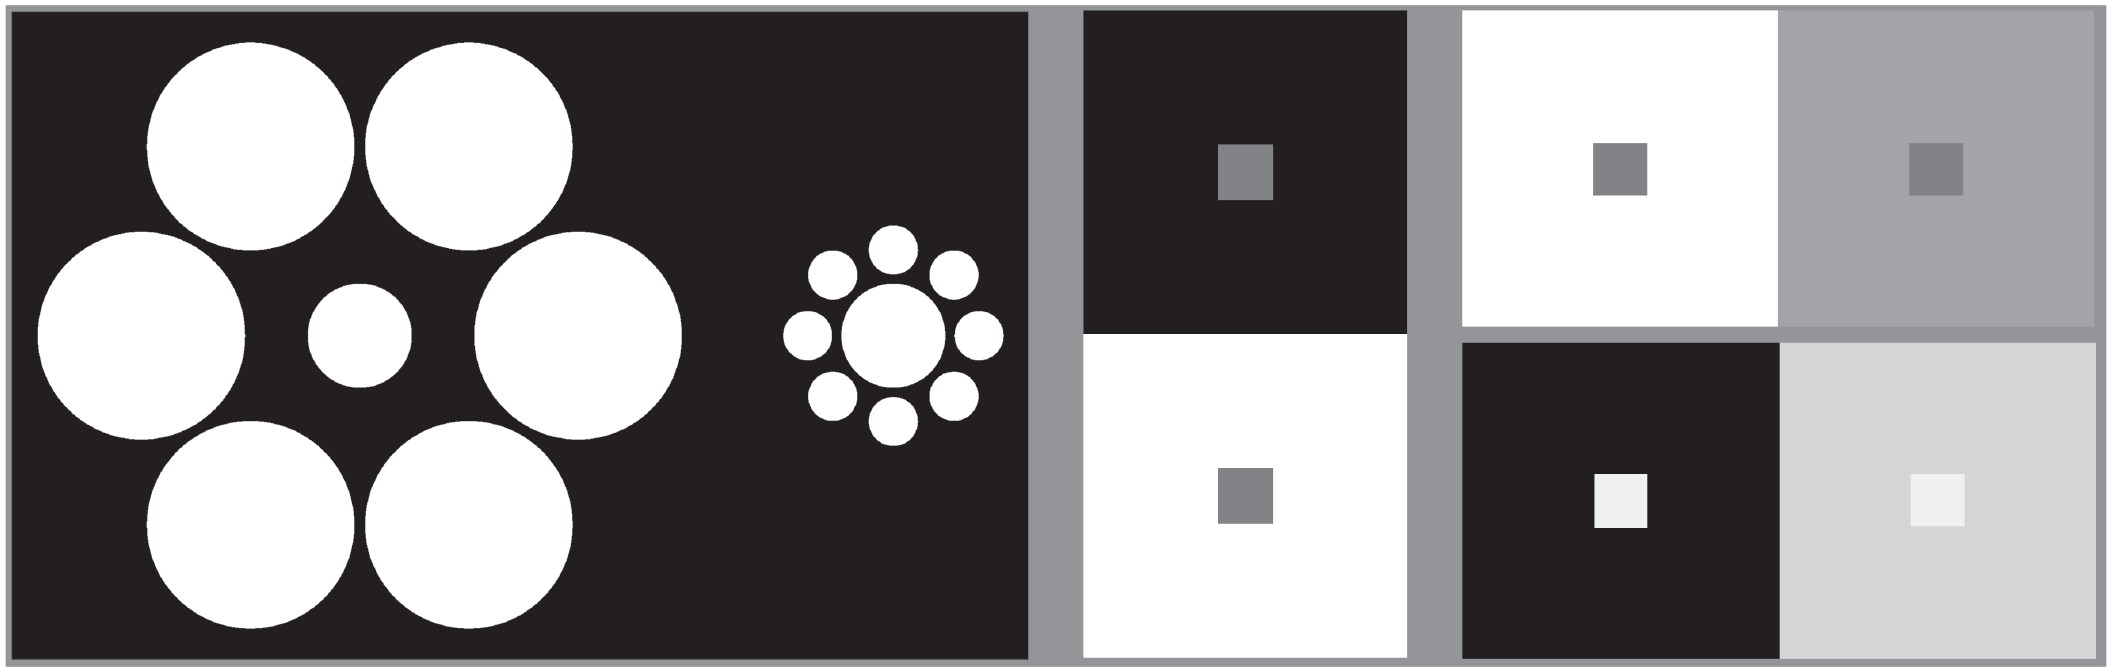
Four visual illusions. In the Ebbinghaus illusion (left), a central disk surrounded by large contextual disks looks smaller than a physically identical disk surrounded by small ones. In the lightness contrast illusion (middle), a small square on a black background looks lighter than a physically identical square on a white background. Two variations of the lightness contrast illusion are shown on the right. In the double-decrement contrast illusion (top row), the two identical small squares are both dimmer than their backgrounds (they are luminance decrements), but the square on a white background looks slightly darker than the square on a gray one. In the double-increment contrast illusion (bottom row), the two identical small squares are both brighter than their backgrounds (they are luminance increments), but the square on a black background looks slightly lighter than the square on a gray one.
Now consider classical lightness contrast (Fig. 1, middle). The Ebbinghaus illusion emerges after the other parts of the scene have been taken into account (Schmidt et al., 2016), but lightness contrast kicks in before it. Basic lightness contrast (e.g., a target on a plain background) peaks at the shortest possible duration, a flash of 10 ms, when only the luminance difference along the target’s edge has been processed. It then proceeds to fall rapidly over the next 150 ms or so—as cues from more distant edges, which help the viewer figure out what is going on, become available as well (Kaneko & Murakami, 2012; see also Kaneko et al., 2018; Robinson & de Sa, 2008). Once these first 150 ms are past, there is not much one can do to improve lightness “accuracy.” If the two central squares are small enough, simply focusing on them is not enough to insulate them from their surrounds: One cannot get truly away from the edges, and the edges are defined by the luminance contrast with the surrounds themselves. Hence, if context-dependent effects weaken with time because the context can be discounted better and better, we should not expect the same of illusions such as these. Things could indeed go the opposite way, because the longer one inspects the central squares, the longer one inevitably ends up looking at their edges, too.
The way illusions change over several seconds of inspection poses major challenges to existing theories. Perhaps less obviously, the time course of illusions carries methodological implications for studies that measure illusion strengths by having participants either adjust a stimulus feature until it matches another (Chouinard et al., 2016; Grzeczkowski et al., 2018; Ropar & Mitchell, 1999) or choose a match on a scale (Gilchrist et al., 1999). The same goes for research that compares illusions between people who differ in sex (Phillips et al., 2004), age (Doherty et al., 2010), culture (Caparos et al., 2012; Linnell et al., 2018), political attitude (Caparos et al., 2015), autistic tendencies (Chouinard et al., 2016; Walter et al., 2009), or mental health (Bölte et al., 2007; Happé, 1996; Hoy et al., 2004; Ropar & Mitchell, 1999; Silverstein et al., 2015; Tibber et al., 2013). From the susceptibility to illusions shown by individuals or groups, the researchers mentioned above (and many others besides) drew conclusions about processing styles or deficits. Yet all such studies had flexible inspection times and may thus have confounded an actual difference (or similarity) in illusion strength between participants with a systematic or unsystematic difference in the time these participants took to arrive at their judgment about the illusion.
Statement of Relevance
Our eyes deceive us. The moon looks bigger near the horizon than up in the sky and looks white up in the sky but dark gray under an astronaut’s boot. Such illusions not only help uncover how we perceive reality but also are used to investigate cognitive styles, mental disorders, and cultural differences. Certain illusions appear weaker to patients with schizophrenia, for example, or to remote tribespeople as opposed to urbanites. Here, we show for the first time that illusions can change in counterintuitive ways as we look at them longer: some decrease, some remain the same, and others increase. Differences in how individuals perceive illusions are typically attributed to inequalities in their mental processes or capacity. Yet we demonstrate that these differences may, instead, simply be due to differences in the time taken to inspect the illusions—which does happen to vary, randomly or systematically, across individuals and groups. Thus, some well-established disparities in how people see illusions (and the world more broadly) may themselves be illusory.
As a case in point, Bressan and Kramer (2013) previously reported that the Ebbinghaus illusion diminishes with a particular aspect of schizotypal tendency. Their analysis, however, also revealed that the effect was entirely mediated by judgment time: The stronger their schizotypal tendency, the longer participants took to adjust one central disk until it matched the other—and it was this longer time that weakened the illusion, not the schizotypal tendency itself.
In that study, inspection time coincided with the time participants took to adjust one of the central disks by dragging a cursor along a slide. It is thus possible that the observed effects of time were in fact driven, or heavily influenced, by the fine motor control needed to perform the adjustment task. Here, we simplify the participants’ critical response to one of the easiest possible: pressing a space bar. To make our case, we compare the Ebbinghaus illusion, which we expect to diminish with inspection time, with lightness contrast, which we expect to remain the same or even strengthen. We do not use the classical lightness contrast illusion depicted in the middle of Figure 1 because this is actually a combination of two effects, which we investigate separately: a strong lightening of the square sitting on black and a slight darkening of the square sitting on white (Bressan, 2006; Gilchrist, 2006). These two effects are not symmetrical; indeed, as we will see, how either varies with inspection time has significant implications for theories of lightness.
Method
Participants
To provide robust power and reproducibility, we ran two independent studies and enrolled as many participants as feasible—in light of the constraint that they were all unpaid volunteers, separately recruited and tested individually in the same laboratory. Most were university students of various scientific disciplines. Data were collected over 6 years (Study 1: 2014–2015; Study 2: 2016–2019) by experimenters blind to the study hypotheses. A total of 263 adults (138 women and 125 men; median and mean age = 22 years, range = 18–30) participated in Study 1, and a total of 290 adults (195 women and 95 men; median and mean age = 23 years, range = 19–62) participated in Study 2. Each sample therefore included more than twice the number of participants used in Bressan and Kramer’s (2013) study. The experimental procedures were approved by the University of Padova’s Psychological Research Ethics Committee and were in accordance with the Declaration of Helsinki (seventh revision). All participants gave written informed consent.
Apparatus and stimuli
In both studies, stimuli were presented in a dark or dimly lit laboratory on a calibrated Perfect Color 22 CRT monitor (manufactured by Quato) with a 22-in. screen shielded by a custom black hood. We used a pairwise-comparison paradigm with a fixed stimulus and a variable one with four possible values. In the two studies, we presented slightly different values at the ends of each spectrum so as to expand the overall stimulus range and increase measurement sensitivity.
The stimuli for the Ebbinghaus illusion (Fig. 1, left) were two white target disks centered on adjacent black squares (15.5 × 15.5 cm). One target was surrounded by large disks (diameter: 50 mm in Study 1 and 45 mm in Study 2) and the other by small ones (diameter: 12 mm in Study 1 and 10 mm in Study 2). The size of the target surrounded by large disks was fixed (diameter: 25 mm). The diameter of the other target—which tends to look larger—varied and was 21, 22, 23, or 24 mm in Study 1 and 20, 21, 22, or 23 mm in Study 2. The position (left vs. right) of the variable half of the stimulus was counterbalanced within and between participants.
The stimuli for the lightness illusions (Fig. 1, right) were two small target squares (both 6.4 × 6.4 cm) centered on two large background squares (both 16 × 16 cm) sitting side by side and surrounded by a dark frame (gray-scale value = 55). In the case of double decrements, the backgrounds were white (gray scale = 255) and medium gray (gray scale = 153). The gray-scale value of the target on gray was fixed (gray scale = 102). The gray-scale value of the target on white—which tends to look darker—varied and was 117, 122, 125, or 127 in Study 1 and 123, 125, 127, or 129 in Study 2. In the case of double increments, the backgrounds were black (gray scale = 0) and light gray (gray scale = 200 in Study 1 and gray scale = 180 in Study 2). The gray-scale value of the target on gray was fixed (gray scale = 222). The gray-scale value of the target on black—which tends to look lighter—varied and was 205, 208, 211, or 214 in Study 1 and 211, 213, 215, or 217 in Study 2. The position (left vs. right) of the variable half of the stimulus was counterbalanced within and between participants.
Procedure
Data were collected as part of two larger studies, but the experiment reported here was always presented first. Each illusion (double increment, double decrement, and Ebbinghaus, in that order) was shown in two blocks of four trials each, for a total of eight trials per illusion and 24 trials overall. Presentation time was a single second in one block and unlimited (allowing “ad-libitum” inspection) in the other, and the order of the two blocks was counterbalanced across participants. In both the 1-s and ad-libitum conditions, the participants were to press a key if they perceived the target on the left (“Z” key) or the right (“M” key) to be lighter in the double-increment illusion, darker in the double-decrement illusion, or larger in the Ebbinghaus illusion. At the start of each block (1 s or ad libitum), participants were presented with the general instructions for that block and pressed the space bar to begin. Before each stimulus, they were shown a 2,500-ms reminder about whether they had 1 s or unlimited inspection time.
In the 1-s block, the stimulus disappearance was followed by the instruction to press either the left or the right key. In the ad-libitum block, participants were asked to hit the space bar as soon as they had decided which target was lighter, or darker, or larger. There was no time pressure. After hitting the space bar, participants were shown the instruction to press either the left or the right key.
Results
Illusion-consistent responses were assigned a score of 1; illusion-inconsistent ones were assigned a score of 0. Mean illusion strength within a block was obtained by averaging across its four trials. For each participant and ad-libitum block, we also calculated the median inspection time—that is, the time participants took to make their decision (which disk was larger or which square was lighter or darker) and press the space bar. On average, the Ebbinghaus illusion was inspected for 5.5 s (SD = 4.5 s), the double-increment illusion for 7.7 s (SD = 5.1 s), and the double-decrement illusion for 5.8 s (SD = 3.8). Anticipations (responses faster than 200 ms) were excluded from analysis, but results were virtually the same if these were included.
Three repeated measures analyses of variance were carried out on illusion strengths, each with a within-participants factor of presentation time (1 s vs. unlimited) and a between-participants factor of study (Study 1 vs. Study 2). In the 1-s condition, the Ebbinghaus illusion was larger, F(1, 550) = 53.15, p < .0001, η p 2 = .09; the double-increment contrast illusion smaller, F(1, 550) = 24.83, p < .0001, η p 2 = .04; and the double-decrement contrast illusion neither larger nor smaller, F(1, 550) = 2.40, p = .122, η p 2 = .004. Corresponding mean illusion strengths are represented in Figure 2. None of these effects interacted significantly with study. (Here, main effects of study are irrelevant and we do not report them. The complete set of results is provided in the analysis outputs; see our OSF project at https://osf.io/4ucrd.)
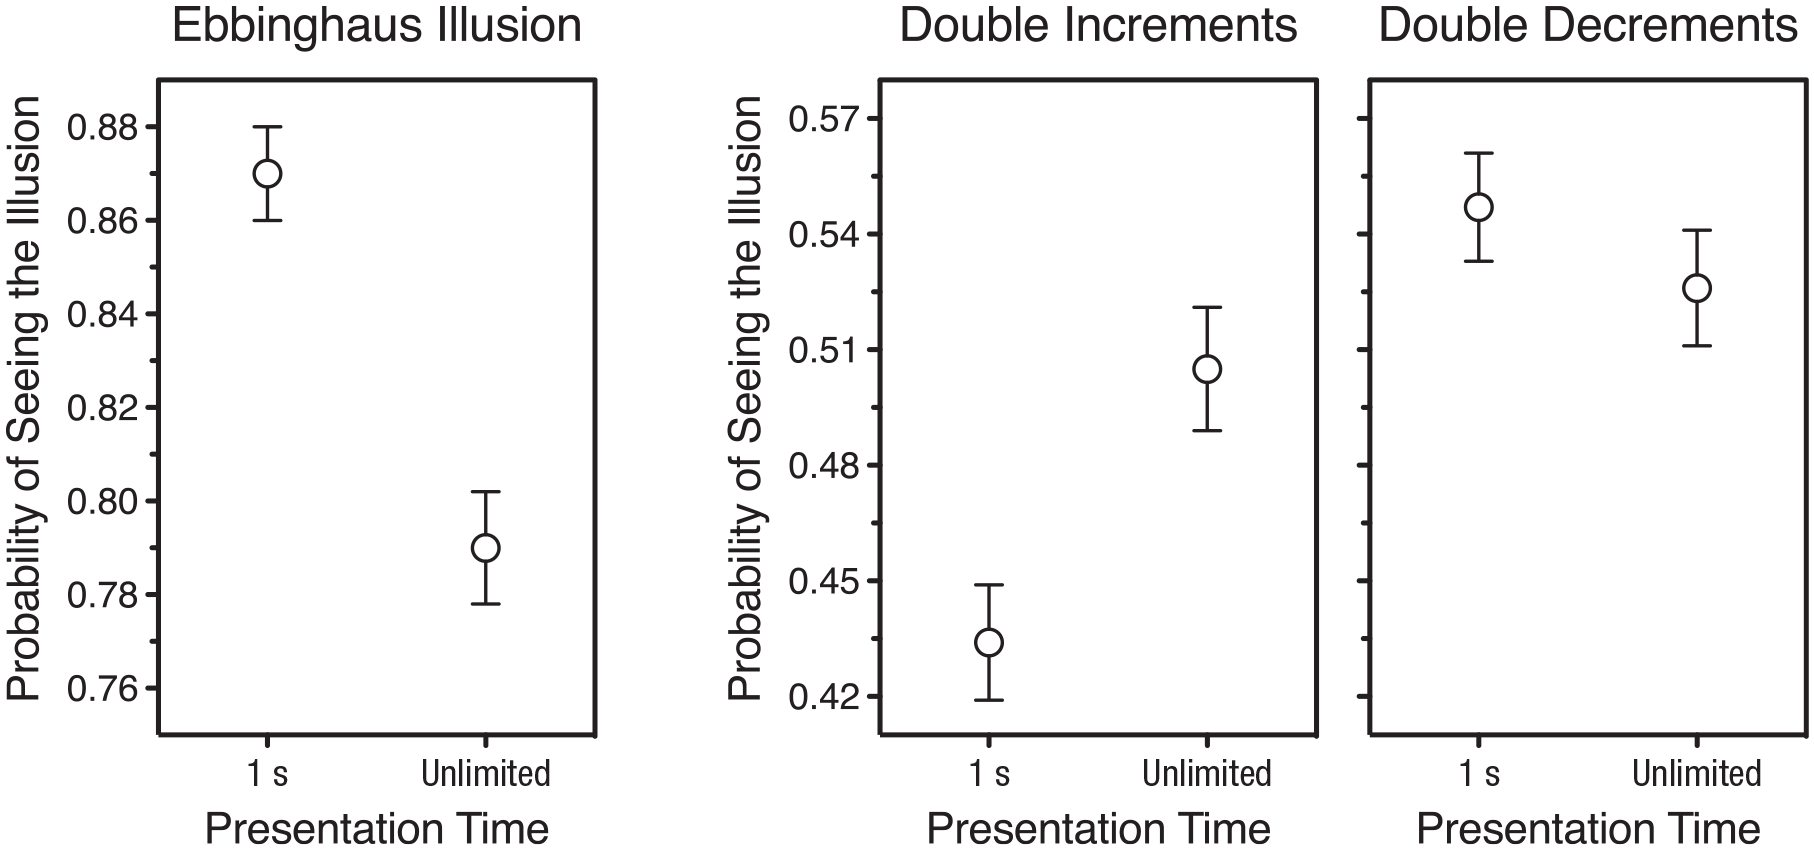
Mean probability of seeing each of the three illusions as a function of presentation time (1 s vs. unlimited). Error bars indicate standard errors.
Mirroring these results, Spearman’s correlations showed that, in the ad-libitum condition, the Ebbinghaus illusion decreased with inspection time, rS = −.45, N = 552, p < .0001; the double-increment illusion increased, rS = .15, N = 550, p = .0003; and the double-decrement illusion neither increased nor decreased, rS = .01, N = 550, p = .749. These results remained virtually unchanged after we removed potential outliers (i.e., inspection times that deviated more than 3 SD from the mean). Note that these findings imply that the classical lightness contrast illusion—which relies almost entirely on the perceptual lightening of the incremental target (Gilchrist, 2006)—would increase with observation time.
Parametric analyses showed that the best-fitting curve for the decrease in the Ebbinghaus illusion with inspection time was linear, r = .38, F(1, 550) = 90.92, p < .0001, though a logarithmic fit was equally good. This result means that the Ebbinghaus illusion continued to diminish with spontaneous inspection time and never reached a plateau (Fig. 3). The best-fitting curve for the time course of the double-increment contrast illusion was nonlinear: Illusion strength varied with the reciprocal of inspection time, r = .22, F(1, 548) = 27.68, p < .0001 (outlier exclusion had virtually no effect). That is, the double-increment illusion rose steeply with time at first and then flattened out, approaching an asymptote (Fig. 4, left). As for the double-decrement contrast illusion, no curve significantly fitted its practically nil progression with inspection time (Fig. 4, right). Note that, for both lightness illusions, the mean inspection time of the fastest participants (first bin) was longer in the ad-libitum condition than in the 1-s condition (double increments: 1,353 ms, SD = 242 ms; double decrements: 1,151 ms, SD = 232 ms); but for the Ebbinghaus illusion it was shorter (971 ms, SD = 151 ms), which is why, in Figure 3, the corresponding symbol is plotted in gray.
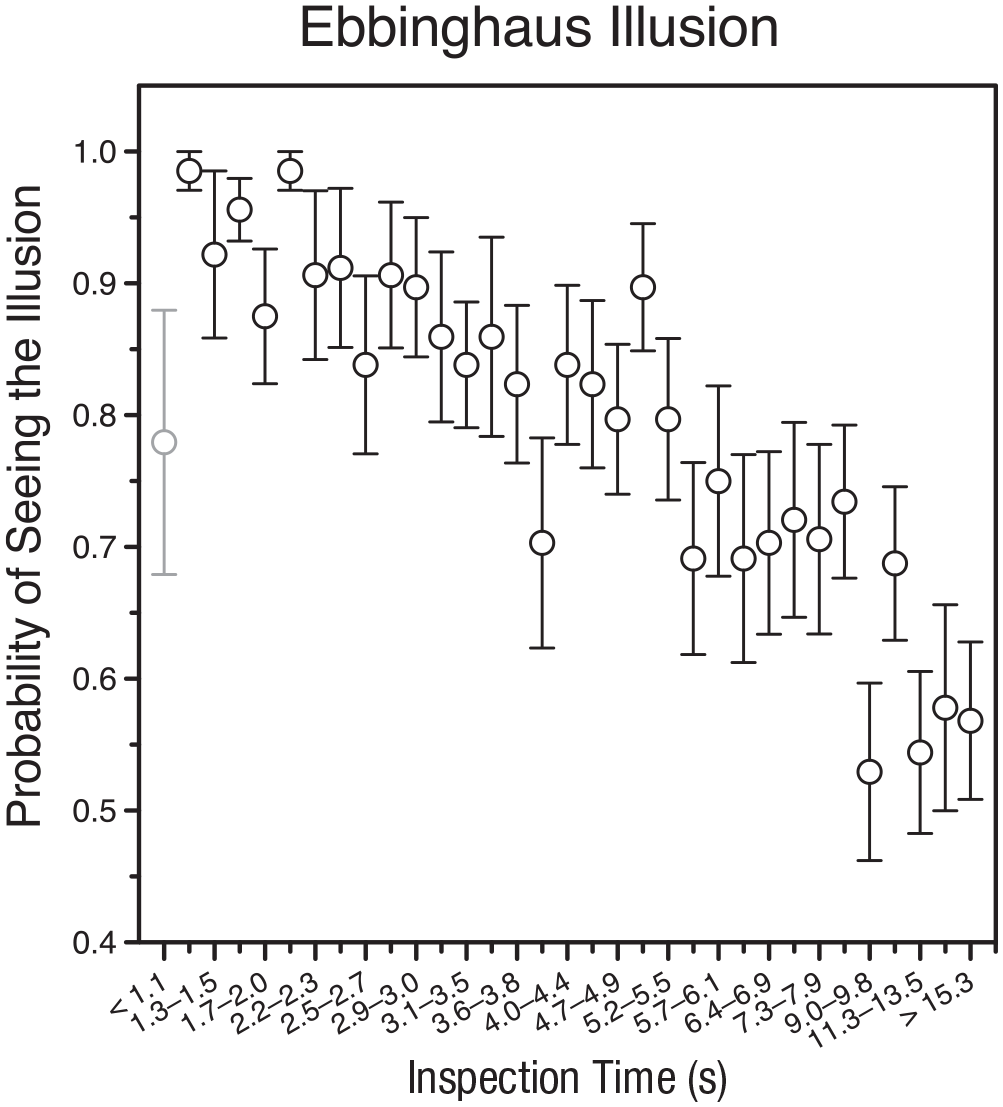
Mean probability of seeing the Ebbinghaus illusion as a function of spontaneous inspection time in the ad-libitum condition. Individual inspection times are grouped into 3% bins (16–17 participants per bin, except for the last bin of 22 participants). Error bars indicate standard errors. The mean inspection time of the 17 participants in the first bin is plotted in gray to indicate that it was shorter than in the 1-s condition.
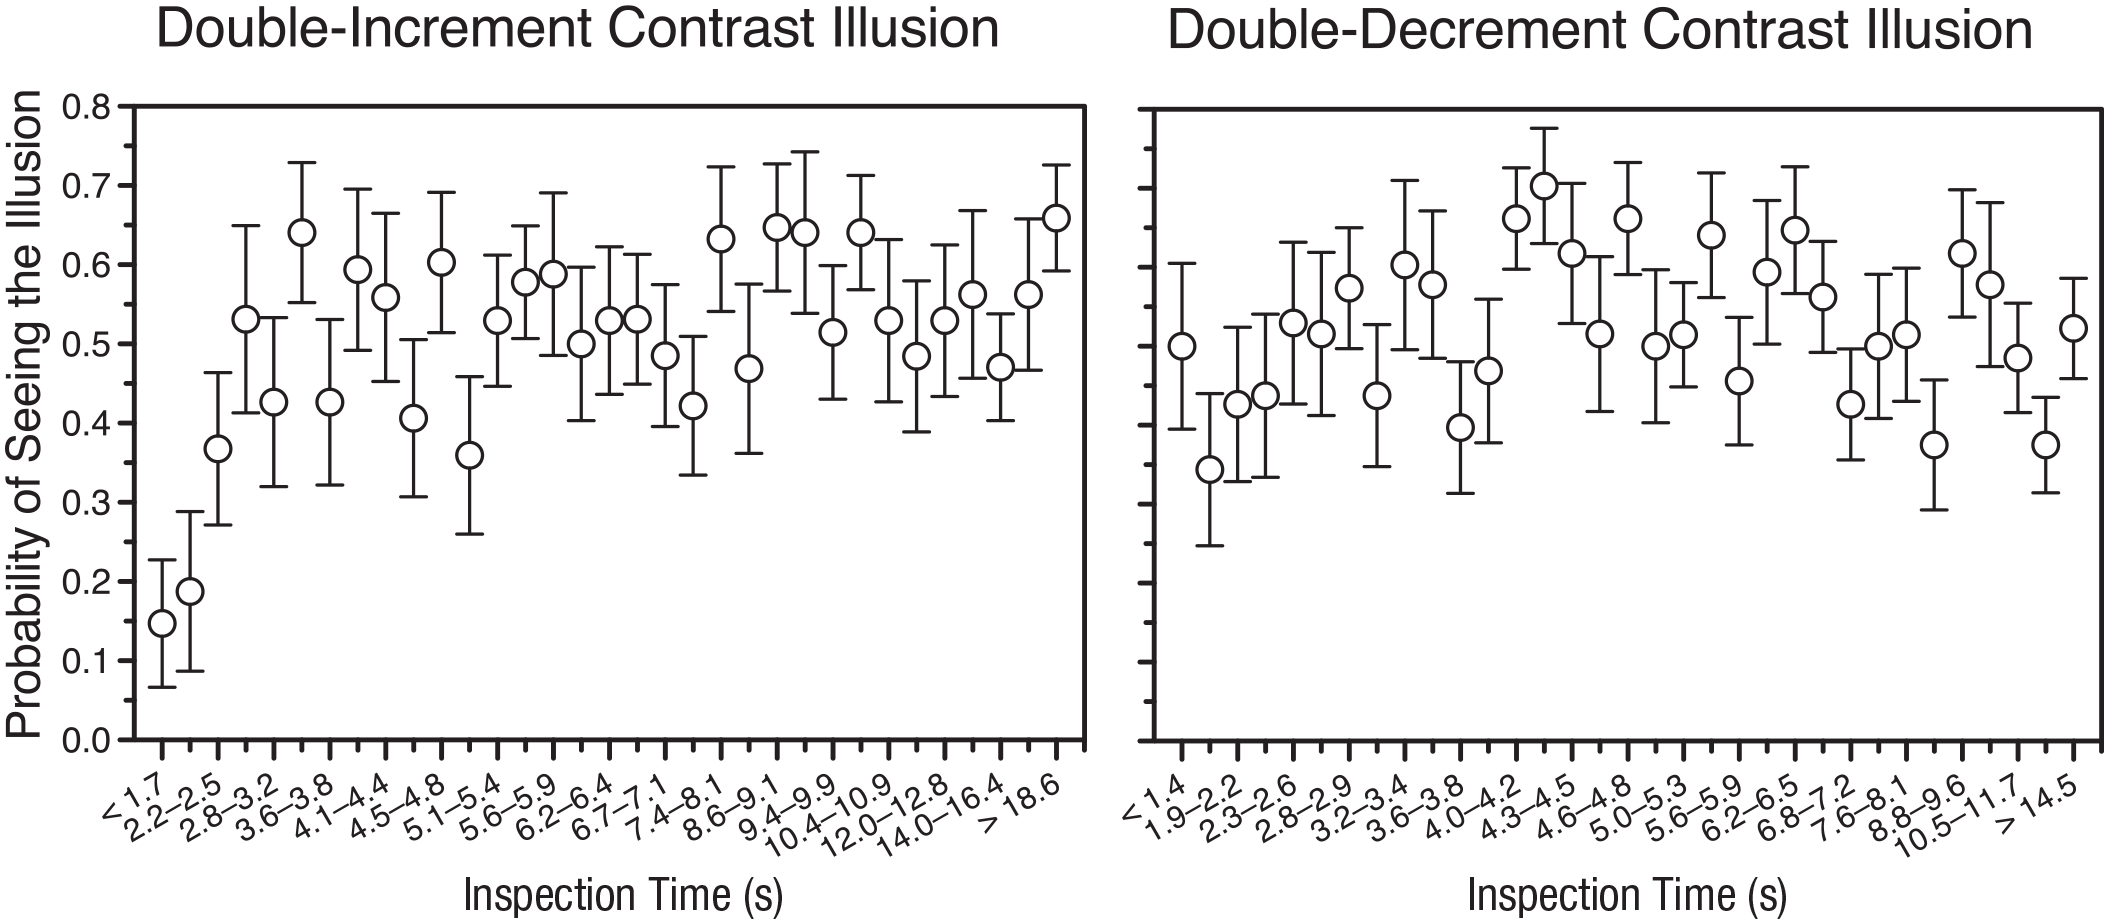
Mean probability of seeing the double-increment (left) and double-decrement (right) lightness contrast illusions as a function of spontaneous inspection time in the ad-libitum condition. Individual inspection times are grouped into 3% bins (16–17 participants per bin, except for the last bin of 22 participants). Error bars indicate standard errors.
Discussion
The Ebbinghaus, double-increment, and double-decrement illusions respectively weakened with inspection time, strengthened with inspection time, and remained unaffected by inspection time—whether this was constrained as opposed to unconstrained (1 s vs. unlimited) or voluntarily chosen (ad libitum). These findings have several general methodological and theoretical implications, which we illustrate here with two notable examples. The first is a reinterpretation of the role of cultural differences in global-local processing and lightness perception, the second a better informed look at lightness-perception theories.
Methodological implications: mix-ups in global-local processing
A series of well-cited studies investigated global versus local processing of visual stimuli and compared seminomadic Himba tribesmen from Namibia with British undergraduates (and other urbanites; see Caparos et al., 2020). The Ebbinghaus illusion was smaller (Caparos et al., 2012) and classical lightness contrast larger (Linnell et al., 2018) among the Himba than among the British. These effects were attributed to a stronger local (as opposed to global) bias among the former than the latter, ascribed in turn to their traditional rather than urban lifestyle. The implication that urban experience may influence visual illusions is remarkable, particularly as regards something so very basic as lightness contrast.
Yet because inspection time in these studies was neither controlled nor considered, a less provocative interpretation presents itself. Traditional Himba are so removed from the modern world that they even lack names for geometric shapes such as circles and squares (Davidoff et al., 2008). Understandably, they are also quite unaccustomed to being asked to perform exotic cognitive tasks in exchange for sugar and flour. It thus seems likely that they would find participating in such experiments more interesting than do British university students. One way in which greater engagement can express itself is more time spent on the task (Huang et al., 2012; Wise & Kong, 2005). In reaction time experiments, in fact, the Himba proved significantly slower and less distractible than British undergraduates (de Fockert et al., 2011; Linnell et al., 2013). Hence, it is perfectly possible that the Himba might also have taken longer than the British to inspect the illusions. Our own findings suggest that this would lead precisely to a weaker Ebbinghaus illusion and a stronger lightness contrast.
Three separate findings suggest that the unusual performance of the Himba may indeed be driven not by some “local bias” rooted in their intimate relationship with nature but, more simply, by their greater attentional engagement. First, the Himba matched constellations of squares and crosses (after Navon, 1977) more by their local elements than by their global shapes; but such “local” choices turned out to be uncorrelated with the allegedly “local” choices they had previously made with the Ebbinghaus illusion (Caparos et al., 2012), calling into question whether these two sets of responses truly have the same cause. Second, when explicitly asked to identify either the local elements or the global shape of such constellations, the Himba outperformed British psychology students in both tasks (Caparos et al., 2013). Third, in reaction time experiments that required attending to a target and ignoring distractors (Linnell et al., 2013), the Himba outperformed the British when the task was relatively boring to students (determining whether an arrow points left or right) but not when it was “engaging or interesting” (p. 1245) to the Himba and British both (determining whether a face is Black or White).
In our present study, as well as in most of the Himba studies, optimal performance requires disregarding context, which takes effort. One can expend this effort by looking at the stimulus for longer or by concentrating on it harder. Thus, we predict that participants’ motivation to respond carefully (their response effort; Huang et al., 2012) will change visual illusions in much the same way as does spontaneous inspection time, even when such time is held constant. This implies that the strategy of matching subgroups of Himba and urbanites by their response times (as has been done, for example, to allay concerns of speed/accuracy trade-offs in reaction time experiments; de Fockert et al., 2011; Linnell et al., 2013) is inadequate for dismissing engagement as an explanation. And of course, whereas the idea that urbanization could affect visual illusions is very provocative, the idea that urbanization could affect engagement and engagement affect visual illusions is rather less so—especially if “urbanization” turned out to simply reflect a different attitude of urbanized and nonurbanized people toward experiments.
Theoretical implications: the timeline of grays
Our finding that lightness contrast depends on inspection time for increments but not for decrements has important repercussions for theories of lightness. As far as we can tell, none of them is capable of accommodating this finding except the double-anchoring theory (Bressan, 2006, 2007).
The primary problem in lightness perception is that we cannot “see” the percentage of light a region reflects (its reflectance or gray shade) but only the amount of light it reflects (its luminance), which depends on both reflectance and illumination. To tell them apart, we must rely on a regularity of nature: Light sources tend to illuminate not only the region of interest but also nearby ones. Thus, taking into account the target’s luminance relative to that of its neighbors helps discount the illumination they share. Double-anchoring theory proposes a mechanism to determine which regions are likely to be sitting under a common illumination. Within this shared-illumination framework, the target’s luminance is anchored twice: once to the other regions (the target’s surround) and once to the highest luminance. The target:surround and target:highest-luminance ratios are then averaged. Note that both anchors are defined as white (though neither necessarily appears white in the end). Thus, anchoring establishes not only the target’s relative luminance but also its specific lightness—which in the model can range from black to luminous superwhite. (For a discussion of highest-luminance anchoring by itself, see also Gilchrist et al., 1999; Wallach, 1948.)
Surround anchoring is weighted relative to highest-luminance anchoring to express the surround’s importance: how much information about the illuminant it is likely to be supplying and how reliable this information is. For example, a larger and more irregular surround tends to provide more information than a small, uniform one. And a bright surround (which is likely to be getting plenty of light) tends to provide more detailed, better-quality information than one that is dim (and likely to be poorly lit). In the exact same vein, a surround that is inspected for longer tends to provide more accurate and reliable information than one that is seen only very briefly.
In the model, decremental and incremental lightness contrasts are rather different. The double-decrement illusion (Fig. 1, top right) is brought about in full by either anchoring. Surround anchoring computes the target as darker when it sits on white rather than on gray, because the target:surround luminance ratio is lower. Highest-luminance anchoring does that too, because—for decremental targets—the local highest luminance is the surround itself. When the relative weight of surround anchoring increases, therefore, the double-decrement illusion is expected to neither increase nor decrease. Instead, the double-increment illusion (Fig. 1, bottom right) is entirely due to surround anchoring: The target is computed as lighter when it sits on black rather than on gray, because the target:surround luminance ratio is higher. Highest-luminance anchoring produces no illusion, because both targets are the local highest luminances and thus defined as white. When the relative weight of surround anchoring increases, therefore, the double-increment illusion is expected to increase as well.
Both predictions are corroborated by evidence that whatever one does to augment the weight of the surround (e.g., enlarge it or make it less homogeneous; Bressan & Actis-Grosso, 2006; Schirillo & Shevell, 1996) increases contrast illusions with increments but has no effect on those with decrements. Exactly the same is expected to happen if the illusion-inducing surround acquires more weight by being looked at for longer than a glimpse.
Thus, double-anchoring theory accounts effortlessly for two counterintuitive findings. First, a longer inspection time—which is bound to increase the visual information available for processing, at least over the first few seconds—can make lightness perception less rather than more veridical. Second, this general effect entirely depends on whether the object whose color is being assessed is brighter or dimmer than its surroundings.
Conclusion
Much research relies on visual illusions to either build theories of them or explore differences in people’s perceptual or cognitive styles. Here, we have shown that the experience of visual illusions depends on how long they are looked at—in ways that are specific to each illusion and can be highly counterintuitive. Theories that cannot account for this fact are incomplete; studies that ignore it, confounded.
Footnotes
Acknowledgements
This work was carried out within the scope of the project “Use-Inspired Basic Research,” for which the Department of General Psychology of the University of Padova has been recognized as a “Dipartimento di Eccellenza” by the Italian Ministry of University and Research. We are grateful to Massimiliano Martinelli and Luca Semenzato for programming the experiments. Data were collected by Emanuela D’Agostino and Valentina Vellani (Study 1) and by Lucia Tagliente, Tommaso Querci, Cecilia Marchetti, and Giulia Martorana (Study 2).
Transparency
Action Editor: Marc J. Buehner
Editor: Patricia J. Bauer
Author Contributions
P. Bressan supervised the project, analyzed the data, produced the materials for open access, prepared the figures, and laid out the implications for lightness theories. P. Kramer explored the literature and conceived the experiment with the Ebbinghaus illusion. The authors wrote the manuscript together; both approved the final manuscript for submission.
