
Abstract
People often rely on scientific findings to help them make decisions—however, failing to report effect magnitudes might lead to a potential bias in assuming findings are practically significant. Across two online studies (Prolific; N = 800), we measured U.S. adults’ endorsements of expensive interventions described in media reports that led to effects that were small, large, or of unreported magnitude between groups. Participants who viewed interventions with unreported effect magnitudes were more likely to endorse interventions compared with those who viewed interventions with small effects and were just as likely to endorse interventions as those who viewed interventions with large effects, suggesting a practical significance bias. When effect magnitudes were reported, participants on average adjusted their evaluations accordingly. However, some individuals, such as those with low numeracy skills, were more likely than others to act on small effects, even when explicitly prompted to first consider the meaningfulness of the effect.
Keywords
Consider a typical media headline such as “Drinking Green Tea Regularly Increases Longevity.” People often rely on scientific claims to help them choose whether to consume or avoid specific foods, engage in risky behaviors, take medications or supplements, vote for public policies, and make other everyday decisions (e.g., Bromme & Goldman, 2014; Hendriks et al., 2020; National Science Board, 2018). However, laypeople are susceptible to making evidence-evaluation errors, such as drawing causal conclusions from correlational data (e.g., Adams et al., 2017; Rodriguez et al., 2016; Seifert et al., 2022; Shah et al., 2017) or ignoring selection bias in an experimental study (e.g., Burrage, 2008; Klaczynski, 2000). Here we document an underexplored evidence-evaluation error in which people show a practical significance bias: a tendency to believe that the magnitude of a scientific finding is practically meaningful, even when effects are described only in general terms (e.g., “Group A improved more than Group B”). For instance, do people assume the claim that drinking green tea increases longevity means that green tea consumption increases one’s life span by several years rather than a single year on average (Wang et al., 2020)?
There are theoretical reasons why laypeople may simply assume that general descriptions of effect size reflect meaningfully large effects in scientific-communication contexts. According to Grice’s (1975) cooperative principle of communication, individuals assume that messages will be maximally informative, which may cause laypeople to infer that scientific findings described in general terms are practically meaningful. People also rely on context variables, such as prior knowledge about typical quantities of objects in specific situations, to help them interpret vague quantifiers, such as “few” or “many” (Coventry et al., 2010; Moll et al., 2021); thus, if laypeople have prior expectations that scientific findings will generally be of high practical significance, they might overinterpret the meaning of quantifiers such as “greater” or “more.” Generic language in scientific communication can also lead to overgeneralizations about the reliability and importance of findings (e.g., DeJesus et al., 2019). Finally, because people tend not to seek out disconfirming evidence (e.g., Wason, 1960), laypeople may not think to question the practical importance of plausible scientific findings described in general terms.
The focus of our work is on how laypeople reason about the magnitude of an effect rather than standardized effect size, which provides information about both the magnitude and the precision of an effect (Baguley, 2009; Kirk, 1996; Thompson, 2002). Standardized effect size and effect magnitude often go hand in hand; sometimes, however, effect magnitude can be small, yet the standardized effect size can still be large due to small variance. For example, Funder and Ozer (2019) described a hypothetical relationship between years of education and income in which the fit of the regression is high (i.e., small variance) but the regression coefficient is small (e.g., each year of education leads only to a $1 increase in income). We thus define practical significance here as an absolute mean difference that reflects a meaningful change within a specific context, emphasizing the effect magnitude rather than variance. Although knowing the variance of an effect can help individuals determine how likely they are to be impacted by an intervention, it is also critical to consider the magnitude of an expected effect to determine whether an intervention is worth adopting in the first place; an intervention that has a good chance of producing a benefit may not be worth adopting if the size of the expected benefit is trivial. This is particularly true when an intervention is associated with added costs, time, or effort.
Little is known about how laypeople reason about the practical significance of scientific findings, although related work has investigated how laypeople reason about standardized effect size (e.g., Brooks et al., 2014; Hanel & Mehler, 2019; Kale et al., 2021; Kim et al., 2022). Generally, laypeople struggle to interpret standardized effect size information, either because they are unfamiliar with effect size terms (Hanel & Mehler, 2019) or because they underemphasize the role of variance and uncertainty in effect size (e.g., Brooks et al., 2014) and/or overemphasize mean difference information, particularly in visualized formats (e.g., Hofman et al., 2020; Kale et al., 2021; Kim et al., 2022).
Here we investigated whether laypeople are influenced by, or even consider, effect magnitudes when making everyday decisions about studies reported in the media. Despite evidence that having numerical information can improve the quality of people’s decisions (e.g., Peters et al., 2014), it is unlikely that people encounter effect magnitudes when reading media reports about studies, possibly because press releases and journalists exclude statistical details to improve readability for lay audiences (e.g., DeJesus et al., 2019). Thus, we explored an important potential consequence of excluding effect magnitude information in scientific reports: When scientific findings are described only in general terms, do people show a practical significance bias and assume that effects are meaningfully large?
Statement of Relevance
People often make everyday decisions on the basis of scientific findings they read about in the media. However, people might assume that scientific findings are more impactful than they truly are. Our research shows that when numerical information about the magnitude of a finding is absent, people assume that a finding is meaningfully large—what scientists refer to as “practically significant.” If people erroneously assume that scientific findings are practically significant, they may adopt ineffective health, dietary, and other lifestyle interventions on the basis of limited information. In contrast, transparently reporting the magnitude of findings can help people make better informed everyday decisions. Moreover, our finding that individuals with low numeracy skills were more likely to act on trivial findings highlights the importance of making numerical findings more concrete in scientific reports. Students may also benefit from explicit instruction on interpreting the practical significance of scientific findings to improve their evidence-based decision-making skills.
The current study also focused on several secondary questions related to how people reason about and use practical significance information. First, we asked whether people would be sensitive to small versus large expected benefits of an intervention and whether people would use that numerical information appropriately when deciding whether to adopt costly interventions. Second, we tested whether drawing people’s attention to small effects (findings of low practical significance) would lead to better quality decisions. In a previous study, college students rarely spontaneously noticed when a journalist made a sweeping claim based on a finding with trivially small effects (Burrage, 2008). Thus, if laypeople fail to identify trivial effects because of insufficient attention to numerical information, they might be less likely to endorse findings of low practical significance if they are first explicitly prompted to consider the meaningfulness of the effect. Third, we investigated the extent to which people differ in their perceived practical significance of empirical results. Given that individuals with low numeracy skills tend to process numerical information more superficially and less precisely and extract less meaning overall from numbers compared with individuals with high numeracy skills (e.g., Lipkus & Peters, 2009; Peters, 2020), we expected that effect magnitude perceptions (and decisions) might also be related to general numeracy ability.
Studies 1 and 2
Across two studies, we investigated whether decisions to recommend a new math curriculum to a school district (Study 1) and to purchase a new energy bar that offered mental-alertness benefits (Study 2) would be influenced by how an improvement resulting from the intervention (new math curriculum/new energy bar) was described: as a numerically small effect, a numerically large effect, or in general terms (e.g., “better performance”). In addition, we tested whether prompting some participants to first consider the meaningfulness of the small effect would influence their recommendation decisions. Because we wanted participants to seriously consider the practical significance of the findings and to avoid “why not?” reasons for decisions, there was a significant monetary cost associated with each intervention.
We conducted Study 2 to replicate our findings from Study 1 in the context of a more personally relevant decision to gather additional information about what amount of improvement participants consider meaningful versus not meaningful and to allow participants in the general-terms condition to guess how much of an improvement resulted from the intervention to confirm that they assume effects are numerically large.
Open Practices Statement
All hypotheses, sample size, and data analysis plans for both studies were preregistered, and raw data files for each study can be found on the OSF at https://osf.io/4927f/.
Method
Participants
In Study 1, 400 online participants were recruited from Prolific to participate in the study (174 females; mean age = 37 years). Two submissions were excluded because they came from the same individual, leaving 398 total. In Study 2, 400 online participants were recruited from Prolific (194 females; mean age = 37 years). Participants from both studies were selected from a participant pool consisting of fluent 18- to 80-year-old English speakers living in the United States. Participants were told that they would read an article (about an education research study in Study 1 and health and wellness study in Study 2) and answer some questions about it, followed by a brief numeracy test. Participants were paid $12/hr. All participants gave their informed consent to participate, and the study was approved by the University of Michigan’s Institutional Review Board.
On the basis of pilot data, we expected a small to medium effect of the meaningfulness prompt on decisions (Cohen’s d = 0.4). On the basis of a power analysis for a two-sample t test with d = 0.4, α = .05, and power = .8, we would need 94 participants per condition, which we rounded up to 100 per condition. Because there were four conditions, we collected data from 400 participants for each study.
Procedure
Participants were directed to a Qualtrics survey, where they were randomly assigned to four conditions: small effect with prompt (Study 1 N = 100; Study 2 N = 101), small effect no prompt (Study 1 N = 100; Study 2 N = 100), large effect (Study 1 N = 101; Study 2 N = 99), and no effect size information (Study 1 N = 97; Study 2 N = 100). After consenting to participate in the study, participants in all conditions read an article. In Study 1, the school article described a research study in which more than 500 4th graders took a national math test at the beginning and end of the school year (for an example of the small-effect article version, see the Appendix). During the school year, half of the students completed the current math curriculum (Journey in Mathematics) and half completed a new math curriculum (Math in the Real World). To avoid influences of prior knowledge, the school district and math curricula were fictional. There were three versions of the school article; in all three versions, the percentage of students performing at a proficient level did not change for students who completed the current curriculum (holding steady at 25%). In the small-effect version (read by participants in the small-effect-with-prompt and small-effect-no-prompt conditions), the percentage of students performing at the proficient level increased from 25% to 27% (a 2% increase) among students who completed the new curriculum, whereas in the large-effect version (read by participants in the large-effect condition), the improvement was from 25% to 35% (a 10% increase). In the general-effect version (read by participants in the no-effect-size-information condition), the article did not describe the magnitude of the improvement for the new curriculum, merely stating: “By the end of the school year, the percent of students performing at a proficient level increased for students who completed the [new] Math in the Real World curriculum, whereas there was no change in the percent of students performing at a proficient level for students who completed the [current] Journey in Mathematics curriculum.” In all three versions, the school article concluded by stating that the new math curriculum would cost significantly more than the current curriculum. After reading the article, participants reported the likelihood that they would recommend that the school district purchase the new math curriculum to boost elementary students’ math proficiency.
In Study 2, participants read an article about a new energy bar that offered mental-alertness benefits at a higher cost than conventional energy bars. The mental-alertness benefit was driven by a fictional natural supplement in the energy bar (“cara berries”). The energy-bar article described a research study in which 340 participants were randomly assigned to eat either one conventional energy bar or one cara berry energy bar each day for a week (for an example of the small-effect article version, see the Appendix). Participants in the article self-reported their own mental alertness both at the beginning and end of the week on a 5-point scale from 1 (very low) to 5 (very high). Participants who ate cara berry bars showed larger increases in self-reported mental alertness by the end of the week than those who ate conventional energy bars. Similar to Study 1, there were three versions of the article; in all three versions, participants who ate conventional energy bars went from an average mental-alertness rating of 1.50 to 1.52 by the end of the week. In the small-effect version (read by participants in the small-effect-with-prompt and small-effect-no-prompt conditions), participants who ate cara berry energy bars went from an average mental-alertness rating of 1.50 to 1.56 (increase of 0.06 points), whereas in the large-effect version (read by participants in the large-effect condition), the improvement was from 1.50 to 3.5 (increase of 2 points). In the general-effect version (read by participants in the no-effect-size-information condition), the article did not specify the magnitude of the mental-alertness improvement from the cara berry bars, merely stating: “By the end of the week, participants who ate the cara berry energy bars showed larger increases in average mental alertness ratings compared to those who ate the conventional energy bars.” In all three versions, the energy-bar article concluded by stating that the cara berry bars were twice as expensive as conventional energy bars. After reading the article, participants reported the likelihood that they would purchase the new energy bar.
Outcome measures
Meaningfulness rating
Only participants in the small-effect-with-prompt conditions were then prompted to consider the meaningfulness of the improvement from the intervention in relation to its cost. Depending on the study, participants were asked: “On a scale from 0 (not at all) to 100 (very much), to what extent do you think the improvement in [math proficiency/mental alertness] from [completing the new math curriculum/eating cara berry energy bars] is worth the additional cost?” Participants responded using a sliding scale that originated at the midpoint. In Study 1, if the meaningfulness rating was less than 50, participants received a follow-up open-ended question that asked: “How large of a change in math proficiency would you consider to be a meaningful improvement?” The purpose of this follow-up was to verify whether laypeople agreed with our own estimate of a meaningfully large improvement in math proficiency in this context (i.e., 10%). In Study 2, if the meaningfulness rating was less than 50, participants were then asked: “What amount of improvement in mental alertness from eating cara berry energy bars would make these bars worth the added cost (if any)? For example, going from an average mental alertness rating of 1.0 to 2.0 by the end of the week would be an improvement of 1 point in mental alertness.” We gave all participants an example of a possible improvement amount to make it clear what we meant by “improvement” and to dissuade participants from giving impossible responses (e.g., improvements greater than 5 points). If participants’ meaningfulness rating was 50 or larger, they were asked what amount of improvement would make the cara berry bars not worth the added cost. These open-ended follow-up questions allowed us to measure thresholds for perceived “meaningful” and “not meaningful” improvements.
Decision rating
All participants were then asked to make a decision based on the article they read (using a sliding scale that originated at the midpoint). In Study 1, participants were asked to make a recommendation to the school district about adopting the new math curriculum: “On a scale from 0 (do not recommend) to 100 (strongly recommend), to what extent would you recommend that the Lakeview School District use the [new] Math in the Real World curriculum?” In Study 2, participants rated their endorsement of the cara berry bars: “On a scale from 0 (very unlikely) to 100 (very likely), what is the likelihood that you would purchase cara berry energy bars to improve your own mental alertness?”
Decision explanation
After giving a quantitative rating, all participants were asked to explain their decision rating in an open-ended manner. In Study 1, participants were asked: “Please explain your response: Why would/wouldn’t you recommend that the Lakeview School District use the [new] Math in the Real World curriculum?” In Study 2, they were asked: “Please explain your response: Why would/wouldn’t you purchase cara berry energy bars to improve your own mental alertness?”
Improvement guess
Only participants in Study 2 in the no-effect-size-information condition were then asked the following: “If you had to guess, how much of an improvement in overall mental alertness did the participants who ate cara berry energy bars show? For example, going from an average mental alertness rating of 1.0 to 2.0 by the end of the week would be an improvement of 1 point in mental alertness.” Participants gave an open-ended response.
Improvement threshold values
Only Study 2 participants in the large-effect and small-effect-no-prompt conditions then gave open-ended responses about what improvements they would consider meaningful/not meaningful based on their endorsement rating. Participants who gave endorsement ratings less than 50 were asked what amount of mental-alertness improvement would be worth the added costs, whereas those who gave endorsement ratings of 50 or greater were asked at what point would the amount of mental-alertness improvement not be worth the added costs (using the same question formats as the small-effect-with-prompt condition described above).
Numeracy score
Finally, all participants completed the Abbreviated Numeracy Scale (Weller et al., 2013). Numeracy scores reflected the total number of questions for which participants responded correctly, ranging from 0 to 8.
Hypotheses
Our main hypothesis was that most participants in the no-effect-size-information condition would assume that the intervention produced meaningfully large improvements (in math performance for Study 1 and in mental alertness for Study 2). If so, then decision ratings should be significantly higher for participants in the no-effect-size-information condition than the small-effect-no-prompt condition, and decision ratings should not be significantly different between participants in the no-effect-size-information and large-effect conditions, after controlling for numeracy. In Study 2, we also predicted that the average guess of the improvement magnitude among participants in the no-effect-size-information condition would be more comparable to the magnitude of the effect in the large-effect version (2 points) than the small-effect version (.06 points) of the article. Finally, on the basis of our findings for Study 1, for Study 2, we expected that explanations for endorsement ratings among participants in the no-effect-size-information group would rarely mention that the article failed to report the size of the mental-alertness improvement (i.e., response rate less than 20%).
We also had several secondary hypotheses. First, we predicted that providing participants with numerical information about the magnitude of the effect would impact their perceptions of the practical significance of the intervention. Specifically, if participants perceive the small effect to be less meaningful than the large effect, then decision ratings should be significantly lower for participants in the small-effect-no-prompt condition than the large-effect condition, after controlling for numeracy. In addition, on the basis of our findings in Study 1, for Study 2, we expected that participants in the large-effect group would be more likely to mention that the improvement is large/meaningful in their open-ended explanations for decisions, whereas participants in the small-effect groups would be more likely to mention that the improvement is small/not meaningful.
Second, if the main reason why people endorse findings with small effects is because they do not sufficiently attend to effect magnitudes, then prompting participants to first consider whether the effect is worth the added cost should decrease their decision ratings further such that decision ratings should be significantly lower for participants in the small-effect-with-prompt condition than the small-effect-no-prompt condition, after controlling for numeracy.
Third, if participants’ decisions are related to the extent to which they perceive the effect as meaningful, then meaningfulness ratings should be positively and significantly correlated with decision ratings for participants in the small-effect-with-prompt condition.
Fourth, on the basis of our findings from Study 1, for Study 2, we predicted that there would be an interaction between numeracy and effect size condition on decisions such that numeracy would be negatively correlated with endorsement ratings only for the small effect size groups.
Finally, for all participants in Study 2 except for those in the no-effect-size-information condition, we predicted that both upper meaningful thresholds (the point at which participants consider improvements in mental alertness to be worth the added cost) and lower meaningful thresholds (the point at which participants consider improvements in mental alertness to not be worth the added cost) would be positively associated with numeracy such that more numerate participants would report larger meaningful thresholds than less numerate individuals. For details on the analyses and results of the meaningful threshold data, see the Supplemental Material available online.
Results
Decision ratings
All statistical analyses were conducted using R statistical software (Version 4.2.3; R Core Team, 2023). We first compared decision ratings across the four conditions (for box plots showing the raw data from Studies 1 and 2, see Fig. 1). Overall, participants in the no-effect-size-information (Study 1 M = 80.56; Study 2 M = 50.47) and large-effect (Study 1 M = 73.93; Study 2 M = 58.90) conditions were more likely to recommend the new math curriculum than participants in the small-effect conditions (Study 1 no prompt M = 45.26; Study 2 no prompt M = 34.98; Study 2 with prompt M = 45.22; Study 2 with prompt M = 31.68). To test for statistical differences in decision ratings, we ran an analysis of variance (ANOVA) on a regression model with decision rating as the dependent variable, numeracy as a continuous covariate, and condition as a between-subjects factor using the following formula: Decision Rating ~ Numeracy + Condition.

Box plots of decision ratings by condition for Study 1 (a) and Study 2 (b). Large, centered black dots reflect the mean responses for each condition.
In Study 1, there were significant effects of both numeracy, F(1, 393) = 16.58, p < .001, η2 = .04, and condition, F(3, 393) = 49.46, p < .001, η2 = .27, on recommendation ratings (Fig. 1a). Post hoc Tukey’s honest significance difference (HSD) and Bayes factor (BF) t tests (using the BayesFactor package in R; Morey & Rouder, 2022) confirmed that recommendation ratings were significantly higher for the no-effect-size-information than the small-effect-no-prompt condition—Mdiff = 34.83, 95% family-wise confidence interval (CI) = [25.18, 44.48], p < .001, d = 1.41, BF = 7.09 × 10¹⁵. In addition, recommendation ratings were not significantly different between the no-effect-size-information and large-effect conditions; if anything, ratings were slightly higher for the no-effect-size-information condition, Mdiff = 6.00, 95% family-wise CI = [−3.63, 15.63], p = .38, d = 0.32, BF = 1.62, supporting our main hypothesis. Further, recommendation ratings were significantly lower for the small-effect-no-prompt condition than the large-effect condition, Mdiff = 28.83, 95% family-wise CI = [19.27, 38.38], p < .001, d = 1.06, BF = 3.23 × 10⁹, supporting our first secondary hypothesis. These findings support the idea that participants in the no-effect-size-information condition exhibited a practical significance bias; however, participants distinguished between findings of low versus high practical significance when effect magnitudes were provided (i.e., in the large-effect and small-effect-no-prompt conditions). Recommendation ratings were statistically similar among the small-effect-with-prompt and small-effect-no-prompt conditions after controlling for numeracy, Mdiff = 0.02, 95% family-wise CI = [−9.56, 9.59], p = 1, d = 0.005, BF = 0.15, refuting our second secondary hypothesis.
For Study 2, endorsement ratings were lower overall than recommendation ratings in Study 1 (for a box plot of the raw data, see Fig 1b), primarily because more participants, including those in the no-effect-size-information and large-effect conditions, were concerned by the added costs of the new energy bar (for descriptive statistics of open-ended explanations, see Table 2). An ANOVA based on the regression model above revealed significant effects of numeracy, F(1, 395) = 17.78, p < .001, η2 = .04, and condition, F(3, 395) = 19.18, p < .001, η2 = .13, on endorsement ratings. Post hoc Tukey’s HSD and BF t tests revealed that endorsement ratings for the no-effect-size-information condition were significantly higher than the small-effect-no-prompt condition, Mdiff = 14.75, 95% family-wise CI = [4.13, 25.36], p = .002, d = 0.54, BF = 115.47, and not significantly different between the no-effect-size-information and large-effect conditions, Mdiff = 7.52, 95% family-wise CI = [3.12, 18.17], p = .26, d = 0.29, BF = 1.08. Together, these findings show evidence of a practical significance bias, supporting our main hypothesis and replicating our findings from Study 1 in a new, personally relevant decision-making context. Additionally, endorsement ratings were significantly higher for the large-effect condition than the small-effect-no-prompt condition, Mdiff = 22.27, 95% family-wise CI = [11.63, 32.91], p < .001, d = 0.83, BF = 497754.3, suggesting that participants’ decisions aligned with the size of the effect when it was reported, similar to Study 1. Again, we found no statistical difference in endorsement ratings between the small-effect-no-prompt and small-effect-with-prompt conditions, Mdiff = 5.20, 95% family-wise CI = 5.39, 15.79, p = .59, d = 0.11, BF = 0.20, replicating our findings from Study 1 and confirming that the meaningfulness prompt was not effective for reducing participants’ perceived meaningfulness of the numerically small improvement.
In an exploratory analysis, we plotted correlations between numeracy and decision ratings for each condition (Fig. 2). Specifically, we wondered whether numeracy differences might explain why people varied in their tendency to perceive small effects as meaningful in the small-effect conditions. For example, people who are less numerate tend to have difficulties with proportional reasoning (e.g., Thompson et al., 2023); thus, if lower numeracy individuals are less sensitive to the size of an effect in relation to its scale of measurement, they may be more likely to perceive trivial improvements as meaningful.
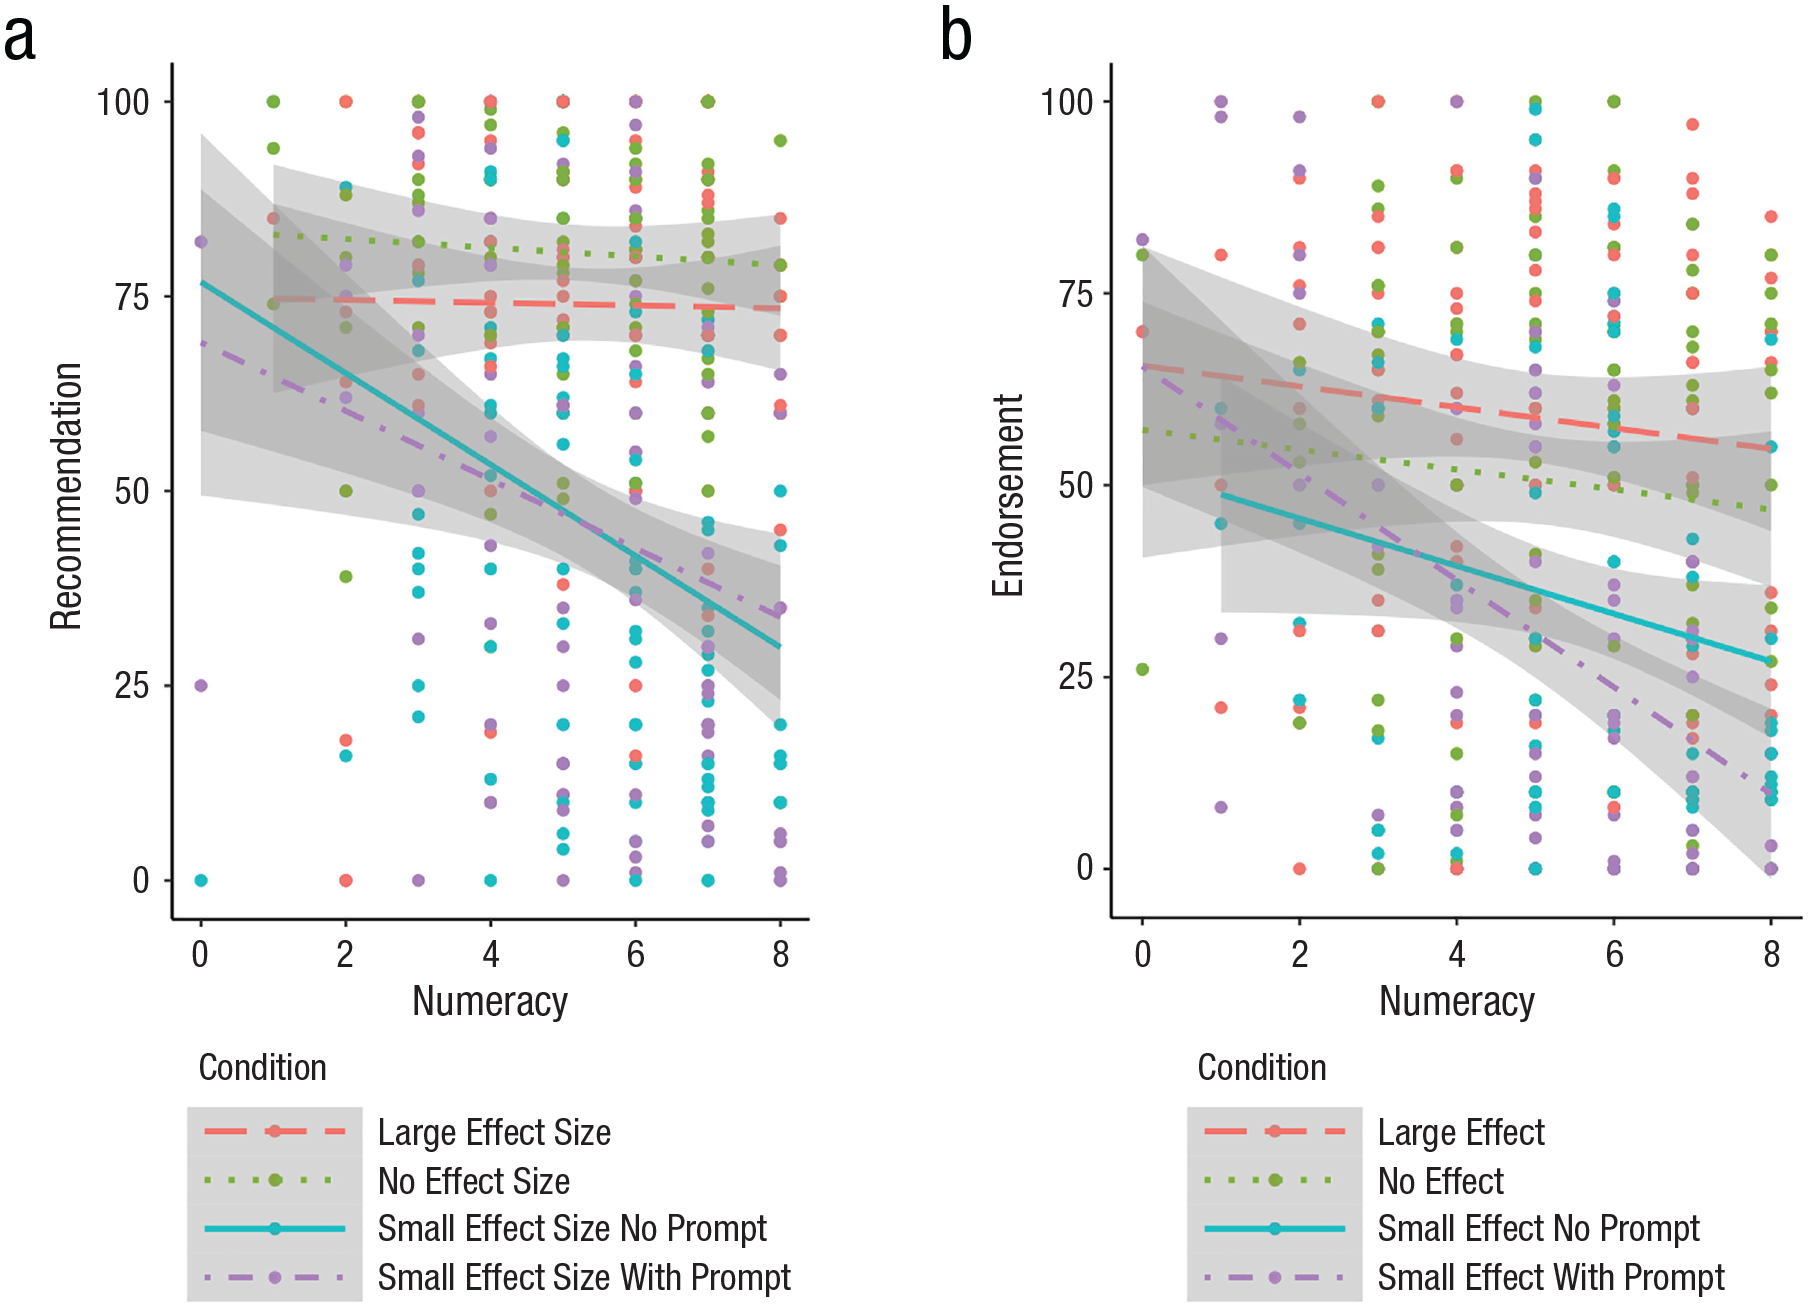
Correlations (with 95% confidence intervals) between numeracy and recommendation ratings by condition for Study 1 (a) and between numeracy and endorsement ratings by condition for Study 2 (b).
The visualizations in Figure 2 revealed a possible interaction between numeracy and condition on decision ratings such that decision ratings were negatively associated with numeracy only for the small-effect conditions. To test for a statistical interaction between numeracy and condition, we ran new ANOVAs on the following regression model: Decision Rating ~ Numeracy + Condition + Numeracy × Condition.
For Study 1, this analysis revealed a significant interaction between numeracy and condition on recommendation ratings, F(3, 390) = 3.69, p = .01, η2 = .03 (Fig. 2a). We next tested for correlations between numeracy and recommendation ratings for each condition; correlations were significant only for the small-effect-no-prompt, r = −.33, t(98) = −3.45, 95% CI [−.49, −.14], p < .001, and small-effect-with-prompt, r = −.25, t(98) = −2.56, 95% CI [−.43, −.06], p = .01 (all other rs < .06; all other ps > .5), conditions. Thus, lower numeracy individuals were more likely to endorse the new math curriculum on the basis of trivial math-performance gains. For Study 2, there was also a significant interaction between numeracy and condition, F(3, 392) = 3.13, p = .026, η2 = .02 (Fig. 2b). Follow-up correlation tests revealed a significant negative association between numeracy and endorsement ratings for the small-effect-with-prompt condition, r = −.41, t(99) = −4.58, 95% CI [−.57, −.24], p < .001, and a nonsignificant negative correlation for the small-effect-no-prompt condition, r = −.19, t(98) = −1.91, 95% CI [−.37, .006], p = .058 (all other rs < .1; all other ps > .35), generally replicating our finding from Study 1 that lower numeracy individuals were more likely to endorse small effects.
Correlation between meaningfulness and recommendation ratings
We tested our third secondary hypothesis by correlating meaningfulness ratings and decision ratings for participants in the small-effect-with-prompt condition. For both studies, there was a significant positive correlation—Study 1: r = .94, t(98) = 27.13, 95% CI [.91, .96], p < .001; Study 2: r = .86, t(99) = 16.84, 95% CI [.80, .90], p < .001—such that the higher participants rated the meaningfulness of the small effect, the more likely they were to recommend or endorse the intervention.
Open-ended responses
In addition to quantitative ratings, we also asked participants to give open-ended responses for some questions.
Meaningful improvement
In Study 1, participants in the small-effect-with-prompt condition who gave prompt ratings less than 50 (i.e., that the math gain was not worth the added cost) were asked: “How large of a change in math proficiency would you consider to be a meaningful improvement?” This question mainly served as a check to see whether laypeople agreed with our own intuitions that an improvement of 10% would be considered a meaningfully large improvement in the context of the math-curriculum study. The median response from this follow-up question was 11.25%, suggesting that laypeople generally agreed with our own estimate of a meaningfully large gain in this scenario.
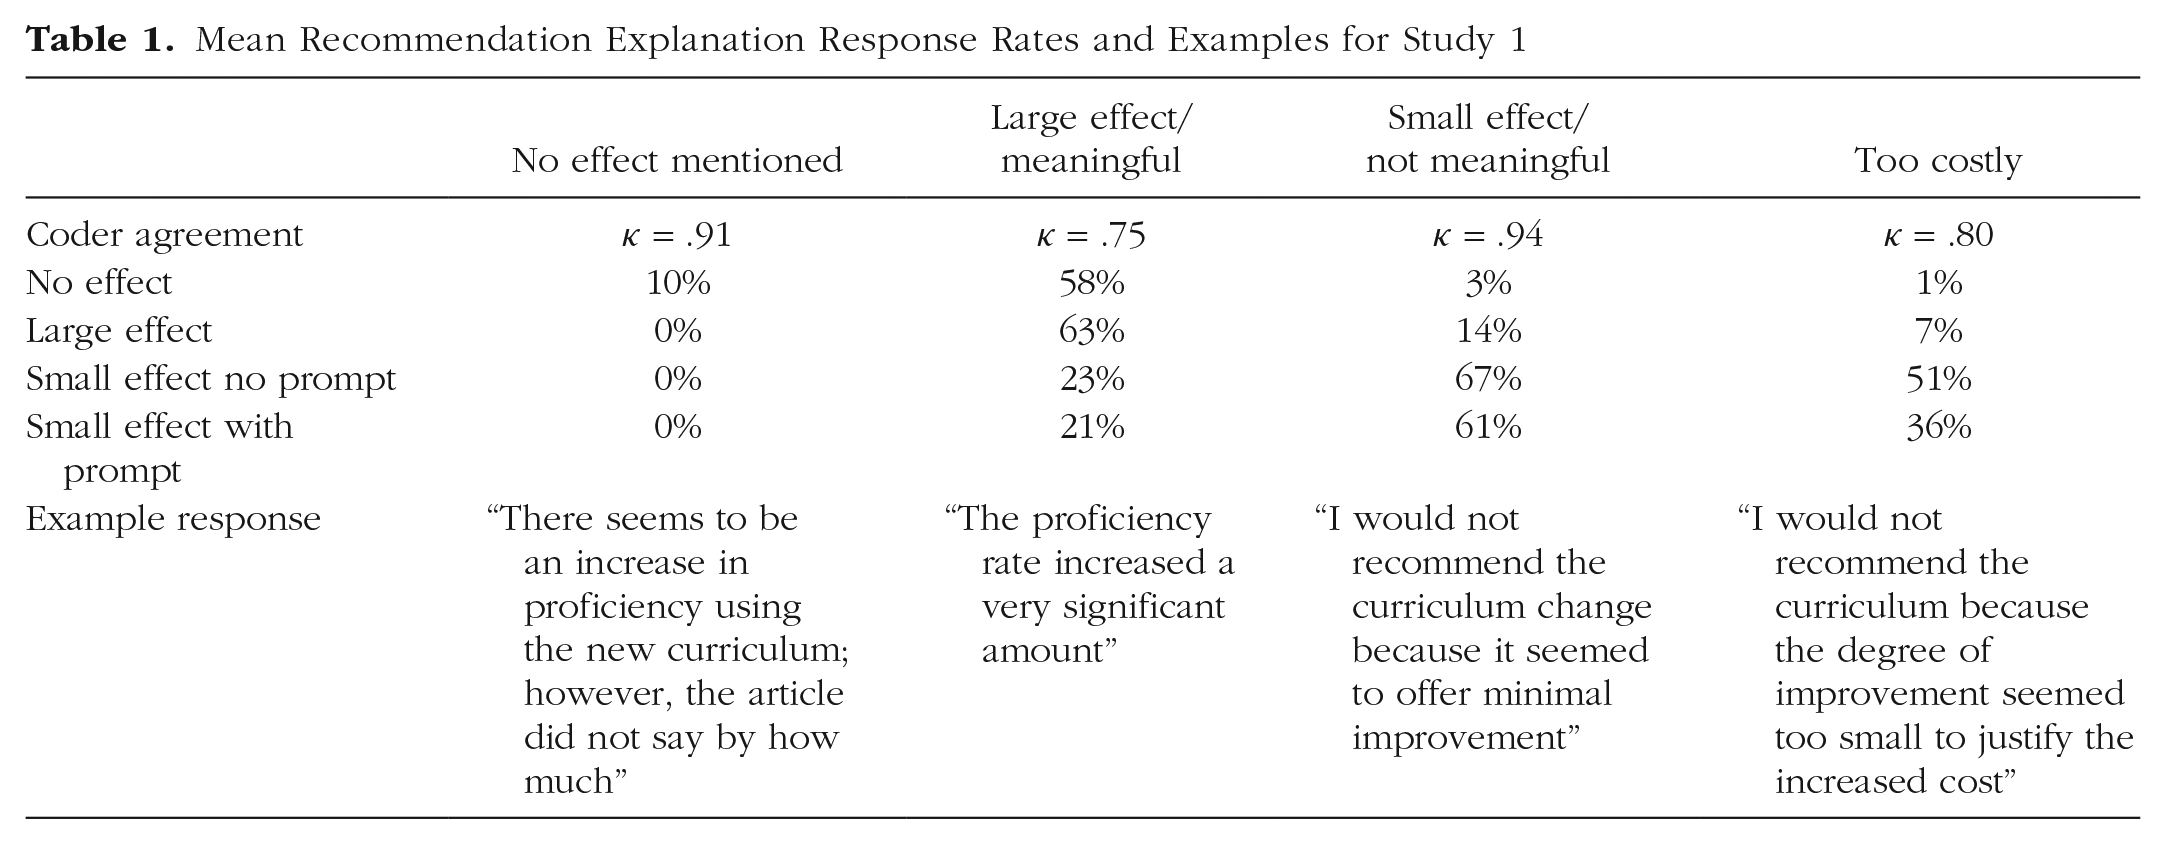
Decision explanations
All participants in both studies were also asked to explain their decision ratings; for example, for Study 1, we asked: “Why would/wouldn’t you recommend that the Lakeview School District use the [new] Math in the Real World curriculum?” As an exploratory analysis, open-ended explanations were coded by two independent raters (including A. L. Michal) into four categories of responses (which were not mutually exclusive): magnitude of the improvement in math proficiency not mentioned; math-proficiency gain large/meaningful; math-proficiency gain small/not meaningful; and new curriculum too costly/not worth the cost. Cohen’s κ values were high for all four categories in both studies—Study 1: all κs > .75 (Table 1); Study 2: all κs > .57 (Table 2). Only responses for which both coders agreed were included in the statistical analysis, which comprised 94.1% of the data for Study 1 and 93.9% of the data for Study 2. Overall response rates by condition and example responses for each category are shown in Tables 1 and 2. Further details about statistical analyses of open-ended responses are included in the Supplemental Material. Only 10% of Study 1 participants and only 5% of Study 2 participants in the no-effect-size-information condition spontaneously observed that the article did not mention how much of a benefit resulted from the interventions, supporting the presence of a practical significance bias among these participants, consistent with our previous findings.
Mean Recommendation Explanation Response Rates and Examples for Study 1
Mean Endorsement Explanation Response Rates by Condition for Study 2

Improvement guess
Study 2 participants in the no-effect-size-information condition were also asked to guess how much of an improvement in mental alertness the cara berry bar participants experienced. For context, participants were given an example of a possible improvement (going from 1.0 to 2.0 would be considered an improvement of 1 point in mental alertness); their article also mentioned that study participants rated their mental alertness on a scale from 1 to 5. We tested whether participants’ guesses were statistically different from both the large (2 points) and small (0.06 points) improvements in mental alertness mentioned in the large- and small-effect versions of the article, respectively. Ten participants were excluded from this analysis either because they did not give numerical responses or because they gave an impossible guess (i.e., a value that exceeded the 5-point scale of the mental-alertness measure). Paired t tests revealed that participant guesses were significantly smaller than the large improvement value of 2, M = 1.61, t(86) = 3.75, p < .001, d = 0.40, BF = 65.72, whereas guesses were significantly higher than the small improvement value of 0.06, t(86) = 14.78, p < .001, d = 1.58, BF = 1.57 × 10²². Thus, Study 2 participants in the no-effect condition generally assumed that improvements in mental alertness were more comparable in size to a numerically large effect than a small effect, consistent with the existence of a practical significance bias.
Discussion
Across two studies, we found that laypeople showed a practical significance bias when making decisions in everyday contexts—they tended to assume that gains from an intervention described in general terms (e.g., “Group A did better than Group B”) reflected meaningfully large effects. This bias was evident for both recommendation decisions (whether a school district should purchase a new math curriculum to improve student math proficiency) and personal decisions (whether to purchase energy bars to increase one’s mental alertness). However, when participants were given numerical information about the magnitude of effects, their decisions on average aligned with the overall size of the effect—they were more likely to recommend/endorse interventions with numerically large improvements than trivial improvements. These findings suggest that reporting effect magnitudes, rather than describing effects in general terms, can help people make better informed decisions, consistent with evidence that people make better health decisions when they have numerical than verbal information about risks and benefits (Lipkus, 2007; Peters, 2020; Peters et al., 2014). Conversely, our results also suggest that describing scientific findings only in general terms can be potentially misleading; laypeople may erroneously act on trivial effects because they assume that those findings are practically meaningful, similar to how generic claims in advertisements (e.g. “Brand X contains protein”) can mislead consumers by implying that a product contains meaningful amounts of a substance when in fact the amount is trivial (Hastak & Mazis, 2011).
Although participants who viewed numerical effects were sensitive to practical significance differences overall, we also found that individuals varied greatly in their endorsements of small effects and that this individual difference was related to overall numeracy—less numerate individuals were more likely to endorse interventions with small effects. In addition, explicitly drawing participants’ attention to numerically small effects did not decrease their meaningfulness perceptions. Thus, some individuals acted on small effects not because they ignored numerical information but because they had either low numeracy skills and/or erroneously perceived trivial effects as practically meaningful.
These results suggest that intervention may be necessary to help individuals interpret the practical importance of findings with small effects. One promising approach may be to provide additional context, such as visualizations, analogies, concrete reexpressions, and benchmarks for comparison, which can improve the interpretability of unfamiliar measurements (Hullman et al., 2018), very large numbers (e.g., Barrio et al., 2016; Riederer et al., 2018), and standardized effect size (e.g., Funder & Ozer, 2019; Lipsey et al., 2012; Mastrich & Hernandez, 2021; Kim et al., 2022). If people have trouble extracting the meaningfulness of small effects because they struggle with relative magnitude judgments (Reyna & Brainerd, 2008), then translating numerical effects into more familiar, concrete terms could facilitate interpretations of small effects. For example, a mental-alertness increase of .06 on a 5-point scale could be reexpressed as an increase equivalent to “the length of a guitar pick” relative to “the length of a double bed” (Hullman et al., 2018). Further research is thus necessary to determine effective techniques for improving the interpretability of small effects. In addition, students may benefit from explicit-practice reasoning about small effects reported in relevant scientific news articles, perhaps in the context of math-, science-, and/or media-literacy instruction; such reasoning would help students learn to apply scientific research appropriately in their everyday lives.
Although we replicated our findings across two different contexts that were likely familiar to most people, it is unknown whether laypeople would be similarly sensitive to effect magnitude information in less familiar contexts. There are some contexts for which changes in magnitude are not intuitive; for instance, tiny changes in global temperatures can have significant impacts on ecosystems and weather patterns (Hoegh-Guldberg et al., 2018), yet many people struggle to perceive the importance of small global temperature increases (e.g., Weber & Stern, 2011). However, it is possible that people may be better able to extract the meaning of effect magnitudes for unfamiliar contexts if they are given information about the scale of measurement (e.g., on a scale from 0 to 100) or additional context about how to interpret simple effects (e.g., Hullman et al., 2018). Thus, further work is necessary to determine how people reason about effect magnitude information in both familiar and unfamiliar contexts.
Finally, the current investigation examined only how people reason about the practical significance of improvements or gains. Are people equally sensitive to effect magnitudes in the context of risks or losses? Given that losses carry more weight than gains (Kahneman & Tversky, 1979), people might be more sensitive to effect magnitudes framed as losses or risks, and they may show a greater practical significance bias for losses described in general terms (i.e., “worse performance” or “greater risk”). Further research is necessary to test how people reason about practical significance in the context of losses or risks.
Supplemental Material
sj-docx-1-pss-10.1177_09567976241231506 – Supplemental material for A Practical Significance Bias in Laypeople’s Evaluation of Scientific Findings
Supplemental material, sj-docx-1-pss-10.1177_09567976241231506 for A Practical Significance Bias in Laypeople’s Evaluation of Scientific Findings by Audrey L. Michal and Priti Shah in Psychological Science
Supplemental Material
sj-png-2-pss-10.1177_09567976241231506 – Supplemental material for A Practical Significance Bias in Laypeople’s Evaluation of Scientific Findings
Supplemental material, sj-png-2-pss-10.1177_09567976241231506 for A Practical Significance Bias in Laypeople’s Evaluation of Scientific Findings by Audrey L. Michal and Priti Shah in Psychological Science
Supplemental Material
sj-png-3-pss-10.1177_09567976241231506 – Supplemental material for A Practical Significance Bias in Laypeople’s Evaluation of Scientific Findings
Supplemental material, sj-png-3-pss-10.1177_09567976241231506 for A Practical Significance Bias in Laypeople’s Evaluation of Scientific Findings by Audrey L. Michal and Priti Shah in Psychological Science
Footnotes
Appendix
Transparency
Action Editor: Angela Lukowski
Editor: Patricia J. Bauer
Author Contributions
Correction (August 2024):
This article has been updated since its original publication. See doi:10.1177/09567976241275068 for more information.
References
Supplementary Material
Please find the following supplemental material available below.
For Open Access articles published under a Creative Commons License, all supplemental material carries the same license as the article it is associated with.
For non-Open Access articles published, all supplemental material carries a non-exclusive license, and permission requests for re-use of supplemental material or any part of supplemental material shall be sent directly to the copyright owner as specified in the copyright notice associated with the article.