
Abstract
Humans differ vastly in the confidence they assign to decisions. Although such under- and overconfidence relate to fundamental life outcomes, a computational account specifying the underlying mechanisms is currently lacking. We propose that prior beliefs in the ability to perform a task explain confidence differences across participants and tasks, despite similar performance. In two perceptual decision-making experiments, we show that manipulating prior beliefs about performance during training causally influences confidence in healthy adults (N = 50 each; Experiment 1: 8 men, one nonbinary; Experiment 2: 5 men) during a test phase, despite unaffected objective performance. This is true when prior beliefs are induced via manipulated comparative feedback and via manipulated training-phase difficulty. Our results were accounted for within an accumulation-to-bound model, explicitly modeling prior beliefs on the basis of earlier task exposure. Decision confidence is quantified as the probability of being correct conditional on prior beliefs, causing under- or overconfidence. We provide a fundamental mechanistic insight into the computations underlying under- and overconfidence.
Human decisions are accompanied by a sense of confidence regarding the accuracy of those decisions. In experimental work, decision confidence usually correlates with objective accuracy: Participants report high confidence for correct choices and low confidence for errors (Fleming et al., 2010). Theoretically, this is explained by assuming that confidence for binary choices reflects the probability of being correct given the available data (Kiani & Shadlen, 2009). Thus, humans should be rather stable in computing and reporting confidence. However, although such probabilistic models on average explain decision confidence well, vast differences exist between individuals and tasks concerning the reported confidence level (Ais et al., 2016). This is clearly evident in simple, low-level perceptual decision-making tasks, where some systematically underestimate their accuracy and others overestimate.
Introduction
Under- and overconfidence have far-reaching implications in real life: Overconfidence has been related to increased sharing of fake news (Lyons et al., 2021) and diagnostic inaccuracies in physicians (Saposnik et al., 2016), whereas underconfidence is linked to low self-esteem (Moses-Payne et al., 2019). Moreover, impaired metacognition has been linked to holding radical beliefs (Rollwage et al., 2018) and various psychiatric symptoms (Hoven et al., 2019).
Despite clear evidence for individual and task differences in confidence, with potentially far-reaching consequences, the origins of the phenomenon are ill understood. Although researchers have proposed explanations in terms of impression management (Belmi et al., 2019; Schwardmann & van der Weele, 2019) or feedback exposure (Baranski & Petrusic, 1994; Petruzzello & Corbin, 1988), these accounts do not fundamentally explain the underlying mechanism of confidence biases. The current work investigated whether a probabilistic framework can account for under- and overconfidence by leveraging an underappreciated aspect of probabilistic models of confidence: The probability of being correct depends on the task context. Everything else being equal, the probability of a correct choice is higher in an easy task context than in a difficult task context simply because correct choices appear more often in easy tasks. Thus, even agents who merely believe to be operating in a difficult task context will report lower confidence than agents who believe the task context to be easy (see Fig. 1). Likewise, agents who assume themselves to be very bad at a task will report lower confidence than agents who believe themselves to be very competent. We introduce a subjective drift rate representing prior beliefs, which controls the mapping between the available data and the probability of being correct. The idea that an internal model of the world informs the computations of decision confidence has been explored before (e.g., Drugowitsch et al., 2014; Fleming & Daw, 2017; Khalvati et al., 2021), demonstrating that a “wrong” model of the world could lead to distorted confidence computations. Here, we opted for the term prior beliefs because we propose that changes in participants’ beliefs about their ability to perform a task influence their computations of confidence. Thus, this term relates more closely to the idea that confidence depends on beliefs about capacities compared to their beliefs about the world. Apart from theoretical considerations, direct empirical support for the involvement of prior beliefs in the computation of confidence is equally lacking. We aimed to provide direct evidence that prior beliefs underlie under- and overconfidence by explicitly manipulating beliefs about task performance in perceptual decision-making tasks.
In two experiments, we manipulated prior beliefs during the training phase and looked at the influence on confidence ratings during a subsequent test phase. Our results showed that altered prior beliefs, resulting from fake comparative feedback (Experiment 1) or training on tasks with differential difficulty (Experiment 2) selectively affected subsequent (test phase) confidence ratings while leaving performance unaffected. These effects were accounted for by a probabilistic model of confidence that represented prior beliefs about one’s ability to perform the task at hand, changing the mapping between accumulated evidence and confidence (see Fig. 1).
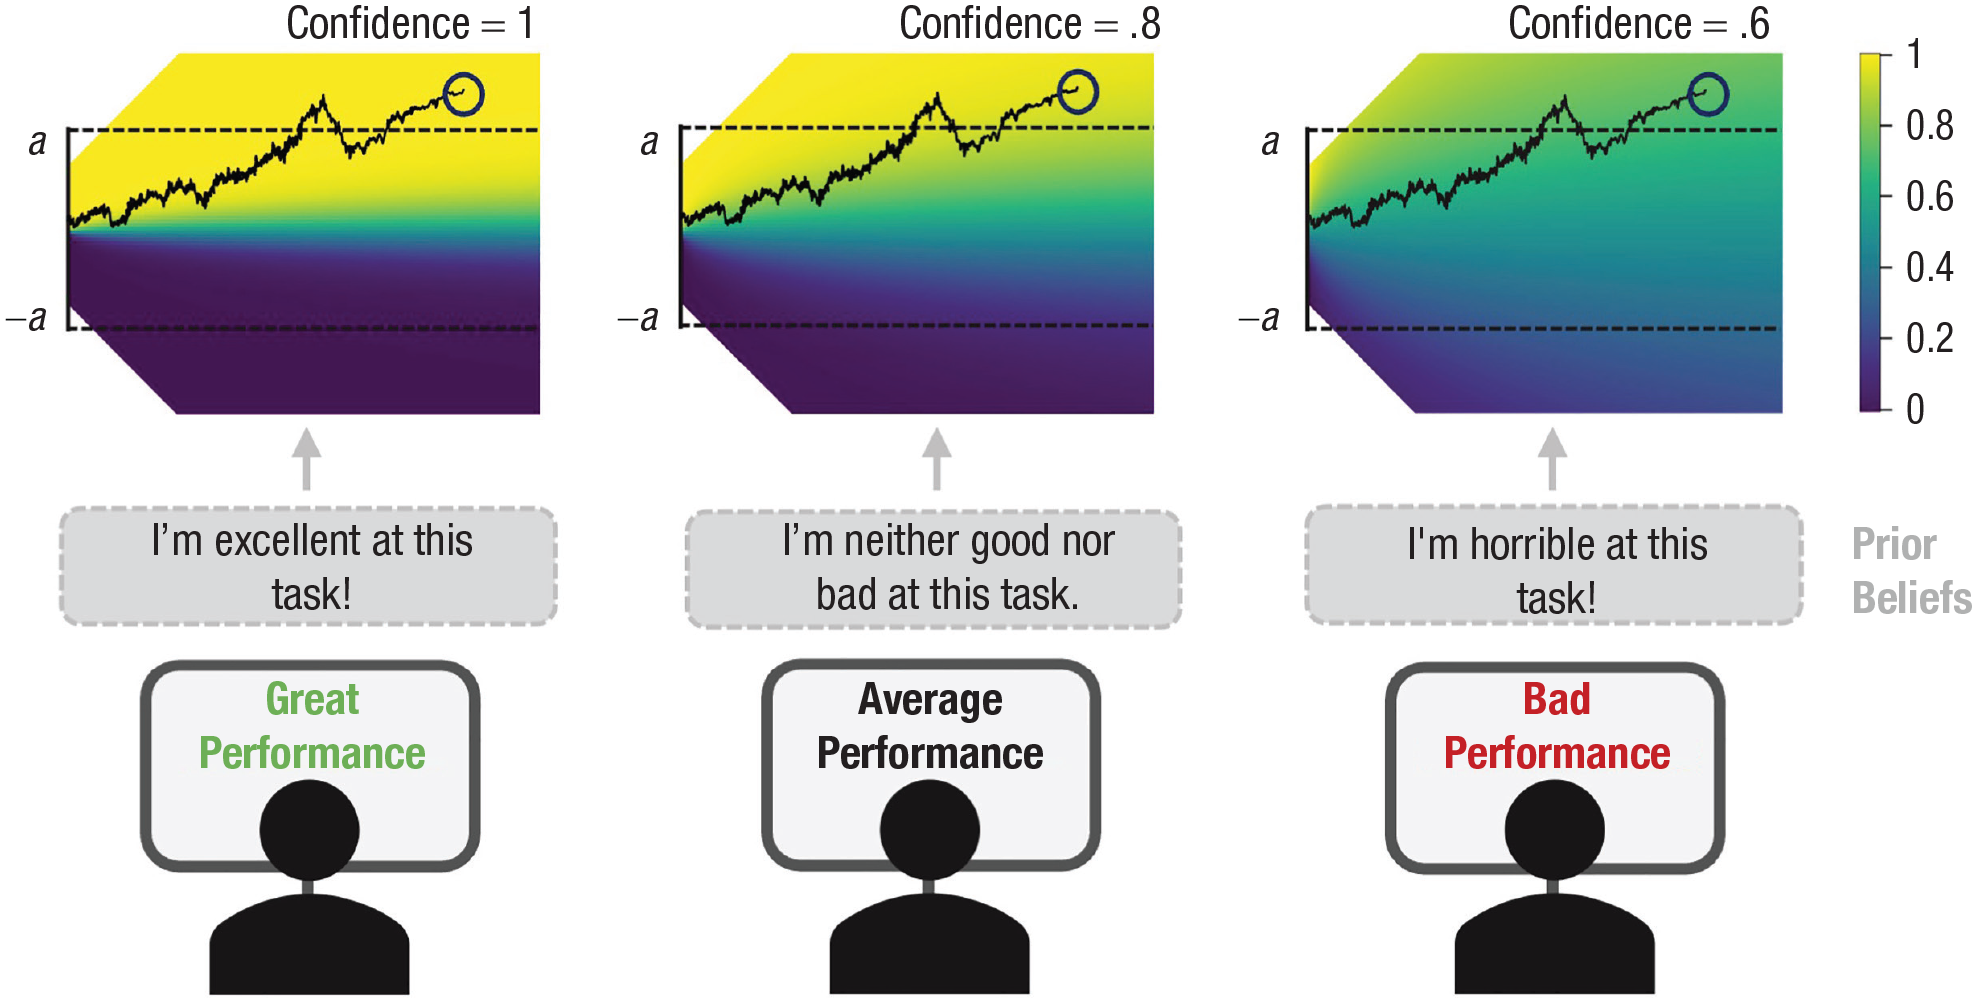
Illustration of how prior beliefs can influence decision confidence. We hypothesized that participants exposed to feedback indicating that they are performing well (versus badly) will hold the prior belief that they are good versus bad at this task. In our computational framework (top row), a change in prior belief is implemented by changing the mapping between the amount of evidence (y-axis) and the perceived probability of responding correctly (i.e., decision confidence; colored heat map). Within this framework, noisy sensory evidence (y-axis) accumulates over time (x-axis) until one of the two bounds (a or −a) is hit and a choice is made, after which postdecisional evidence continues to accumulate and informs decision confidence. In the figure, note that for the exact same trial, the final amount of accumulated evidence (blue circle) leads to different levels of confidence depending on the prior belief about task performance.
Method
Open practices statement
All raw data and analysis code are openly available on the Open Science Framework at https://osf.io/8bf3r/. This work was not preregistered.
Statement of Relevance
The ability to accurately evaluate your choices is crucial for healthy human functioning. Tendencies to be under- or overconfident in one’s choices have been linked to a variety of psychiatric symptoms, to self-esteem, and even to real-world outcomes such as believing in fake news or holding radical beliefs. However, the underlying mechanisms that result in such erroneous estimations of confidence are currently sorely underexplored. We provide a solid fundamental account that explains under- and overconfidence as resulting from prior beliefs in one’s performance, and we demonstrate how this results in dissociations between accuracy and confidence. Our study provides long-needed empirical evidence on the computational signatures of confidence deviations, and we introduce manipulations of prior beliefs that could be leveraged in a clinical context. Thus, our work will appeal to researchers interested in a fundamental understanding of (meta)cognition as well as researchers with a more clinical orientation.
Participants
Fifty participants (8 men, one nonbinary; age: M = 19 years, SD = 4.9 years, range 17–52 years) took part in Experiment 1. Fifty participants (5 men; age: M = 18.5 years, SD = 1 year, range 17–22 years) took part in Experiment 2. In our lab, unless otherwise required we use a convenience sample of first-year undergraduate students with the aim of testing 50 participants. In doing so, we ensure that we have high experimental power, well above the 1,600 trials per cell usually required of the design, combined across participants and items (Brysbaert & Stevens, 2018). Due to chance level performance in at least one of the tasks, we removed 2 participants from Experiment 1 and 3 from Experiment 2. All participants participated in return for course credit and read and signed a written informed consent at the start of the experiment. All procedures were approved by the KU Leuven Ethics Committee.
Stimuli and apparatus
Both experiments were conducted on a 22-in. Dell monitor with a 60 Hz refresh rate, using PsychoPy3 (Peirce et al., 2019). All stimuli were presented on a black background centered around the middle of the screen (radius 2.49° visual arc). Stimuli for the dot-number task (white dots) were presented in two equally sized boxes (height 20°, width 18°) at an equal distance from the center of the screen. Stimuli for the letter-discrimination task (white Xs and Os) and dot-color task (red and blue dots) were presented in one box (height 22°, width 22°), centered around the fixation point.
Procedure
General
In both experiments, participants completed three decision-making tasks: a dot-color task, a dot-number task, and a letter-discrimination task (see Fig. 2). Each task started with 120 training trials. In Experiment 1, participants were presented performance feedback every 24 trials, whereas in Experiment 2, feedback was given on every trial. After the training phase of a task, a test phase of 216 trials followed during which no feedback was provided; instead, participants indicated their level of confidence after each choice. For all tasks, a trial started with a fixation cross that was presented for 500 ms, after which the stimulus appeared for 200 ms or until a response was given. Participants indicated their choice using the C or N key, using the thumbs of both hands. There was no time limit for responding. On test trials, participants additionally rated their confidence after each choice on a 6-point scale, labeled certainly wrong, probably wrong, maybe wrong, maybe correct, probably correct, and certainly correct (reversed order for half the participants). Confidence was indicated using the 1, 2, 3, 8, 9, and 0 keys with the ring, middle, and index fingers of both hands. There was no response limit for indicating confidence.
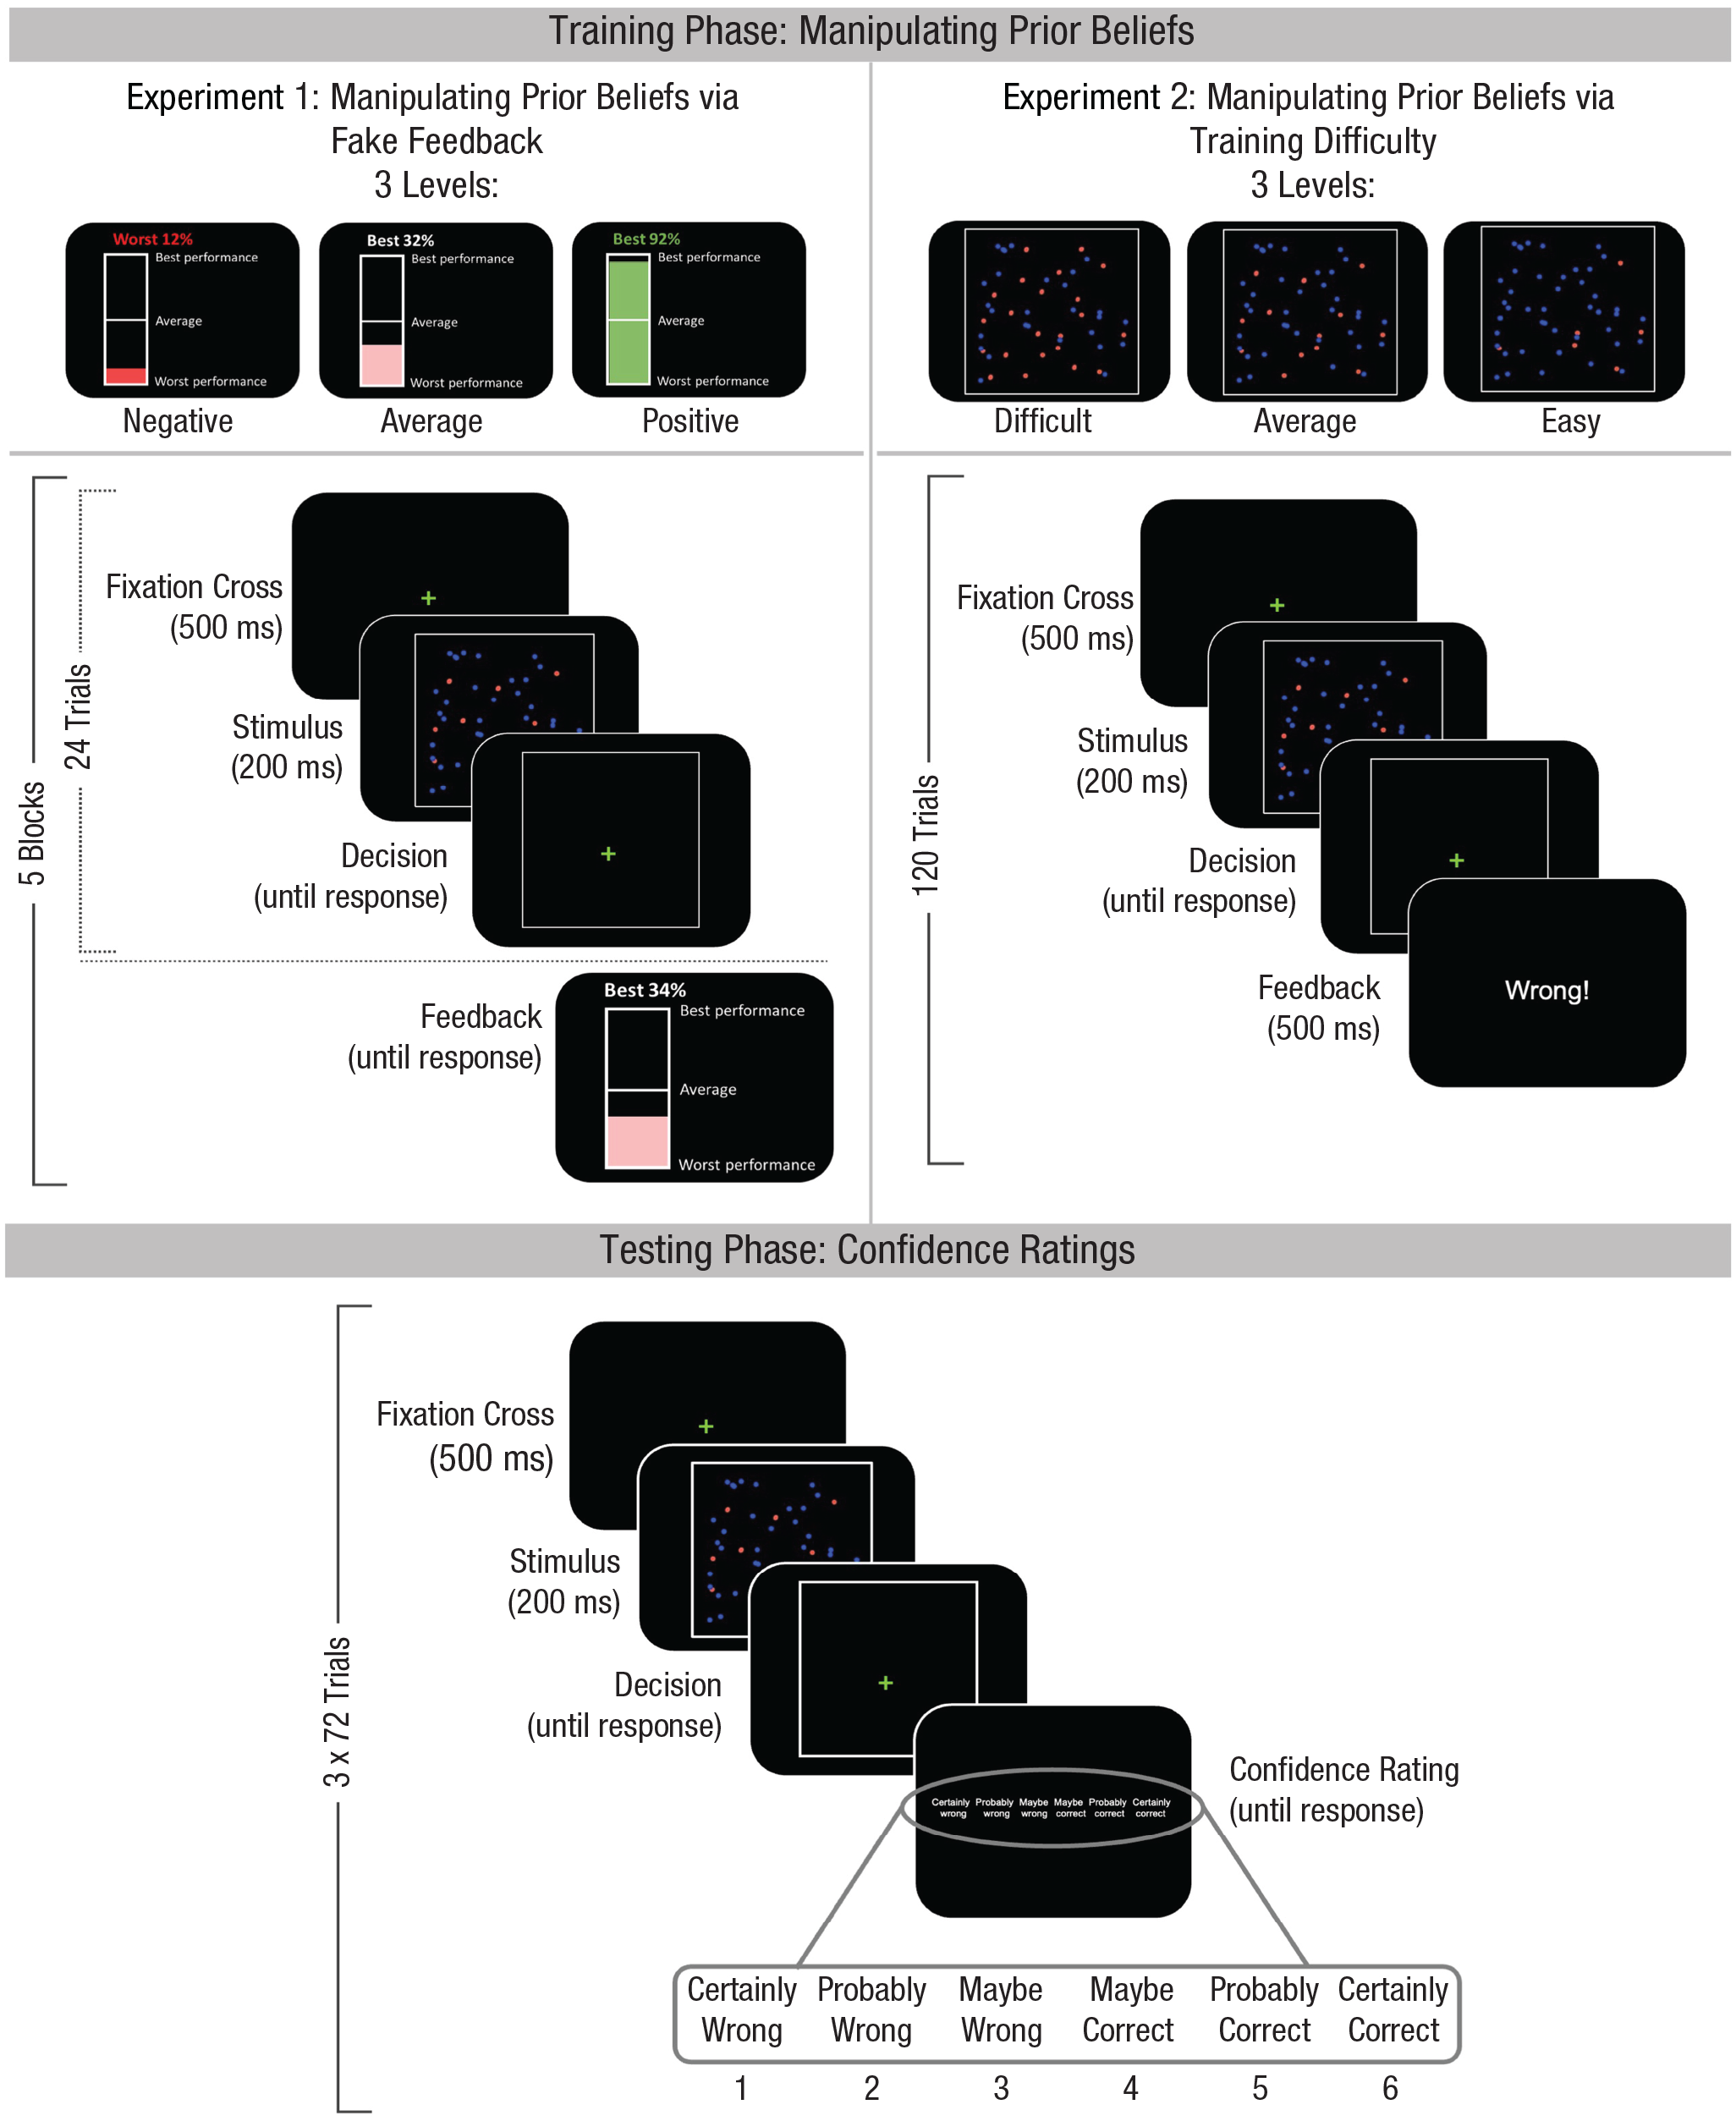
Experimental design. In both experiments, participants performed three different perceptual decision-making tasks (only one is shown here). Each task started with a training phase during which a different prior belief was induced. In Experiment 1, participants received comparative feedback after each training block, indicating that their performance was better, similar, or worse than the performance of a reference group. In reality, feedback was unrelated to their performance. In Experiment 2, during the training phase participants encountered only easy, average, or difficult trials. In this experiment, trial-by-trial feedback reflected actual performance. For both experiments, these manipulations aimed to install the belief that participants were very good, average, or very bad, respectively, at performing this task. Each participant was subjected to each of these three manipulations once (i.e., a different manipulation in each task). After each training phase, participants completed a test phase during which they no longer received feedback but instead rated their decision confidence after each decision.
For each task, there were three levels of stimulus difficulty (easy, average, or difficult). Stimulus properties for Experiment 1 were decided on the basis of the results of a small pilot study (N = 5). For Experiment 2, stimulus properties were revised on the basis of the results of Experiment 1 in order to achieve better matching accuracy between tasks. Stimulus dependencies for each task can be found in Table 1.
Stimulus Properties for Each Difficulty Level, Task, and Experiment

Dot-color task
On each trial, participants decided whether a field contained more (static) blue or red dots. The total number of dots was always 80, with differing proportions of red or blue dots depending on the difficulty condition. The position of dots was randomly generated on each trial.
Dot-number task
On each trial, two fields were presented, one of which contained 50 dots and the other either more than 50 dots or fewer than 50 dots. Participants decided which of the two fields contained the largest number of dots. The exact number of dots in the variable field differed depending on the difficulty condition. The position of dots was randomly generated on each trial.
Letter-discrimination task
On each trial, participants decided whether a field contained more Xs or Os. The total number of Xs and Os was always 80, with differing proportions of Xs or Os depending on the difficulty condition. The position of the letters was randomly generated on each trial.
Experiment 1: prior-belief induction in the comparative-feedback experiment
In Experiment 1, prior beliefs about the ability to correctly perform the task were manipulated by means of fake comparative feedback during the training phase. Participants were told that their feedback score was indicative of their performance (accuracy and reaction time, or RT) on the preceding trials relative to the performance of other participants who took part previously. Unknown to participants, feedback was predetermined to be either good, average, or bad for a specific task, and feedback scores were randomly sampled according to the feedback condition. Each participant received good feedback on one task (inducing prior beliefs of high task performance), average feedback on another task, and bad feedback on a third task (inducing prior beliefs of low task performance; order and mapping, with tasks counterbalanced between participants). For each task, participants received feedback after every 24 training trials, amounting to five feedback presentations per task. Feedback scores were pseudorandomly generated on each feedback presentation and ranged between 5% and 30% in the negative-feedback condition, between 37% and 62% in the average-feedback condition, and between 70% and 95% in the positive-feedback condition. To increase the credibility of the negative feedback, the second of the five feedback screens showed average feedback (ranging between 32% and 36%, labeled as average). Likewise, the second of five feedback screens in the positive-feedback condition showed average feedback (ranging between 63% and 67%, labeled as average).
At the top of the feedback screens, a verbal indication of the participant’s score was presented—“good performance” in green, “average performance” in white, or “bad performance” in red. The score itself was presented in the same color as the verbal indication. In the middle of the feedback screen, the participant’s score was indicated in a visual way. A vertically oriented rectangle with no fill color was presented, with the bottom line marked “worst performance,” the top line marked “best performance,” and a midline marked “average performance.” The participant’s score was used to color the same percentage of the rectangle’s total surface (starting at the bottom) in red (bad performance), white (average performance), or green (good performance; see Fig. 2).
Experiment 2: prior belief induction via task difficulty
In Experiment 2, prior beliefs about the ability to correctly perform the task were induced by manipulating the difficulty of the task during the training phase in three levels. Contrary to Experiment 1, participants received genuine feedback on every trial: Each correct choice was followed by the word “Correct!” and each incorrect choice by “Wrong!” Each participant completed one task with a training phase consisting only of easy trials (inducing positive prior beliefs about task ability), another with a training phase of all average trials (inducing average prior beliefs), and another with a training phase of all difficult trials (inducing negative prior beliefs).
Statistical analyses
Data from the test phase were analyzed using mixed-effects models. We started from models including the fixed factors of testing phase difficulty and condition (Experiment 1: positive, average, or negative feedback; Experiment 2: easy, average, or hard training phase) and their interaction, as well as a random intercept for each participant. These models were then extended by adding random slopes through forward selection. More specifically, we first compared two separate models (each including the random slope of one of the two fixed factors) against the starting model, using an alpha level of .05 for significance testing. If only one of the random slopes provided a better fit than the starting model, we kept that model as the final model. If both random slopes significantly improved the fit, we then compared a model including a slope for each factor against the best-fitting model from the previous step (i.e., the lowest Bayesian information criterion, or BIC). If we failed to find a better fit, we kept the model with one random slope and the lowest BIC as the final model. If the inclusion of both slopes did provide a better fit, we compared this model against a model including a random slope for the interaction as well. However, for all models reported in our manuscript, the latter failed to converge or provide a better model fit, so that the final models included random slopes for one or both factors, but not the interaction. For Experiment 1, the final model for confidence ratings included additive slopes of both testing-phase difficulty and feedback, whereas the final models for accuracy and RTs included only a random slope of feedback.
For Experiment 2, all three models included only a random slope of training condition. Confidence ratings and RTs were analyzed with linear mixed-effects models, for which we report F statistics and the degrees of freedom as estimated by Satterthwaite’s approximation. Accuracy was analyzed using a generalized linear mixed model, for which we report χ2 statistics. All model analyses were done using the lmerTest package (Kuznetsova et al., 2017) in RStudio (RStudio Team, 2019) using an alpha level of .05 for significance testing. In addition to these frequentist analyses, we calculated Bayes factors (BFs) using the BayesFactor package in R (Morey & Rouder, 2018) with default priors. A BF10 indicates data in favor of the null hypothesis (BF10 < ⅓), data in favor of the alternative hypothesis (BF10 > 3), and data that are uninformative (BF10 ≈ 1).
Computational model
Bounded evidence accumulation
We modeled the data using the drift-diffusion model (DDM), a popular variant of the wider class of accumulation-to-bound models. In the DDM, noisy evidence is accumulated, the strength of which is controlled by a drift rate v, until one of two boundaries, a or −a, is reached. Nondecision components were captured by a nondecision time ter parameter. To simulate data from the model, we used random walks as a discrete approximation of the continuous diffusion process of the drift-diffusion model (Ratcliff & Tuerlinckx, 2002). Each simulated random-walk process started at z * a (here, z was an unbiased starting point of 0), which terminated once the accumulated evidence reached either a or −a. At each time step τ, accumulated evidence changed by Δ with Δ given in Equation (1):

Within-trial variability is given by σ. In all simulations, τ was set to 1 ms, and σ was fixed to .1.
Accounting for prior beliefs
Within this model, confidence is given by mapping accumulated evidence, RT, and the choice on a two-dimensional heat map (as shown in Fig. 1) representing the probability of being correct for any given evidence level, time, and choice. Because confidence judgments were given after the choices in both experiments, we allowed for additional postdecision evidence accumulation following boundary crossing before quantifying confidence (Pleskac & Busemeyer, 2010). The duration of the postdecision evidence-accumulation process was sampled from the full confidence RT distribution observed during the test phase for each participant. The heat maps were constructed by computing the ratio between the probability densities of the amount of evidence accumulated with a given drift rate (μ > 0) and its opposite (−μ) at each time step (the inverse ratio is computed depending on the choice). An important aspect to consider is that these heat maps depend on the actual drift rate that is used to generate them; when generating heat maps with high versus low drift rates, the probability of being correct will be high versus low, respectively (because high drift rates are associated with higher accuracy and vice versa). To model prior beliefs, we assumed that the drift-rate parameter controlling the shape of the heat map can be different from the drift-rate parameter controlling objective performance. To avoid confusion, we refer to the former as the subjective drift rate (vs, formalizing the theoretical notion of prior beliefs) and the latter as the drift rate (v).
Qualitative-model fitting
We estimated vs for each participant and each prior belief condition by estimating which vs provides predictions about confidence that best match the feedback received by participants in the training phase. Note that in Experiment 1, feedback was given only once at the end of each training block (24 trials), so we equally assigned the feedback value presented at the end of a block to every trial within that block. To have access to the amount of accumulated evidence, we first simulated predictions of the observed trials in the training phase from DDM parameters fitted to the training data. Confidence predictions for those simulated trials were then quantified as the probability correct given time and evidence for the heat map generated by vs. The cost function was determined by the mean square error (MSE) between observed feedback and predicted confidence—

—with N representing the number of observed trials in the training phase for a given prior belief condition, oFBi the feedback received at trial i, and pCJi the confidence predicted for trial i. Each observed trial’s feedback was compared 24 times to new predictions to account for the stochastic nature of the DDM. Because generating a heat map is computationally costly, we generated 500 heat maps from values of vs ranging from 0 to .5. The MSE was then computed for each of these generated heat maps. Smoothing using the locally weighted scatterplot-smoothing method (LOWESS; Cleveland, 1981) was performed over the computed MSE for all vs to further reduce noise. The final estimated vs for each participant and prior belief condition was therefore equal to the one that generated the heat map with the minimum smoothed MSE.
Quantitative-model fitting
Quantitative-model predictions were produced by directly fitting our model to confidence ratings in the testing phase. An improved implementation of the heat-map generation allowed us to directly estimate the best-fitting vs instead of comparing the cost for several pregenerated values, as explained in the previous section. We estimated vs separately for each participant and prior belief condition. Because model confidence is given as a probability of being correct, we applied equal-width binning to map model predictions on the confidence-ratings scale. The biases and individual differences in mapping confidence on a categorical scale were accounted for by estimating an additional bias parameter separately for each participant but fixed over conditions. To estimate these parameters, we computed the proportion of trials falling in each confidence level separately for correct responses and errors. We then used a differential evolution algorithm, as implemented in the DEoptim R package (Mullen et al., 2011), to minimize the sum of squared error function shown in Equation 3:
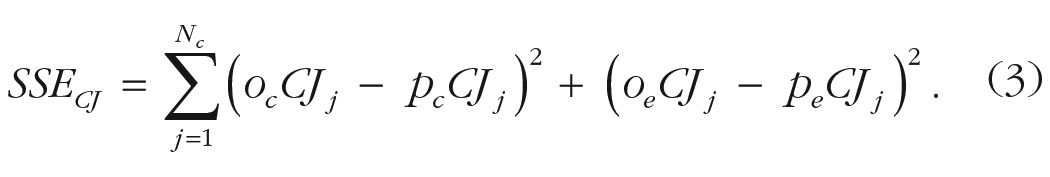
Here, Nc represents the number of confidence levels, ocCJj and pcCJj represent respectively the proportion of observed and predicted correct trials with confidence judgment j, and oeCJj and

Manipulating prior beliefs to causally induce under- and overconfidence. In Experiment 1—left column, (a), (c), and (e)—providing participants with comparative feedback during the training phase (i.e., indicating that they were performing better, equal, or worse than a reference group) left objective performance during the test phase unaffected (a), but induced under- and overconfidence, respectively (c). This effect was captured by our computational model, using both a quantitative fitting method (a, c; shaded bars) and qualitative (e) fitting method. These findings were replicated in Experiment 2—right column, panels (b), (d), and (f)—where prior beliefs were manipulated by differential difficulty levels during the training phase. Shaded bars reflect the model fits’ standard errors of the mean, behavioral data is represented by lines with error bars to reflect standard errors of the mean, and small dots in (c) and (d) reflect individual participants. Note that in (c) and (d), standard errors were too small to produce visible error bars. RT = reaction time.
DDM fitting
For each task and participant in the training data of Experiment 1 as well as in the test data of both experiments, we fitted five DDM parameters to the accuracy and RT data: three drift rates (v; one for each trial-difficulty level), the decision boundary (a) and the nondecision time (Ter). Because only one trial difficulty was presented per task in the training phase of Experiment 2, only one drift rate per task was fitted to the training data of Experiment 2, resulting in the estimation of three DDM parameters in this case. To estimate these parameters, we implemented quantile optimization. Specifically, we computed the proportion of trials in six groups, formed by quantiles .1, .3, .5, .7, and .9 of RT, separately for correct responses and errors. We used a differential evolution algorithm to minimize the following SSE—
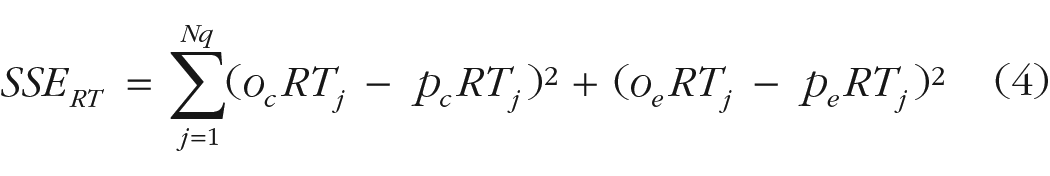
—with Nq representing the number of quantiles,
Results
To unravel the influence of prior beliefs on decision confidence, we carried out two experiments that aimed to causally influence participants’ prior beliefs about their ability to accurately perform the task. In both experiments, participants performed three similar perceptual decision-making tasks. Each task started with a training phase in which we manipulated participants’ prior beliefs in their ability to accurately perform the task. This was done by providing them with feedback indicating that their performance was good, average, or poor. In the subsequent test phase of each task (without comparative feedback in Experiment 1; without task differences in Experiment 2), we tested the influence of the manipulation on trial-by-trial confidence ratings. To account for the influence of prior beliefs on confidence, we fitted a computational model to the data in which belief about its ability to perform the task is based on earlier task experience, dissociated from its actual performance.
Experiment 1: Manipulating prior beliefs via comparative feedback causally induces under- and overconfidence
In Experiment 1 (N = 48), we used comparative feedback to influence prior beliefs about task performance. Participants were told that they would receive feedback every 24 training trials about their performance on the task, relative to a group of participants who had performed the same task at an earlier time. Unbeknownst to participants, feedback was manipulated so that for one task feedback indicated that the participant’s performance was better than most participants’ performance; that it was on average for the second task; and that it was worse than most participants’ performance for the third task (see Fig. 2). Because the feedback was not about performance per se but rather about participants’ supposed relative performance, we assumed that the insincerity of the feedback would be noticed less easily. More importantly, we suspected that comparative feedback would have a more profound impact on participants’ beliefs about their task performance than direct performance feedback would. Afterward, participants took part in a test phase during which they no longer received feedback but instead rated their perceived level of confidence on each trial. In both the training and the test phase, each task was composed of three levels of difficulty (see Method). In line with our main hypothesis, confidence ratings during the test phase depended on the feedback that participants received during the training phase, F(2, 47) = 16.65, p < .001, BF10 = 5.18e + 15 (see Fig. 3c). Participants reported a higher level of choice confidence after exposure to feedback indicating they had performed better (M = 4.79), average (M = 4.64), or worse (M = 4.41) compared to the reference group. This change in average confidence was mostly driven by an increase in “sure correct” ratings and a decrease in “guess correct” ratings after positive versus negative feedback (see Fig. S1 in the Supplemental Material available online; a–c). Likewise, participants tended to change their minds more often (i.e., reporting “guess error,” “probably error,” or “sure error”) after receiving negative compared to positive feedback (see Fig. S1, a–c). In addition to the effects of feedback, there was the expected effect of trial difficulty on confidence ratings, F(2, 47) = 159.71, p < .001, BF10 = 5.21e + 51. There was also a small interaction between feedback condition and trial difficulty, F(4, 30,744) = 2.60, p = .034, demonstrating that the influence of feedback on confidence slightly depended on trial difficulty, but this conclusion was not supported by the BF, which supported the null hypothesis (BF10 = 0.018). As can be seen in Figure 3c, the main effect of feedback condition was significant for all levels of stimulus difficulty (easy trials: F(2, 47) = 7.65, p < .01; average difficulty: F(2, 47) = 16.67, p < .001; hard trials: F(2, 47) = 19.78, p < .001). Importantly, the induction of prior beliefs selectively affected decision confidence but left objective performance unaffected. During the test phase, both accuracy and RTs were affected by trial difficulty—accuracy: χ2(2) = 2,421.63, p < .001, BF10 = 9.47e + 113; reaction times: F(2, 30,837) = 316.29, p < .001, BF10 = 752e + 10, but not by feedback condition—accuracy: χ2(2) = 0.3, p = .863, BF10 = 0.03; RTs: F(2, 47) = 2.06, p = .14, BF10 = 13.96 (see Fig. 3a). There were also no significant interactions between trial difficulty and feedback condition for objective performance—accuracy: χ2(4) = 4.528, p = .34, BF10 = 0.019; RTs: F(4, 30,837) = 1.024, p = .3930, BF10 = 0.014. Note that for the effect of feedback condition on RTs, the BF indicated evidence in favor of the alternative hypothesis. However, this difference seems to originate mostly from the negative condition, whereas the effect of confidence was clearly visible for all three feedback conditions and was not replicated in Experiment 2.
Interestingly, the effect of prior beliefs on confidence was quite persistent throughout the test phase. Each test phase comprised three blocks of 72 trials, separated by a break of 1 min. Analyzing the data of each block separately, the effect was remarkably consistent within each of the three blocks—Block 1: F(2, 48) = 21.79, p < .001, Mpositive = 4.79, Maverage = 4.60, Mnegative = 4.34; Block 2: F(2, 48) = 14.20, p < .001, Mpositive = 4.81, Maverage = 4.67, Mnegative = 4.44; and Block 3: F(2, 48) = 9.51, p < .001, Mpositive = 4.76, Maverage = 4.65, Mnegative = 4.46. However, there was a subtle decrease in the effect across time: When adding the factor “block” to the main model, including the data from all three blocks (see above), there was a significant interaction between block and feedback condition, F(4, 31,412) = 4.98, p < .001.
Experiment 2: Manipulating prior beliefs via differences in task difficulty during training
In Experiment 2 (N = 47), we altered prior beliefs about task performance by varying the difficulty of the task during the training phase. Participants were only trained on easy trials on one task, on trials of average difficulty on another task, and on difficult trials on a third task (Fig. 2b). Unlike Experiment 1, participants received genuine feedback about their choice accuracy (“wrong” or “correct”) on every trial. Critically, because of this difference in difficulty between tasks, we achieved a similar feedback pattern as in Experiment 1: On average, participants saw positive feedback on 95% of the trials (near-perfect performance), on 79% of the trials (average performance), or on 60% of the trials (slightly above chance performance) for the easy, average, and hard tasks, respectively. After the training phase, participants took part in a test phase that was identical to Experiment 1’s (i.e., three levels of difficulty per task, occurring in equal proportions). Despite the different approach in altering prior beliefs, the results fully replicated those of Experiment 1: Confidence ratings during the test phase depended on the difficulty level of the preceding training phase, F(2, 46) = 8.19, p < .001, BF10 = 121461028. Participants reported higher levels of confidence after previous training on an easy task (M = 4.88) versus a task of average difficulty level (M = 4.86) versus a difficult task (M = 4.64; see Fig. 3d). As in Experiment 1, this change was mostly driven by an increase in “sure correct” ratings and a decrease in “guess correct” ratings after training on easy versus difficult trials (for histograms of the actual ratings, see Fig. S1, d–f, in the Supplemental Material). Changes of mind (“guess error,” “probably error,” or “sure error”) were also more common after training on a difficult task compared to an easy task (see Fig. S1, d–f). As expected, trial difficulty during the test phase also had an effect on confidence ratings, F(2, 30,109) = 2,122.11, p < .001, BF10 = 1.77083e + 64, with no interaction between both, F(4, 30,109) = 1.64, p = .16, BF10 = 0.02. The effect of training phase difficulty was significant for all levels of testing-phase difficulty—easy testing trials: F(2, 46) = 3.54, p = .037; average testing trials: F(2, 46) = 8.50, p < .001; hard testing trials: F(2, 46) = 9.5, p < .001. Again, our manipulation left task performance unaffected. Accuracy and RTs were significantly influenced by testing-phase trial difficulty—accuracy: χ2(2) = 3,090.93, p < .001, BF10 = 2.013009e+163; RTs: F(2, 30,109) = 563.52, p < .001, BF10 = 2.727619e+16—but not by the training-phase difficulty conditions—accuracy: χ2(2) = .03, p = .99, BF10 = 0.09; RTs: F(2, 46) = 0.01, p = .99, BF10 = 0.03 (see Fig. 3b). Again, the interaction between both factors was not significant for objective performance—accuracy: χ2(4) = 1.6, p = .81, BF10 = 0.012; RTs: F(4, 30,109) = 1.52, p = .19, BF10 = 0.01.
As in Experiment 1, the influence of prior beliefs on confidence persisted across time. When adding block to the analysis on confidence reported earlier, there was no significant interaction between training condition and block, F(4, 30,091) = 2.3, p = .056, and the effect was remarkably consistent across all three blocks—Block 1: F(2, 80) = 15.97, p < .001, Measytraining = 4.88, Mmediumtraining = 4.87, Mdifficulttraining = 4.60; Block 2: F(2, 81) = 9.83, p < .001, Measytraining = 4.87, Mmediumtraining = 4.84, Mdifficulttraining = 4.65; Block 3: F(2, 82) = 10.69, p < .001, Measytraining = 4.90, Mmediumtraining = 4.87, Mdifficulttraining = 4.67.
Introducing prior beliefs into probabilistic confidence models
In order to address the underlying mechanisms by which prior beliefs influence the reported level of confidence, we turned toward computational models of decision confidence. We focused on accumulation-to-bound models, a family of models that have successfully accounted for choices, RT, and confidence (Desender et al., 2021; Kiani & Shadlen, 2009; Zylberberg et al., 2016). Accumulation-to-bound models, such as the DDM, describe decision-making as the noisy accumulation of evidence until a decision boundary is reached, at which point a response is triggered. The rate of evidence accumulation is controlled by the drift rate (v), representing the efficiency of information extraction from the stimulus. To account for decision confidence within such a model, researchers have argued that confidence reflects the probability of a choice being correct, conditional on the state of the accumulator (i.e., the amount of evidence accumulated), the decision time, and the choice (Desender et al., 2021; Kiani et al., 2014; Moreno-Bote, 2010). In Figure 1, this is represented by the heat maps that visualize how different combinations of evidence (y-axis) and time (x-axis) are associated with different levels of confidence (darker colors are associated with lower confidence). Importantly, when the perceived probability of being correct matches the actual probability of being correct, such a model cannot account for biases in confidence that are independent from objective performance (such as under- and overconfidence). Intuitively, this occurs because the model’s beliefs about its performance match its actual performance. In a typical evidence-accumulation model, task performance is controlled by the drift-rate parameter. Importantly, the drift rate also controls the shape of the two-dimensional heat map representing probability correct for any given evidence level, time, and choice (see Fig. 1). Thus, higher drift rates will generate heat maps with a higher probability of being correct than lower drift rates, because high drift rates are associated with higher accuracy and vice versa. To allow for dissociations between actual and perceived performance, we propose that participants have an imperfect approximation of the probability of being correct (which can be manipulated via comparative feedback or differential training difficulty). Thus, we differentiate between beliefs about performance and actual performance, explicitly incorporating prior beliefs into the computation of decision confidence (for a similar implementation, see Khalvati et al., 2021). In a similar vein, other work has already demonstrated the importance of considering dissociations between participants’ internal model of the world and the external evidence (e.g., Fleming & Daw, 2017; Khalvati et al., 2021). For example, Khalvati et al. (2021) were able to show that common discrepancies between confidence and choice accuracy can be explained by assuming a wrong model of the world. Although Khalvati et al. used a Bayesian framework, the similarity between DDM and Bayesian models has been established (Bitzer et al., 2014). Formally, we propose to parameterize the computation of the probability of being correct and thereby provide a solution as to how individuals integrate previous experience with the current task to form prior beliefs about current performance. To achieve this, we propose a dissociation between the drift rate controlling objective task performance and the subjective drift rate controlling the shape of the heat map (i.e., representing probability correct). This subjective drift rate can be thought of as a formalization of prior beliefs (inverting the heat map into a single parameter), reflecting how well participants think they perform at a task rather than how they actually perform (see the Method section for full details). Thus, different values for the subjective drift rate will give rise to different, unique probability maps, corresponding to different, unique prior beliefs. By assigning different values to the subjective drift rate while leaving the other parameters of the model unaffected, this proposal can in principle explain how conditions with identical objective task performance (i.e., same drift rates) but different prior beliefs (i.e., different subjective drift rates) can lead to differences in subjective confidence. That is precisely the pattern of behavior observed in both experiments: In Experiment 1, participants were faced with false comparative feedback in the training phase, in the sense that it misinformed them about the positioning of their task performance relative to the performance of others. In Experiment 2, as participants were exposed in the training phase to only one of the three difficulty levels subsequently experienced in the test phase, they received an accurate, yet necessarily biased, sample of the heat map.
Modeling the effect of prior beliefs on decision confidence
Quantitative-model fitting
To validate the prediction of our model that differences in subjective confidence, but not task performance, can be captured by a change in subjective drift rate only, we fitted our model to the performance and confidence ratings observed in the testing phase. Given that there was no effect of the comparative-feedback or training-difficulty manipulations on performance, we estimated DDM parameters (v, a and ter) on the basis of testing-phase accuracy and RT data separately for each participant with fixed DDM parameters over conditions. Subjective drift rate was estimated separately for each participant and prior belief condition based on the empirical confidence ratings in the testing phase. Model-predicted confidence was separated into partitions of 6 equal intervals in order to be mapped on the same 6-point scale as the confidence ratings. We fitted an additional confidence bias parameter to account for the specific mapping from continuous probabilities to the categorical ratings that participants made. Importantly, this parameter was fixed over conditions, so that each participant had only one bias parameter. As an alternative to our explanation that the effect of our prior belief manipulations on confidence is best accounted for by a change in subjective drift rate, we fitted two alternative candidate models. In the first alternative model, a confidence bias parameter was allowed to vary between training conditions, and instead of having a subjective drift rate, the probability map used to quantify confidence was calculated on the basis of the mean of objective drift rates estimated from all difficulty levels. Hence, in this model the shift in confidence across conditions can be accounted for only by an overall shift in confidence bias. In the second alternative model, both subjective drift rate and confidence bias were allowed to vary between training conditions. Formal model comparison using BIC showed that in both Experiment 1 and Experiment 2, the model in which only subjective drift rate was allowed to vary across training conditions provided the best fit to the data (see Table 2). This result shows that the influence of training conditions on confidence is best accounted for by a selective change in participants’ belief about their own performance and not by a simple change in confidence bias.
Formal Model Comparison
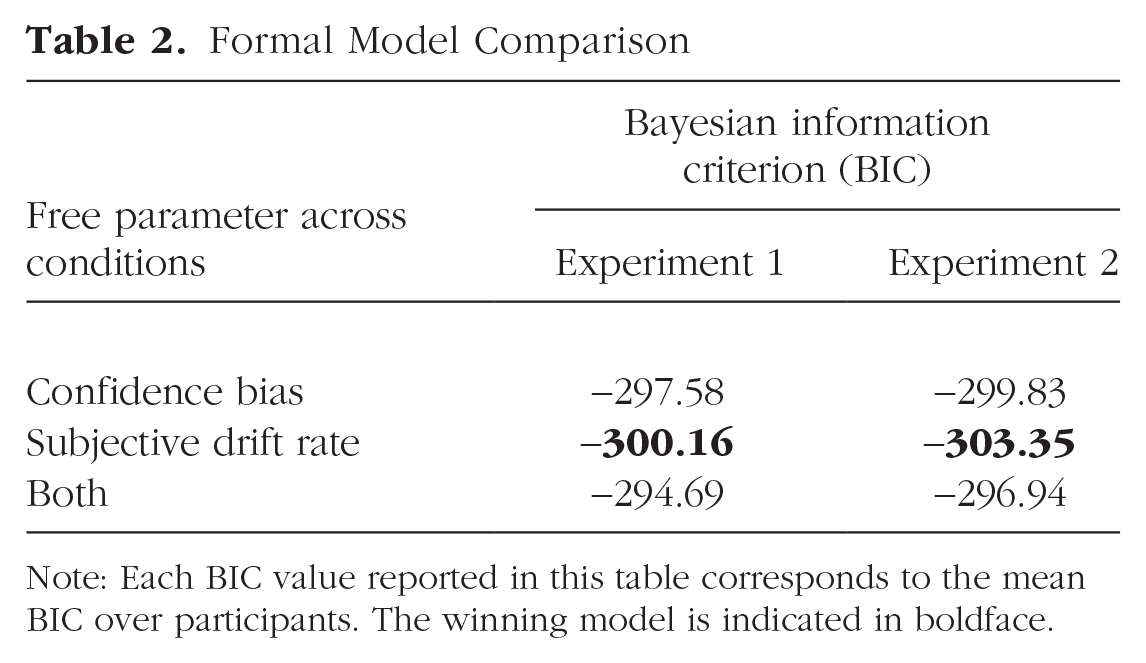
Note: Each BIC value reported in this table corresponds to the mean BIC over participants. The winning model is indicated in boldface.
Next, we analyzed simulated data from our best model to assess its ability to capture behavioral results. As can be seen in Figures 3a through d, model fits closely tracked empirical accuracy, RTs, and confidence ratings. Importantly, simulated confidence ratings from the best-fitting parameters showed the same pattern as the empirical data. Simulated confidence ratings increased both with increasingly positive feedback presented in Experiment 1, F(2, 48) = 6.92, p = .002, BF10 = 7.4838542e+7, and with easier training difficulty in Experiment 2, F(2, 47) = 7.02, p = .002, BF10 = 1.93840824e+8. Simulated confidence ratings were also influenced by trial difficulty in both Experiment 1, F(2, 48) = 194.27, p < .001, BF10 = 8.145035e+36, and Experiment 2, F(2, 47) = 251.68, p < .001, BF10 = 1.978466e+61. Last, identical to behavioral data, no interaction was found between prior belief condition and trial difficulty—Experiment 1: F(4, 30,306) = 1.07, p = .37, BF10 = 0.01; Experiment 2: F(4, 29,519) = 0.38, p = .82, BF10 = 0.01. See the Supplemental Material for model fits at the participant level.
Qualitative-model fitting
In the previous section, we demonstrated that our computational model was able to capture the influence of prior beliefs on confidence by assuming a change in subjective drift rate between the different conditions. We next show that our model can also account for the influence of prior beliefs on confidence even when it is blind to empirical confidence ratings. In this section, our model was exposed to the same training conditions as participants and was then asked to predict confidence judgments on the basis of the performance in the testing phase. We estimated the subjective drift rate, per participant and per task, using the data of the training phase. To do so, we estimated DDM parameters (Ratcliff & McKoon, 2008) using the training-phase data and generated simulations using these parameters. We estimated which subjective drift-rate parameter provided confidence predictions that were in line with the feedback presented to participants. As expected, when the model was exposed to negative feedback, the estimated subjective drift rate was lower than when the model was exposed to positive feedback, F(2, 94) = 450.02, p < .001 (Experiment 1, Fig. 4a). Likewise, when the model was trained on a difficult task, the estimated subjective drift rate was lower compared to when the model was trained on an easy task, F(2, 92) = 64.97, p < .001 (Experiment 2, Fig. 4e). Second, to demonstrate that our feedback and training manipulations selectively influenced subjective drift rate but left objective performance unaffected, we next estimated the parameters of our accumulation-to-bound model on the basis of the test-phase data as well. The estimated parameters did not vary with the feedback conditions in Experiment 1 (all ps > .36, Figs. 4b–d), nor were they influenced by the differential training difficulty in Experiment 2 (all ps > .31, Figs. 4f–h). Thus, our model was able to generate different levels of prior beliefs about task performance after seeing fake comparative feedback (Experiment 1) or performing tasks of differential training difficulty (Experiment 2).

Manipulating prior beliefs selectively influences subjective drift rate. In Experiment 1, the subjective drift rate (a), which reflects the prior belief about performance, increased when the model was exposed to increasingly positive feedback. The feedback conditions in the training phase did not influence the other parameters of the evidence-accumulation model (b–d). Similarly, in Experiment 2 (e–h), only the subjective drift rate was sensitive to the differential training difficulty. Gray dotted lines represent individual participants, solid black lines represent the mean, and error bars reflect standard errors of the mean.
Third, we finally tested whether this difference in prior belief induced during the training phase was sufficient to capture under- and overconfidence in the test phase. To do so, we checked model predictions that were based on the DDM parameters obtained from the fit to the data of the test phase, using the subjective drift rate that was estimated from the data of the training phase. Note that we could not estimate the DDM parameters using the training-phase data in Experiment 2 because in that phase participants performed only one of the three difficulty levels encountered during the testing phase. Therefore, although the subjective drift rate was estimated on the basis of the training-phase data, the DDM parameters were estimated using the testing-phase data. For the sake of consistency, we followed the same approach for Experiment 1. It is important to stress that using this approach, instead of fitting our model to empirically observed confidence data, we generated model predictions from a model that was merely exposed to the same feedback as the participants. Thus, our model was effectively blind to the empirical confidence judgments. As expected, for both Experiment 1 and Experiment 2 (Fig. 3e), the model predicted increases of confidence with increasingly positive feedback, F(2, 47) = 274.10, p < .001 (Experiment 1), and lower task difficulty during the training phase, F(2, 46) = 91.00, p < .001 (Experiment 2). Additionally, the model also predicted the expected increase of confidence with lower testing-trial difficulty—Experiment 1: F(2, 47) = 168.06, p < .001; Experiment 2: F(2, 46) = 198.90, p < .001. Finally, for both experiments there was an interaction between both factors—Experiment 1: F(4, 30,639) = 110.46, p < .001; Experiment 2: F(4, 29,894) = 83.45, p < .001—reflecting that the model predicted the effect to be slightly smaller with difficult trials. In sum, we successfully accounted for expressions of under- and overconfidence within accumulation-to-bound models by taking into account prior beliefs.
Discussion
The current work provides direct evidence that underconfidence and overconfidence for perceptual decisions arise from prior beliefs about the ability to perform a task. In two experiments, a manipulation of prior beliefs causally influenced reported confidence. This was accounted for by extending probabilistic models of confidence with a subjective drift rate, explicitly representing prior beliefs. Our behavioral manipulations selectively influenced the model’s prior belief, in turn accounting for under- and overconfidence as observed empirically.
The mechanism behind under- and overconfidence
In the last decade, numerous studies have investigated how to explain confidence within decision-making models. Although most work focused on quantifying confidence sensitivity (Fleming & Lau, 2014), the computational mechanisms underlying under- and overconfidence remain poorly understood. For example, signal-detection theory (Green & Swets, 1966) models confidence biases by changing the criteria that dissociate high from low confidence (Rahnev, 2021). However, this is merely descriptive and does not provide fundamental insight into the computational underpinnings. To tackle this, we relied on accumulation-to-bound models that explain confidence as the posterior probability of being correct given time and evidence (Zylberberg et al., 2016). Notwithstanding previous suggestions that prior experience might be important to understand deviations in confidence (Drugowitsch et al., 2014; Khalvati et al., 2021; Moreno-Bote, 2010), empirical evidence for this claim has been lacking. Here, we provide the first empirical demonstration that inducing under- and overconfidence by changes in prior beliefs can be readily accounted for within dynamic probabilistic models. Interestingly, recent work (Olawole-Scott & Yon, 2023) has found very similar results to the results of our Experiment 2, yet the authors explained their findings in terms of expected precision of the stimuli rather than expected performance. As support for this claim, they showed that a manipulation of expected precision also influences the reported level of subjective visibility, a finding that does not trivially follow from the computational account put forward here. Conversely, however, the influence of comparative feedback on confidence that we observed does not trivially follow from their account, either.
An elegant solution to this issue is to assume that humans can form prior beliefs at different levels of the processing hierarchy—for example, at higher levels about their overall task ability and at lower levels about the expected precision of perceptual stimuli. In both cases, these prior beliefs then influence subjective judgments, such as confidence and visibility reports. We modeled our results both quantitatively (fitting our model directly to the empirical confidence) and qualitatively (exposing the model to the same training conditions as participants and querying qualitative predictions). Both methods successfully captured our empirical finding that both comparative feedback and different training difficulties affected subsequent confidence ratings. Our quantitative method fitted the empirical data closely, capturing subtle patterns such as the closeness between the easy and medium conditions in Experiment 2. In contrast, our qualitative method predicted stronger effects than those actually observed and predicted an interaction between training condition and testing-phase difficulty that was lacking in the empirical data. Still, it is not trivial that a model that was effectively blind to the empirical confidence judgments successfully captured the main empirical finding. It is important to note that during qualitative fitting our model started from a blank slate (i.e., without any preconceptions), building its prior beliefs entirely from the feedback. Real participants likely come to the experiment with preexisting prior beliefs, and our experimental manipulations ride on top of these. This likely makes participants less sensitive to the manipulations than the predictions of the qualitative model would suggest, which explains the slight differences with the qualitative-model predictions. Additionally, our model assumed perfect feedback integration, as opposed to the presumably leaky feedback integration in humans.
Nevertheless, despite these simplifications, our qualitative-model predictions reflected the empirical findings. Notably, because our modeling framework builds on existing accumulation-to-bound models, it can also account for empirical findings that were previously accounted for within accumulation-to-bound models (e.g., statistical signatures of confidence; Desender et al., 2021). Moreover, because of the addition of a subjective drift rate, our model can flexibly account for other empirically established phenomena, such as the hard–easy effect (Baranski & Petrusic, 1994) or confidence leak (Rahnev et al., 2015) and confidence-accuracy dissociations such as blindsight (Weiskrantz et al., 1974) and change blindness (Levin et al., 2000). Although our lab-based prior belief induction is slightly artificial, one can imagine how this might operate in real life. Spontaneous exposure to comparative feedback (cf. Experiment 1) or engaging in difficult versus easy tasks (cf. Experiment 2) will result in different prior beliefs and hence different confidence ratings.
The interplay between local and global confidence
Our findings are closely linked to global decision confidence (Rouault et al., 2019): the general, subjective feeling about the ability to perform a task, spanning a broader timescale than trial-specific local confidence. Given the clear resemblance between global confidence and the concept of prior beliefs and subjective drift rate discussed here, our findings suggest a direct influence of people’s prior beliefs about task performance (global confidence) on how people believe they will perform on individual trials (local confidence). Interestingly, when lacking trial-by-trial feedback, participants compute global confidence by integrating local confidence judgments (Rouault et al., 2019), revealing an intriguing interplay between local and global confidence. Therefore, it could be that causally inducing prior beliefs might have a long-lasting effect on local confidence through a self-sustaining loop between the two. Our current data already demonstrate that prior beliefs affected local confidence even in the third (final) test block (72 trials), indicating a long-lasting effect rather than a temporary boost or lapse in self-confidence. This interplay between local and global confidence would naturally give rise to a phenomenon known as confidence leak (Rahnev et al., 2015), the finding that confidence on the current trial influences confidence on the next trial. Specifically, when participants’ prior belief about their ability to perform a task is not stable across the experiment (e.g., because of feedback), this would give rise to autocorrelation in confidence judgments. Future work might address whether the persistent nature of prior beliefs on local decision confidence is indeed mediated by global confidence and whether this gives rise to confidence leak. Because impaired confidence on perceptual tasks has been linked to a variety of psychiatric symptoms (Hoven et al., 2019), uncovering the mechanisms behind these persistent biases could provide important new insights for clinical practice. Moreover, our prior belief manipulations could be leveraged to examine whether it is possible to aid individuals with low confidence (which is, for example, typically seen in anxiety disorders) to recalibrate their confidence estimation on simple perceptual tasks. Building on the interactions between local and global confidence, this could potentially be a first step toward a recalibration of overall confidence.
Dissociations between accuracy and confidence
Dissociations between confidence and accuracy are well documented (Rahnev, 2021; Vaghi et al., 2017). For example, whereas choices are equally informed by choice-relevant and choice-irrelevant information, decision confidence mostly reflects choice-relevant information (Peters et al., 2017), and variance has a more profound effect on confidence than on decisions (Desender et al., 2018). Importantly, these observations are often treated as evidence for the existence of a metacognitive module existing separately from the decision-making circuitry (Fleming & Daw, 2017; Mamassian & de Gardelle, 2021). Here, we reported a clear dissociation between accuracy and confidence, but our interpretation of these findings does not require a separate metacognitive processing stream: We explained decision confidence within the decision circuitry simply by changing the prior beliefs within this framework (Khalvati et al., 2021). One could argue, still, that the process of forming (and updating) prior beliefs is the work of a metacognitive module. However, contrary to the modules described in earlier works (Fleming & Daw, 2017; Mamassian & de Gardelle, 2021), our module is rooted within the decision-making process. In other words, our model does not assume processing of metacognitive evidence independent of and parallel to the processing of sensory evidence. All in all, our findings add to the ongoing debate about the need for a separate metacognitive module to explain confidence-accuracy dissociations, demonstrating that both can operate on one stream of data.
Counterfactual confidence
One interesting discussion point is the extent to which participants consciously reported different confidence levels for the same levels of evidence. Especially in Experiment 1, the postexperiment debriefing indicated that 18 out of the 49 participants were aware of the influence the comparative feedback had on their confidence ratings, explicitly stating that positive feedback made them feel more confident and negative feedback less confident. Notably, additional analyses showed no difference between these and the other participants in terms of our manipulation’s effect on confidence. This raises an intriguing question about whether participants immediately computed the level of confidence they eventually reported (i.e., modulated by prior beliefs) or whether they initially computed the “unbiased” probability of being correct and strategically lowered or increased this rating depending on their prior beliefs. The latter would imply that participants possess an unbiased confidence representation, which could be used for alternative purposes (see also “counterfactual confidence”; Zylberberg et al., 2018). Similar to the representation of confidence based on external feedback that our model described, this unbiased representation could be formed similarly from an unbiased internal feedback signal. Moreover, in social contexts it is known that people can sometimes feel very confident (or not very confident) but for social reasons will decide to report a higher (or lower) level of confidence (Bang et al., 2022). Our model could explain such phenomena by assuming that the decision-maker holds an explicitly aware bias between the actual computation and the reporting of confidence.
Suggestions for future research
We tested the hypothesis that underconfidence and overconfidence arise from prior beliefs in two separate perceptual decision-making experiments using two samples of college students. Although the use of simple perceptual tasks allowed us to uncover the fundamental mechanisms behind under- and overconfidence, our results are currently still limited to the domain of perceptual metacognition. Thus, to further confirm the generality of our claim, future research should investigate prior beliefs in other domains (e.g., memory, learning) and finally in real-life decision-making (e.g., economic decision-making). Moreover, the current study used a convenience sample of college students, limiting immediate generalizability to the wider population. In future research, it would be interesting to see how susceptible a more general sample of participants would be to the prior-belief manipulations employed in our study and whether the results we report are generalizable to the wider population. Our comparative feedback manipulation (Experiment 1) could be particularly helpful for studying confidence in group decision-making. Research on group decision-making shows that decision makers automatically communicate their confidence (Bahrami et al., 2010), with opinions expressed with higher confidence gaining more weight (Zarnoth & Sniezek, 1997), and multiple studies detail how groups unify different expressions of individual confidence and cope with individual biases in confidence (Bang et al., 2017). Thus, it would be interesting to see how manipulations of prior beliefs, inducing under- or overconfidence, would change the content and extent of social confidence sharing.
Conclusion
We have demonstrated that a manipulation of prior beliefs in task performance, either through comparative feedback or through changes in task difficulty, causally influences subsequent decision confidence for perceptual decisions. This was well accounted for within a dynamic probabilistic model by changing the model’s prior belief. Our findings provide a mechanistic understanding of under- and overconfidence.
Supplemental Material
sj-jpeg-1-pss-10.1177_09567976241231572 – Supplemental material for Manipulating Prior Beliefs Causally Induces Under- and Overconfidence
Supplemental material, sj-jpeg-1-pss-10.1177_09567976241231572 for Manipulating Prior Beliefs Causally Induces Under- and Overconfidence by Hélène Van Marcke, Pierre Le Denmat, Tom Verguts and Kobe Desender in Psychological Science
Supplemental Material
sj-jpeg-2-pss-10.1177_09567976241231572 – Supplemental material for Manipulating Prior Beliefs Causally Induces Under- and Overconfidence
Supplemental material, sj-jpeg-2-pss-10.1177_09567976241231572 for Manipulating Prior Beliefs Causally Induces Under- and Overconfidence by Hélène Van Marcke, Pierre Le Denmat, Tom Verguts and Kobe Desender in Psychological Science
Supplemental Material
sj-jpeg-3-pss-10.1177_09567976241231572 – Supplemental material for Manipulating Prior Beliefs Causally Induces Under- and Overconfidence
Supplemental material, sj-jpeg-3-pss-10.1177_09567976241231572 for Manipulating Prior Beliefs Causally Induces Under- and Overconfidence by Hélène Van Marcke, Pierre Le Denmat, Tom Verguts and Kobe Desender in Psychological Science
Supplemental Material
sj-jpeg-4-pss-10.1177_09567976241231572 – Supplemental material for Manipulating Prior Beliefs Causally Induces Under- and Overconfidence
Supplemental material, sj-jpeg-4-pss-10.1177_09567976241231572 for Manipulating Prior Beliefs Causally Induces Under- and Overconfidence by Hélène Van Marcke, Pierre Le Denmat, Tom Verguts and Kobe Desender in Psychological Science
Footnotes
Transparency
Action Editor: Leah Somerville
Editor: Patricia J. Bauer
Author Contributions
The first two authors contributed equally to this work.
References
Supplementary Material
Please find the following supplemental material available below.
For Open Access articles published under a Creative Commons License, all supplemental material carries the same license as the article it is associated with.
For non-Open Access articles published, all supplemental material carries a non-exclusive license, and permission requests for re-use of supplemental material or any part of supplemental material shall be sent directly to the copyright owner as specified in the copyright notice associated with the article.