



Abstract
The tendency for people to consider themselves morally good while behaving selfishly is known as moral hypocrisy. Influential work by Valdesolo and DeSteno (2007) found evidence for intergroup moral hypocrisy such that people were more forgiving of transgressions when they were committed by an in-group member than an out-group member. We conducted two experiments to examine moral hypocrisy and group membership in an online paradigm with Prolific workers from the United States: a direct replication of the original work with minimal groups (N = 610; nationally representative) and a conceptual replication with political groups (N = 606; 50% Democrats and 50% Republicans). Although the results did not replicate the original findings, we observed evidence of in-group favoritism in minimal groups and out-group derogation in political groups. The current research finds mixed evidence of intergroup moral hypocrisy and has implications for understanding the contextual dependencies of intergroup bias and partisanship.
Hypocrisy is not a way of getting back to the moral high ground. Pretending you’re moral, saying you’re moral is not the same as acting morally.
Although most people hold themselves to a moral code, they are also able to commit immoral acts (Hofmann et al., 2014). These acts may range from the mundane, such as cutting in line, to the extreme, such as shocking someone nearly to death (Milgram, 1963). Regardless, people continue to consider themselves moral beings even after committing immoral acts—a phenomenon termed “moral hypocrisy” (Batson et al., 1997, 2002). Moral hypocrisy may stem from the psychological need to reframe one’s own immoral actions to justify self-identification as moral beings (Shalvi et al., 2011, 2015). Critically, however, both one’s moral sense and moral identity are heavily influenced by the social groups they belong to (Graham et al., 2009; Van Bavel et al., 2023). Social groups exert a powerful influence such that people are likely to favor in-group members and derogate out-group members (Balliet et al., 2014; Leach et al., 2003; Rathje et al., 2021; Tajfel et al., 1979). Therefore, in the current research we ask the question: Does moral hypocrisy extend beyond individuals to groups?
Influential work in this area has found that group identity shapes moral hypocrisy (Valdesolo & DeSteno, 2007). Using an elegant study design, Valdesolo and DeSteno found that the same immoral action (assigning an easy task to oneself and an onerous task to someone else) was judged to be more fair when the participant themselves, or a member of the participant’s in-group, was the perpetrator. It was seen as more unfair when the same action was perpetrated by an out-group member. In other words, the moral hypocrisy that people allow themselves also extends to in-group members.
This work suggests that judgments of others’ moral behavior are susceptible to intergroup bias. Moral hypocrisy has social consequences such that those who are viewed as hypocritical deserve more punishment for a transgression compared with nonhypocrites (Barden et al., 2005; Effron et al., 2018). Moral hypocrites are also seen as free riders because they outwardly signal their own purported morality to gain social status but do not incur the costs of truly behaving morally (Jordan et al., 2017; Tosi & Warmke, 2020). In the political realm, politicians’ moral hypocrisy reduces judgments of their competency and elicits negative emotions such as anger from constituents (McDermott et al., 2015; von Sikorski & Herbst, 2020). Thus, real-world moral hypocrisy may heighten negative emotions and contribute to affective political polarization (Finkel et al., 2020).
We sought to replicate Valdesolo and DeSteno’s findings to determine whether they generalized to a new sample and a different social identity over a decade later. We improved the methodology in three main ways: by increasing the sample size and statistical power, by adding new explanatory analyses, and by extending the finding to real-world groups to evaluate external validity. First, the original article had a relatively small sample size: The total sample size (N) in the study was 76, which was split into four conditions (providing 19 participants in each cell). The reported effect size was d = 1.11, which is large for a social-psychological study, in which the average effect size is closer to d = 0.4 (Richard et al., 2003). In the original article, the researchers also excluded participants who behaved fairly or altruistically. However, subsetting after random assignment on the basis of participant responses is not statistically sound without robustness checks (Lachin, 2000). Thus, we adopted an intent-to-treat methodology in which all participants are included in our analyses. For robustness, we also replicated the statistical analysis from the original study using listwise deletion of the altruists. 1
Second, the original experiment used a minimal group procedure, in which people are assigned to arbitrary groups (Tajfel et al., 1971). Although the minimal group design offers a well-controlled test of the moral-hypocrisy effect, it is unclear whether intergroup moral hypocrisy would generalize to real-world groups, in which moral hypocrisy appears to be quite prevalent (Cottle, 2021; Wolsky, 2022). Thus, we attempted to replicate the intergroup moral-hypocrisy effect in both minimal groups and natural groups to increase external validity. In everyday life, moral conflict is most likely to occur between groups that have historical and/or sociological origins such as religion (Ginges et al., 2007) or political affiliation (Brady et al., 2020; Finkel et al., 2020). Prior research suggests that people hold moral double standards regarding their political in-groups and out-groups (Claassen & Ensley, 2016; Eriksson et al., 2019; Solomon et al., 2019). Furthermore, people are more likely to downplay an in-group member’s moral transgressions when they themselves are highly identified with the group (Iyer et al., 2012). Therefore, we conducted a novel experiment in which partisans were separated on the basis of their political-party identification (i.e., Democrats or Republicans). This contributes to growing research on moral hypocrisy in real-world groups (McDermott et al., 2015; von Sikorski & Herbst, 2020; Wolsky, 2022).
Statement of Relevance
Social identities and group memberships influence social judgment and decision-making. Prior research has found that social identity influences moral decision-making such that people are more likely to forgive moral transgressions perpetrated by their in-group members than similar transgressions from out-group members (Valdesolo & DeSteno, 2007). The current research sought to replicate this pattern of intergroup moral hypocrisy using minimal groups (mirroring the original research) and political groups. Although we were unable to replicate the findings from the original article, we found that people who are highly identified with their minimal group exhibited in-group favoritism, and partisans exhibited out-group derogation. This work contributes both to open-science replication efforts and to the literature on moral hypocrisy and intergroup relations.
Third, we examined the moderating effect of strength of collective identification on intergroup moral hypocrisy. Prior work suggests that the strength of one’s identification with their in-group is associated with increased perceived in-group homogeneity and out-group derogation (Branscombe et al., 1999; Hornsey, 2008; Leach et al., 2003). For example, people judge out-group behaviors more harshly when they are high in collective narcissism—a defensive belief about one’s own in-group’s greatness (Bocian et al., 2021). Therefore, we examined whether one’s level of collective identification is related to intergroup moral hypocrisy.
We also modified the experiment to occur online to obtain a sufficiently large sample size. Thus, this replication also explores whether the moral-hypocrisy effect can be induced in an online context. Although the original experiment used two confederates to deceive participants into believing that they were interacting with other participants, we used a real online chat room in which participants interacted with three other participants. This change has a number of benefits. First, it eliminated the need for confederates. Second, we labeled each participant with their group identity (i.e., participants were designated “Overestimator-1” or “Underestimator-2”) to make their group membership salient. Similar measures were taken in the original study but were not included because of the short report format. 2 Otherwise, we followed the original procedure almost exactly.
Overview
In two experiments, we planned to replicate and extend the original research on intergroup moral hypocrisy (Valdesolo & DeSteno, 2007). In the original article, the authors performed a contrast analysis that examined whether people who made judgments about themselves or their in-groups were significantly more fair than people who judged unaffiliated others or out-group members. This is the main analysis that we replicated in our experiment. Thus, we hypothesized that people would evaluate themselves and their in-groups more fairly than unaffiliated others and out-group members (Hypothesis 1). For the original study to be replicated, Hypothesis 1 must be confirmed in Experiment 1 (with minimal groups). In addition to the original analysis, we hypothesized that people’s evaluations of their own fairness would be greater than their evaluations of others’ fairness after committing the same moral transgression (Hypothesis 2). We further hypothesized that people would evaluate their in-group members as more fair than out-group members after committing the same moral transgressions when the “self” and “other” conditions are excluded from the analysis (Hypothesis 3).
We also included some key extensions to the original research. We hypothesized that Hypotheses 1 through 3 would be confirmed when in-groups and out-groups were defined by both minimal groups and natural groups (political-party identification; Hypothesis 4). We also hypothesized that the group-based moral-hypocrisy effect (Hypothesis 3) would be stronger for natural groups than minimal groups (Hypothesis 5). Finally, we hypothesized that the strength of collective identification would moderate moral hypocrisy such that people who were strongly identified with their political in-group would rate their in-group member’s actions as more fair (Hypothesis 6a) and their out-group member’s actions as less fair (Hypothesis 6b) than people who were weakly identified. However, we could find a “black-sheep effect” by which people who were highly identified with their groups judge in-group members more harshly for committing a moral transgression (Marques & Paez, 1994). This effect may also depend on political ideology—prior work suggests that conservatism is associated with out-group punishment, whereas liberalism is associated with in-group punishment (Leshin et al., 2022). Thus, we examined the effect of both political extremism and political ideology on the level of in-group and out-group fairness judgments in an exploratory analysis.
Open Practices Statement
This work is a preregistered replication and thus went through peer review both before and after data collection. The data and analysis scripts for these experiments are deidentified and publicly accessible on the OSF at https://osf.io/wzduf.
Method
Participants
Ethics approval for both Experiments 1 and 2 was obtained from the New York University Institutional Review Board. To increase the statistical power from the original article, we increased the sample size in both Experiments 1 and 2 (see Brandt et al., 2014). To find out how many participants we needed to recruit, we conducted a power simulation in R (Version 4.2.1; R Core Team, 2022), assuming the average medium effect size common in social psychology (d = 0.4; Lovakov & Agadullina, 2021; Richard et al., 2003). The original study reported an effect size of 1.11, which would be considered very large for a psychology study (Cohen, 1992). Because we replicated the experiment in an online context in which the manipulation may be less impactful, we chose to be conservative in our effect size estimate.
Because our analyses have multiple steps and complex decision rules, we calculated power on the basis of simulated data. 3 First, we simulated data on the basis of the means from the original study with an effect size one third the size of the original study (i.e., d = 0.4 rather than d = 1.11). We then ran the contrast analysis for Hypothesis 3 on our simulated data and recorded the p value and effect size. We repeated this process 1,000 times for various sample sizes. Assuming d = 0.4, with 520 total participants we would achieve 92% power with an alpha of .05 to detect significant differences in our planned contrasts. We also ran a power analysis for equivalence testing (specifically two one-sided t tests) using the TOSTR R package function powerTOSTone. We tested whether we would have the power to reject the presence of effects of d > 0.2. According to this power analysis, with an alpha of .05 and the proposed sample size of 520, we would achieve 97% power.
Therefore, we planned for each cell in both Experiments 1 and 2 to have at least a sample size of 130. We planned to achieve a sample size of 520 using the online survey platform Prolific because of their large survey population, superior researcher controls, and data quality. Because of attention-check failure, we planned on enrolling 600 participants in both Experiments 1 and 2. If after enrolling 600 participants we had not reached 520 participants who passed the attention check and completed the survey, we would continue to recruit in batches of 80 participants as preregistered until we reached at least 520 participants.
To be eligible for our experiment, participants had to be over the age of 18 and reside in the United States. Participants were paid for 20 min of their time at $10 an hour (above federal minimum wage) such that each participant earned $3.34. Participants signed up for a time slot to participate and were compensated after completing the experiment. We recruited a nationally representative sample of adults in Experiment 1 and recruited a politically balanced sample (i.e., 50% Democrats and 50% Republicans) in Experiment 2, reducing the Democratic bias in many online survey groups (Huff & Tingley, 2015). Participants must have had above a 90% approval rating on Prolific to participate to ensure we had high-quality participants. For logistical reasons, data for Experiment 2 were collected before data for Experiment 1. Participants were not randomly assigned to an experiment, and participants who had participated in Experiment 2 were prevented from subsequently participating in Experiment 1.
Experiment 1 procedure
We used a procedure that matched the original article as closely as possible in an online setting. As in the original study, participants began the survey by completing the minimal group overestimator/underestimator task with false feedback (Tajfel et al., 1971). The estimation task consisted of participants viewing an array of dots for 3 s, after which they were prompted to estimate how many dots were in the array. All participants were shown the same array of dots, but the designation “overestimator” or “underestimator” was assigned randomly. This created an in-group and out-group for participants.
In the original study, participants engaged face to face with two confederates in a lab. Believing that other people are true actors in an experiment is crucial for psychological induction. Therefore, we included a chat room in which participants interacted with three people from their assigned minimal in-group and out-groups. This was implemented into the Qualtrics survey itself using SMARTRIQS (Molnar, 2019). In this phase, the participants were assigned chat names that correspond to the minimal group to which they are assigned (e.g., “Overestimator-1”). The roles were Overestimator-1, Underestimator-2, Overestimator-3, and Underestimator-4. Participants’ group assignments were labeled in order to further strengthen the minimal group induction.
Participants then entered into a chat room with other participants and were prompted to “Please take the next few minutes to chat with other participants about being an overestimator or underestimator. Remember, you may have seen different images.” They were not able to progress in the survey until 60 s had passed. They were told they may have seen different images because participants were assigned to be overestimators or underestimators randomly. Thus, some participants who estimated higher numbers of dots might have been told they were underestimators, whereas someone who guessed a lower number of dots might have been told they were an overestimator.
After participating in the chat, participants were asked to report their collective identification with their in-group and their out-group (Van Bavel & Cunningham, 2012). Participants were asked to respond to the following three items for each group: “I value being a member of the [overestimator/underestimator] group,” “I am proud to be a member of the [overestimator/underestimator] group,” and “Being a member of the [overestimator/underestimator] group is an important part of my identity” (Van Bavel & Cunningham, 2012). Collective identification was calculated by taking the difference of participants’ in-group scores and out-group scores such that positive scores reflect greater collective identification.
Participants in all conditions then read instructions stating that researchers were interested in performance on two different tasks. Task 1 (the “green” task in the original article) was a simple task consisting of a photo-hunt game in which participants were prompted to “spot the difference” between two images and a short personality inventory and was designed to be fun. Task 2 (the “red” task in the original article) was a complex task consisting of mental rotation on an irregular block shape and logic problems from the LSAT and was designed to be cognitively taxing. To make the differences between the tasks salient, participants were given examples of both the green task and the red task to complete, along with feedback on their accuracy. We also told participants that the green task would take approximately 8 min and the red task would take approximately 20 min, consistent with the original study.
In the original study, the participants were in a lab and participating for course credit, and the length of the study had no effect on the possible compensation for their participation. However, on most online survey platforms participants are compensated per minute for their task participation. This might have added an incentive for people to choose the red task to earn more money, which could interfere with whether choosing the green task for one’s self was seen as immoral. To mitigate this potential confound, we told participants that they would be paid for 20 min of work regardless of which task they participate in. Thus, the green task was still a more desirable task to participate in.
Participants were also given an attention check in this phase of the experiment before experimental random assignment. The attention check was designed to look like a regular survey question and read: “There are lots of different types of questions that we may ask participants. Some types of questions look at personality, whereas others may test certain sets of skills. Others may test to ensure that participants read the entire question. Please select ‘Somewhat Disagree’ from the selection below.” Participants had to select “somewhat disagree” on a Likert scale from 1 (strongly disagree) to 7 (strongly agree) to pass the attention check. Because this attention check occurred before participants were assigned to experimental conditions, it was not impacted by conditional dropout.
After completing the sample tasks, participants were told that some participants would be selected to participate in the green task, whereas others would participate in the red task. To keep the researchers blind to the condition of each participant, participants were told that the researchers were using a newly developed assignment procedure in which a random subset of participants were allowed to choose which task they wanted to complete. Whatever task they do not complete would be assigned to another participant. Those chosen to make assignments could either assign tasks randomly by using a computer randomizer or select one task for themselves, leaving a future participant to complete the other, unselected task. Therefore, participants who chose to assign themselves to the faster, easier green task forced different participants to complete the longer, harder red task. This was how our study and the original study operationalized a moral transgression.
At the phase of the experiment in which task selection occurred, the participants were split into four possible conditions that matched the conditions in the original article. In the “self” condition, participants were instructed to select which task they would like to complete. In the original article, 17 of 19 participants in the “self” condition assigned themselves the less onerous task. The two participants who chose to act altruistically (one using the computer randomizer and one choosing the worse task for themselves) were excluded from analyses. Scholars caution against subsetting or excluding participants on the basis of task choices (Lachin, 2000). Thus, we used an intent-to-treat methodology in which all participants were analyzed according to the condition they were randomized into (McCoy, 2017).
In the three remaining conditions (i.e., “other,” “in-group,” and “out-group”) participants were told that another participant had been selected to assign the tasks. In the “other” condition, no other information was given about this other participant, matching the “unaffiliated other” condition from the original article. In the “in-group” condition, participants were told that the participant they observe assigning tasks is part of the same minimal group as they were in. Participants read the following information: “[Overestimator-2/Underestimator-4] has been randomly selected to assign roles.” Participants were then reminded of the two tasks and were then told to wait while the overestimator/underestimator made their choices. Participants saw the label that was the same as the label they were assigned during the minimal group task, matching the “in-group other” condition from the original article. In the “out-group” condition, participants were told that the observed participant was a member of their minimal out-group, matching the “out-group other” condition from the original article.
Participants in these three conditions were then told that they would learn of that participant’s decision. Participants were reminded that the allocator had the choice to use a randomizer or to assign themselves to one of the tasks. After a brief waiting period, participants learned via experimenter-generated false feedback that the other participant chose to behave selfishly by assigning themselves the green task and assigning a future participant the red task.
Once task selection was completed, participants answered questions about the experimenter-blind selection procedure. Embedded in the questionnaire was our question of interest: “How fairly did the other participant act when assigning the tasks?” This was the dependent measure of interest and was answered on a 7-point Likert scale from 1 (extremely unfairly) to 7 (extremely fairly). Participants were also asked three distractor questions. The first distractor question was “Do you think the assignment procedure for tasks is blind (e.g., the researchers are not assigning tasks)?” Participants answered “yes,” “maybe,” or “no.” The second distractor question was “How likely do you think people are to assign themselves the green task?” This question was answered on a 11-point slider scale from 0 (extremely unlikely) to 10 (extremely likely). The third distractor question was “Do you have any other feedback on the new ‘experimenter-blind’ task assignment procedure?” This question was answered as an open-text response.
Experiment 2 procedure
The procedure for Experiment 2 was identical to Experiment 1 except that instead of using minimal groups to establish participants’ in-group and out-group membership we used participants’ preexisting political-party identities. Political-party identities were taken from people’s Prolific battery. Participants’ chat-room names reflected their political-party identification (i.e., Democrat-1, Republican-2, Democrat-3, and Republican-4). Participants still conversed about the minimal group paradigm in the chat room.
Participants in the “self” condition followed the exact same procedure for the “self” condition laid out in Experiment 1. The “other” condition followed exactly the same procedure as in Experiment 1, in which they learned that another participant behaved selfishly and learned nothing about that participant’s identity. In the “in-group” condition, participants learned that someone from their political in-group behaved selfishly (e.g., a participant who identified as a Republican was told they were learning of a Republican’s decision). In the “out-group” condition, participants learned that someone from their political out-group behaved selfishly (e.g., a participant who identified as a Republican was told they were learning of a Democrat’s decision). To inform participants of the target’s political in-group status, the participant read the instructions as follows: “[Player 1 (Democrat)/Player 2 (Republican)/Player 3 (Democrat)/Player 4 (Republican)] has been randomly assigned to assign roles.” Participants were then asked the same question (embedded in a series of distractor questions) regarding how fair they thought the other participant acted.
Analysis Plan
All preregistered hypotheses can be found in Table 1. For the main analyses, participants who failed the attention check or who did not complete the experiment were excluded. The attention check appeared before random assignment to condition to avoid posttreatment bias (Montgomery et al., 2018). In the procedure in the original research, participants in the “self” condition who made altruistic choices (i.e., chose the randomizer or the red task for themselves) were excluded. However, because conditioning inclusion on a posttreatment variable can violate random assignment as a result of nonrandom attrition (Montgomery et al., 2018), we conducted intent-to-treat analyses for all of our main measures in which all participants in the “self” condition were included, regardless of whether they had made an altruistic choice.
Hypothesis Table

For robustness, we also ran an analysis in which we excluded all altruistic participants from analyses via listwise deletion to match the original study. For results to successfully replicate the original study, the hypotheses must be supported by the intent-to-treat analysis. For significance testing, we used an alpha of 0.05 for all of the proposed, preregistered analyses. Regarding concerns about floor or ceiling effects in statistical analyses, there was no reason in the original study to suspect that floor or ceiling effects would occur, nor did we find evidence of floor or ceiling effects in Pilot Experiments 1 or 2 (see Section A in the Supplemental Material available online).
Experiment 1 analysis plan
In Experiment 1, we tested Hypotheses 1, 2, 3, and 6. Hypothesis 1 predicted that people would rate themselves and their in-group members as behaving more fairly than their out-group members or unaffiliated others. To test this, we used a planned contrast in which the “self” condition and the “in-group” condition had contrast weights of 1 and the “other” condition and the “out-group” condition had contrast weights of −1, matching the original study. If the contrast analysis was significant and the mean fairness ratings for participants in the “self” and “in-group” conditions were greater than the mean fairness ratings for participants in the “out-group” and “other” conditions, then we would conclude that Hypothesis 1 is supported.
If this contrast analysis did not reach an alpha of 0.05, we planned to conduct equivalence testing to examine whether we had an absence of a meaningful effect. We planned to use the TOSTER package in R. We preregistered the use of the function powerTOSTone but found that equ_ftest was the correct function to determine F-test equivalence. If the equivalence test was significant, we would conclude there is no meaningful effect in our data.
Hypothesis 2 predicted that people would rate themselves as behaving more fairly than others. To test this, we used a planned contrast in which the “self” condition had a contrast weight of 3 and the “other,” “in-group,” and “out-group” conditions had contrast weights of −1. If the contrast analysis was significant and the fairness rating for the self was higher than the mean fairness ratings in the other conditions, then we would conclude that Hypothesis 2 is supported.
Hypothesis 3 predicted that people would rate in-group members as behaving more fairly than out-group members. To test this, we used a planned contrast in which the “in-group” condition had a contrast weight of 1, the “out-group” condition had a contrast weight of −1, and the “self” and “other” conditions had contrast weights of 0. If the contrast analysis was significant and the fairness rating for in-group members was higher than the fairness ratings for out-group members, then we would conclude that Hypothesis 3 is supported.
Hypothesis 6 predicted that the strength of collective identification would moderate moral hypocrisy such that people who were strongly identified with their in-group would rate their in-group member’s actions as more fair (6a) and their out-group member’s actions as less fair (6b). To test this, we used a multiple linear regression model in which we regressed fairness ratings on the dummy-coded condition variable (the “in-group” and “out-group” conditions), mean collective identification, and their interaction. If the interaction term was significant such that fairness ratings for in-group members increased as collective identification increased while fairness ratings decreased for out-group members as collective identification increased, then we would conclude that Hypothesis 6 is supported.
As an exploratory analysis, we wanted to look at the effect of both political extremism and political ideology on the level of in-group and out-group fairness judgments. To test this, we used two multiple linear regression models, one for those in the “in-group” condition and one for those in the “out-group” condition, in which we regressed fairness on the linear term for political ideology and the quadratic term for political ideology that we conceptualized as political extremity. If the linear effect of political ideology was significant and positive, we would conclude that fairness judgments went up as participants became more conservative. If the linear effect of political ideology was significant and negative, we would conclude that fairness judgments went up as participants became more liberal. If political extremity was significant and positive, we would conclude that people who were more extreme in their political ideology judged others’ actions as being more fair. If political extremity was significant and negative, we would conclude that people who were more extreme in their political ideology judged other’s actions as being less fair.
Experiment 2 analysis plan
In Experiment 2, we tested Hypotheses 4 through 6. Hypothesis 4 states that Hypotheses 1 through 3 would be confirmed in natural groups as well as minimal groups. Thus, we repeated all analyses proposed for Hypotheses 1 through 3 on the natural group sample. If Hypotheses 1 through 3 were supported when groups were based on political-party and minimal group assignment, then we would conclude that Hypothesis 4 was supported.
Hypothesis 5 states that the effects of moral hypocrisy will be larger for natural groups compared with minimal groups. To test this, we conducted a 2 (contrast: in-group vs. out-group) × 2 (experiment: minimal groups vs. natural groups) analysis of variance (ANOVA). We expected that the interaction term would be significant and that simple effects would reveal that in-group fairness was higher for natural groups compared with minimal groups and out-group fairness was lower for natural groups compared with minimal groups. If the above predictions were all supported, then we would conclude that Hypothesis 5 is supported.
Hypothesis 6 states that the strength of collective identification would moderate moral hypocrisy such that people who were strongly identified with their political in-group would rate their in-group member’s actions as more fair (6a) and their out-group member’s actions as less fair (6b). To test this, we used a multiple linear regression model in which we regressed fairness ratings on the dummy-coded condition variable (“in-group” condition and “out-group” condition), mean collective identification, and their interaction. If the interaction term was significant such that fairness ratings for in-group members increased as collective identification increased, we would investigate the nature of the relationship using a follow-up simple slopes analysis. We would conduct post hoc tests of the relationship between fairness ratings and collective identification for those in the “in-group” condition and the “out-group” condition) separately. If the slope was positive for those judging their in-group members’ moral transgressions and negative (or flat) for those judging their out-group members’ moral transgressions, then we would conclude that Hypothesis 6 is supported.
We also conducted two robustness tests of our manipulations. First, we examined whether those who were assigned to be overestimators and those who were assigned to be underestimators significantly differed in judgments across our four conditions. We hypothesized that there would be little to no difference between overestimators’ and underestimators’ judgments in the same conditions. To test this, we conducted equivalence testing across the four conditions comparing responses from overestimators to underestimators in the same conditions. Using established guidelines from Cohen (1992) and procedures from Lakens (2017), we considered d = 0.2 our smallest effect size of interest. We hypothesized that the effect of being in the overestimator/underestimator group would not be statistically different from zero in any of the four conditions. We ran this robustness check for both Experiments 1 and 2.
Second, we also analyzed the levels of identification with the in-group and out-group to ensure the minimal group manipulation is inducing people to identify more with their minimal in-group. In previous work, we found that there was a clear difference in identification between these minimal groups, with people identifying more with their in-group compared with the out-group (d = 0.91), and identification moderated intergroup bias in minimal groups (Van Bavel & Cunningham, 2012). We used a one-sample t test on participants’ collective identification difference scores to examine whether participants’ difference scores were significantly different from chance. We hypothesized that participants’ difference scores would be significantly higher than zero, indicating that they felt more identified with their in-group compared with their out-group. We expected this to be true for both minimal groups and natural groups.
Results
Experiment 1
We recruited 610 American, nationally representative participants from Prolific. 4 After removing participants who failed attention checks (n = 6), who accidentally took the survey more than once (n = 9), and those who did not consent to the use of our data (n = 5), our final sample consisted of 590 participants (Mage = 35.68 years, SDage = 14.61 years; 295 men and 275 women). For a full gender and ethnicity breakdown of the sample, see Section C of the Supplemental Material.
We preregistered an intent-to-treat analysis in which we included both altruists and moral transgressors in the “self” condition sample. This resulted in a major experimental confound, however, because altruists judged the fairness of a fair decision, whereas all other participants judged the fairness of an unfair decision, which made results including altruists difficult to interpret. Furthermore, participants in the “self” condition who chose to behave fairly (i.e., used the randomizer; n = 47) or altruistically (chose the red task for themselves; n = 4) rated themselves as behaving significantly more fairly (Mfairness = 6.41, SDfairness = 0.94) than the transgressors in the “self” condition (Mfairness = 4.16, SDfairness = 1.74), t(148.4) = 10.40, p < .001. Therefore, we made a post hoc decision to report results excluding the altruists in the main text (Fig. 1a) along with the intent-to-treat analyses (Fig. 2a). This decision was also made by the original authors and thus closely replicated the original study. The results were virtually identical for all comparisons except for the results comparing those in the “self” condition to all other conditions, which we discuss below.

Average fairness judgments. The violin plot shows the average fairness judgments of participants across four conditions in (a) Experiment 1 with minimal groups and (b) Experiment 2 with political groups. The fairness judgment scale runs from 1 (very unfairly) to 7 (very fairly). People expressed intergroup moral hypocrisy only in political groups (via outgroup derogation). Altruists are not included. The error bars around the mean indicate the 95% confidence interval. **p < .01.

Intent-to-treat model. The violin plot shows the average fairness judgments of participants across four conditions in (a) Experiment 1 with minimal groups and (b) Experiment 2 with political groups. The fairness judgment scale runs from 1 (very unfairly) to 7 (very fairly). People expressed intergroup moral hypocrisy only in political groups (via out-group derogation). Altruists are included in red. The error bars around the mean indicate the 95% confidence interval. **p < .01. ***p < .001.
Preregistered replication analyses
We aimed to replicate the findings from the original study. First, we predicted that people would evaluate themselves and their in-groups more fairly than unaffiliated others and out-group members. A planned contrast in which the “self” condition and the “in-group” condition had contrast weights of 1 and the “other” condition and the “out-group” condition had contrast weights of −1 was not significant, F(1, 536) = 0.15, p = .70, η2 = .0003. Results did not change when altruists were included in the sample F(1, 592) = 0.198, p = .66, η2 = .0003. We conducted equivalence testing to determine whether the nonsignificant contrast analysis was smaller than the smallest effect size of interest. We tested whether we had the power to reject the presence of effects of η p 2 > .01, which is equivalent to a small effect size (Cohen, 1988). According to this power analysis, with an alpha of .05 and a final sample size of 536, we had > 99% power to detect an effect. We used the R package TOSTER and the function equ_ftest. For the self and in-group versus other and out-group contrast, where F(1, 536) = 0.15, the 95% confidence interval (CI) of our effect size was [0.00, 0.0096], which is below the equivalence bound of .01. On the basis of the null-hypothesis test and the equivalence testing combined, we can conclude that the observed contrast effect is statistically not different from zero and is statistically equivalent to zero, which fails to replicate the original research.
Preregistered extension analyses
Next, we predicted that people’s evaluations of their own fairness would be greater compared with their evaluations of others’ fairness after committing the same moral transgression. Again, for minimal groups, we found that this comparison was not significant when altruists were excluded, F(1, 536) = 1.27, p = .26, η2 = .002. When altruists were included, we found that those in the “self” condition rated themselves as having behaved significantly more fairly than those in conditions in which others were judged, F(1, 592) = 40.16, p < .001, η2 = .06. Third, we hypothesized that people would evaluate their in-group members as behaving more fairly than out-group members after committing the same moral transgressions when the “self” and “other” conditions were coded 0 in the contrast analysis. For minimal groups, we found that people did not judge in-group and out-group members significantly differently, F(1, 536) = 3.22, p = .07, η2 = .006. Results did not change when altruists were included in the sample, F(1, 592) = 2.88, p = .09, η2 = .005. Thus, we did not find evidence of intergroup moral hypocrisy in minimal groups.
Next, we examined whether the strength of collective identification moderated intergroup moral hypocrisy. Collective identification was calculated by taking the difference of participants’ in-group scores and out-group scores such that positive scores would reflect greater collective identification and a score of zero would indicate equal collective identification with in-groups and out-groups. First, we found that people identified with their minimal in-groups significantly more than zero (Mcollective identification = 1.04, SDcollective identification = 1.63), t(592) = 15.58, p < .001, d = 0.64. Next, we predicted that people who were strongly identified with their groups would rate their in-group members’ actions as more fair and their out-group members actions as less fair. We found a significant main effect for collective identification, b = 0.30, SE = 0.08, t(290) = 3.79, p < .001, and a significant interaction effect between condition and collective identification, b = −0.39, SE = 0.11, t(290) = −3.64, p < .001 (Fig. 3). Simple slopes analysis revealed a significant effect in the in-group condition, b = 0.30, SE = 0.08, t(290) = 3.79, p < .001, such that participants judged other in-group members more fairly the more they were identified with their minimal group memberships. There was no significant effect in the out-group condition, b = −0.09, SE = 0.07, t(290) = −1.28, p < .20 This provided evidence of in-group favoritism among relatively highly identified minimal group members.

Scatterplot showing the relationship between collective identification with minimal group (overestimator/underestimator) fairness ratings of in-group and out-group members’ immoral behavior. Collective identification was measured by calculating the difference score between three-item in-group identification and three-item out-group identification. The fairness rating scale runs from 1 (very unfairly) to 7 (very fairly). The blue lines are regression coefficients, and the shaded region around the blue line represents the 95% confidence interval. For legibility, this figure has truncated the x-axis to exclude people who reported higher identification with their out-group. The results did not change when those participants were included. Collective identification, b = 0.269, t(158) = 2.42, p = .017, and the Collective Identification × Condition (in-group vs. out-group) interaction, b = −0.317, t(158) = −2.00, p = .047, remained significant when out-group identifiers were excluded. For graphs with full results, see Section D in the Supplemental Material available online.
Robustness analyses
For robustness, we examined differences between overestimators and underestimators in our sample. First, we conducted a two-way 4 (condition) × 2 (estimator group) ANOVA to examine whether fairness ratings differed between overestimators and underestimators across conditions. The results revealed no statistically significant main effect of estimator group, F(1, 588) = 0.66, p = .42, η2 = .001. Post hoc pairwise comparisons revealed no significant differences between overestimators and underestimators in any condition, but equivalence testing was unable to conclude that these differences were not statistically different from zero (for full results, see Section D of the Supplemental Material). We also tested whether overestimators and underestimators had different levels of collective identification. Our null-hypothesis test found that overestimators and underestimators did not significantly differ in collective identification (Moverestimators = 1.12, SDoverestimators = 1.70; Munderestimators = 0.971, SDunderestimators = 1.56), t(584.7) = 1.09, p = .28, d = 0.09, but again, equivalence testing was unable to conclude that these differences were not statistically different from zero (for full results, see Section D in the Supplemental Material).
Exploratory analyses
Finally, we tested whether participants’ political ideology or political extremity influenced judgments of in-group and out-group fairness. Neither political ideology nor political extremity significantly predicted in-group fairness judgments. However, political ideology, b = −0.83, SE = 0.29, t(146) = −2.78, p = .006, and political extremity, b = 0.13, SE = 0.04, t(146) = 3.25, p = .001, significantly predicted out-group fairness judgments. Fairness judgments were negatively linearly related to political ideology, suggesting that participants judged out-group members more harshly as conservatism increased, but positively quadratically related, suggesting that participants who were ideologically extreme judged out-group members’ behavior as more fair (for full results, see Section E in the Supplemental Material).
Experiment 2
We recruited 606 American participants from Prolific. After removing participants who failed attention checks (n = 8), who accidentally took the survey more than once (n = 13), and those who did not consent to the use of our data (n = 8), our final sample consisted of 577 participants (Mage = 33.63 years, SDage = 13.52 years; 283 men and 280 women). For a full gender and ethnicity breakdown of the sample, see Section C in the Supplemental Material. Participants were assigned roles as either Democrats or Republicans on the basis of their reported political-party identification on Prolific. In our sample, 50.78% of participants reported being Democrats, and 49.22% reported being Republicans. We also asked participants to report their political orientation on a 7-point Likert scale from 1 (very liberal) to 7 (very conservative). We found that 281 participants identified as liberal, 260 identified as conservative, and 44 identified as moderate.
Some participants in the “self” condition who chose to behave fairly (i.e., used the randomizer; n = 40) or altruistically (chose the red task for themselves; n = 6) and the altruists in our sample rated themselves as behaving significantly more fairly (Mfairness = 6.41, SDfairness = 0.81) than the transgressors in our sample (Mfairness = 4.08, SDfairness = 1.66), t(146) = 11.58, p < .001, d = 1.61, consistent with Experiment 1. Thus, we made the same post hoc decision to report results excluding the altruists (Fig. 1b) in the main text along with the intent-to-treat analyses (Fig. 2b).
Preregistered extension analyses
First, we predicted that people would evaluate themselves and their in-groups more fairly than unaffiliated others and out-group members (Hypothesis 1). For political groups, this was not significant, F(1, 528) = 1.86, p = .17, η2 = .003. Results did not change when altruists were included in the sample F(1, 581) = 1.56, p = .21, η2 = .003. Second, we predicted that people’s evaluations of their own fairness would be greater compared with their evaluations of others’ fairness after committing the same moral transgression (Hypothesis 2). Again, for political groups, we found that this comparison was not significant when altruists were excluded, F(1, 528) = 1.44, p = .23, η2 = .003. When altruists were included, we found that those in the “self” condition rated themselves as having behaved significantly more fairly than those in the other three conditions, F(1, 581) = 40.61, p < .001, η2 = .06.
Third, we hypothesized that people would evaluate their in-group members as behaving more fairly than out-group members after committing the same moral transgressions when the “self” and “other” conditions were coded 0 in the contrast analysis (Hypothesis 3). For natural groups, we found that people believed that their in-group members acted significantly more fairly than their out-group members, F(1, 528) = 9.04, p = .003, η2 = .02. This was also true when altruists were included in the sample, F(1, 581) = 7.46, p = .007, η2 = .01. This provided evidence of intergroup moral hypocrisy in political groups.
Next, we examined whether the strength of collective identification moderated moral hypocrisy (Hypothesis 6). Collective identification was calculated by taking the difference of participants’ in-group scores and out-group scores such that positive scores reflected greater collective identification and a score of zero would indicate equal collective identification with in-groups and out-groups. First, we found that people identified with their political in-group significantly more than zero (Mcollective identification = 2.96, SDcollective identification = 2.27), t(582) = 31.36, p < .001, d = 1.30. An exploratory analysis revealed that people reported significantly greater collective identification with their political groups (Mcollective identification = 2.95, SDcollective identification = 2.27) compared with minimal groups (Mcollective identification = 1.04, SDcollective identification = 1.63), t(967.4) = −15.81, p < .001, d = −0.97. We predicted that people who were strongly identified with their political groups would rate their in-group members’ actions as more fair and their out-group members’ actions as less fair. We did not find significant main effects for either condition, b = −0.45, SE = 0.27, t(284) = −1.64, p = .10, or collective identification, b = −0.01, SE = 0.053, t(284) = −0.154, p = .878, or the interaction effect for these predictions, b = −0.02, SE = 0.07, t(284) = −0.29, p = .77 (Fig. 4). Unlike Experiment 1, there was no moderation by collective identification.
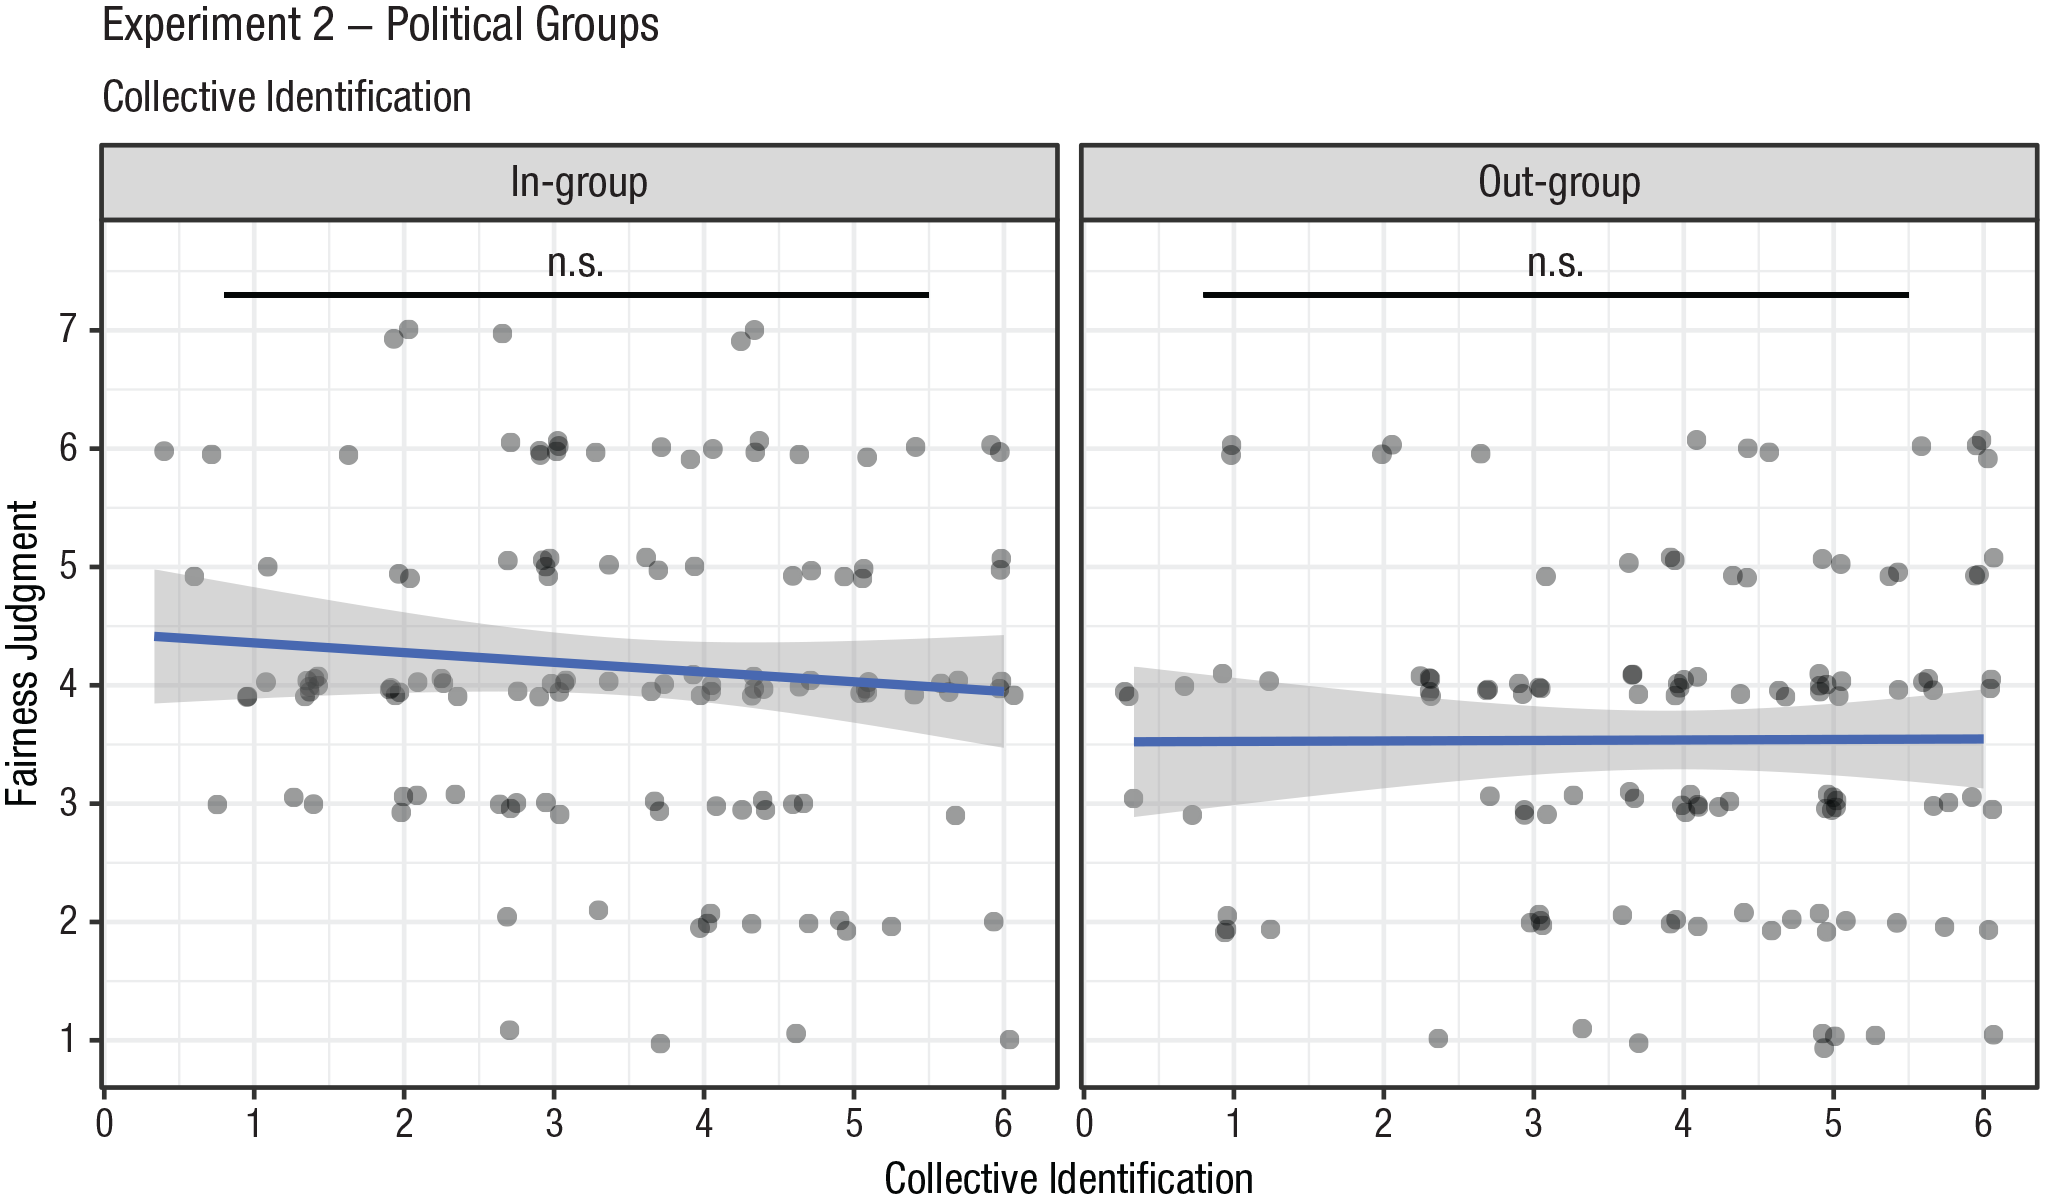
Scatterplot showing the relationship between collective identification with political group (Democrats/Republicans) fairness ratings of in-group and out-group members’ immoral behavior. Collective identification was measured by calculating the difference score between three-item in-group identification and three-item out-group identification. The fairness rating scale runs from 1 (very unfairly) to 7 (very fairly). The blue lines are regression coefficients, and the shaded region around the blue line represents the 95% confidence interval. For legibility, this figure has truncated the x-axis to exclude people who reported higher identification with their out-group. The results did not change when those participants were included. For graphs with full results, see Section F in the Supplemental Material available online.
Robustness analyses
Although it was not the salient group identity in Experiment 2, participants still completed the minimal group induction in Experiment 2 to replicate the original paradigm as closely as possible. For robustness, we preregistered a robustness check for differences between overestimators and underestimators for both studies. First, we conducted a two-way 4 (condition) × 2 (estimator group) ANOVA to examine whether fairness ratings differed between overestimators and underestimators across conditions. The results revealed no statistically significant main effect of the estimator group, F(1, 577) = 0.75, p = .39, η2 = .001. Post hoc pairwise comparisons revealed no significant differences between overestimators and underestimators in any condition, but equivalence testing was unable to conclude that these differences were not statistically different from zero (for full results, see Section F in the Supplemental Material).
We also tested whether Democrats and Republicans had different levels of collective identification. Our null-hypothesis test found that Democrats (MDemocrats = 3.12, SDDemocrats = 2.19) and Republicans (MRepublicans = 2.78, SDRepublicans = 2.35) did not significantly differ in collective identification, t(576.27) = 1.77, p = .08, d = 0.15, but equivalence testing was unable to conclude that these differences were not statistically different from zero, t(577.53) = −0.63, p = .53.
Exploratory analyses
We examined whether political ideology or political extremism influenced judgments of in-group and out-group fairness. Neither political ideology nor political extremity had a significant effect on in-group or out-group fairness judgments (for full results, see Section G in the Supplemental Material).
Experiment 1 and 2 comparison analyses
To test Hypothesis 5, we examined whether the group-based moral-hypocrisy effect was stronger for natural groups (Experiment 2) compared with minimal groups (Experiment 1). We did not find a significant effect of minimal versus natural groups, F(1, 581) = 1.84, p = .17, η2 = .003, nor did we find a significant interaction effect, F(1, 581) = 0.59, p = .44, η2 = .001. We did see a significant effect of condition such that participants judged in-group members’ actions as more fair compared with out-group members when data from Experiments 1 and 2 were combined, F(1, 581) = 11.69, p < .001, η2 = .02. This supports the general pattern of intergroup bias in moral judgments.
Discussion
In two experiments, we examined the impact of social identity and intergroup dynamics on moral hypocrisy. Although we were unable to replicate prior findings in both minimal groups and natural groups (Valdesolo & DeSteno, 2007), we did observe evidence of intergroup biases in moral judgments in two ways. First, we found that people who strongly identified with their minimal in-group expressed in-group favoritism (i.e., judging in-group members more fairly than out-group members who committed the same transgression). Second, we found that partisans engaged in out-group derogation (i.e., judging out-group members less fairly than in-group members who committed the same transgression). Thus, the current research finds clear evidence of intergroup bias in moral judgments.
Our research was inspired by prior work in which people judged themselves and their in-groups as behaving more fairly than unaffiliated others and out-group members for the same moral transgression (unfairly assigning themselves an easier experimental task), demonstrating that the moral-hypocrisy effect extends to in-groups and out-groups (Valdesolo & DeSteno, 2007). However, the original research did not isolate intergroup moral hypocrisy because the analysis relied on a simple contrast that combined personal moral hypocrisy with group moral hypocrisy. The current work was able to directly analyze intergroup biases in moral judgments and found that it was driven by in-group favoritism in minimal groups and out-group derogation in partisan groups.
We found that the level of identification with one’s minimal group (relative to the minimal out-group) predicted fairness ratings of in-group members but not out-group members. People who identified more with their minimal group rated in-group members’ immoral behavior as more fair. This is consistent with previous work showing that the minimal group effect is typically driven by in-group favoritism rather than out-group derogation (Brewer, 1979, 1999). Moreover, this is further evidence that individual differences in collective identification exist in minimal groups and help explain patterns of bias (see Van Bavel et al., 2012). This is particularly important to measure in minimal groups, in which some people might not identify with the novel groups and therefore obscure patterns of intergroup bias.
Among political groups, we found evidence of out-group derogation such that people judged political out-group members as having behaved more unfairly than political in-group members. Furthermore, exploratory analyses revealed that this out-group derogation effect was present in both Democrats and Republicans. These findings are consistent with rising levels of affective polarization (Iyengar et al., 2012, 2019) and partisan sectarianism in the United States (Finkel et al., 2020), where dislike and distrust of those from opposing political parties is extremely strong and socially reinforced. In our experiment, people were demonstrating out-group animosity toward political out-group members in a nonpolitical context, demonstrating how affective polarization and partisan sectarianism can bleed into nonpolitical domains and bias perceptions of political out-group members’ general character (Lees & Cikara, 2020; Moore-Berg et al., 2020).
In political groups, we did not find an effect of collective identification on fairness ratings. However, exploratory analyses revealed that people reported significantly greater collective identification with their political groups compared with minimal groups. This may explain why we found an overall effect of out-group derogation in political groups that was not moderated by collective identification: Collective identification was significantly higher in political groups compared with minimal groups. This also reveals a potential explanation for the lack of main effects in Experiment 1—the minimal group induction may have only been effective for some people. Indeed, exploratory analyses including only people who were highly identified with their minimal group found that they also judged moral transgressions from in-group members as being significantly more fair than out-group members (see Section E in the Supplemental Material). Another possibility is that there was a black-sheep effect in Experiment 2 because of the real-world importance of political identity (Marques & Paez, 1994). Because political identity has more real-world consequences compared with minimal group identities, people may want to distance themselves from and reject immoral in-group members.
We also examined whether people engaged in individual moral hypocrisy, rating themselves as more moral than others for the same transgression (Batson et al., 1997, 2002). We found mixed results. When we included people who made fair or altruistic decisions, we found that people rated themselves as behaving more fairly than others. However, these results were difficult to interpret because participants who chose to use a randomizer to assign tasks, or chose the difficult task for themselves, objectively behaved more fairly than transgressors who assigned themselves the easier task. When only transgressors were included in our sample, we did not find that participants rated themselves as more moral than others. Furthermore, although we collected a large sample, the generalizability of our results may be limited to Prolific workers.
Conclusion
The current work provides new evidence of intergroup bias in moral judgments in artificial and natural groups. Although we failed to replicate the results of Valdesolo and DeSteno (2007), we found evidence of out-group derogation among political groups, even in a nonpolitical context. This work also provides new evidence that collective identification is an important predictor of in-group favoritism in minimal group inductions. In low-stakes contexts such as minimal groups, in-group bias is typically driven by in-group favoritism. However, in-group bias is typically driven by out-group derogation when groups fight over zero-sum resources, such as electoral power, and engage in moral conflict, such as arguing over partisan ideological beliefs (Brewer, 1999). This may be why partisan conflicts are often rife with moral hypocrisy.
Supplemental Material
sj-pdf-1-pss-10.1177_09567976241246552 – Supplemental material for Preregistered Replication and Extension of “Moral Hypocrisy: Social Groups and the Flexibility of Virtue”
Supplemental material, sj-pdf-1-pss-10.1177_09567976241246552 for Preregistered Replication and Extension of “Moral Hypocrisy: Social Groups and the Flexibility of Virtue” by Claire E. Robertson, Madison Akles and Jay J. Van Bavel in Psychological Science
Footnotes
Acknowledgements
We would like to thank the Social Identity and Morality Lab for their helpful comments on this manuscript.
Transparency
Action Editor: Mark Brandt
Editor: Patricia J. Bauer
Author Contributions

Notes
References
Supplementary Material
Please find the following supplemental material available below.
For Open Access articles published under a Creative Commons License, all supplemental material carries the same license as the article it is associated with.
For non-Open Access articles published, all supplemental material carries a non-exclusive license, and permission requests for re-use of supplemental material or any part of supplemental material shall be sent directly to the copyright owner as specified in the copyright notice associated with the article.
