
Abstract
As a key component of a split-type intelligent sports wheelchair for the disabled, the reliability of the motor is related to the personal safety of the wheelchair user and the accurate realization of the wheelchair’s sports functions. This motor is actually just a rotating machine. In order to achieve detection and analysis of rotating machinery bearing vibration signal, a method based on wavelet and energy feature of rotating machinery fault diagnosis is introduced. This method applies wavelet to obtain de-noising and then uses wavelet packet energy feature extraction to diagnose faults effectively caused by rotating machinery such as rotor unbalance fault, rotor misalignment fault, and rotor-to-stator rub fault. Test results illustrate that when different faults occur to the bearing, it is viable to utilize pattern recognition to diagnose faults for the reason that discrepancies appear in sub-hand energy after wavelet packet decomposition. The main research conclusions of this paper are also directly applied to the fault diagnosis of such wheelchair motors.
Introduction
With the rapid development of science technology, rotating machinery is widely applied in machinery, energy, petrochemical, metallurgy, electric power, aerospace, defense industry, and other industries. The rotor and bearing system is the key part of rotating machinery, particularly in high speed conditions. Due to the long-term high speed and full load operation, faults arise easily. In this case, the real-time monitoring and fault diagnosis of rotating machinery can guarantee the safety of equipment and the reliability of operation. Meanwhile, it also helps to reduce the cost of repairs, prolong the service life of the equipment, and avoid enormous waste caused by halting and repairing. At present, there are many effective diagnosis theories in nonstationary and nonlinear feature extraction of the rotating machinery fault signal. However, there are flaws in the early fault diagnosis, weak signal feature extraction and various faults identification, and so on. In other words, it is difficult to extract dynamic amplitude characteristics of a fault signal in a mechanical system effectively. The rotor vibration fault, as the main fault in rotating machinery fault, affects the running status, reliability, and durability of the equipment directly. So, it is vital to diagnose rotor unbalance fault, rotor misalignment fault, and rotor-to-stator rub fault.1–3 This paper carries on de-noising analysis of the real-time vibration signal using improved wavelet threshold quantization function and afterward recognizes different faults of the rotating machinery combining with a wavelet packet energy feature algorithm.
Hardware design of the system
The hardware of the rotating machinery condition monitoring system mainly contains a signal acquisition module and data transmitting and receiving modules. The hardware design block diagram is shown in Figure 1. The eddy current sensors are, respectively, installed in horizontal and vertical of the rotor, while a ring with a groove is installed on the rotor to measure the velocity. The figure presents that the rotor speed and vibration signals of rotating machinery are measured through eddy current sensors and acceleration sensors, and then the signals are sent to the data acquisition module. Moreover, the data collected from data acquisition are transmitted by the wireless data transmission module. Eventually, PC reads the rotor vibration and rotating speed signal from the wireless data receiving module to complete fault diagnosis. System hardware block diagram.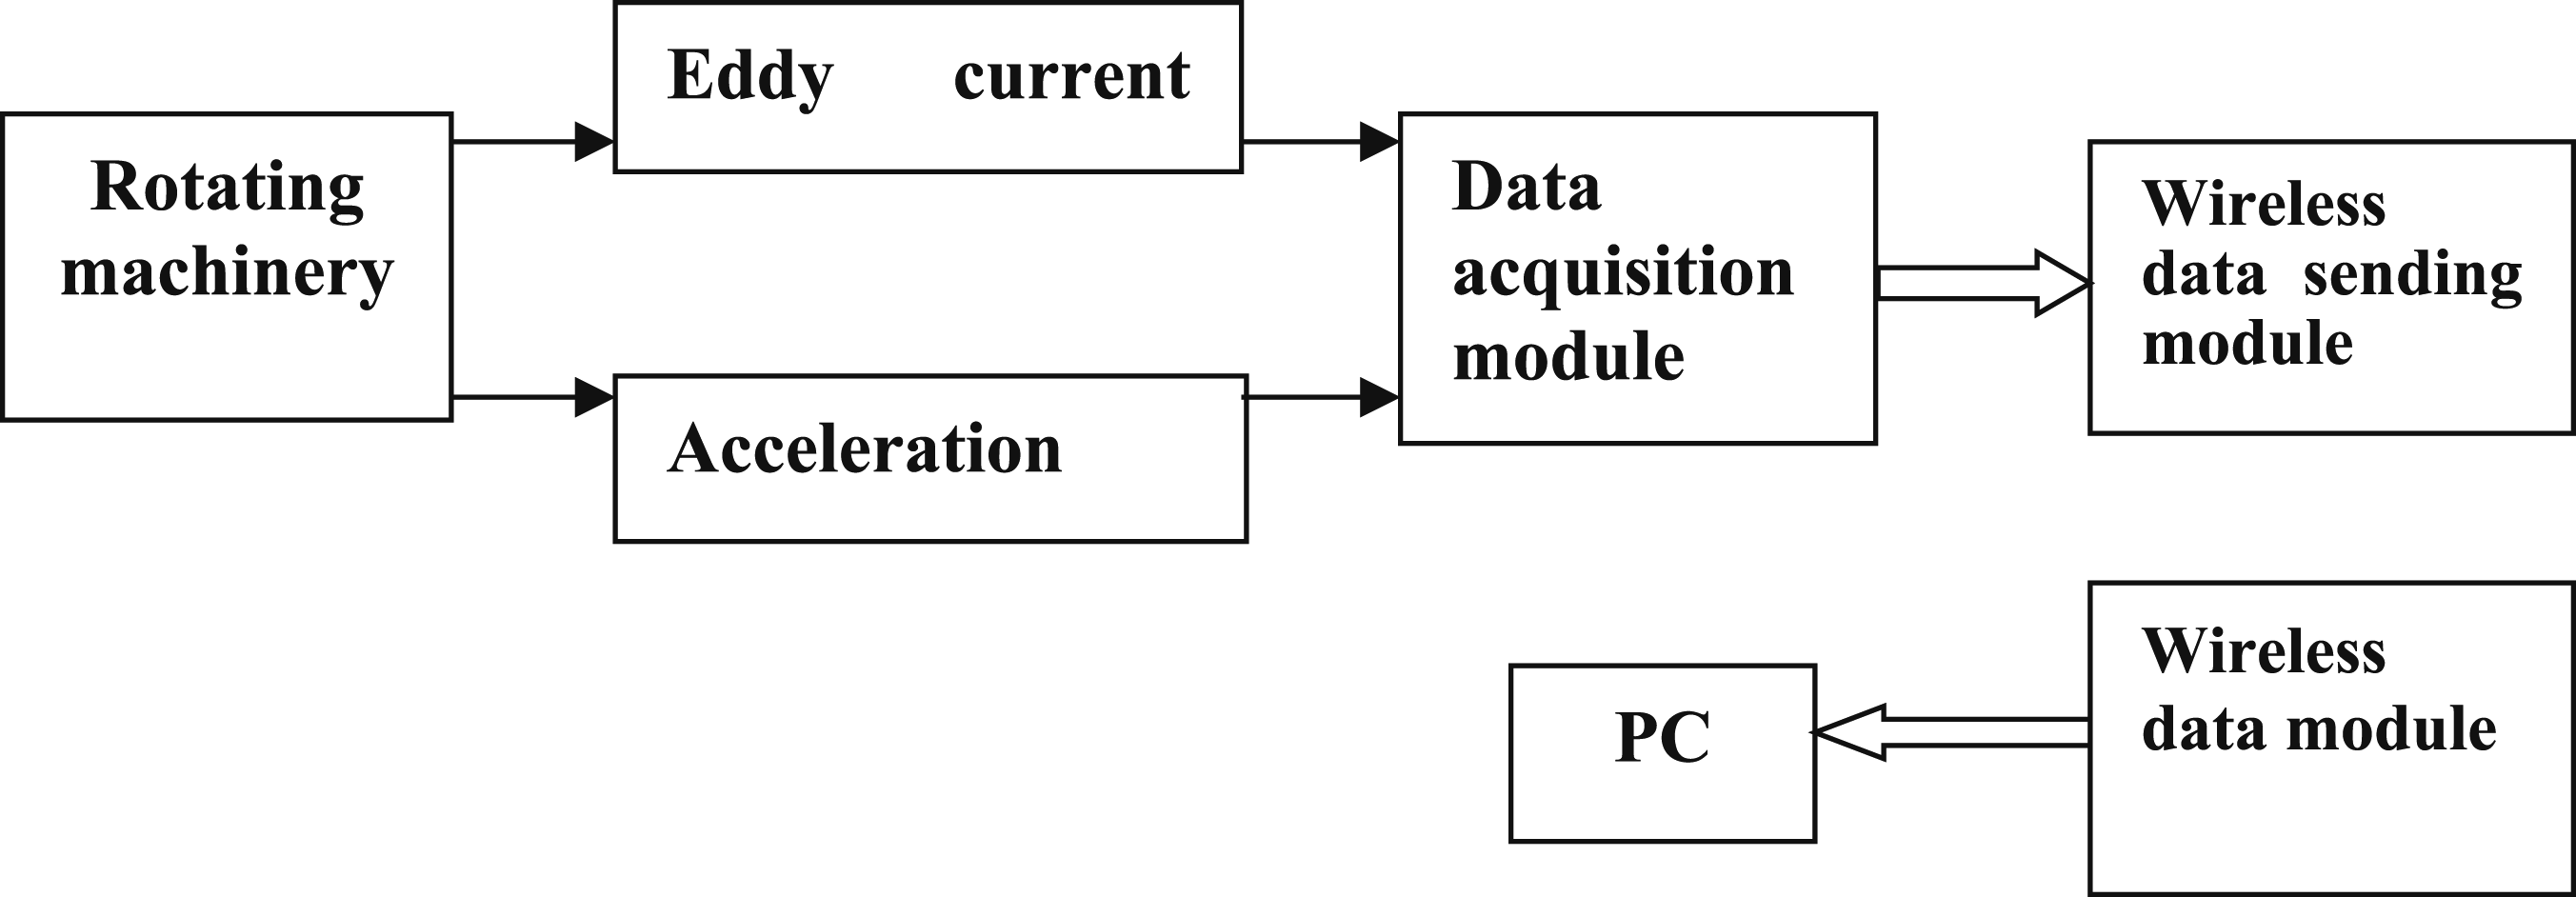
Vibration signal feature extraction based on wavelet
Vibration signal acquisition
For the sake of simulating different faults, there are eight evenly distributed column bores set on the rotating machinery rotor to place columns of different number. The basic characteristics frequency of the rotor vibration signal can be calculated by equation (1)
4
In the equation, n is the rotor speed, and f is the characteristic frequency.
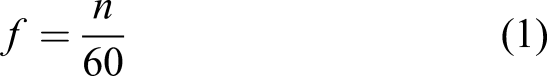
During measuring process, speed is 440 r/min; it can be figured out that characteristic frequency is 7.33 Hz. By screwing different number of weight steels into the quantity rotor, the system can obtain an unbalanced vibration signal under different degrees. In regard to misalignment fault, when replacing the eccentric shaft, excursion exists between the center position of the rotor rotating shaft and that of the motor, which is mainly caused by mechanical equipment installation error, foundation settlement, or the supporting frame expansion. In addition, rotor-to-stator rub fault is a kind of friction generated between rubbing screw and shaft accompanied by tangential friction force, so large vibration is generated in the rotor. However, rotor unbalance and serious misalignment case may lead to rotor-to-stator rub fault as well. With the above measuring method, the vibration signals of rotating machinery rotor in different conditions are collected through the designed data collection systems which are shown in Figure 2. Rotor vibration signal time-domain waveform: (a) normal state; (b) rotor unbalance fault; (c) rotor misalignment fault; (d) rubbing fault movement.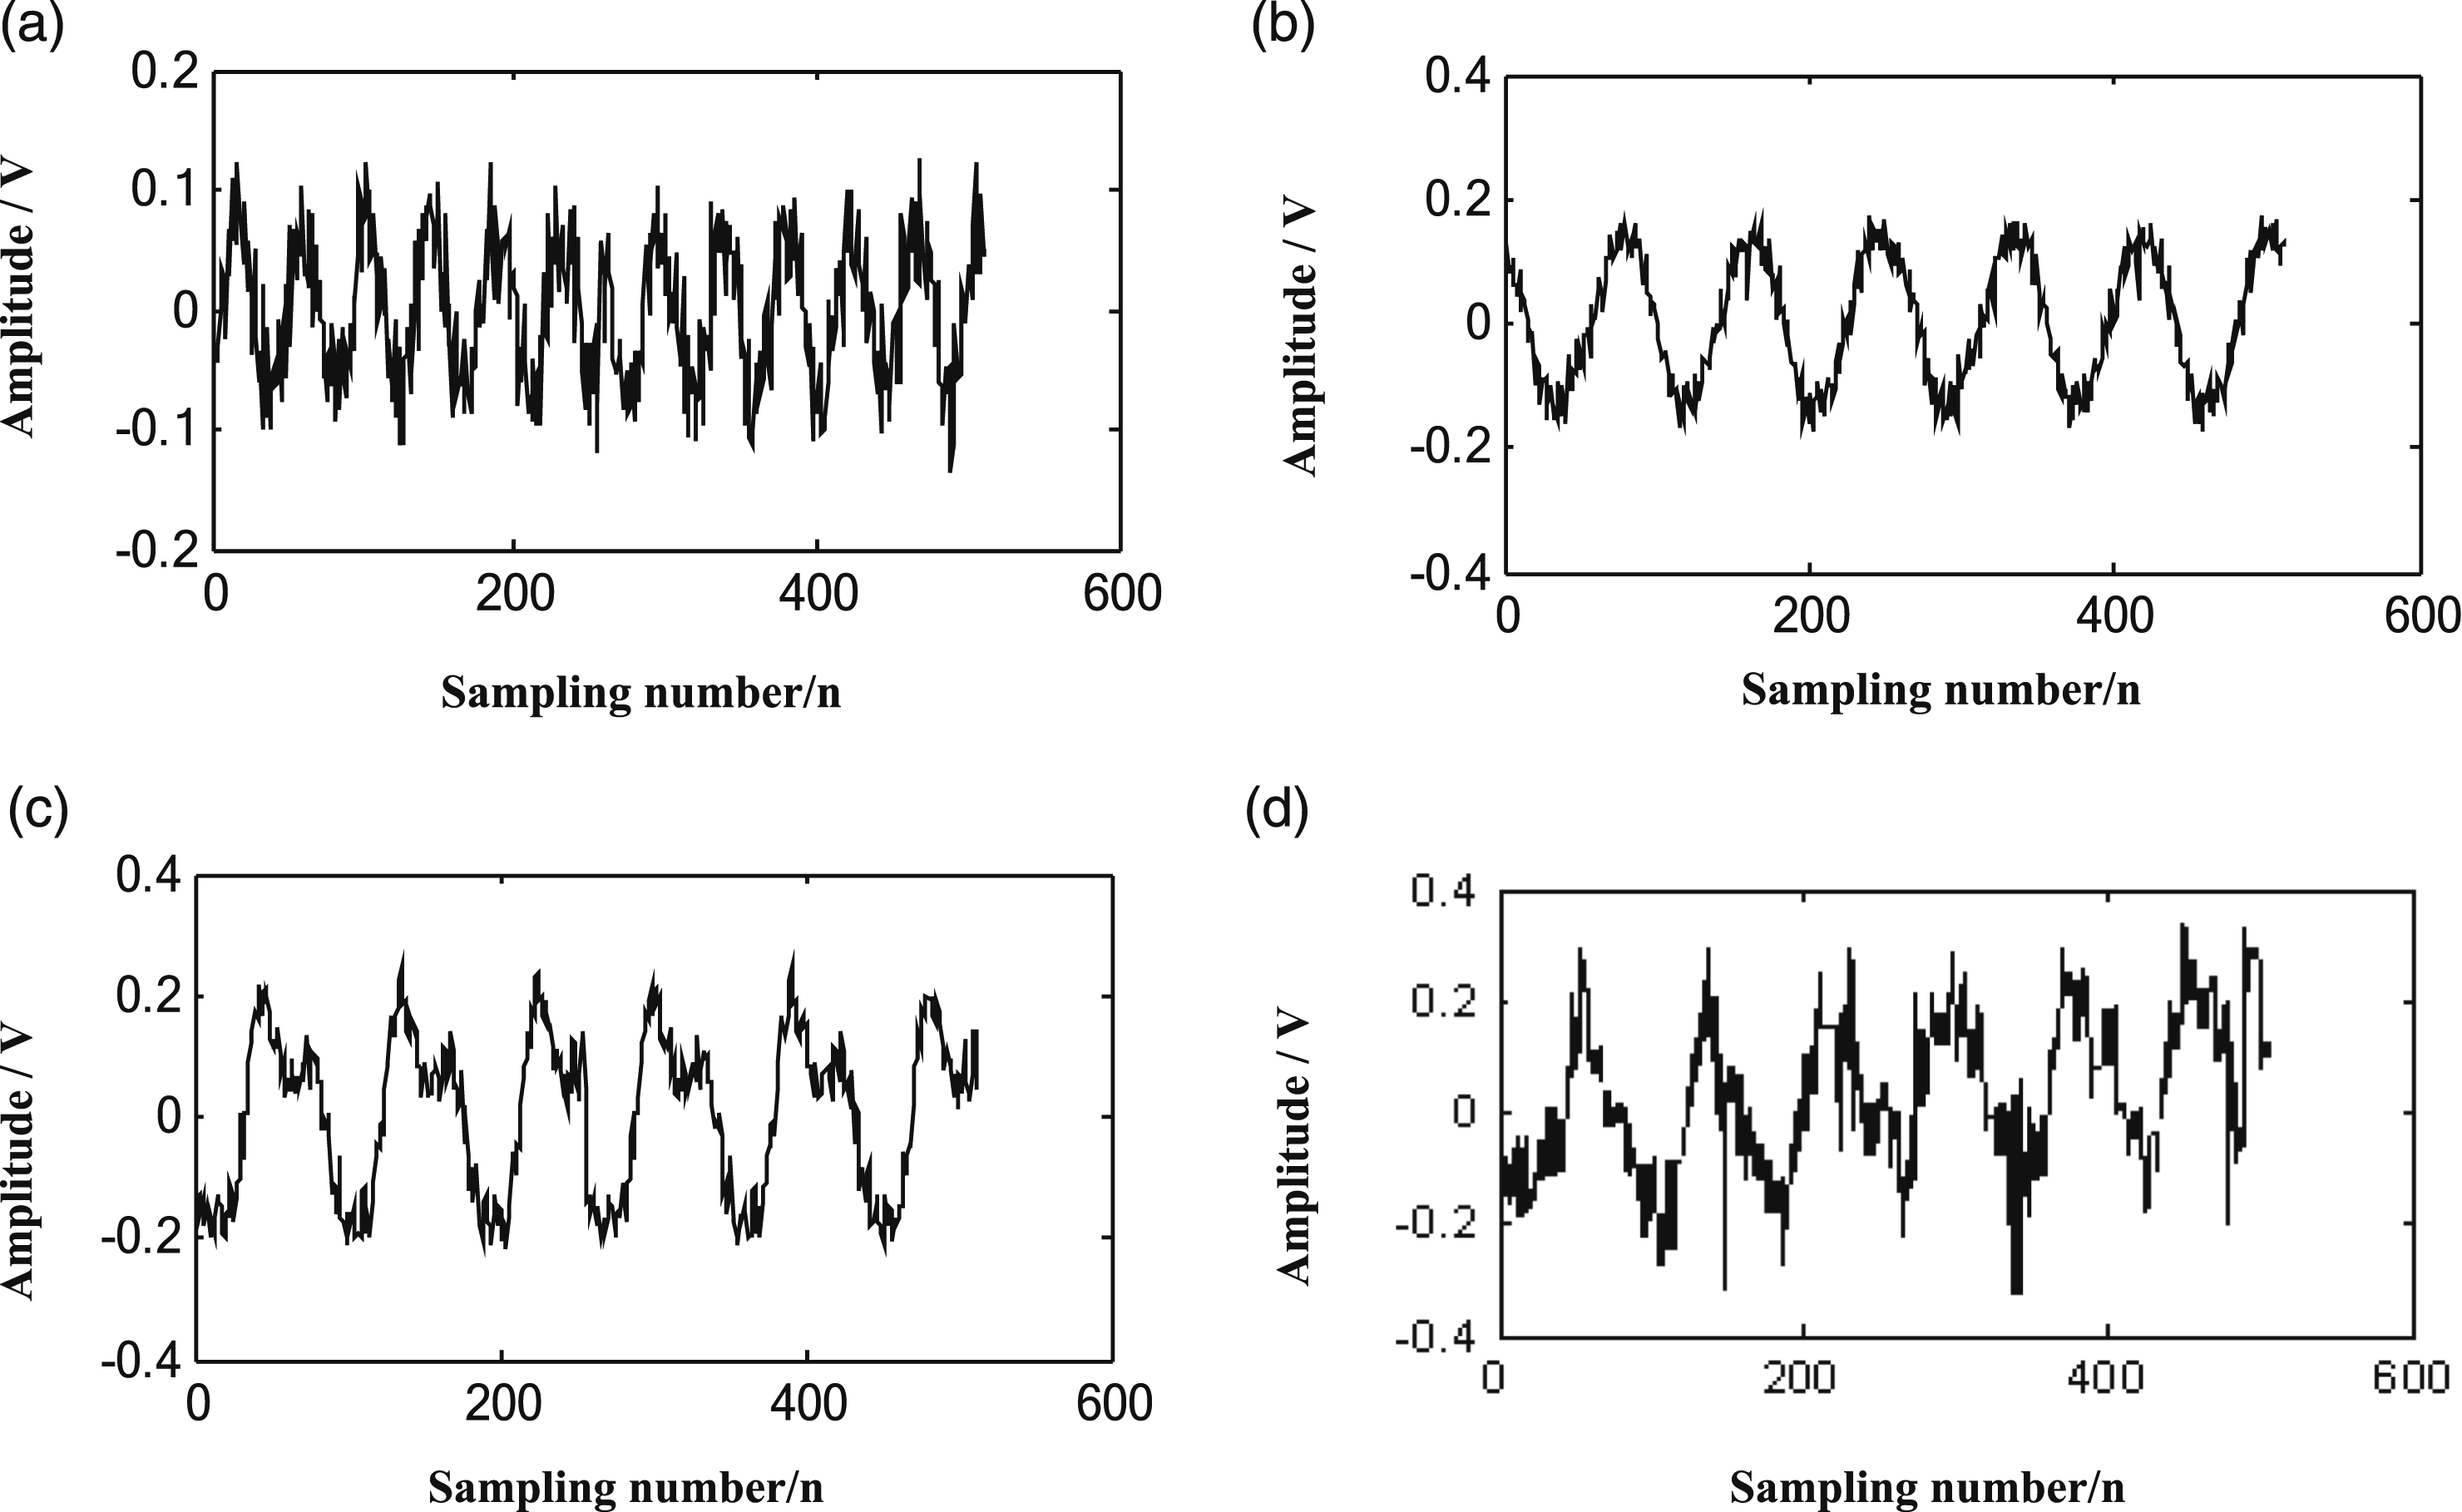
Figure 2 demonstrates that when rotor is in different states, its vibration signal wavelets are different. Besides, there is a big disparity between the misalignment fault signal and unbalance fault signal.
Wavelet packet analysis
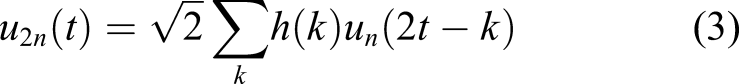
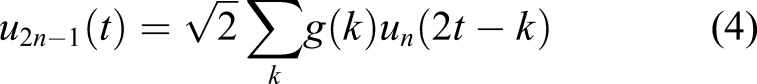
Wavelet analysis is a time–frequency analysis method which processes high frequency resolution. Therefore, each time it is able to keep on decomposing the decomposed low-frequency signal, for purpose of remedying the frequency limitation of the wavelet analysis in high frequency part, the wavelet packet analysis is put forward in the basis of wavelet analysis, which can be described as follows5–9 Three wavelet packet decomposition tree structure diagram.

Wavelet threshold de-noising and reconstruction
In actual rotating machinery vibration signal testing process, due to the interference of the site environment and equipment, there is a noise signal interfused in the normal signal.10–12 In order to eliminate the noise and obtain the useful signal, the wavelet analysis is used to de-noising the vibration signal. After wavelet decomposition, the wavelet coefficients corresponding to the useful signal are relatively large, and the signal energy is mainly concentrated in several frequency bands. However, the wavelet coefficients corresponding to the noise signal are relatively small, and the noise energy is evenly distributed over the entire frequency band. In consequence, setting an appropriate threshold value is of great importance. Regarding the coefficients less than the threshold value, they are set to 0; otherwise, they remain unchanged. Finally, by performing inverse transformation, the system achieves the aim of signal reconstruction.13,14
A decomposition level j with suitable wavelet basis is chosen as a decomposition standard of the noise signal s(i).
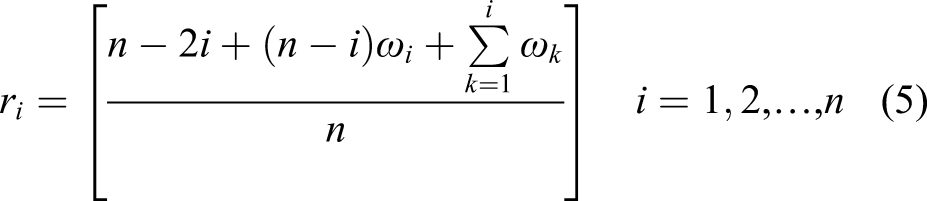
The next step is to quantify the high-frequency wavelet coefficients got from upper decomposition in accordance with threshold function, while the low-frequency coefficients stay the same. Besides, the threshold is obtained using the minimum risk vector rule in MATLAB. It is calculated by the following equation
15
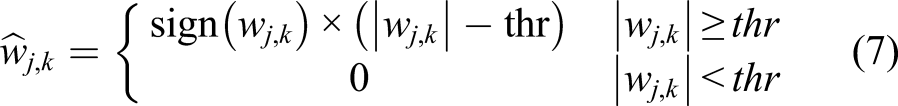
The wavelet coefficient of traditional hard threshold de-noising is
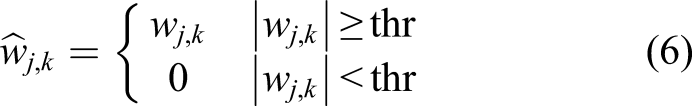
The wavelet coefficient of traditional soft threshold de-noising is
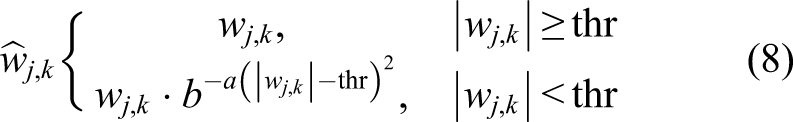
For reserving more original features of the rotating machinery vibration signal, to overcome the defect of traditional threshold function quantization method as well, an improved threshold de-noising function quantization method is introduced and can be described as equation (8)
Afterward, high-frequency wavelet coefficients and low-frequency wavelet coefficients are reconstructed according to the following equation

Eventually, when conducting de-noising process of the measured misalignment fault in rotating machinery, DB9 wavelet basis is selected as a criterion. Figure 4 illustrates the de-noising results of misalignment fault, respectively, using soft and hard threshold values and the improved threshold quantization function. The de-noising results of misalignment fault signal: (a) measured vibration signal; (b) hard threshold results; (c) soft threshold results; (d) improved threshold results.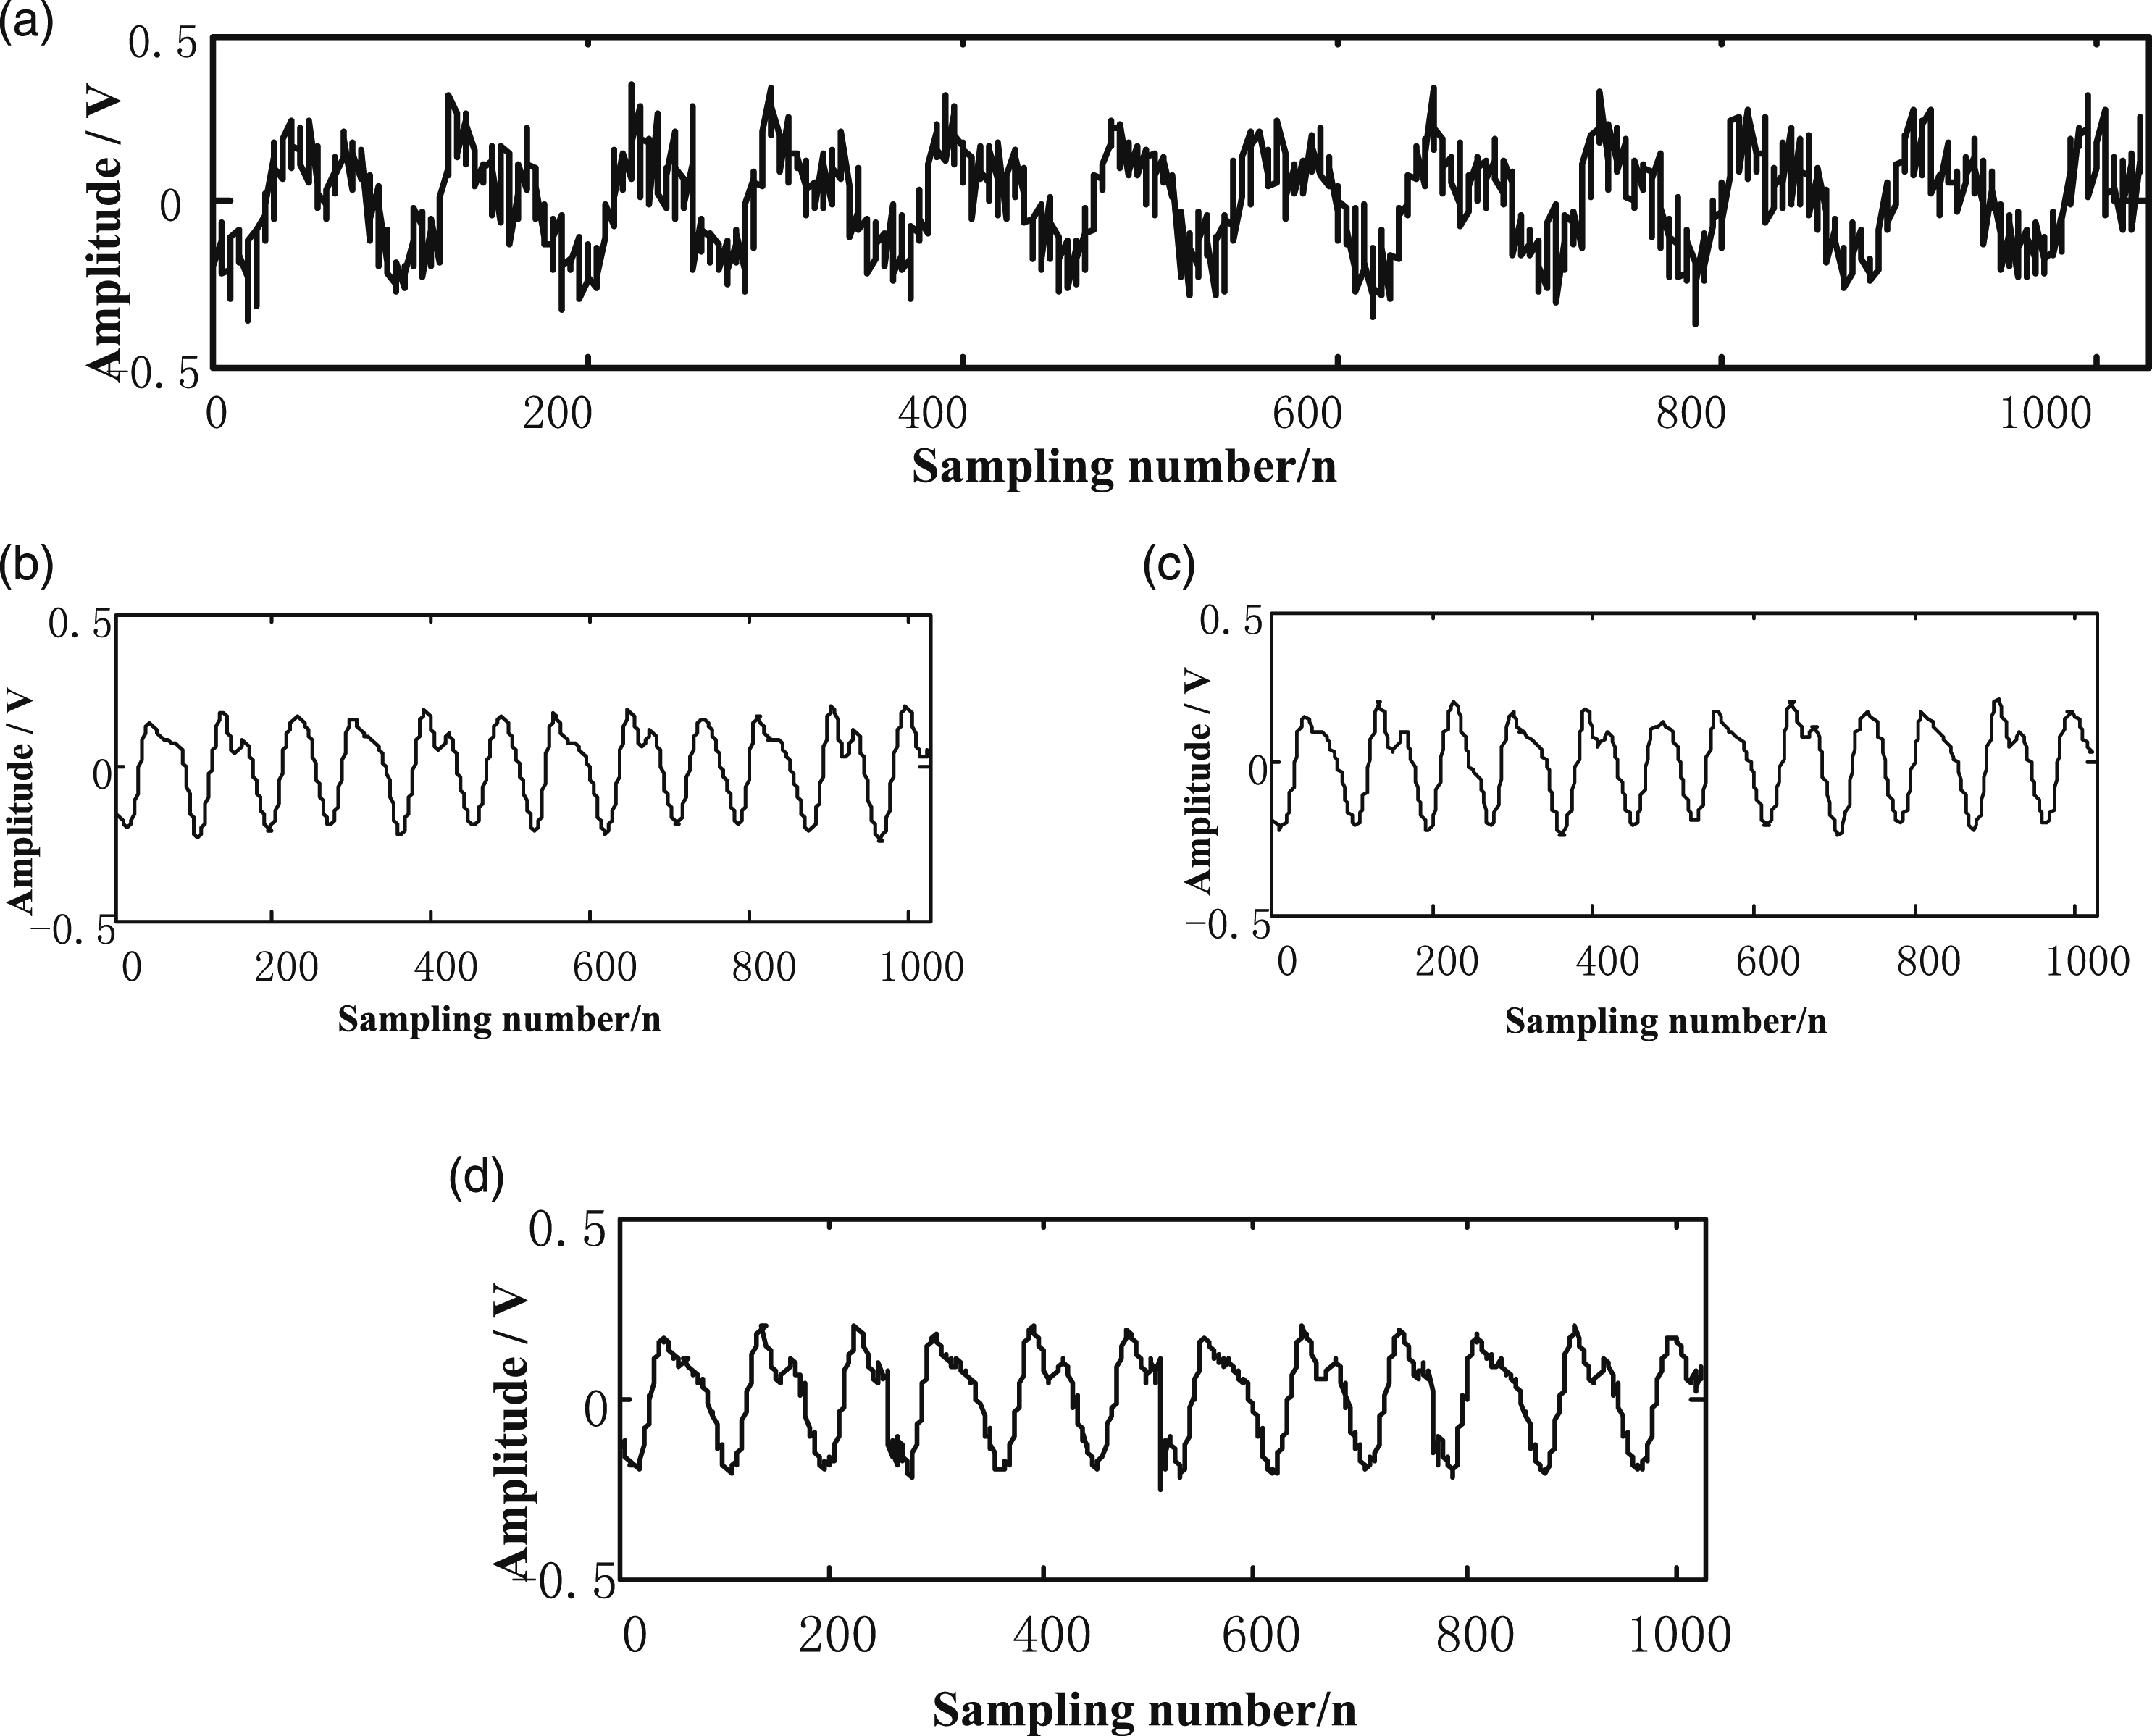
Energy feature extraction
With respect to fault diagnosis basing on the vibration signal process, signal feature extraction is a problem of fundamental importance. The wavelet decomposition result is expressed in terms of energy. In other words, the energy of a signal after wavelet transformation is equivalent to that of the original signal. 16 Because of the large difference between vibration signals under different status, the correspondingly decomposed energy in each frequency band is different from each other, which is feasible to judge the fault type.
Specifically, the system decomposes the vibration signal based upon a chosen wavelet packet basis and then extracts the signal feature of eight frequencies from low frequency to high frequency at the third layer. After that, the signals are reconstructed.
For working out the total energy of a band signal, it is consumed that X
3j
( j = 0,1,…7) are signals corresponding to the reconstructed signals and E
3j
( j = 0,1,...7) are energy values
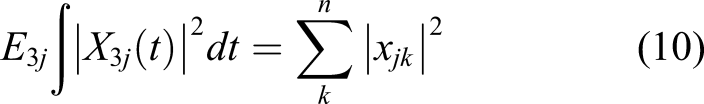
In equation (10),
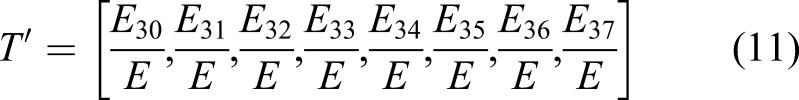
At length, in order to construct normalized eigenvector, let
Through three-layer wavelet packet decomposition of the collected vibration signal, namely, rotor normal signal, rotor imbalance fault signal, rotor misalignment fault signal, and rotor-to-stator rub fault signal, the energy feature of the reconstructed signal in the third layer is extracted and is shown in Figure 5. Rotor vibration fault signal relative energy diagram: (a) normal state; (b) rotor unbalance fault; (c) rotor misalignment fault; (d) rubbing fault movement.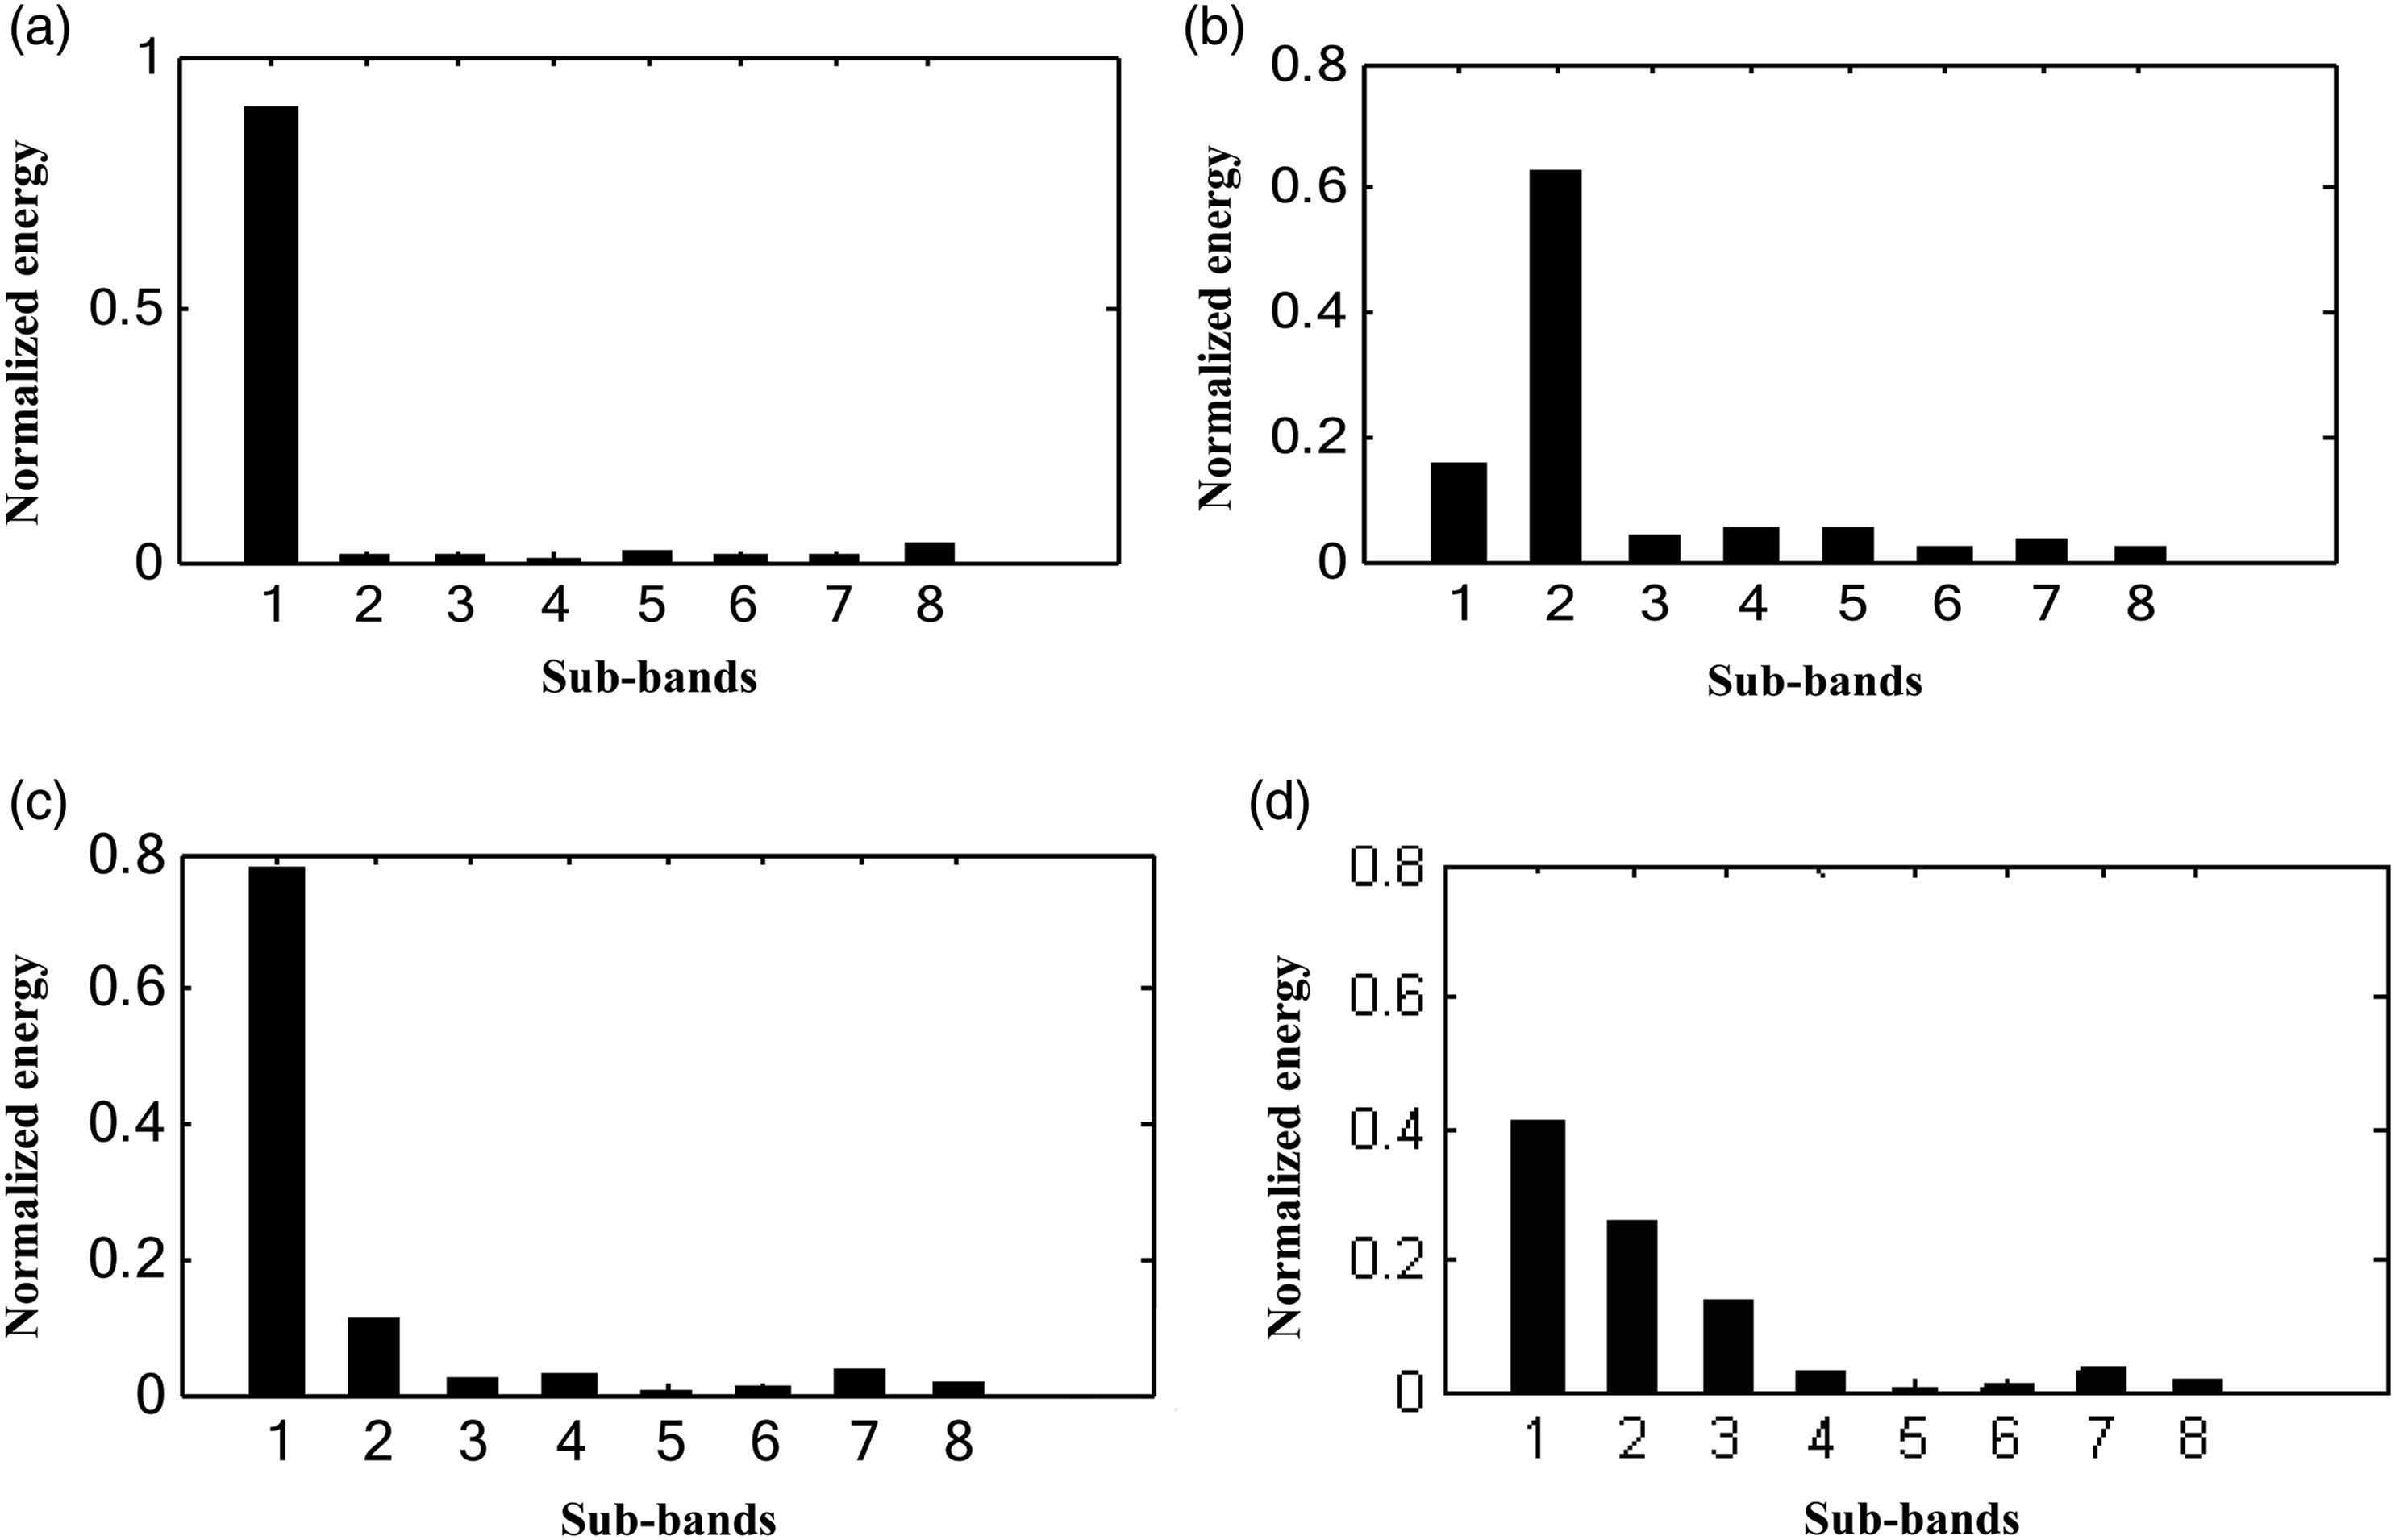
Typical characteristics of rotating machinery fault energy table.

In conclusion, after wavelet packet decomposition, the energy of different sub-bands is different. In this case, the energy value of different frequency bands can serve as the characteristic vector of fault diagnosis. Ultimately, using a pattern recognition method can identify the fault.
The data of Case Western Reserve University (CWRU) are used to extract the energy characteristics of the wavelet packet for vibration signals under normal bearing, bearing inner ring failure, bearing outer ring failure, and rolling body failure conditions. Figure 6 is a schematic diagram of time-domain signal energy extraction results in a normal state. Normal time-domain signal and relative energy diagram: (a) time-domain signal in normal state; (b) relative energy of time-domain signal in normal state.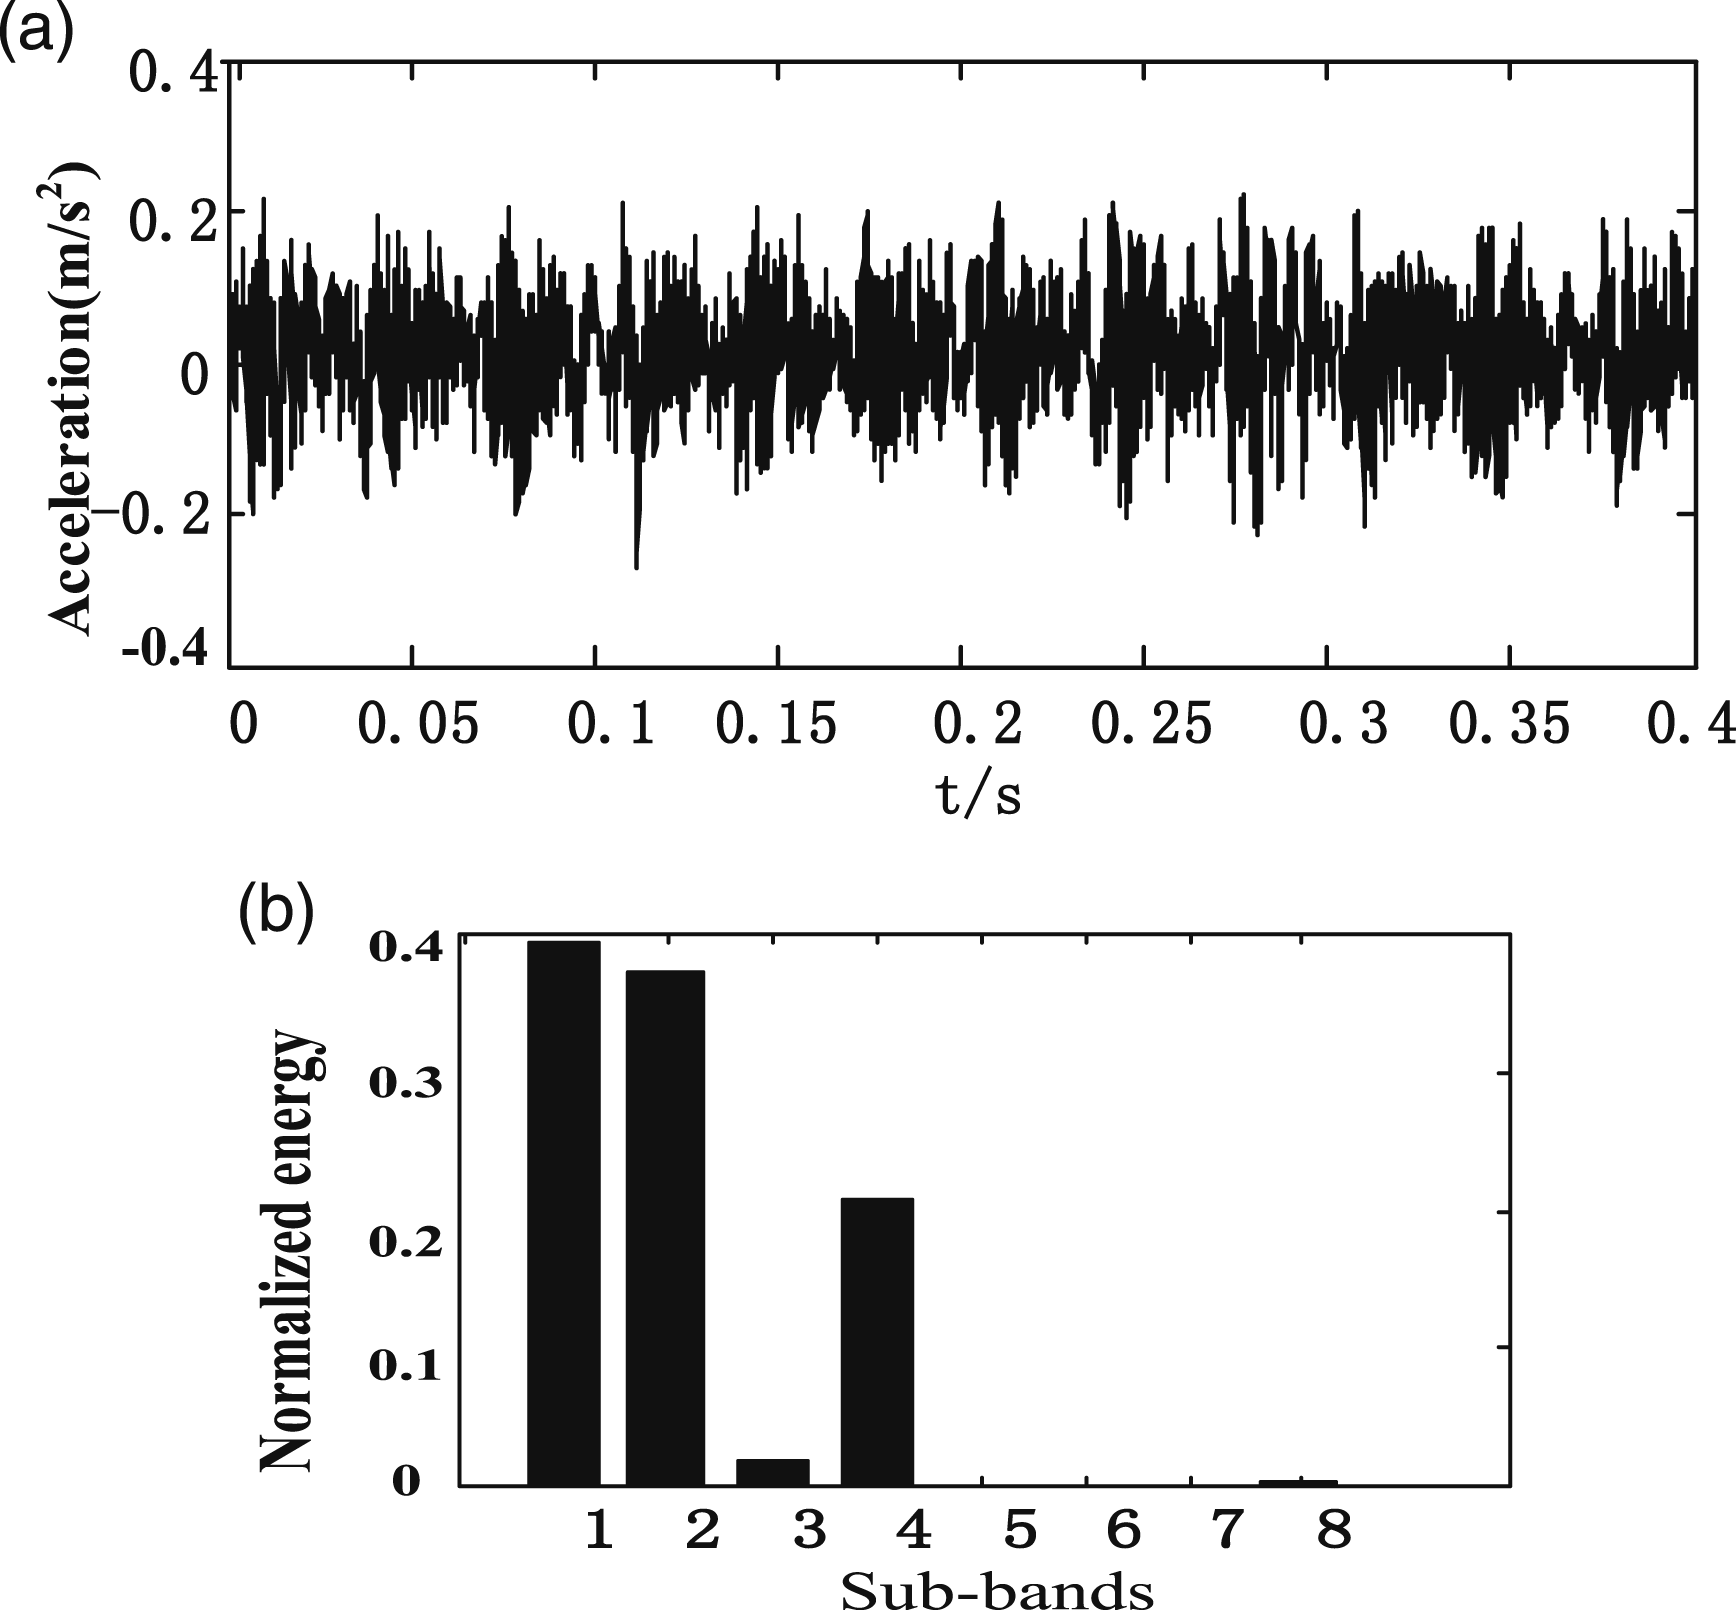
Figure 6(a) is a normal time-domain signal. The result of wavelet packet energy feature extraction on this signal is shown in Figure 6(b). Under normal conditions, the signal energy is mainly concentrated in the first four frequency bands, of which the maximum proportion of the first sub-band is 0.4 and the fourth sub-band is 0.2. The time-domain signal in Figure 6(a) shows no obvious change rule. Figure 7 is a schematic diagram of an energy feature extraction result of a time-domain signal of an inner ring fault. Time-domain signal and relative energy diagram of inner ring fault: (a) time domain of inner ring fault status; (b) relative energy of time-domain signal in inner ring fault state.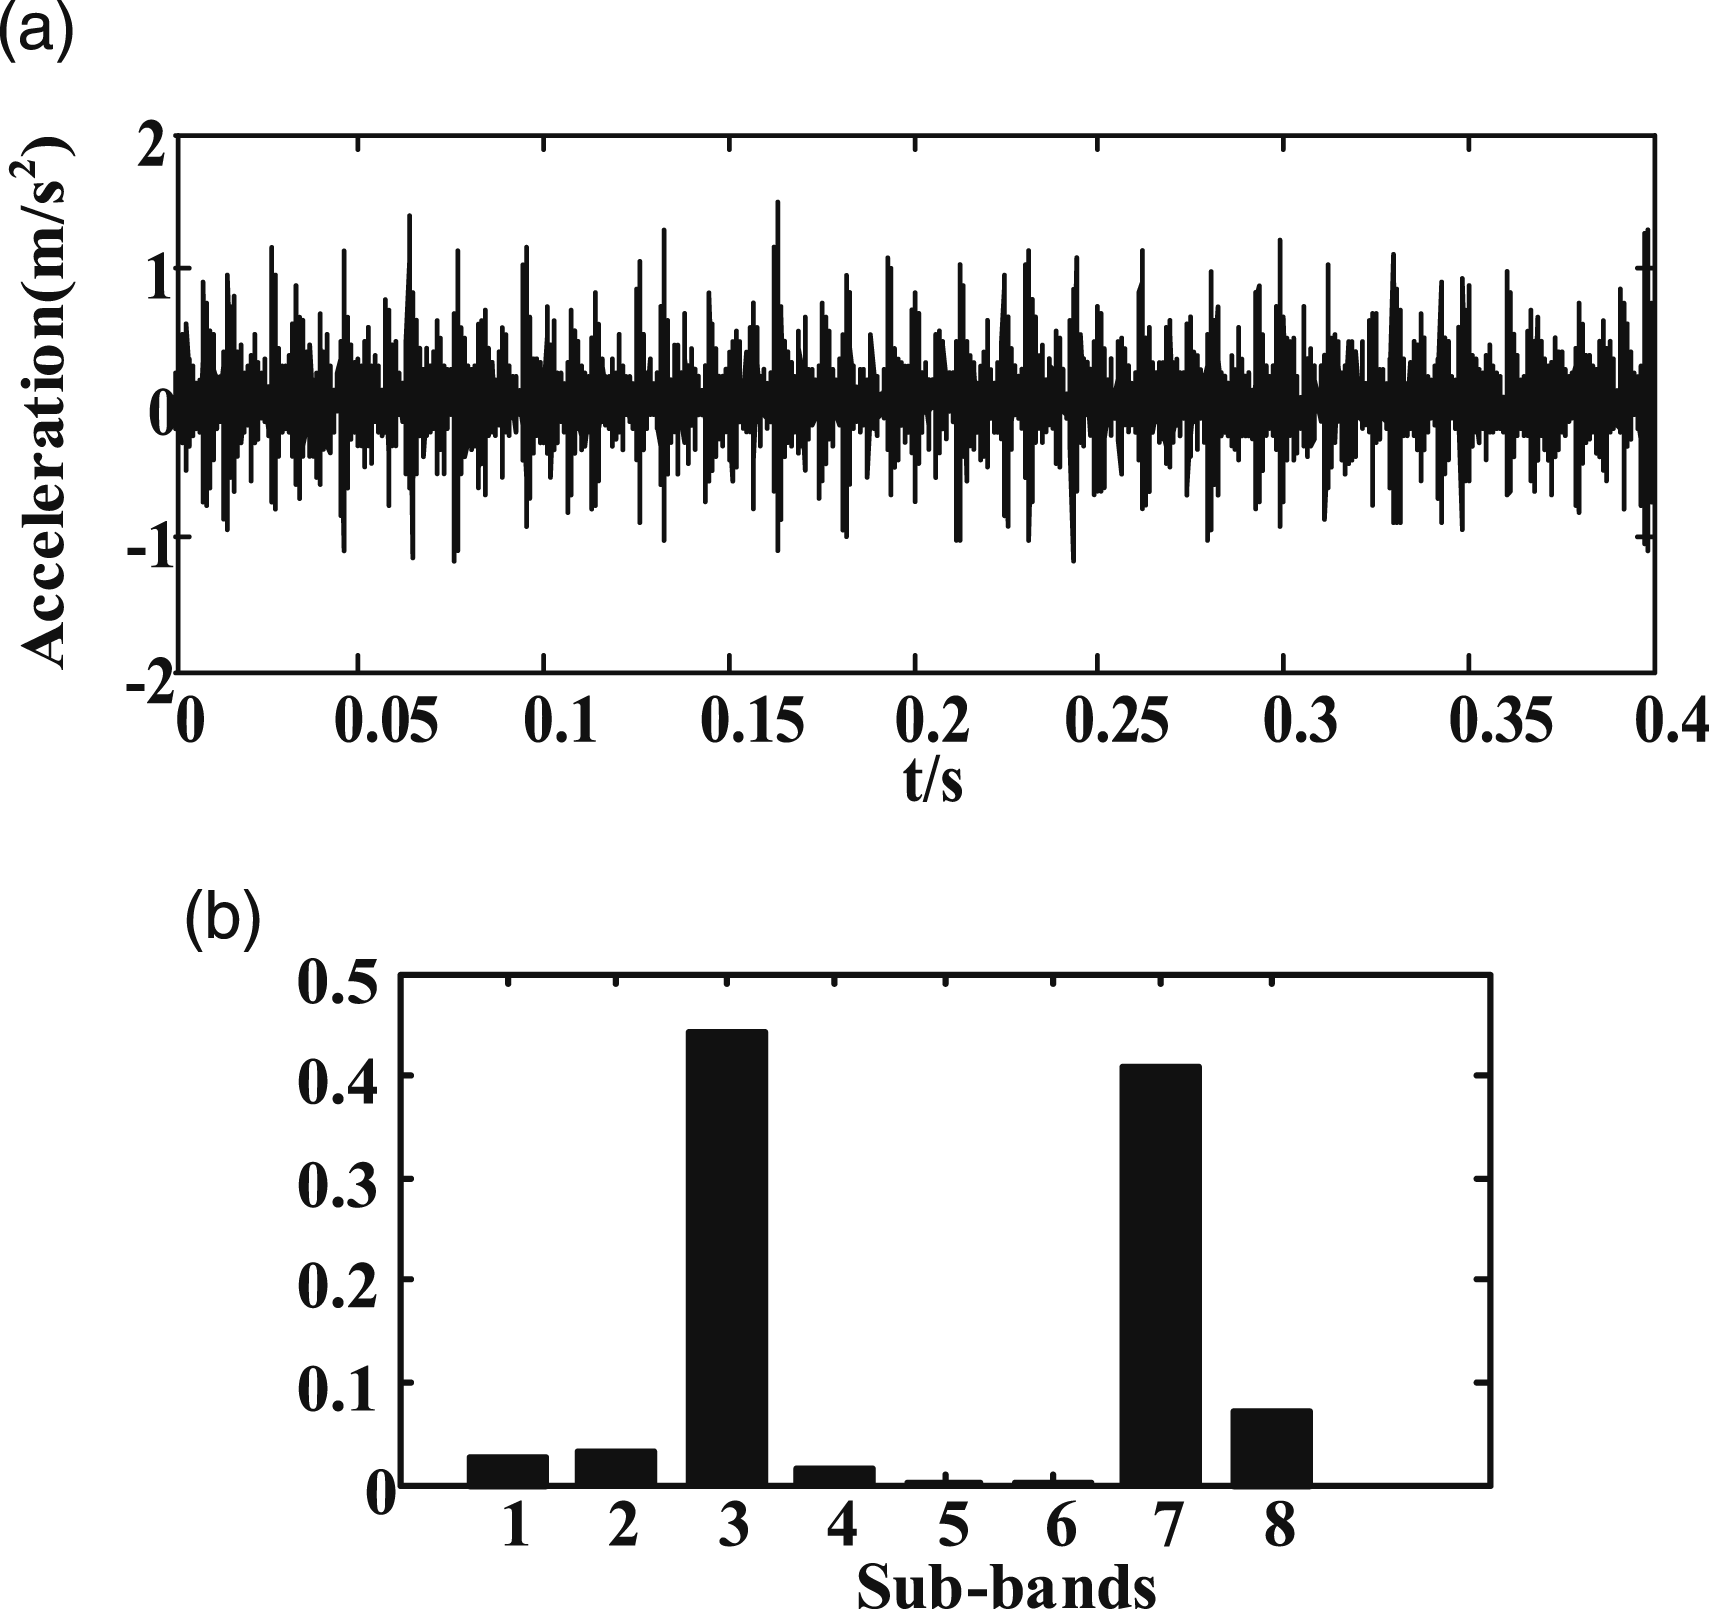
Figure 7(a) is the time-domain signal of the bearing inner ring fault vibration. The wavelet packet energy feature extraction result of this signal is shown in Figure 7(b). In the inner ring fault state, the signal energy is mainly concentrated in the third and seventh frequency bands, and the energy ratio of other frequency bands is about 0.2. It is seen from Figure 7(a) that periodic pulses appear in the time-domain signal. Figure 8 is a schematic diagram of an energy extraction result of a time-domain signal of an outer ring fault. Time-domain signal and relative energy diagram of outer ring fault: (a) time-domain signal of outer ring fault status; (b) relative energy of time-domain signal in outer ring fault state.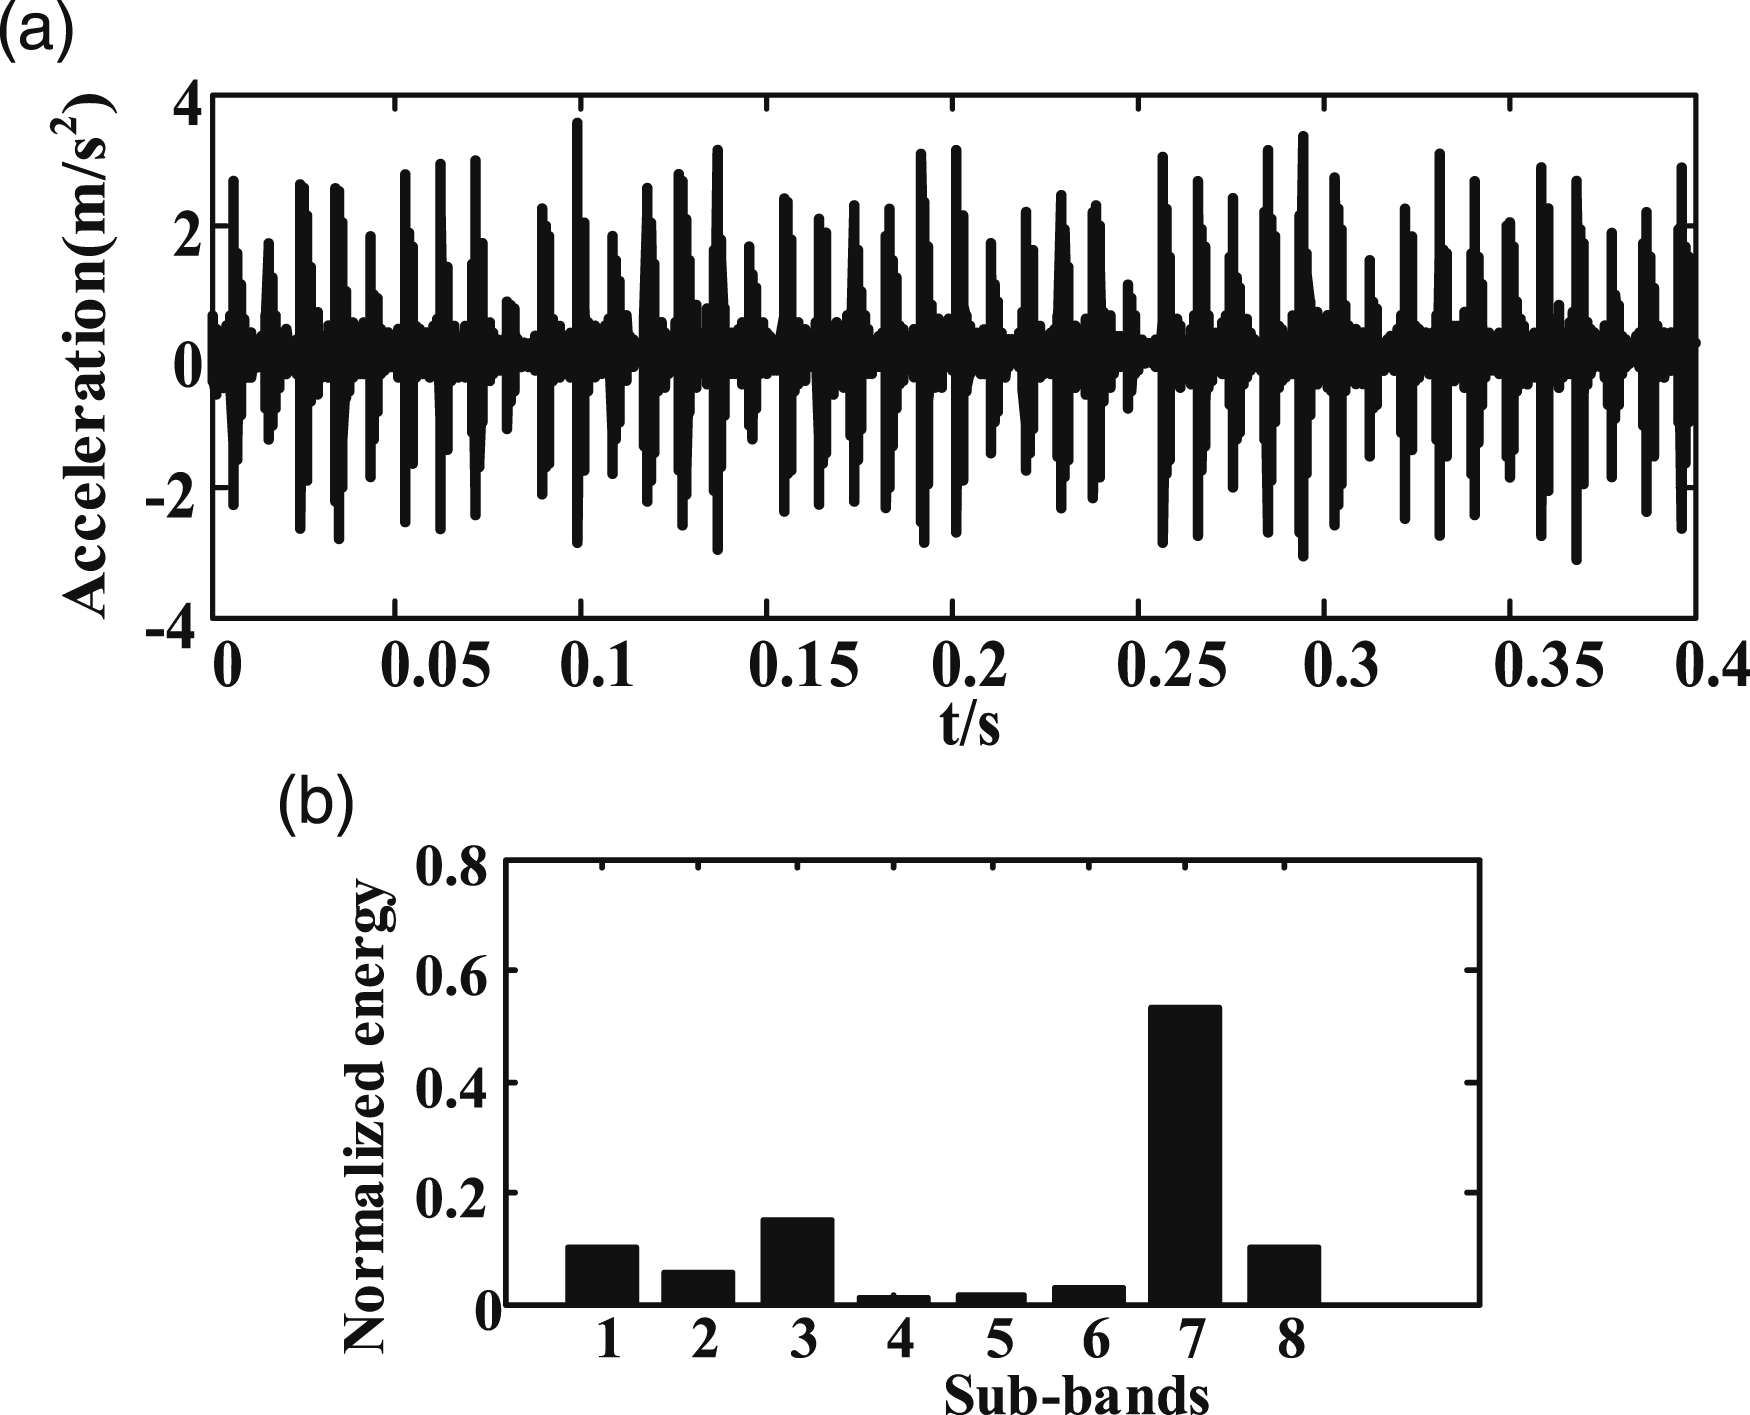
Figure 8(a) is the time-domain signal of the outer ring fault. It is seen from Figure 8(b), in the outer ring fault state, the signal energy is mainly concentrated in the third and seventh frequency bands, and the energy in other frequency bands ratio is about 0.2. However, compared with the inner ring fault, these two frequency bands each occupy a larger proportion, and it can be seen from Figure 8(a) that periodic shock pulses also appear in the time-domain signal. The result of the energy extraction of the rolling element fault time-domain signal is shown in Figure 9. Time-domain signal and relative energy diagram of rolling element failure: (a) time-domain signal of rolling element fault status; (b) relative energy of time-domain signals in rolling state.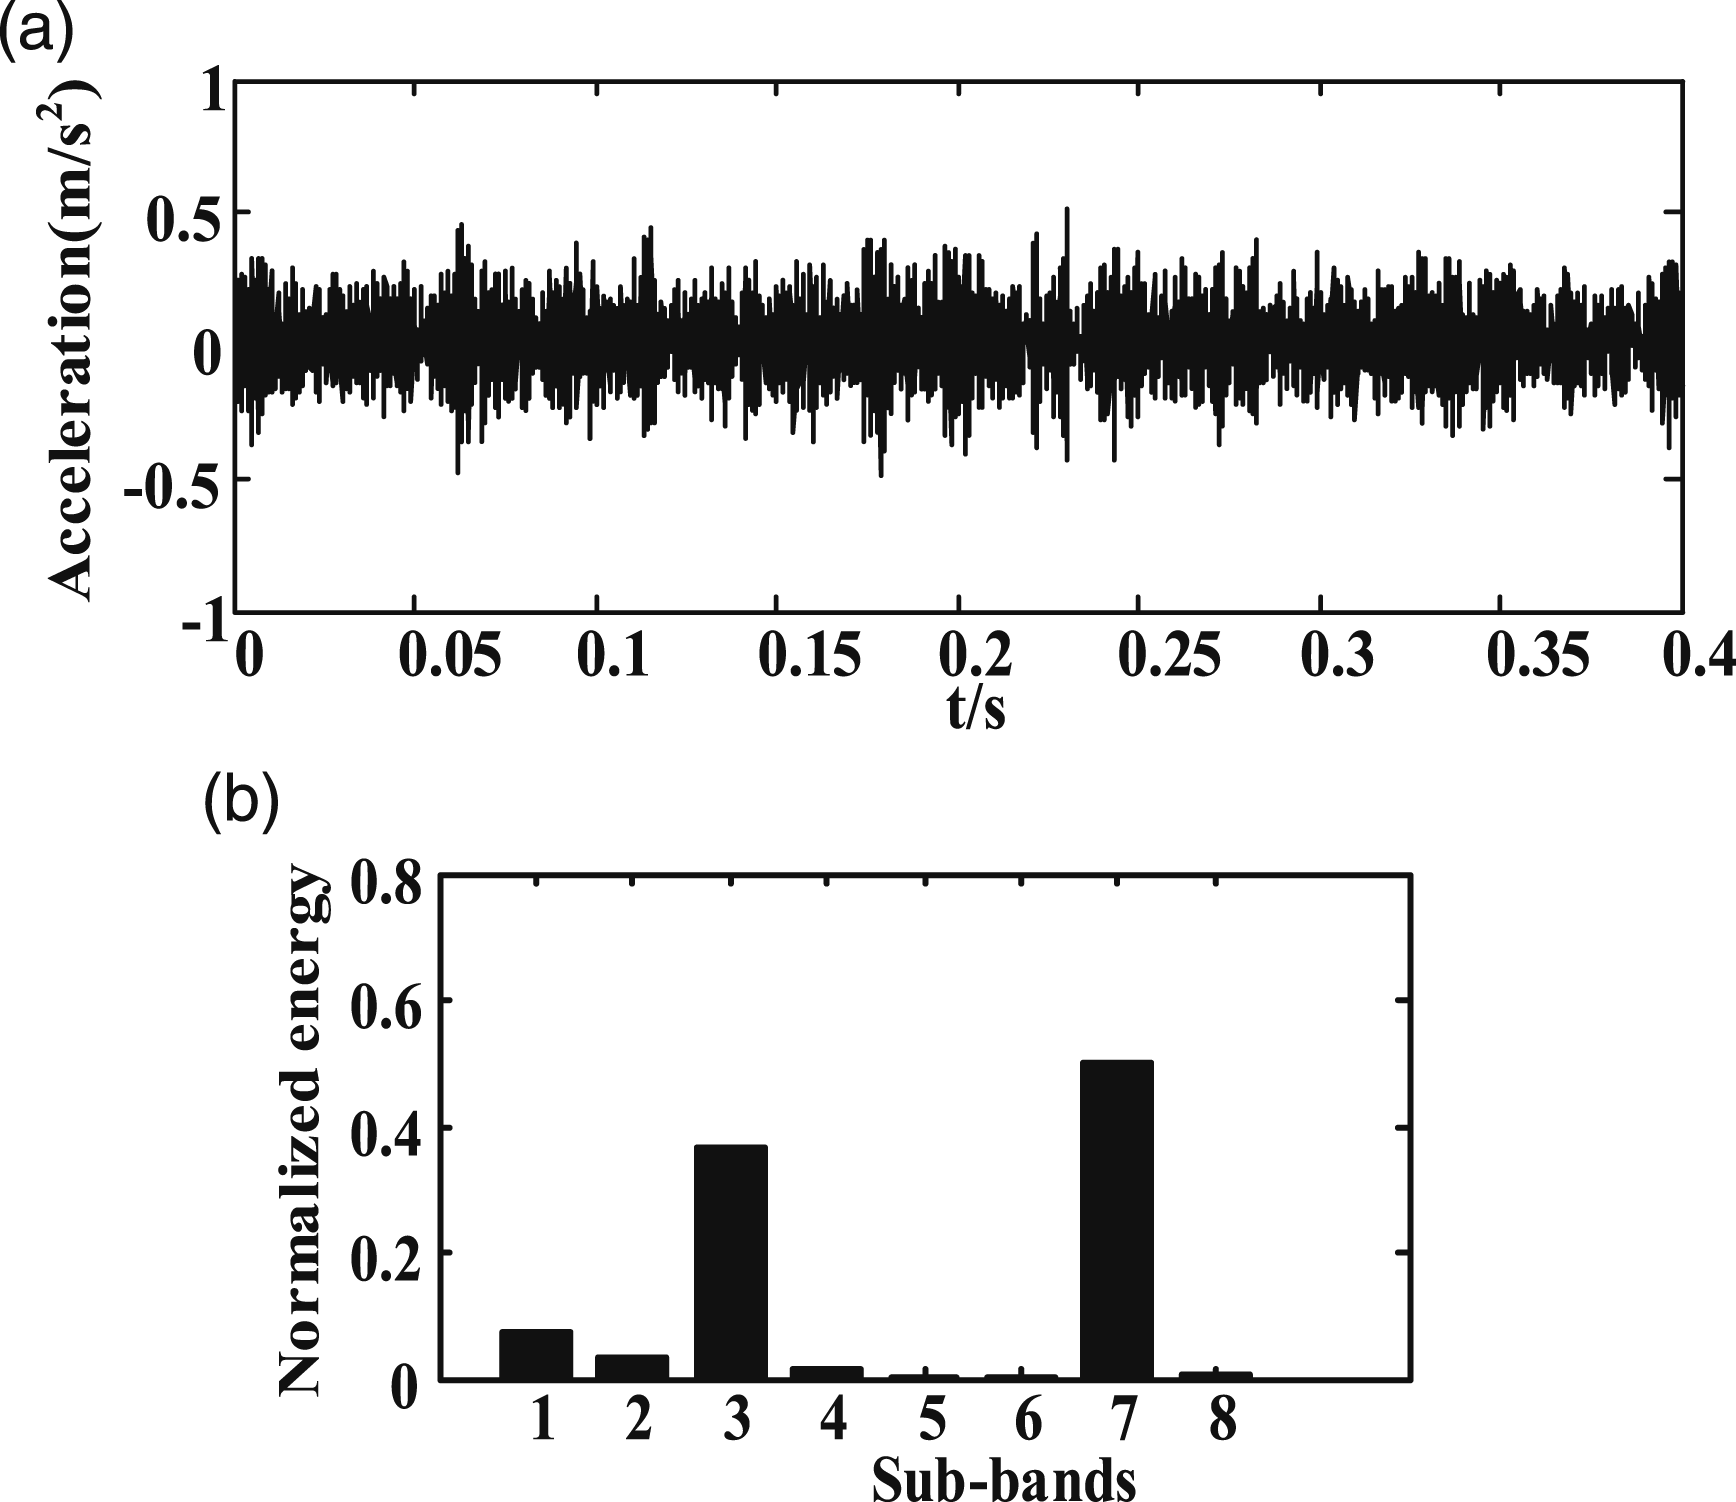
Among them, Figure 9(a) is the time-domain signal of rolling element failure. In the rolling element failure state, the signal energy is also mainly concentrated in the third frequency band and the seventh frequency band. However, compared with the fault of the outer ring, the energy of the third frequency band is increased, and there is no obvious rule can be seen from the time-domain signal in Figure 9(a).
It is obtained from the above experiment results that when different faults occur in the bearing, the energy of different sub-bands is different after wavelet packet decomposition. The energy values of the above frequency bands can be used as feature vectors for fault diagnosis, and then pattern recognition can be used to identify faults.
Feature parameter extraction method of vibration signal based on sample entropy analysis
Sample entropy algorithm
“Entropy” first appeared in thermodynamics and statistical physics. When investigating the phenomenon of energy conversion, it was used as a measure of the unavailability of energy. Nowadays, entropy is widely used in the field of information theory, and information entropy is used to quantitatively describe information. Information entropy theory states that, for an uncertain system, if a random variable X with a finite value is used to represent its state characteristics, the probability that X takes a value of 
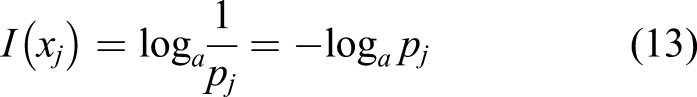
Shannon defines the mathematical expectation from the information 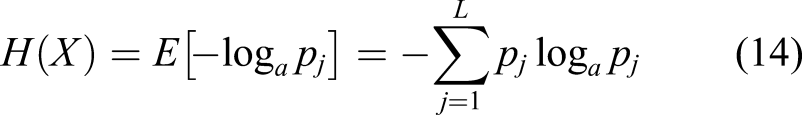
In order to characterize the complexity of the system, the scholar Sinai proposed the concept of approximate entropy, which is the precision of the concept of information entropy in a dynamic system. The present entropy is another related complexity measure proposed in order to overcome the Ln (0) that appears in the calculation process of approximate entropy. Sample entropy is a measure of the negative heterogeneity of a signal sequence. The more complex the sequence, the larger its sample entropy value. The application effect of sample entropy in vibration signal analysis is better than simple statistical parameters, such as mean, variance, standard deviation, etc.
Let the original data sequence be x(1), x(2),..., x(N), a total of N data points, and the detailed steps of calculating the sample entropy of the signal sequence are Given the dimension m, an m-dimensional vector is composed of the original sequence 2. Calculate the distance between x(i) and x(j). The calculation formula is shown in equations (2)–(14) 3. Set the threshold value r; calculate the number of d(i, j) < r for each I value and the ratio of this number to the total distance N − m + l, denoted as 4. Given a dimension of m + 1, repeat steps (1)–(3) to get 5. If N is a finite value, the formula for calculating the sample entropy of this sequence is shown in equation (18)
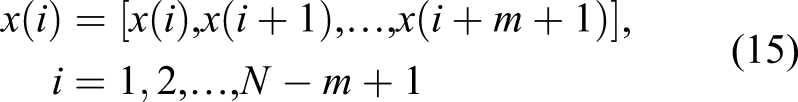
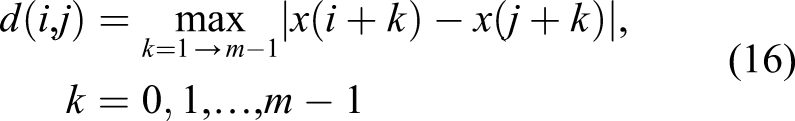
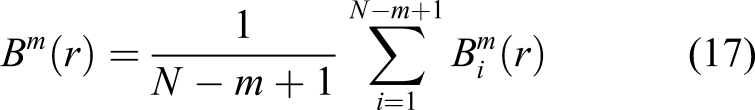
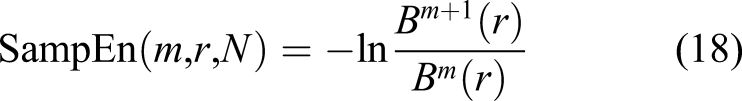
In this paper, the sample standard entropy is taken as the standard deviation of the sequence N = 1024, m = 2, and r = 0.2.
Research and analysis of measured vibration signal
The vibration signal under the fault condition of rotating machinery has nonstationary and nonlinear characteristics. The sample entropy is used to analyze the complexity of this type of signal. The CWRU website bearing experimental data is still used, in which the bearing damage is 0.1778 mm and the load is 2 hp (1470.988 w). The sample entropy is calculated for each of the 40 sets of vibration signals in each state. The results are shown in Figure 10. Sample entropy distribution map for different fault states.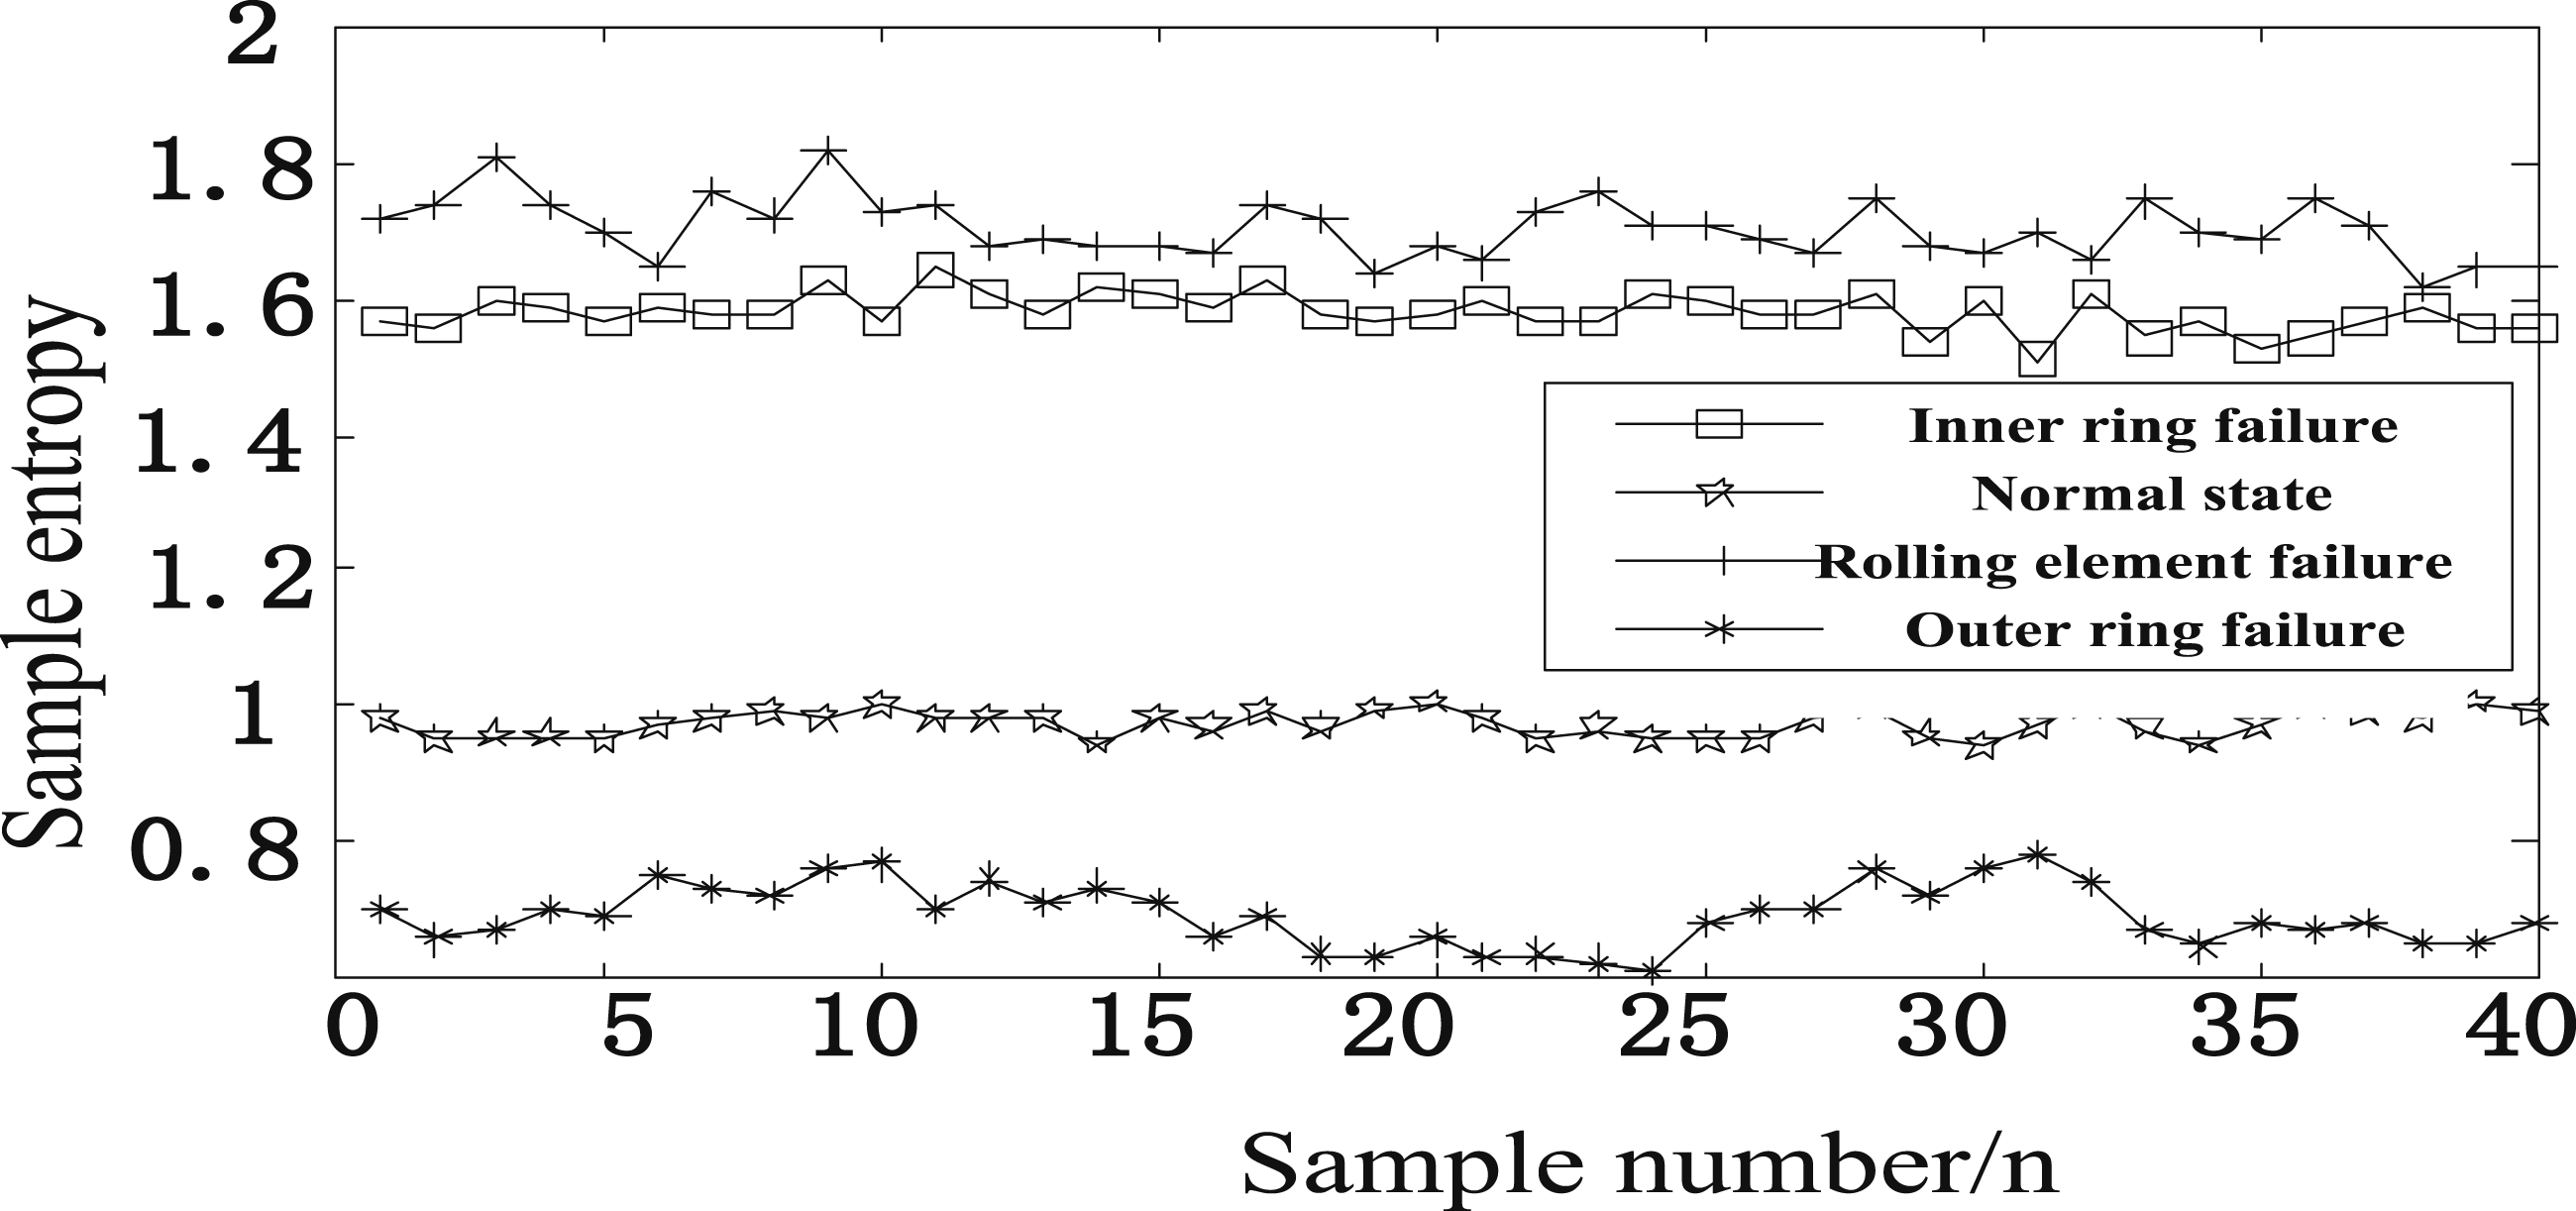
It can be seen from Figure 10 that the calculation of sample entropy does not depend on the data length; the sample entropy has better consistency. The lower the value of sample entropy, the higher the self-similarity of the sequence; the larger the value of sample entropy, the more complex the sample sequence. The sample entropy is the largest when the rolling element fault occurs, and the sample entropy is the smallest when the outer ring fault occurs. It can be seen from Figure 10 that the sample entropy is the largest when the rolling element fault occurs, and the sample entropy is the smallest when the outer ring fault occurs; the sample entropy value is different under different faults.
Wavelet packet sample entropy vibration signal feature parameter extraction method
Sample entropy algorithm
Because wavelet packet decomposition has energy accumulation characteristics, the higher the signal energy of the decomposed sub-band, the more fault information it contains. Therefore, the vibration signal is decomposed by the wavelet packet method, and then the entropy of the decomposed and reconstructed signal is calculated. The analysis of the wavelet packet energy feature extraction results shows that the signal energy is mainly concentrated in three frequency bands, and the remaining five frequency bands contain less energy. The signals in the three frequency bands with the greatest energy are reconstructed, and the sample entropy is calculated. The detailed calculation method steps are as follows: Select the db9 wavelet base to perform three-layer wavelet packet decomposition on the bearing vibration signal. Calculate the energy values of a total of eight node signals in the third layer after wavelet packet decomposition, and the energy feature vector is formed for the calculated energy value in the order of the first to the eighth node. Sort the extracted energy feature vectors from large to small, select the first three sub-bands with larger energy, reconstruct the signals corresponding to the child nodes, and calculate the sample entropy of the reconstructed signals. The calculated three sample entropy values are used as feature vectors for fault diagnosis and analysis of measured vibration signals.
Using a vibration signal with a bearing damage of 0.1778 mm and a load of 2 hp, wavelet packet sample entropy is calculated for 40 groups of signals in each state, and 40 three-dimensional feature vectors can be obtained. The sample entropy of the reconstructed signal at the maximum energy node after wavelet packet decomposition is shown in Figure 11. Sample entropy of the reconstructed signal at the maximum energy node after wavelet packet decomposition.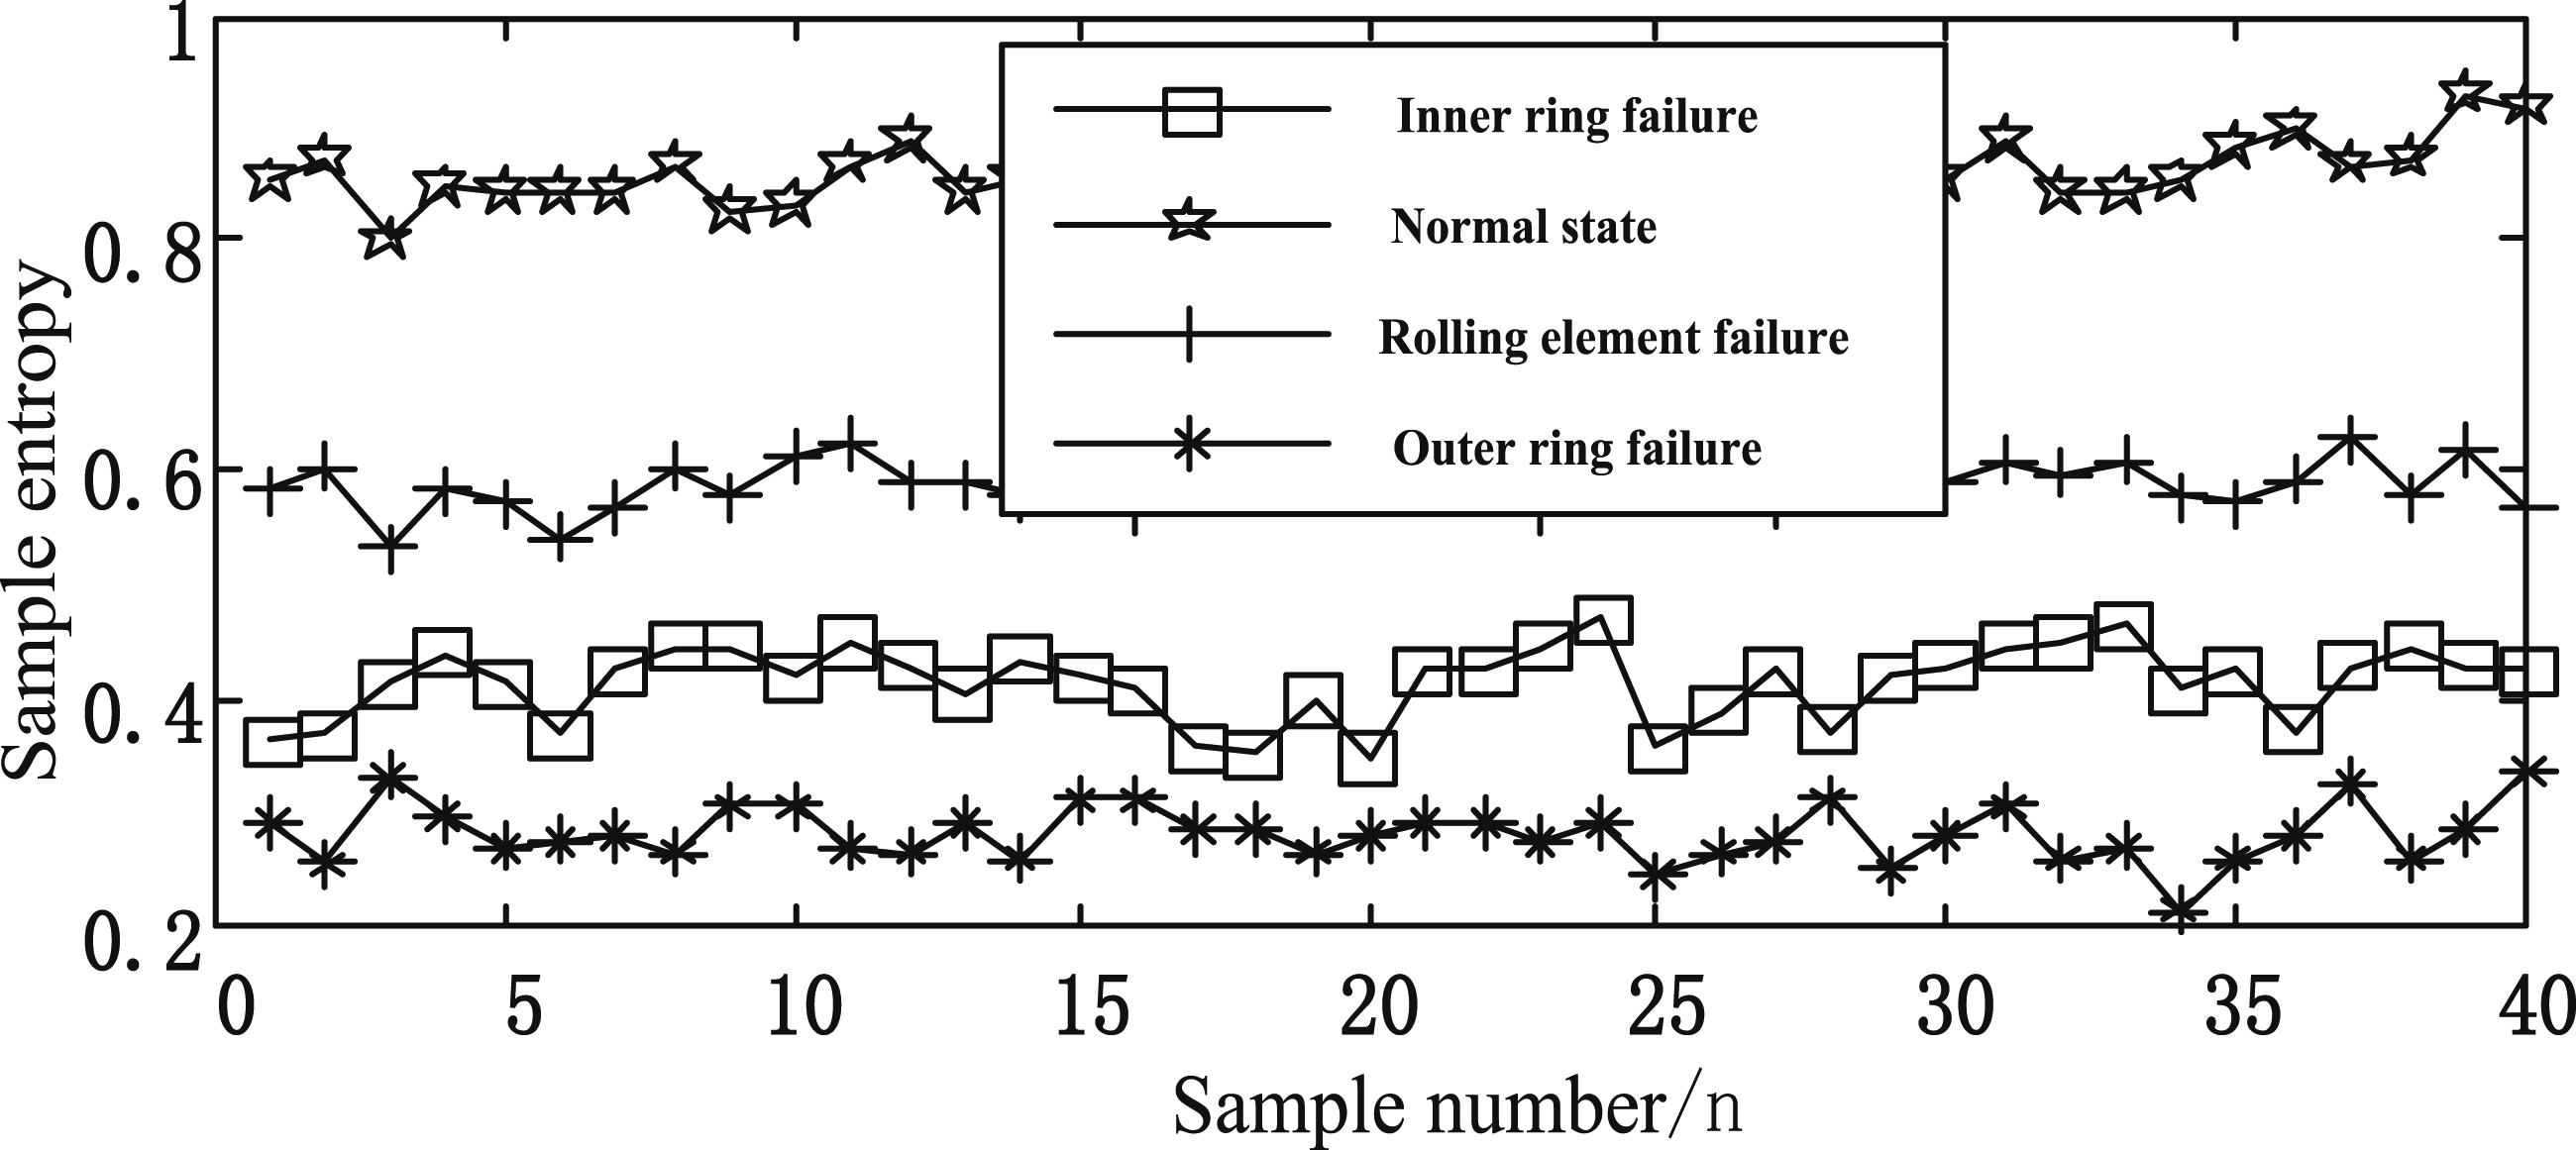
It can be seen from Figure 11 that the sample entropy values of the four states of inner ring failure, rolling body failure, outer ring failure, and normal are different. Although the wavelet packet sample entropy values of the four states are all reduced, the sample entropy values of the rolling element failure and the inner ring failure do not overlap significantly, which is better than the sample entropy calculated directly in Figure 10 for fault discrimination.
Conclusion
The improved wavelet threshold quantization function is used to de-noise the measured vibration signal to obtain better results than the traditional threshold de-noising. The method of extracting the characteristics of the vibration signal from wavelet packets and sample entropy is studied, and the measured vibration signal is verified and analyzed. Aiming at the problem that the direct calculation of sample entropy of rotary machinery bearing vibration signals has low discrimination to faults, the feature parameter extraction method of wavelet packet sample entropy is adopted to overcome the shortage of direct calculation. Finally, the extraction and analysis of vibration signal characteristic parameters under four states of normal rolling bearing, inner ring fault, outer ring fault, and rolling element fault are completed.
Wavelet packet energy feature extraction is performed on time-domain signals. In normal state, the signal energy is mainly concentrated in the first four frequency bands, of which the first sub-band accounts for the largest proportion of 0.4 and the fourth sub-band is 0.2; in the inner ring fault state, the signal energy is mainly concentrated in the third and seventh frequency bands, and the energy of other frequency bands accounts for about 0.2; in the outer ring failure state, the signal energy is mainly concentrated in the third and seventh frequency bands, and the energy of other frequency bands is occupied, the ratio is about 0.2, but compared with the inner ring failure, these two frequency bands each account for a larger proportion; in the rolling element failure state, the signal energy is mainly concentrated in the third and seventh frequency bands, and the energy of other frequency bands is occupied, the ratio is small, but compared with the outer ring failure, the energy of the third frequency band is increased. The experimental results show that different faults can be judged by using wavelet packet energy features and sample entropy features, which provides a basis for the subsequent construction of fault diagnosis feature vectors.
Footnotes
Declaration of Conflicting Interests
The author(s) declared no potential conflicts of interest with respect to the research, authorship, and/or publication of this article.
Funding
The author(s) disclosed receipt of the following financial support for the research, authorship, and/or publication of this article: This project is sponsored by the fund for Sichuan Science and Technology Program (Grant No. 2018F20050).