
Abstract
In this paper, a synchronous acquisition system of milling temperature and milling vibration was established to measure the data of milling temperature and milling vibration. Based on grey correlation theory, the influence of milling parameters and milling vibration on milling temperature was analyzed. It is found that the grey correlation degree between milling temperature and milling parameters and vibration is above 0.70, indicating that milling parameters and vibration have great influence on temperature. In addition, the GM (0, N) grey prediction model of milling temperature on milling parameters and milling vibration was established, and the correlation coefficient of the model was above 0.8, indicating that the reliability of the model was high, and the correlation between milling temperature and milling vibration signal was high.
Introduction
Compared with other metal materials, titanium alloy has higher tensile strength, lower density, excellent corrosion resistance, and high-temperature resistance. However, titanium alloy is a typical difficult-to-machine material because of its poor thermal conductivity and high relative friction coefficient. 1 At present, problems such as high temperature and large vibration in the cutting process of titanium alloy have led to poor machinability and long manufacturing cycle, which poses severe challenges to the aerospace manufacturing industry. 2
In recent years, many experts and scholars have studied the cutting temperature and cutting vibration in metal cutting process from the aspects of theory, numerical simulation, and experimental verification. 3 Davies (2007) reviewed several widely used cutting temperature measurement methods and showed how to monitor the cutting temperature during material removal 4 ;Astakhov (2019) proposed the importance of temperature measurement in the metal cutting process. In the process of metal cutting, different processing methods have different effects on temperature. 5 Zhang (2018) developed a tool-workpiece thermocouple system to study the effect of cutting fluid on the cutting temperature of Ti6Al4V alloy during high-speed ultrasonic vibration cutting 6 ; Venkatesan (2014) analyzed the influence of laser cutting parameters (cutting speed, feed rate, and laser power) on cutting temperature through experimental research on Inconel 718 laser-assisted processing 7 ; Xavior (2014) carried out precision turning of Ti6Al4V titanium alloy. Based on the experimental data, the effects of cutting speed, feed speed, cutting depth, and tool-tip radius on cutting tool temperature were analyzed 8 ; Veeranaath (2018) studied the change law of metal cutting parameters on the temperature of PCBN tools during dry machining of Ti6Al4V. In addition, with the development of computer science and technology, finite element simulation has become the main means to study cutting heat and cutting temperature. 9 Yang (2014) established the finite element model of spiral double edge cutting, simulated the milling process of titanium alloy, and analyzed that the highest cutting temperature was located at the tool chip interface and was closer to the cutting edge 10 ; Pervaiz (2018) proposed a coupled program based on finite element analysis and computational fluid dynamics to obtain the best value of convective heat transfer coefficient and study the flow heat transfer coefficient under different cutting environments 11 ;Imbrogno (2017) developed a new three-dimensional finite element model to predict the change of temperature during semi-finishing Ti6Al4V under dry and low-temperature conditions, and calibrated and verified it.
The cutting process is a complex process involving the coupling of material deformation, stress, strain rate, and cutting temperature under the interaction of tool and work-piece. At the same time, the sharp relative vibration between the tool and the work-piece is called cutting vibration. The cutting vibration affects the surface quality, reduces the service life of the tool, and improves the cost of the industrial processing. 12 Albertelli (2016) measured tool vibration during milling based on indirect multi-sensor of the process 13 ; Yurkevich (2006) used a displacement sensor to measure tool-vibration during turning. In the metal cutting process, different processing methods will have different effects on vibration. Fang (Fang,2011; Fang,2013; Fang,2010)14–16 studied the effect of tool edge wear on cutting vibration in 3D high-speed finish machining of nickel-base superalloy Inconel 718 based on experiments. Based on the finite element simulation analysis software, 17 Luo (2020) studied the influence of cutting and vibration parameters on the machining performance of 7075-T651 aluminum alloy in unidirectional ultrasonic vibration cutting 18 ;Chen(2011) used best design to model and analyze the vibration of diamond tools in precision turning.
In addition, some scholars have studied the coupling characteristics of cutting heat and cutting force in the process of cutting. 19 Wang (2016) established the relationship between cutting parameters, cutting temperature, and cutting force based on response surface method (RSM) 20 ; Zhang (2018) predicted the influence of cutting parameters on cutting force and cutting temperature through simulation, and established the prediction model of cutting force and cutting temperature. Based on the finite element analysis and PVL model, 21 Ebrahimi (2019) predicted the cutting force and tool temperature under different turning conditions.
To sum up, it can be found that scholars focus on the experimental and Numerical Simulation Research on the influence of cutting elements and processing methods on cutting vibration and cutting temperature. In the aspect of thermal-force-vibration coupling characteristics, there are many research results on the coupling of cutting heat and cutting force, while there are few achievements on the real-time synchronous acquisition of titanium alloy cutting vibration and cutting temperature. Therefore, the comprehensive research on cutting temperature and cutting vibration needs to be further strengthened. 22 On the basis of testing the basic mechanical properties of titanium alloy, a synchronous acquisition system for milling temperature and vibration of titanium alloy was established. Through the milling experiment, the relationship between different milling parameters, milling vibration, and milling temperature was analyzed. Based on the grey correlation theory, a multivariate grey prediction model of milling temperature on milling parameters and milling vibration was established. The model can provide theoretical guidance for monitoring the state of the milling system and provide a necessary state equation for numerical simulation of the milling thermal-vibration coupling. The research content is shown in Figure 1.
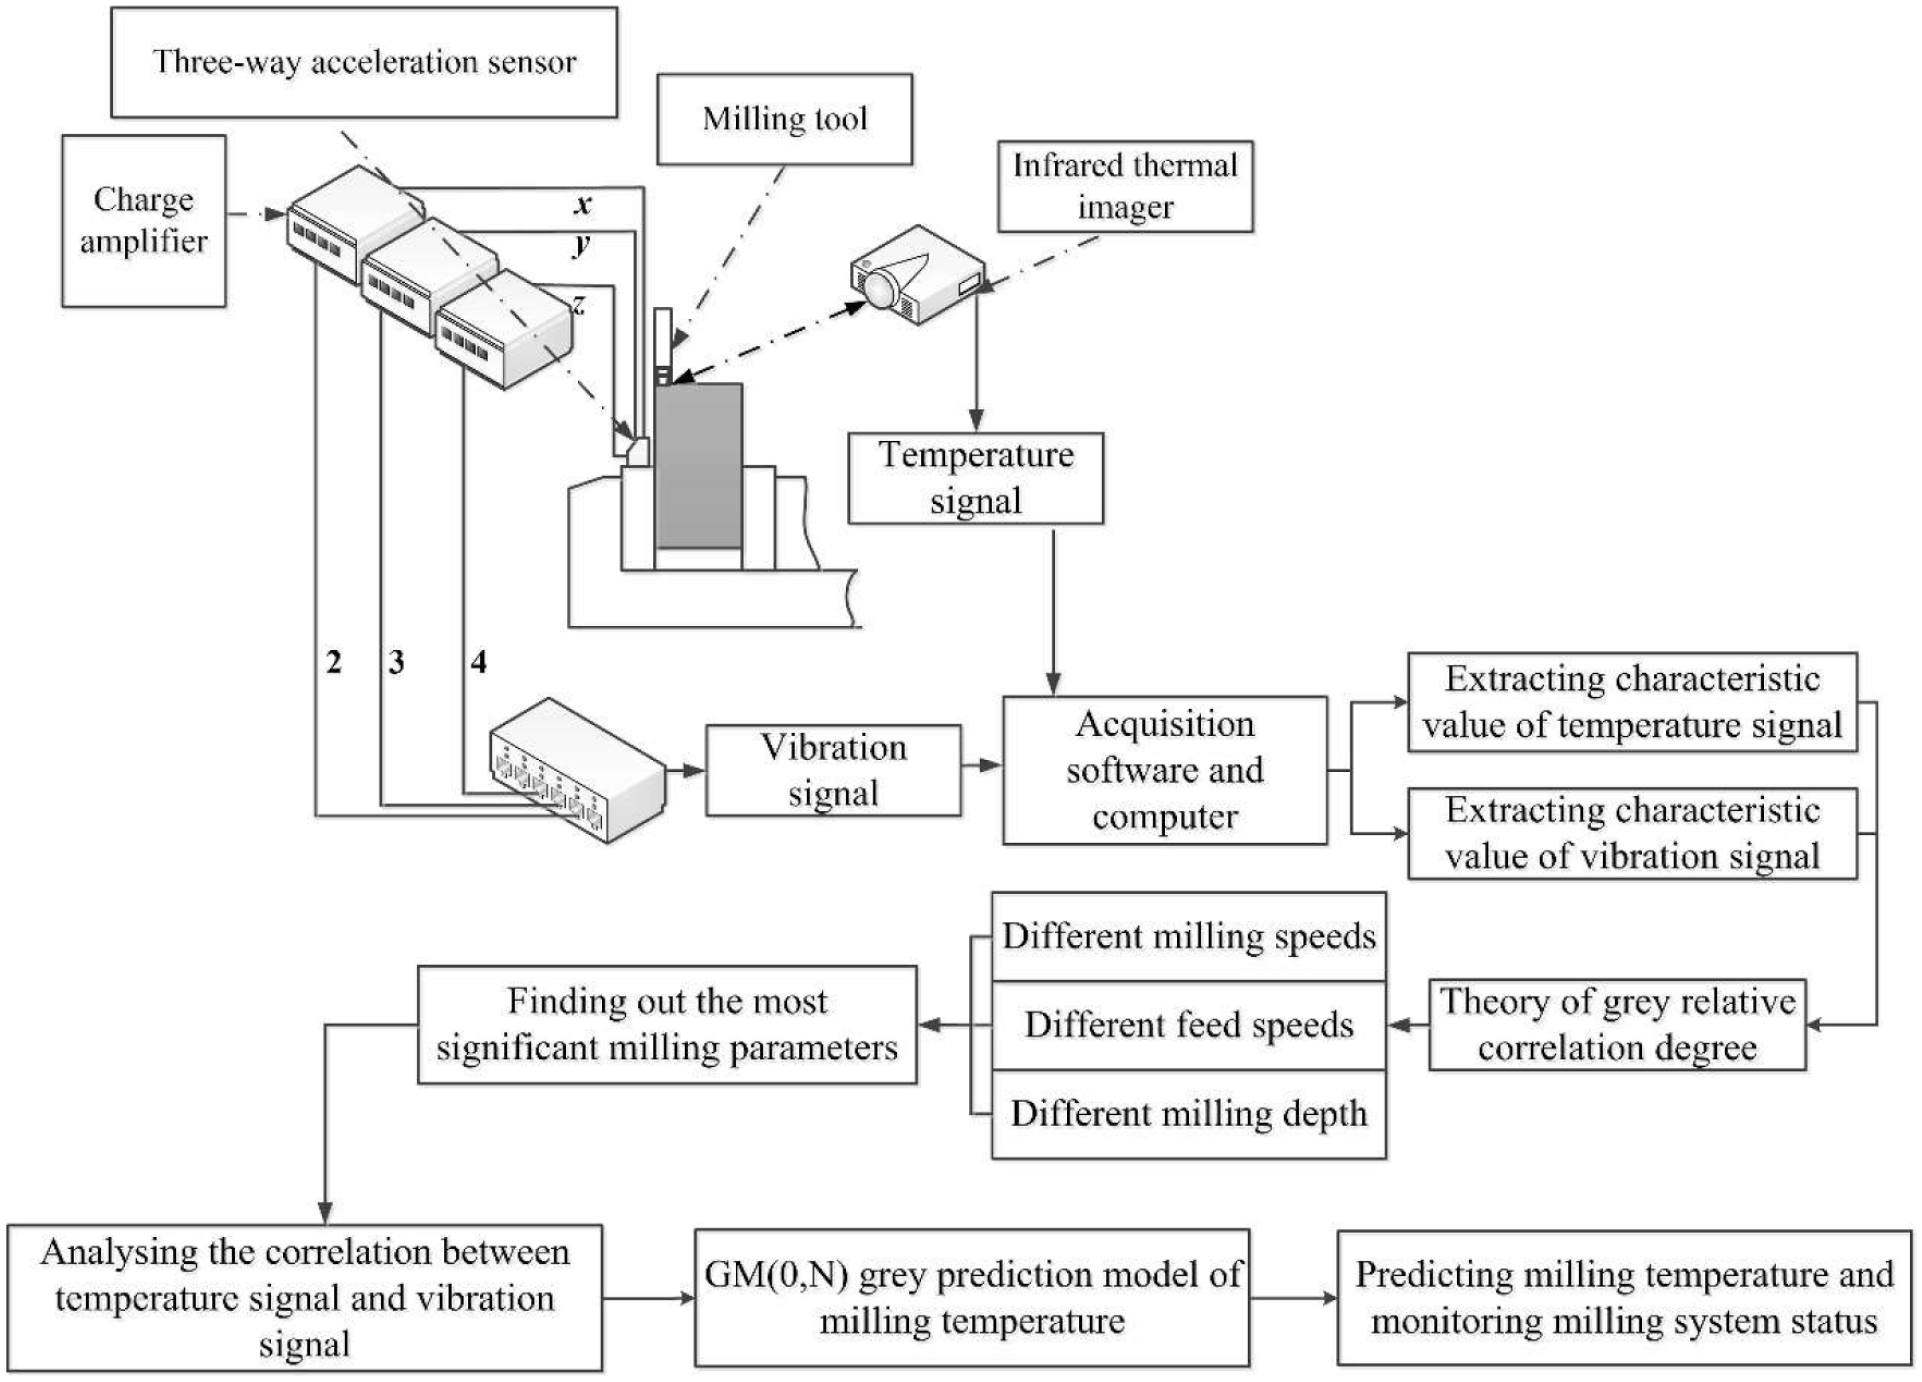
Research content.
Experimental design and scheme
Milling test equipment and work-piece
The milling test system is shown in Figure 2. The XKA714 CNC milling machine produced by Beijing No.1 Machine Tool Works is used in this test. Its weight is about 3500 kg, and the maximum bearing weight is 1500 kg. In the process of milling, the milling tool rotates clockwise around the fixed axis and the work-piece feeds, so as to complete the machining of metal surface. The work-piece movement is divided into three directions: x, y, and z. The x-direction is the radial milling width direction, the y-direction is the feed direction, and the z-direction is the milling depth direction, as shown in Figure 3. The test work-piece is a TC4 titanium alloy cube of 100*100*40 mm, and its material composition is shown in Table 1. The cutting tool used in the test is carbide four edge end mill with a diameter of 10 mm.
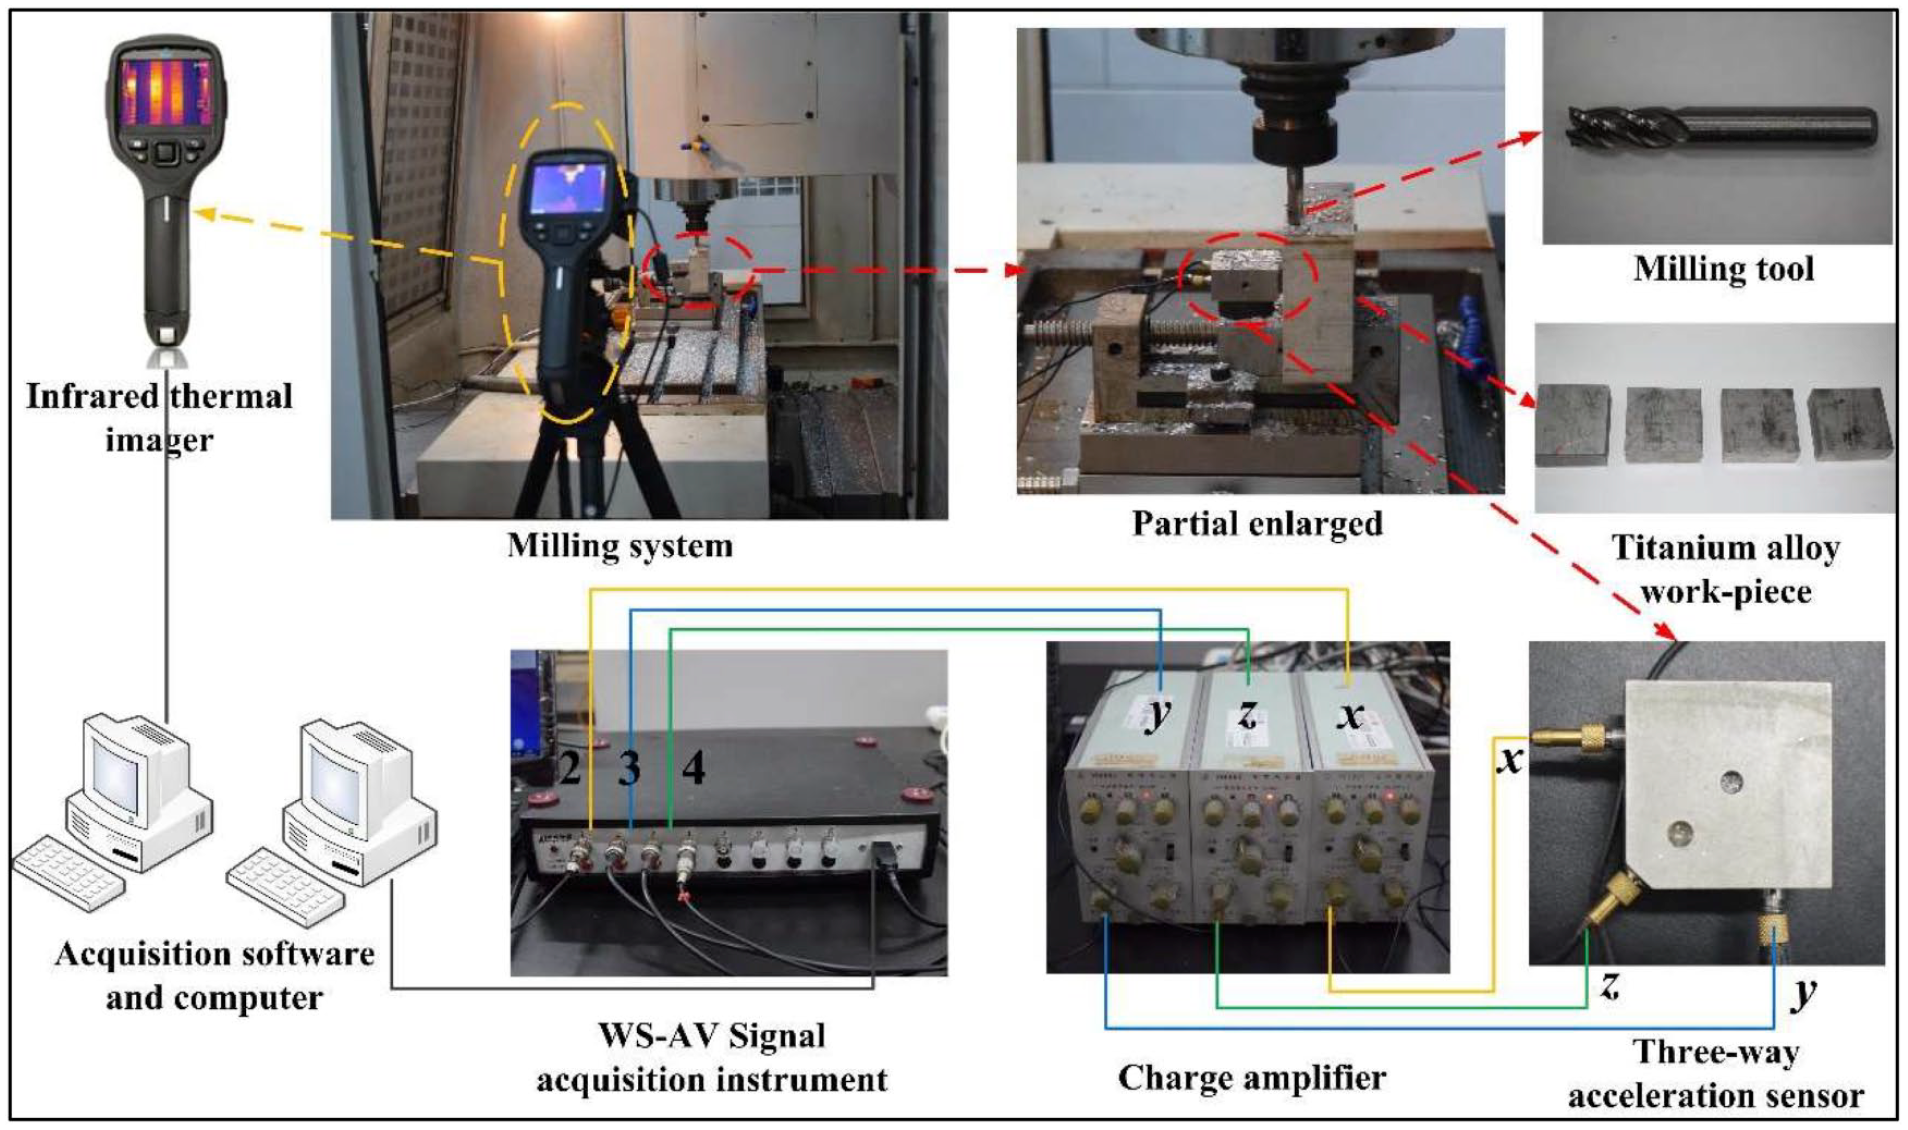
Milling test system.
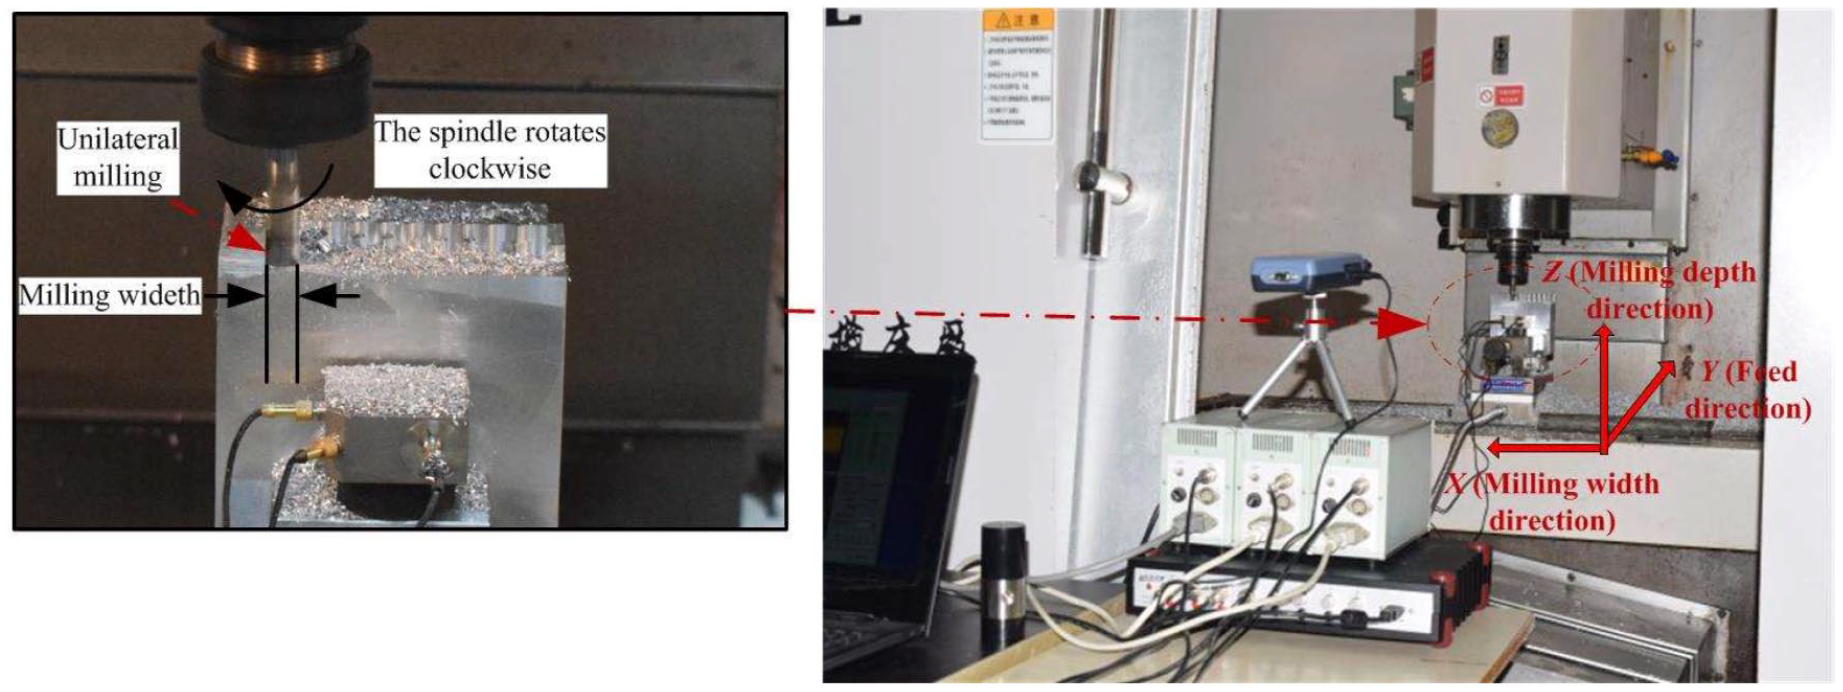
Milling direction.
Composition of titanium alloy materials.

The temperature measurement system consists of FLIR E60 series non-contact infrared thermal imager, FLIR Tools acquisition software, and computer. The emittance range of the infrared thermal imager is 0–1, the thermal sensitivity is 30°C < 0.05°C, the infrared resolution is 320*240, and the optimal temperature measurement range is −20–650°C.
The vibration measurement system is composed of the YD-21 piezoelectric three-way acceleration sensor, YE5852 charge amplifier, WS-AV acoustic and vibration signal acquisition instrument, matching acquisition software, and computer. The frequency band range of the three-way acceleration sensor is 0.2–4000 Hz, and the maximum transverse sensitivity ratio is <5%. The x, y, and z directions of the three-way acceleration are connected to the charge amplifier, respectively, which converts the collected charge signals into voltage signals. Then, the charge amplifier is connected to channels 2, 3, and 4 of the signal acquisition instrument, and the sampling frequency of the signal acquisition instrument is set at 2000 Hz.
Mechanical properties test of TC4 titanium alloy
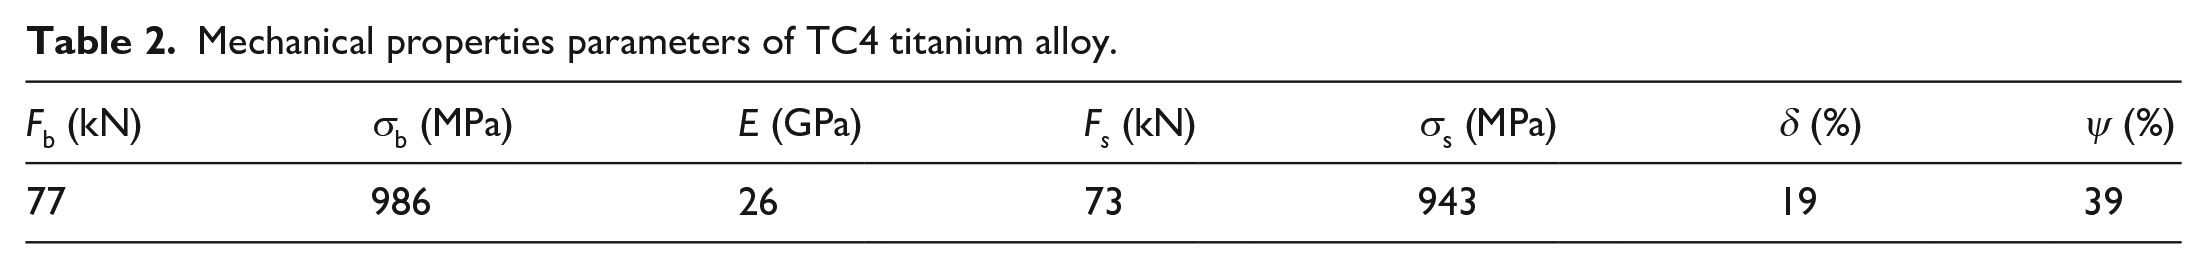
Before the milling test, the TC4 titanium alloy material was processed into a standard specimen with a diameter of 10 mm and a standard distance of 100 mm for the uniaxial tensile test. The corresponding load–displacement curve and section of the specimen are shown in Figure 4. The maximum tension of the corresponding material is denoted as
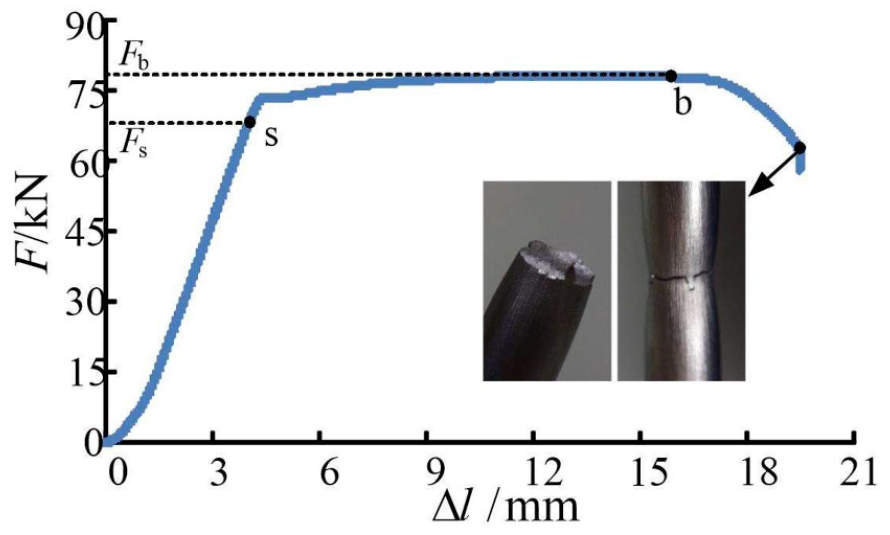
Load–displacement curve of TC4 titanium alloy under uniaxial tension.
Mechanical properties parameters of TC4 titanium alloy.
Test scheme
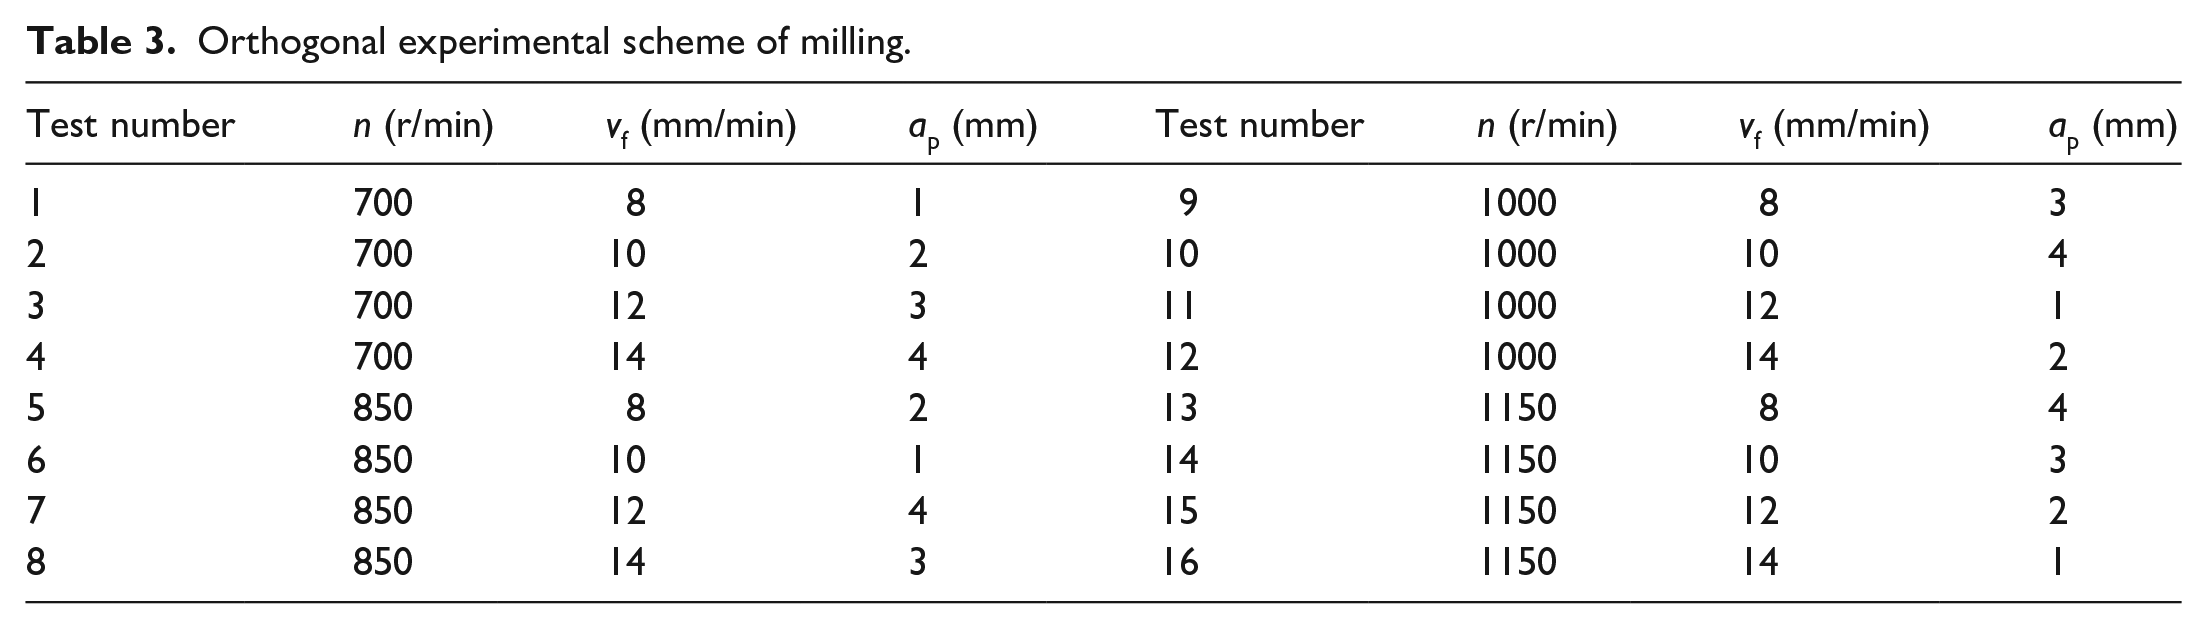
In the milling process of titanium alloy, different processing parameters have a great influence on milling temperature and vibration. In order to study the influence of different process parameters on milling temperature and vibration of titanium alloy, an orthogonal experiment with three factors and four levels was designed. The three factors are spindle speed n, feed speed vf, and milling depth ap. The test scheme is shown in Table 3.
Orthogonal experimental scheme of milling.
Experimental results and analysis
Time-domain curves of temperature and vibration acceleration in milling
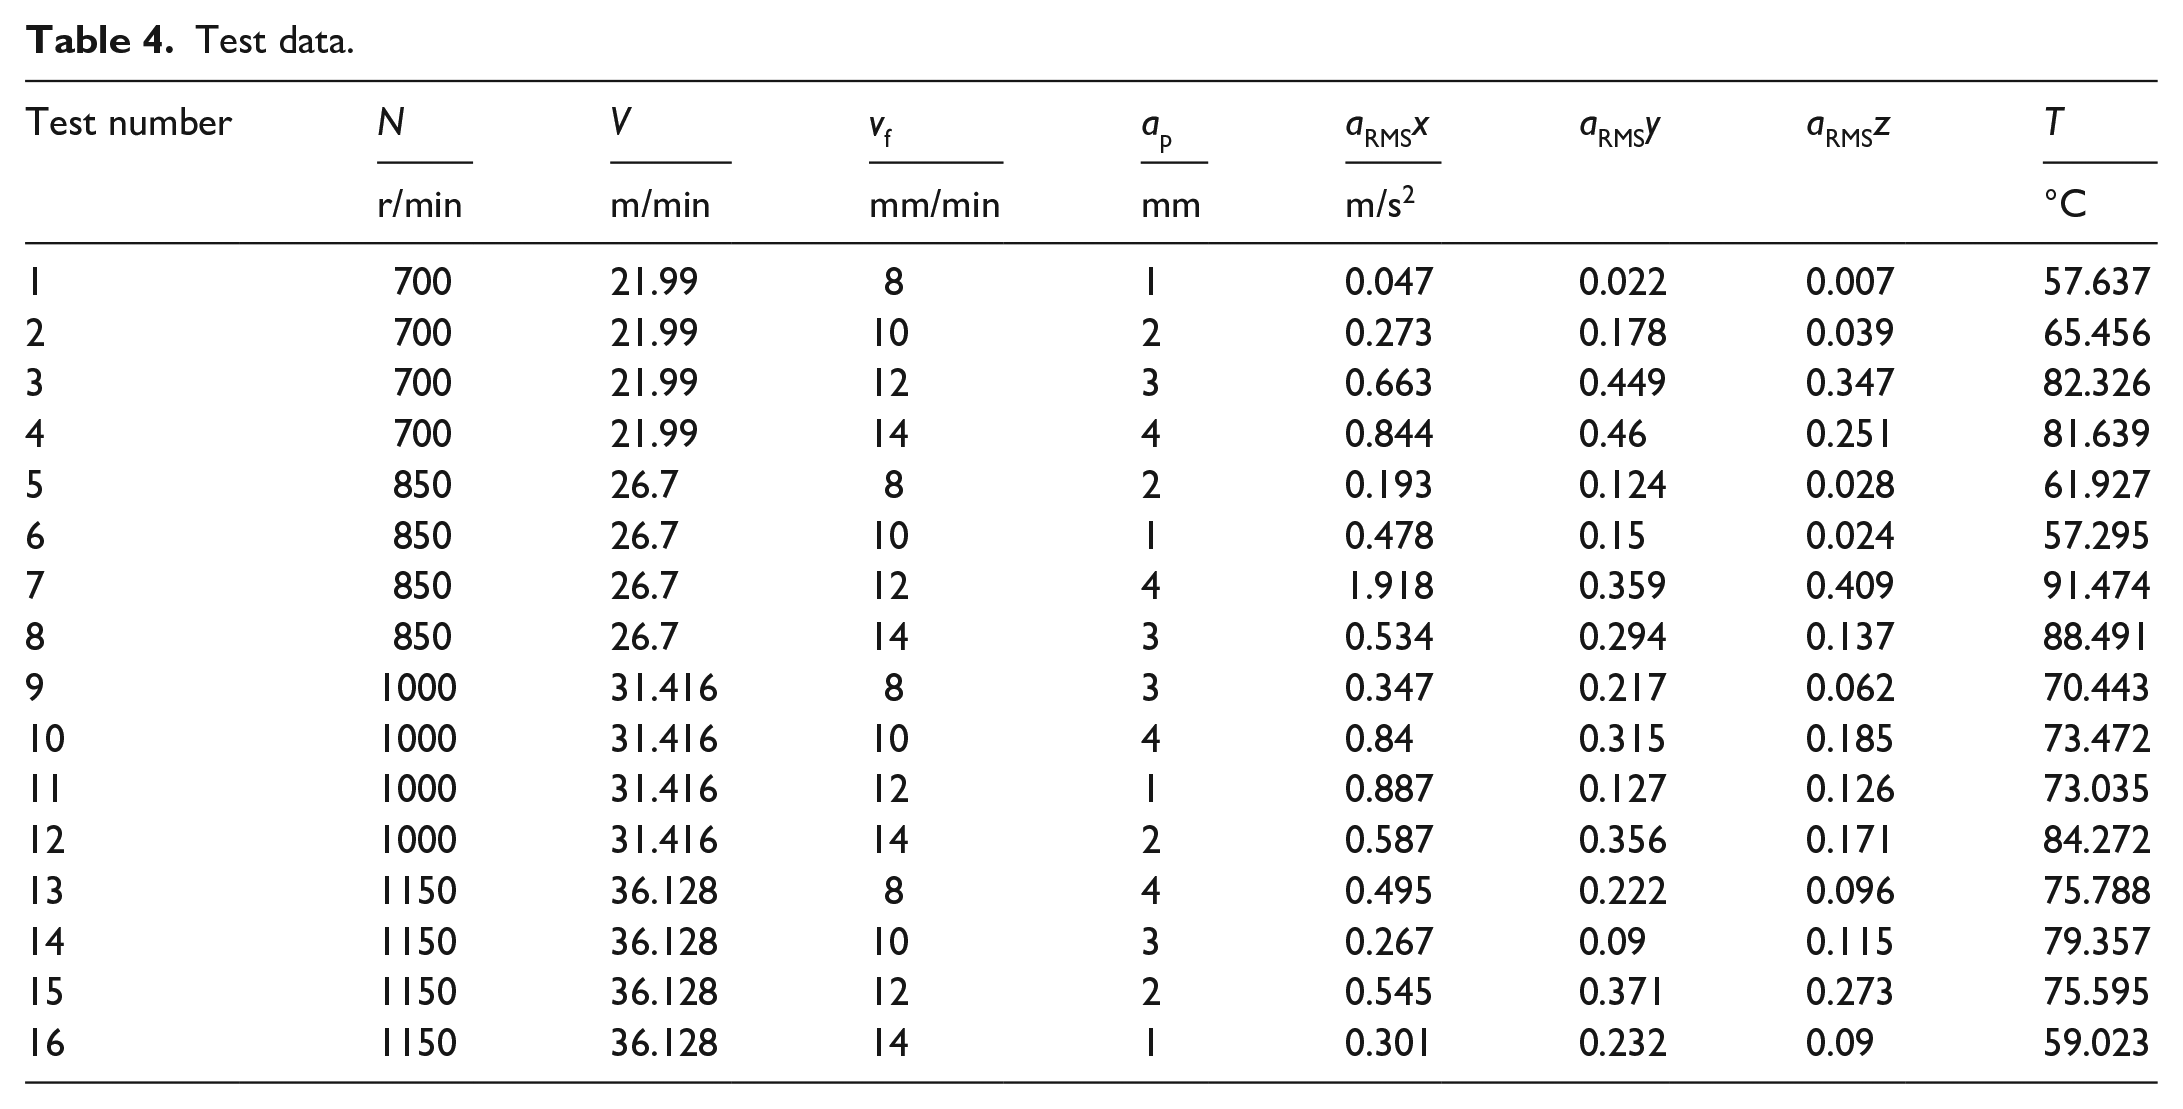
The FLIR Tools temperature signal analysis software is used to conduct time-domain analysis of the temperature signal, and the highest, lowest, and average values of the regional temperature measured by the infrared thermal imager could be obtained, as shown in Figure 5(a). Similarly, the vibration signal analysis software is used to process the vibration signal in time domain, and the three-way acceleration time-domain curves, mean value, root mean square value, etc., can be obtained, as shown in Figure 5(b)–(d). Combined with the experimental data, this paper selects average temperature T and root mean square values of three-way vibration acceleration aRMSx, aRMSy, and aRMSz as features for analysis, as shown in Table 4. Milling speed v is calculated by the formula (1)

where v is the milling speed, and its unit is m/min; n is the spindle speed, and its unit is r/min; d is the diameter of the tool, and its unit is mm.
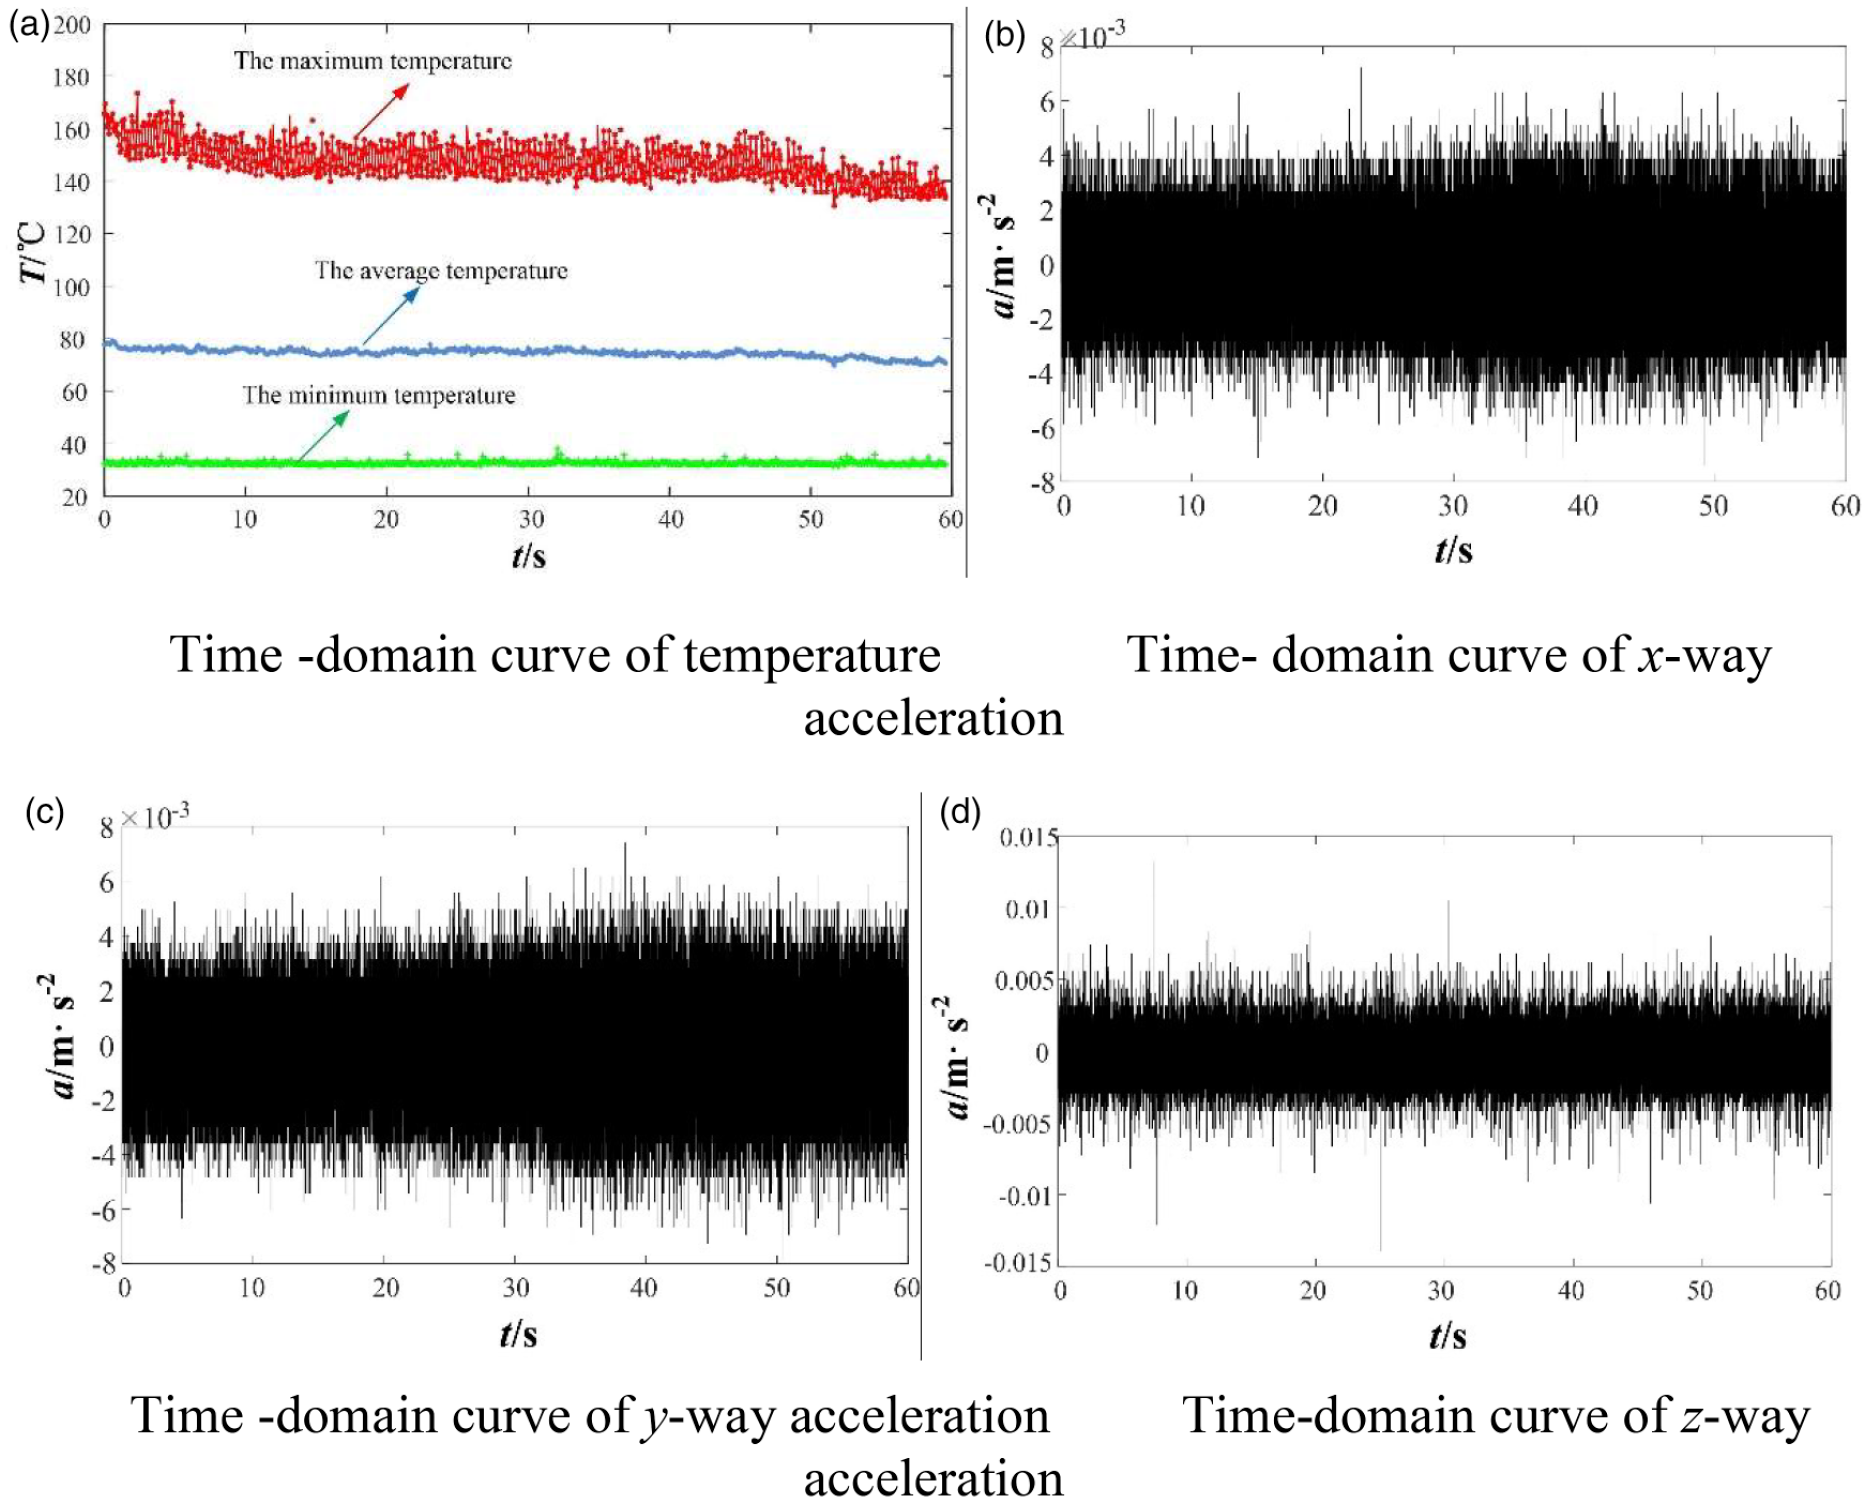
Time-domain curves of temperature and three-way vibration acceleration. (a)Time-domain curve of temperature. (b) Time-domain curve of x-way acceleration. (c)Time-domain curve of y-way acceleration. (d) Time-domain curve of z-way acceleration.
Test data.
Grey correlation analysis between milling temperature and milling parameters
Based on the experimental data in Table 4 and the grey relational theory, 23 the grey relative correlation degree between the average milling temperature and milling speed, feed speed, and milling depth is calculated, respectively. The larger the grey relative correlation degree is, the greater the influence of the parameter is. Therefore, the most significant milling parameter can be analyzed. First of all, in order to eliminate dimension, the average value of milling temperature and milling parameters is calculated first, and then the actual value measured by each test is divided by the corresponding mean value, the mean image of each test parameter can be obtained. The milling temperature mean image is denoted as X0, the milling speed mean image is denoted as X1, the feed speed mean image is denoted as X2, and the milling depth mean image is denoted as X3. In order to find out the most influential quantity, the grey correlation theory is selected for analysis, and the corresponding calculation formula of grey relative correlation degree is as follows

Among it


in the formula, the corresponding
Based on MATLAB software and programming, the values of each grey relative degree can be calculated, as shown in Table 5.
Calculation results of grey relative correlation degree
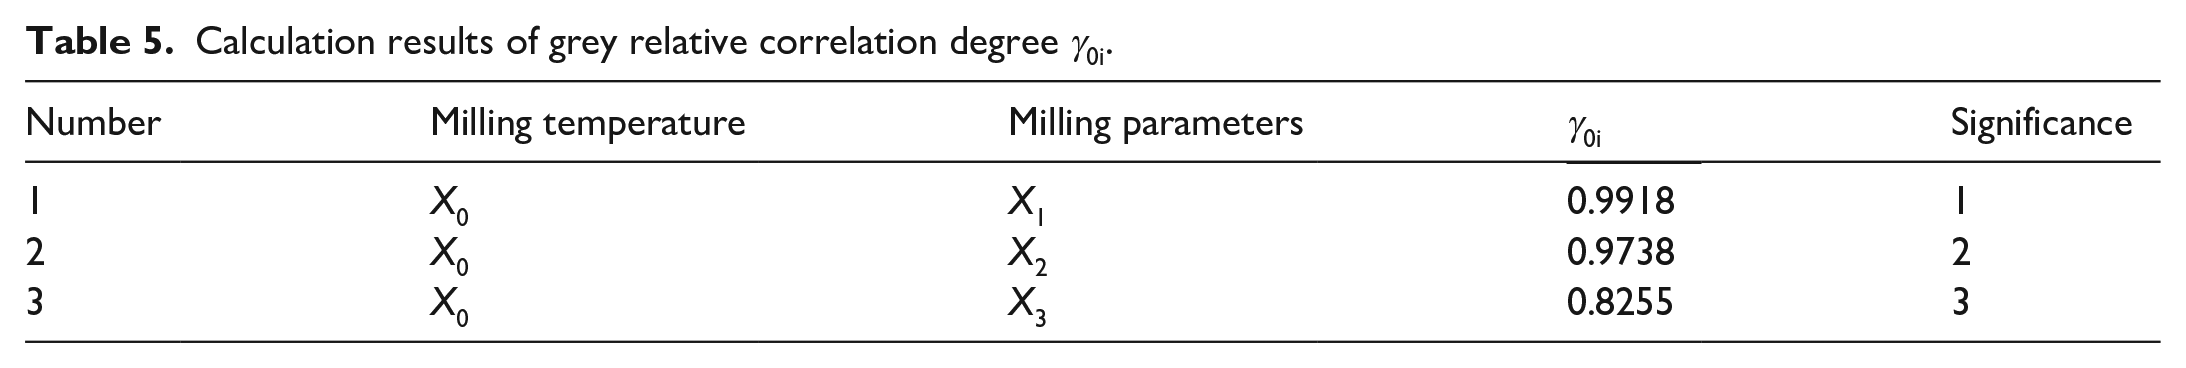
It can be seen from Table 5 that the grey relative correlation degree between milling temperature and three milling parameters is above 0.8, which indicates that milling parameters have a great influence on milling temperature. Among them, the grey relative correlation between milling temperature and milling speed is the largest, so the influence of milling speed is the largest, followed by feed speed and milling depth.
Grey correlation analysis between milling temperature and milling vibration
Based on the grey relational theory, 24 the grey relative correlation degree between milling temperature and three-way vibration acceleration is calculated, respectively. If the value of grey relative correlation degree is larger, it shows that there is a greater correlation between milling temperature and three-way vibration acceleration. First of all, in order to eliminate dimension, the average value of milling temperature and three-way vibration acceleration is calculated first, and then the actual value measured by each test is divided by the corresponding mean value, the mean image of each test parameter can be obtained. The milling temperature mean image is denoted as X0, the aRMSx mean image is denoted as X4, the aRMSy mean image is denoted as X5, and the aRMSz mean image is denoted as X6. In order to find out the most influential quantity, grey correlation theory is adopted for analysis, and the grey relative correlation degree between milling temperature and three-way vibration can be obtained, as shown in Table 6.
Calculation results of grey relative correlation degree
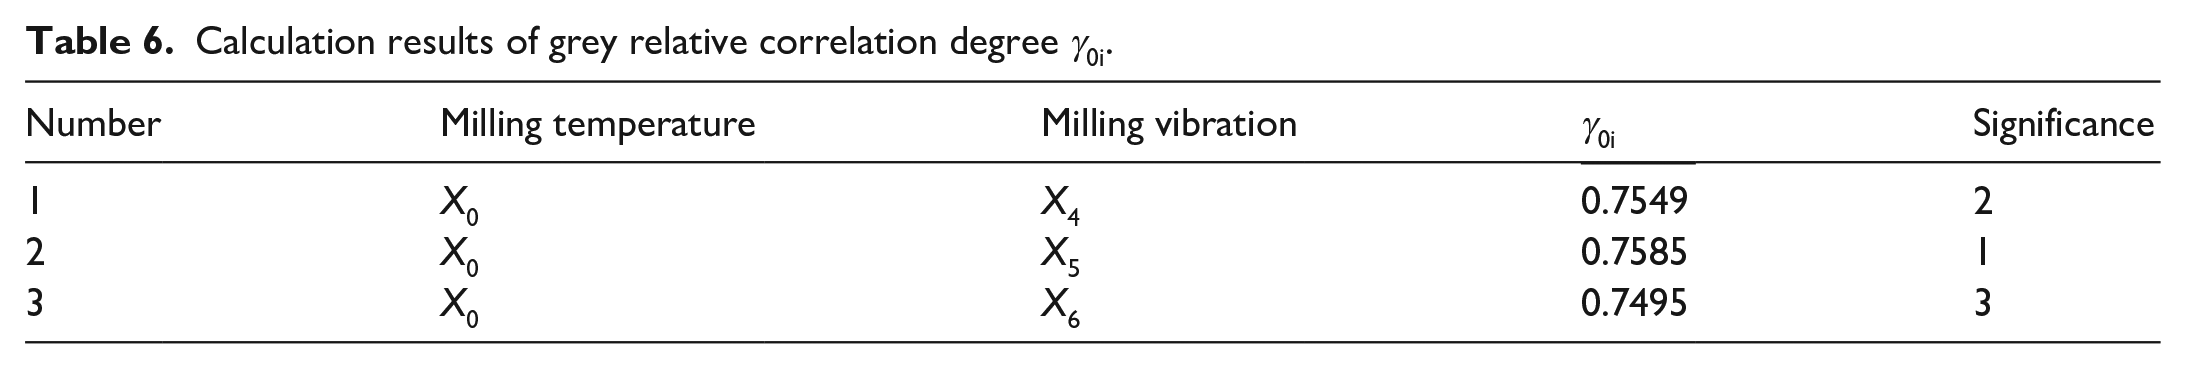
It can be seen from Table 6 that the grey relative correlation degree between milling temperature and milling three-way vibration is more than 0.7, which indicates that there is a certain correlation between milling temperature, and milling vibration, and the difference of grey relative correlation degree between milling temperature and milling vibration is small.
Establish the grey prediction model between milling temperature and milling parameters and milling vibration
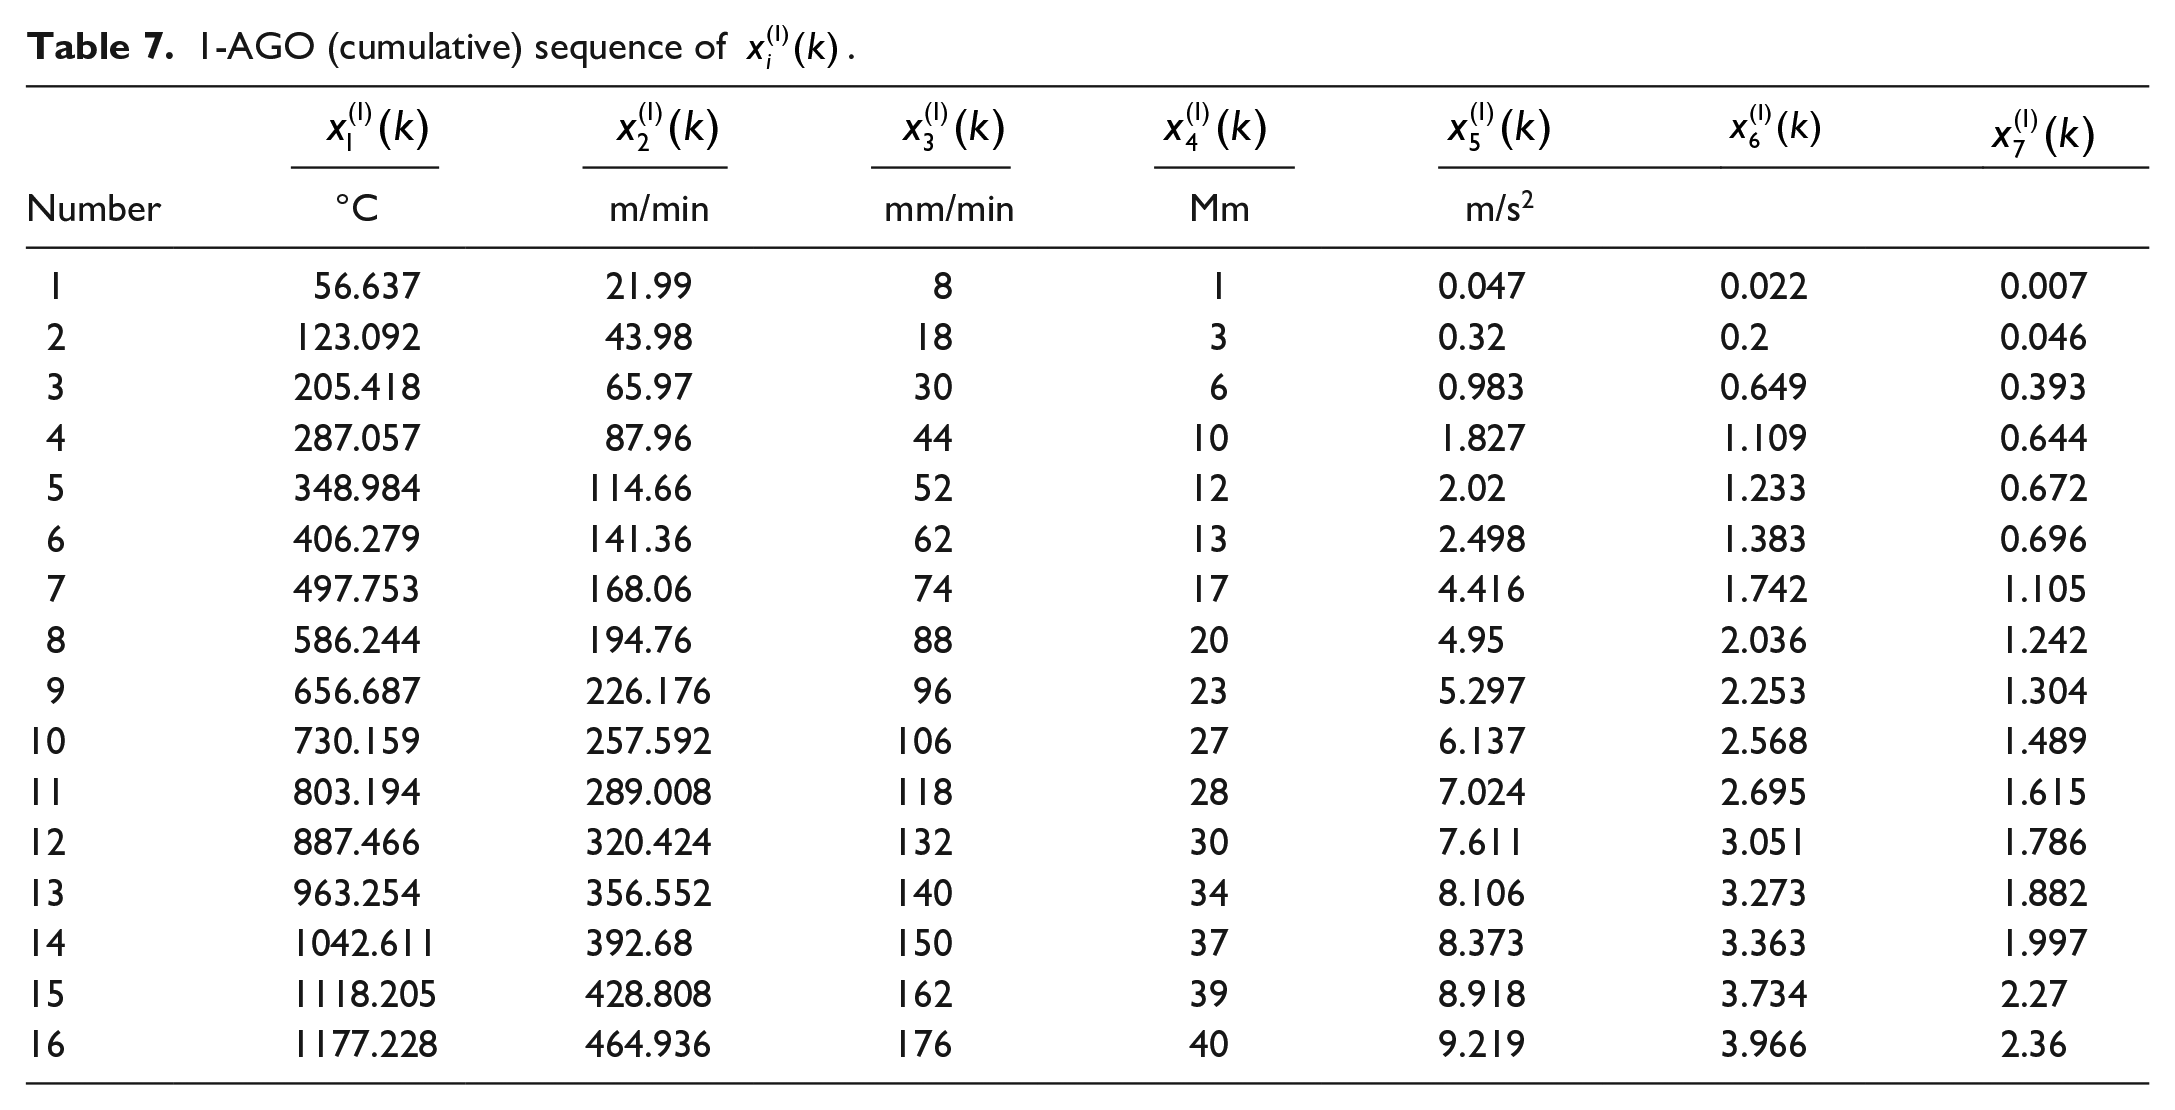
Based on the milling test data and GM(0, N) grey model theory, 24 the grey prediction model between milling temperature, milling parameters, and three-way vibration acceleration can be established

where k is the k-th test, k = 1, 2, 3, . . ., 16;
1-AGO (cumulative) sequence of
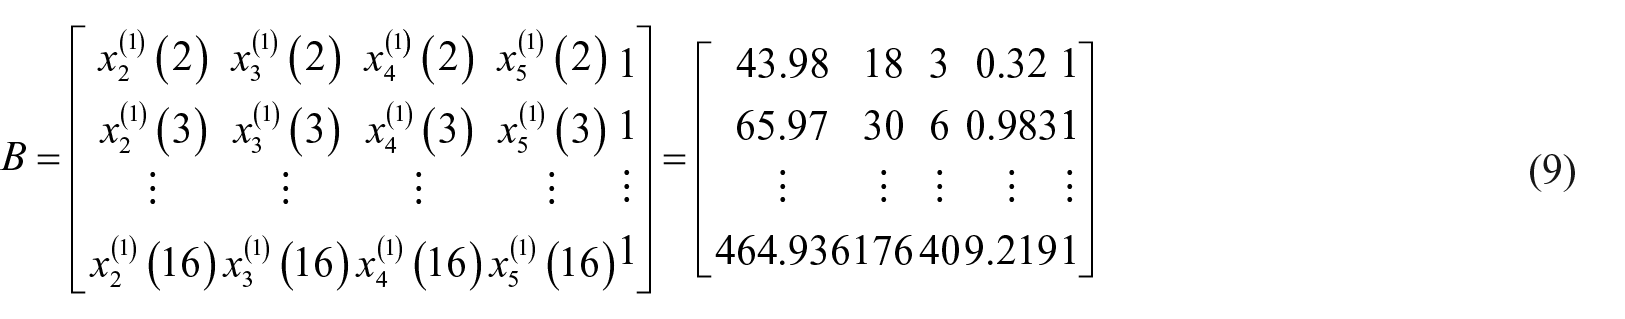
Taking grey prediction model Formula 6–1 as an example, the parameters to be solved b2,b3, b4, b5, a

where Y and B are, respectively

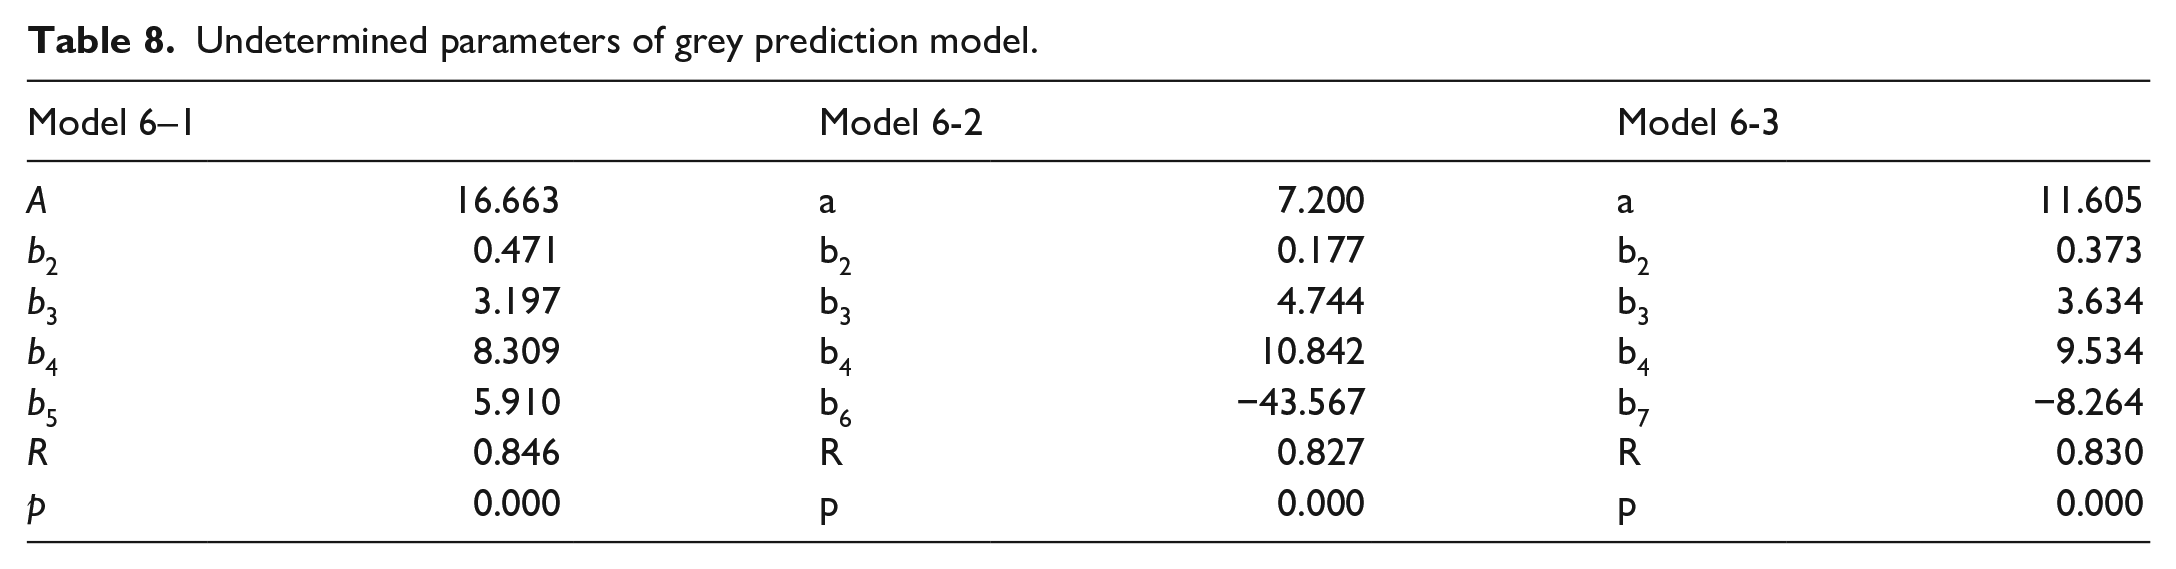
Therefore, the value of the coefficient to be calculated and the correlation coefficient R can be obtained by MATLAB solution, as shown in Table 8. Meanwhile, the comparison graph of the actual measured value and the predicted value of the milling temperature can be drawn, as shown in Figure 6.
Undetermined parameters of grey prediction model.
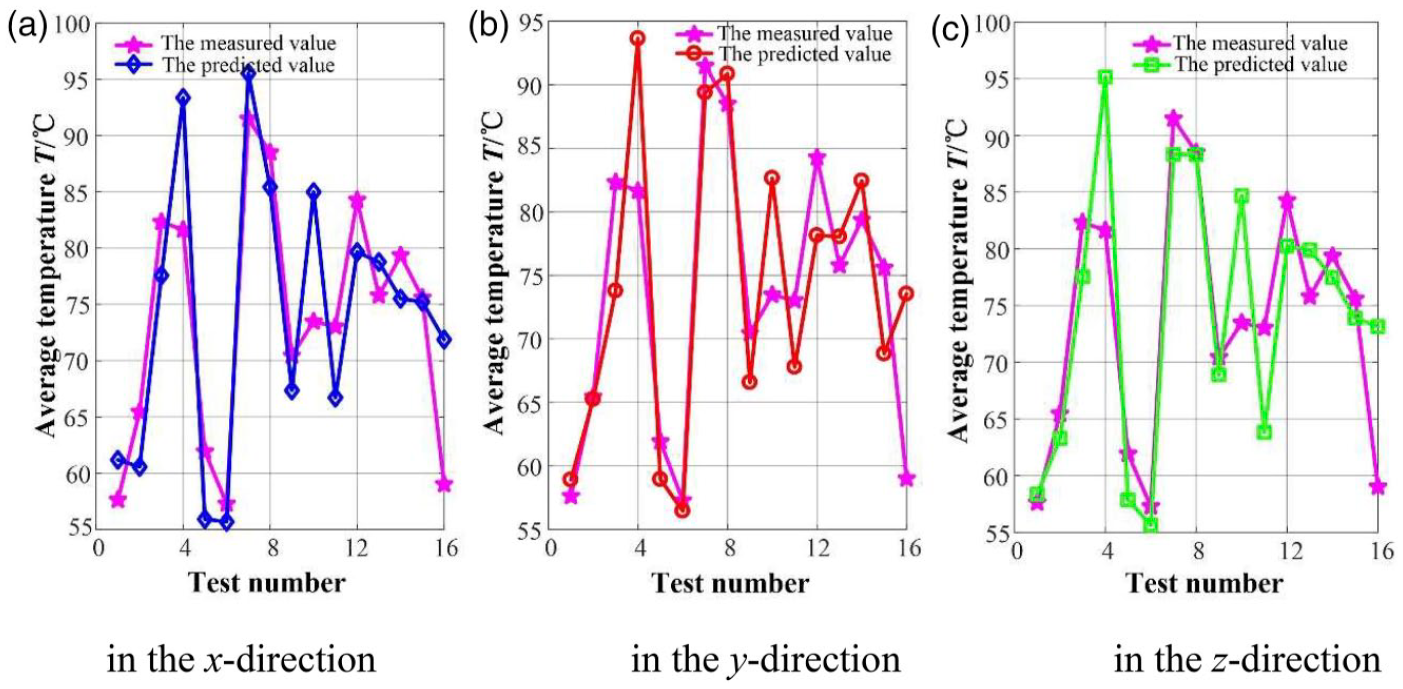
Comparison graph of the actual measured and predicted milling temperature. (a)In the x-direction, (b) in the y-direction, and (c) in the z-direction.
The GM(0, N) grey prediction model of milling temperature can be obtained as follows
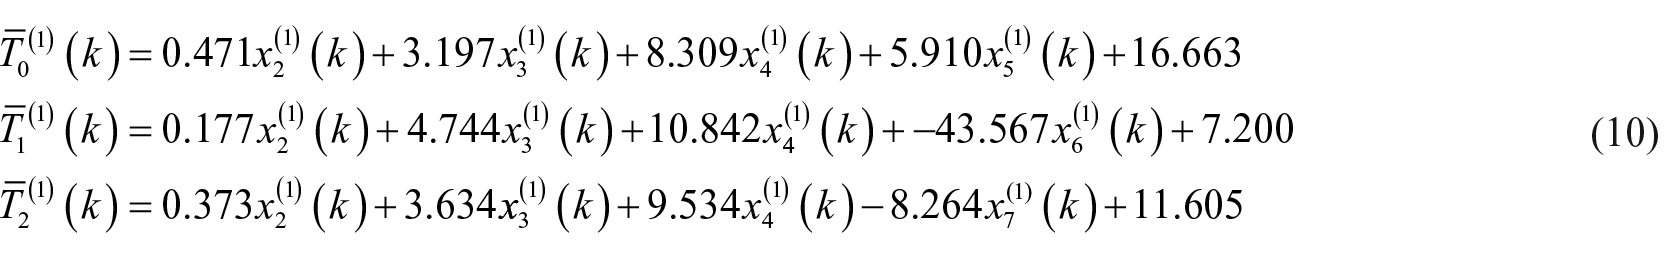
It can be seen from Table 8 and Figure 6 that the value of correlation coefficient R is greater than 0.8, and the actual measured value and the predicted value of milling temperature have high consistency, indicating that the GM(0, N) grey prediction model of milling temperature about milling parameters and milling vibration is reliable. With given milling parameters and milling vibration, the value of milling temperature can be predicted well by GM(0, N) grey prediction model.
Concluding remarks
In order to comprehensively consider the impact of milling parameters and milling vibration on milling temperature, this paper took TC4 titanium alloy as the test object, and used infrared thermography, a three-way acceleration sensor, and supporting software to collect temperature and vibration signals of titanium alloy in milling processing state with different milling parameters. Based on experimental data and grey relational theory, the correlation between milling temperature and milling parameters and milling vibration was analyzed, and GM(0, N) grey prediction model of milling temperature on milling parameters and milling vibration was established. The results show that: (1) The influence of milling speed on milling temperature is the greatest, followed by feed speed and milling depth. (2) The grey relative correlation degree between milling temperature and milling vibration is more than 0.7, which indicates that there is a certain correlation between milling temperature and milling vibration, and the difference of grey relative correlation between milling temperature and milling vibration is small. (3) The correlation coefficient R of the grey prediction model of milling temperature fused with multiple influencing factors is greater than 0.80, and the prediction effect is good. Under given conditions, the value of milling temperature can be predicted. The prediction model can provide theoretical guidance for monitoring the state of the milling system and provide a necessary state equation for numerical simulation of heat-vibration coupling of milling.
Supplemental Material
sj-docx-1-nvw-10.1177_09574565221093251 – Supplemental material for Grey correlation analysis of milling temperature and milling vibration of TC4 titanium alloy
Supplemental material, sj-docx-1-nvw-10.1177_09574565221093251 for Grey correlation analysis of milling temperature and milling vibration of TC4 titanium alloy by Shuncai Li, Yuting Hu and Eugene Popov in Noise & Vibration Worldwide
Footnotes
Declaration of conflicting interests
The author(s) declared no potential conflicts of interest with respect to the research, authorship, and/or publication of this article.
Funding
The author(s) disclosed receipt of the following financial support for the research, authorship, and/or publication of this article: This work was supported by the Postgraduate Research & Practice Innovation Program of Jiangsu Province (KYCX20_2331), Joint scientific research project of Sino foreign cooperative education platform in Jiangsu Province, the Science and Technology Plan Project of Xuzhou City (KC20188), Undergraduate Innovation Training Program (201910320117Y), and the Xuzhou Science and Technology Project (KC18118).
Supplemental material
Supplemental material for this article is available online.
References
Supplementary Material
Please find the following supplemental material available below.
For Open Access articles published under a Creative Commons License, all supplemental material carries the same license as the article it is associated with.
For non-Open Access articles published, all supplemental material carries a non-exclusive license, and permission requests for re-use of supplemental material or any part of supplemental material shall be sent directly to the copyright owner as specified in the copyright notice associated with the article.