



Abstract
Over recent decades, ambiguous ground vibration induced by blasting operation can cause extensive damage to structures, lives and fields in and around mine premises. As a consequence, it is indispensable to measure the ambiguous ground vibration intensity levels for assessing and reduce their perilous impact. In this investigation, estimation and evaluation of blast-induced ground vibration in terms of peak particle velocity (PPV) through the ensemble machine learning intelligent algorithms were carried out. One hundred and 21 experimental and blasting events were monitored to collect the real-time field data in Mine-A, India. The collected data was randomly split into training and testing to generate models. Eight input parameters include number of holes, burden, spacing, hole diameter, hole depth, top stemming, maximum explosive charge per delay and the distance were selected for development of ensemble machine learning algorithms. An eXtreme gradient boosting (XGBoost) and random forest (RF) ensemble model, Decision Tree were developed to assess the PPV levels. In addition to that, four empirical predictor models proposed by the US Bureau of Mines, Langefors–Kihlstrom, Central Mining Research Institute, and Bureau of Indian Standards were applied to derive a relation between PPV and its influencing parameters. The accuracy and efficiency of developed models can be determined by performance evaluation metrics chosen as the coefficient of determination (R2), and root mean square error (RMSE). Among all models, yielded results evidence that the Decision Tree ensemble model with the R2 of 0.9549, and RMSE of 0.0444 was more precise optimum model to assess the PPV. Besides, a sensitivity analysis method was applied in this current study to know the role of the input parameters in estimating PPV. The determined results inferred that burden, number of holes and top stemming are more influenced parameters on the intensity of PPV levels.
Introduction
Vibration is a form of energy propagation which collapses the equilibrium state of medium. A general form of vibration wave may be characterized as sinusoidal oscillating motion of the soil particle, however in most of the instances the nature of vibration is more tangled and may be discovered as periodic, transient or random oscillation. These kind of vibration motions can be directly controlled at the origin of source which produces them. The origin of vibration source may be natural phenomena or artificial. Natural phenomena such as earthquake, ocean waves, landslide and wind energy which generates high level of energy over a period of time of several seconds. On the contrary, the artificial sources (well known as man-made sources) such as quarry blasting in mines, pile driving, traffic (road and rail) and civil construction activities (soil compaction) induce low intensity energy level, and are often of short period of time. 1
Ground vibration can travel outwards from the blast source and slowly decreases in magnitude like induced ripples nature while a stone is thrown into a pool of water. The motion of ground vibration wave induced by blasting having various kinds of waves such as Compression (or P), Shear (or S or secondary), Rayleigh (or R) waves. The P wave is a fastest wave and moves radially from blast source (blast hole) through the ground. The S wave motion is transverse or shear which means wave motion is perpendicular to the direction wave propagation. The R-wave spreads more slowly over P and S wave motions. Induced particles travel elliptically in the vertical plane and in the similar direction as the wave propagation
Mineral resources are the backbone of any industrial nation and industry needs metal and non-metals as raw material. These are extracted by both underground and open cast mining methods. In both scenarios, Blasting and Drilling (B&D) combination is a viable and economical method for rock excavation in mining and civil construction. High explosives are used to move and fracture the rock material in the blasting process, due to explosive force, a large quantity of energy is released. Previous reports reveal that about only 20% of the explosive energy is used to break the rock mass and the rest is dissipated in the form of ground vibration, fly rocks, back breaks, and air overpressure. 2 Over the past few decades, inducing of ground vibrations from blasting operations have become the subject of concern. The influence of ambiguous ground vibrations, above the excessive level, may grievous damage to nearby inhabitants, close vicinity structures, human comfort and other sensitive sites. High intensity ambiguous vibration levels also inevitable and chock the current used ground water conduits and damage the surrounding area ecology. Sometimes, it might be accountable for water logging and up-rooting of the plants/trees around the mine premises. Induced ground vibration by blasting operation may destroy the free face and produce several back breaks. These elicited back breaks may cause the severe problems when drilling the next round of blast event and creates over-size boulders. This kind of detrimental effects the economics of mine, hamper production and endanger the socio-economic development of the nearby areas. 3 Thus, it is essential prerequisite to monitor and predict the blast-induced ground vibration (BIGV) in open cast mines.
Damaging pinpoint levels of ground vibrations are normally expressed in terms of peak particle acceleration, displacement, or velocity along with its frequency characteristics. Most of the times, peak particle velocity (PPV) is an acceptable potentially damaging measurement to quantify the vibration damaging threshold level. It is defined as the maximum speed at which each particle passes or moves in the ground to its inactive state and expressed in millimeter per second (mm/sec). According to Directorate General of Mine Safety (DGMS) standard in India, the PPV is 5 and 10 mm/sec within the dominant excitation frequency range of 8–25 Hz and more than 25 Hz respectively for sensitive structure. 4 Similarly, United States of Bureau of Mines (USBM) reported from case history that a PPV limit of 12 mm/s will provide protection from blast collapses in more than 95% cases. 5
The PPV is defined as maximum velocity of particle over the complete recorded time in a medium. The unit of PPV is the millimeter per second (mm/s). Peak vector sum (PVS) is the resultant particle component which means square root of addition of particle velocity of individual component. Generally, PPV’s data are measured at various strategic locations. The collected data has fitted to model using empirical constants. There are number propagation equations presented and commonly adopted equation is

The parameter V can be related to either particle acceleration, particle displacement or particle velocity. However, PPV is commonly adopted parameter and it is closer to damage.
6
On the other hand, the most reliable equation is based on scaled distance. It is a concept that uses the amount of explosive creating energy in air shock and seismic waves, and the effect of distance. The equation has been used for the measurement of PPV using scaled distance is
7

Different empirical predictor equations. 8
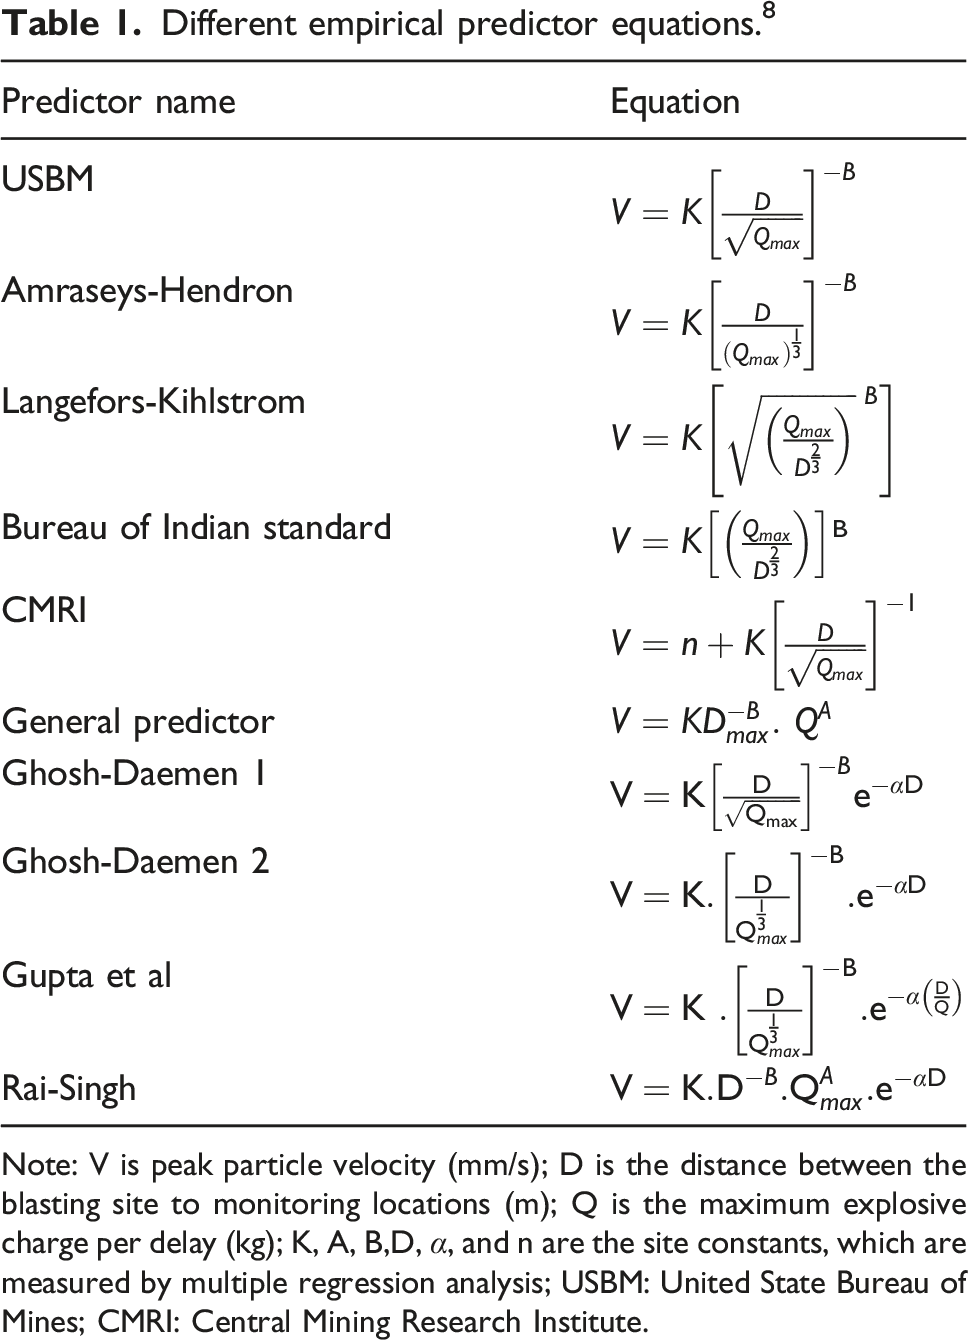
Note: V is peak particle velocity (mm/s); D is the distance between the blasting site to monitoring locations (m); Q is the maximum explosive charge per delay (kg); K, A, B,D,
As stated earlier, the predictor equations are assimilating with two parameters including maximum charge per delay and distance from the blast face on PPV. However, it was influenced by additional controllable or non-controllable parameters such as a number of holes, burden, hole depth, spacing, hole diameter, stemming, and powder factor. In the mentioned techniques, additional input parameters belong to blasting pattern design, properties of the rock mass, and type of explosive material has been utilized for BIGV estimation. In the recent times, novel soft-computing technique approaches are adopted, developed and applied by various researchers and scientists widely to estimate the BIGV based PPV values. In this current research, application of an XGBoost-RF and decision tree ensemble models are adopted to predict blast-induced ground vibrations at Mine-A, India.
Previous work(s)
Summary of previous investigations in the field of PPV prediction. 15
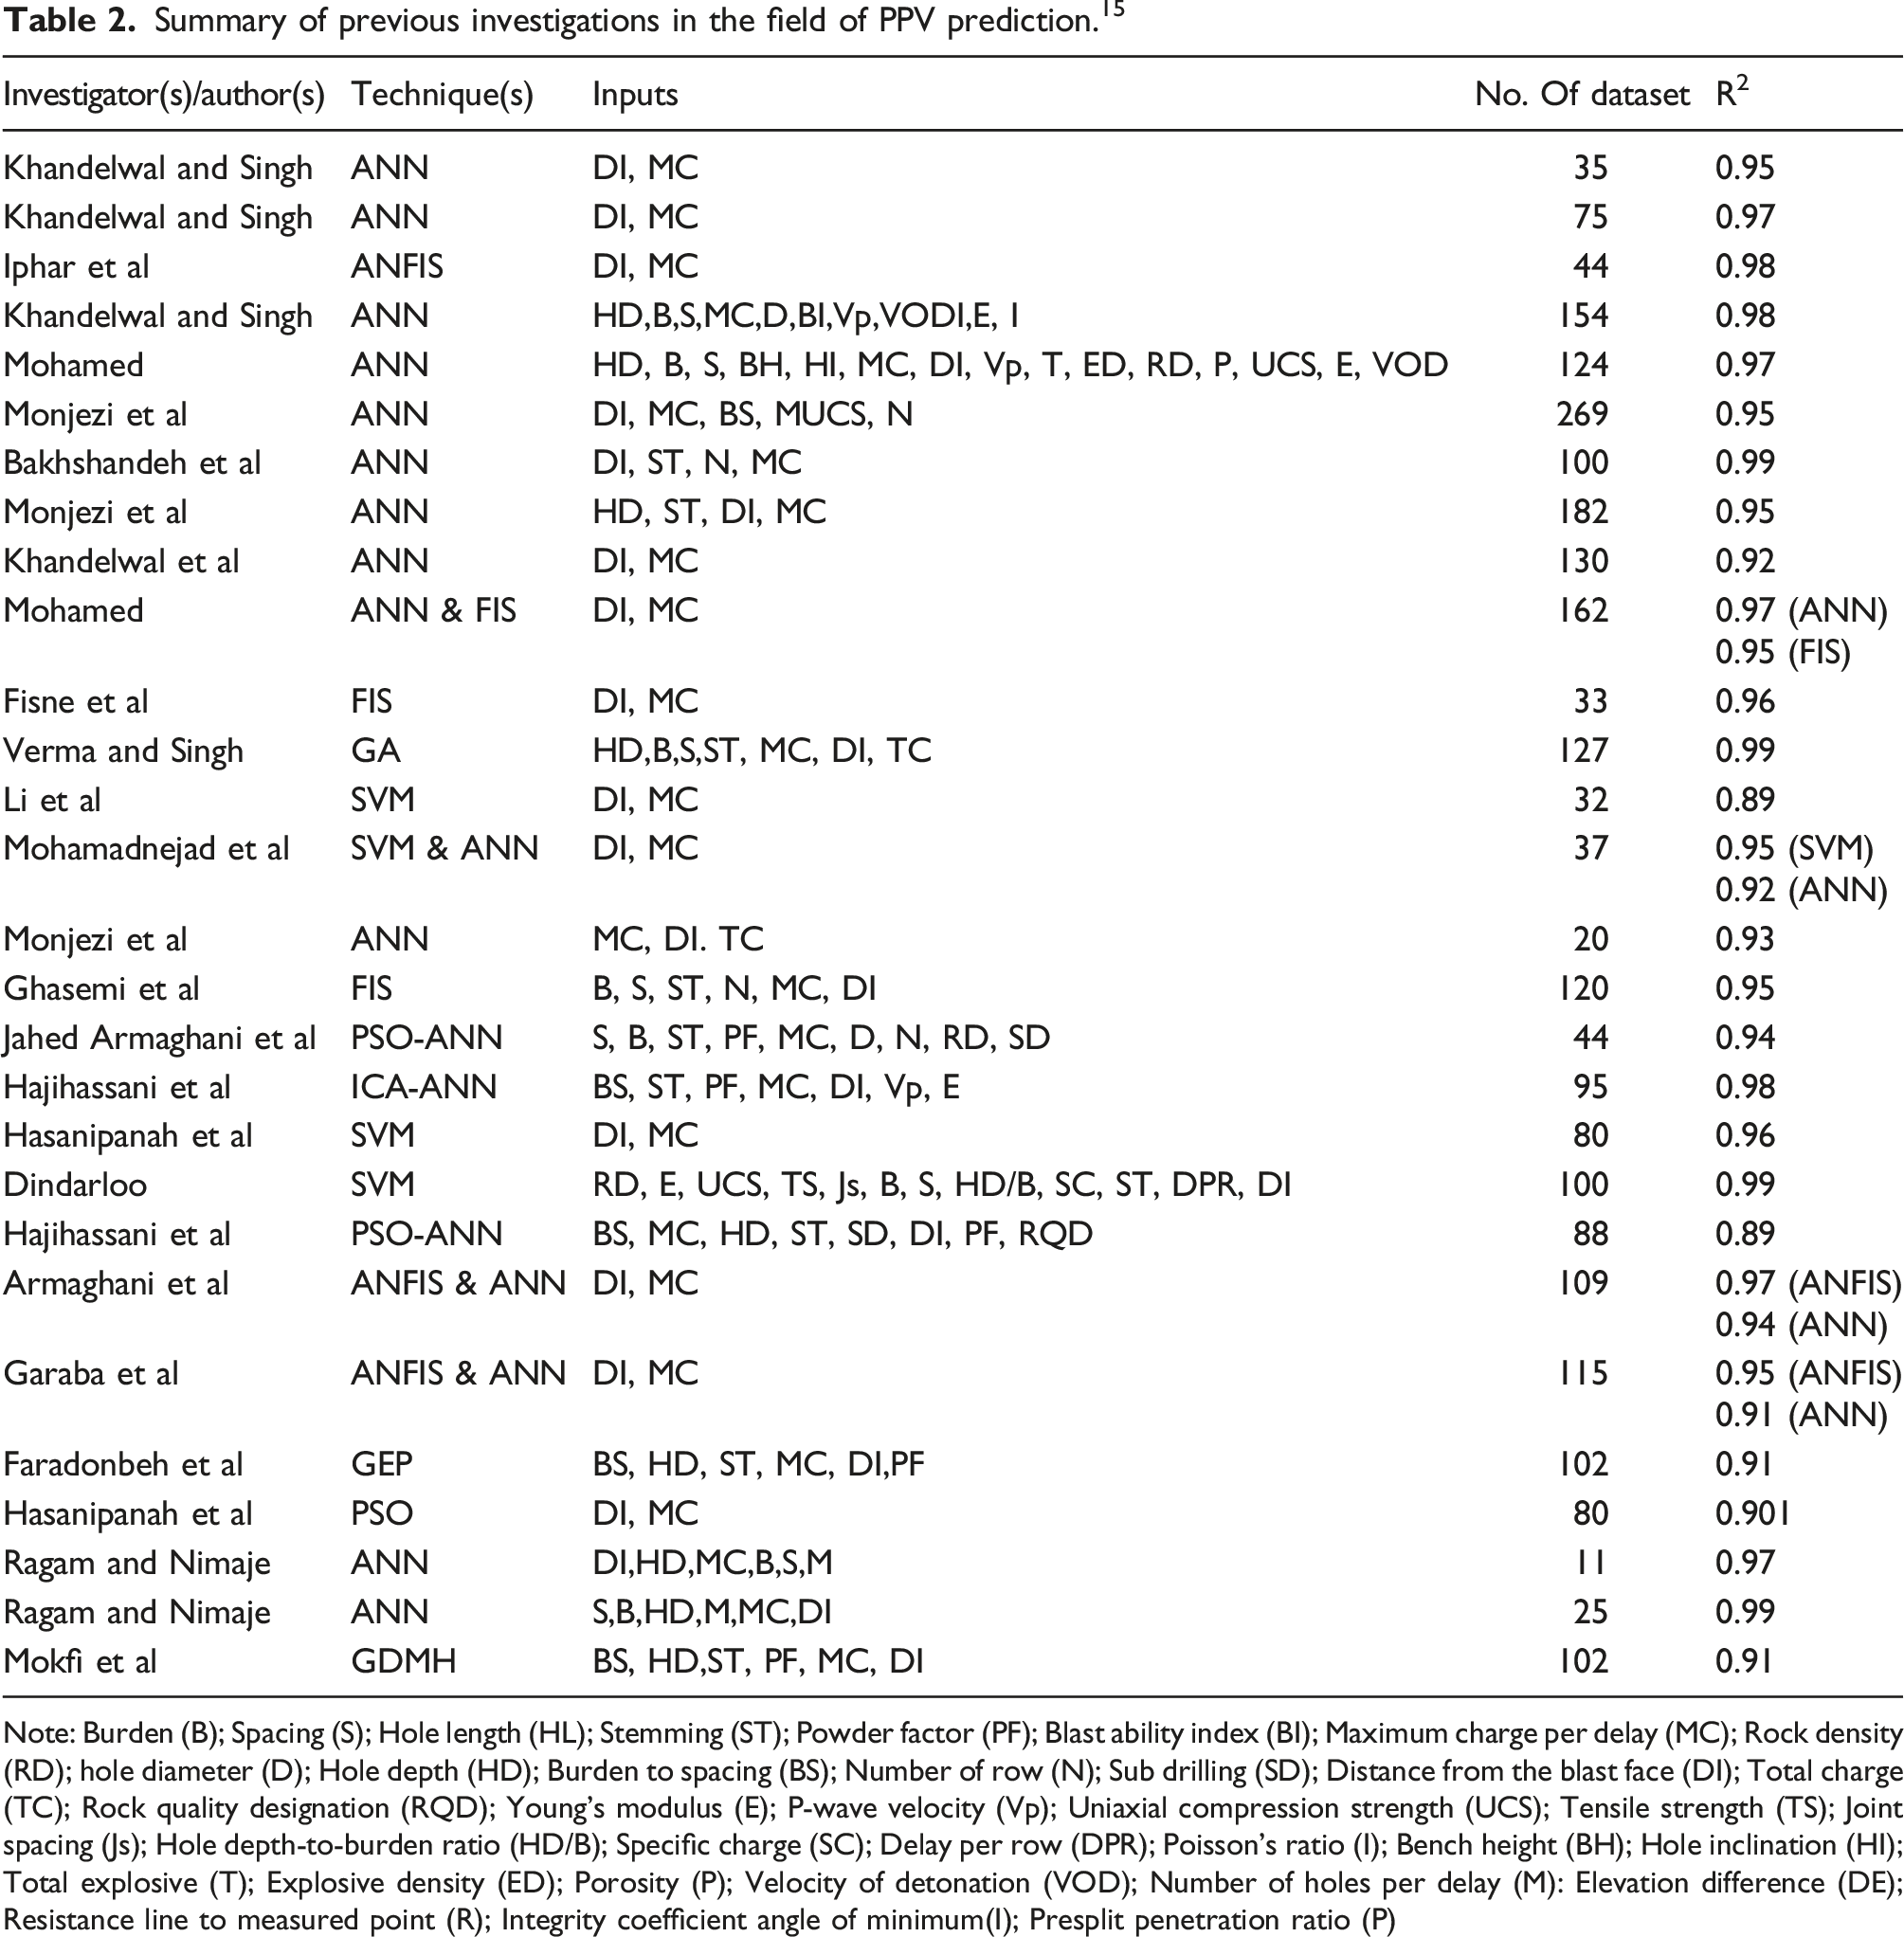
Note: Burden (B); Spacing (S); Hole length (HL); Stemming (ST); Powder factor (PF); Blast ability index (BI); Maximum charge per delay (MC); Rock density (RD); hole diameter (D); Hole depth (HD); Burden to spacing (BS); Number of row (N); Sub drilling (SD); Distance from the blast face (DI); Total charge (TC); Rock quality designation (RQD); Young’s modulus (E); P-wave velocity (Vp); Uniaxial compression strength (UCS); Tensile strength (TS); Joint spacing (Js); Hole depth-to-burden ratio (HD/B); Specific charge (SC); Delay per row (DPR); Poisson’s ratio (I); Bench height (BH); Hole inclination (HI); Total explosive (T); Explosive density (ED); Porosity (P); Velocity of detonation (VOD); Number of holes per delay (M): Elevation difference (DE); Resistance line to measured point (R); Integrity coefficient angle of minimum(I); Presplit penetration ratio (P)
Description of experimental study area and data collected
To prove the concept, the ground vibration experimental case study was carried out in Mine-A opencast mine. The area of Mine-A lies geographically in the Singrauli Coalfield which lies between latitudes 23° 47′ 00″ N and 24° 12′ 00″ North and Longitudes 81° 40′ 00″ and 82° 52′ 00″ East and is mainly located in India. The coalfield has been dived into tow parts kachni river viz. the major western and southern part comprising the Mine-A main sub-basin and north-eastern part the Mine-A sub-basin covers an area of 312 sq. km and contains thick coal seams namely; Turra, Purewa and Jhingurdah making it the highest potential area of the coal field and it presents the entire coal production of singrauli coal fields. For data collection, a Minimate plus instrument was used to record the PPV (in mm/s) at different locations from the blast point. The location map of Mine-A is depitcted in Figure 1. Mine-A map.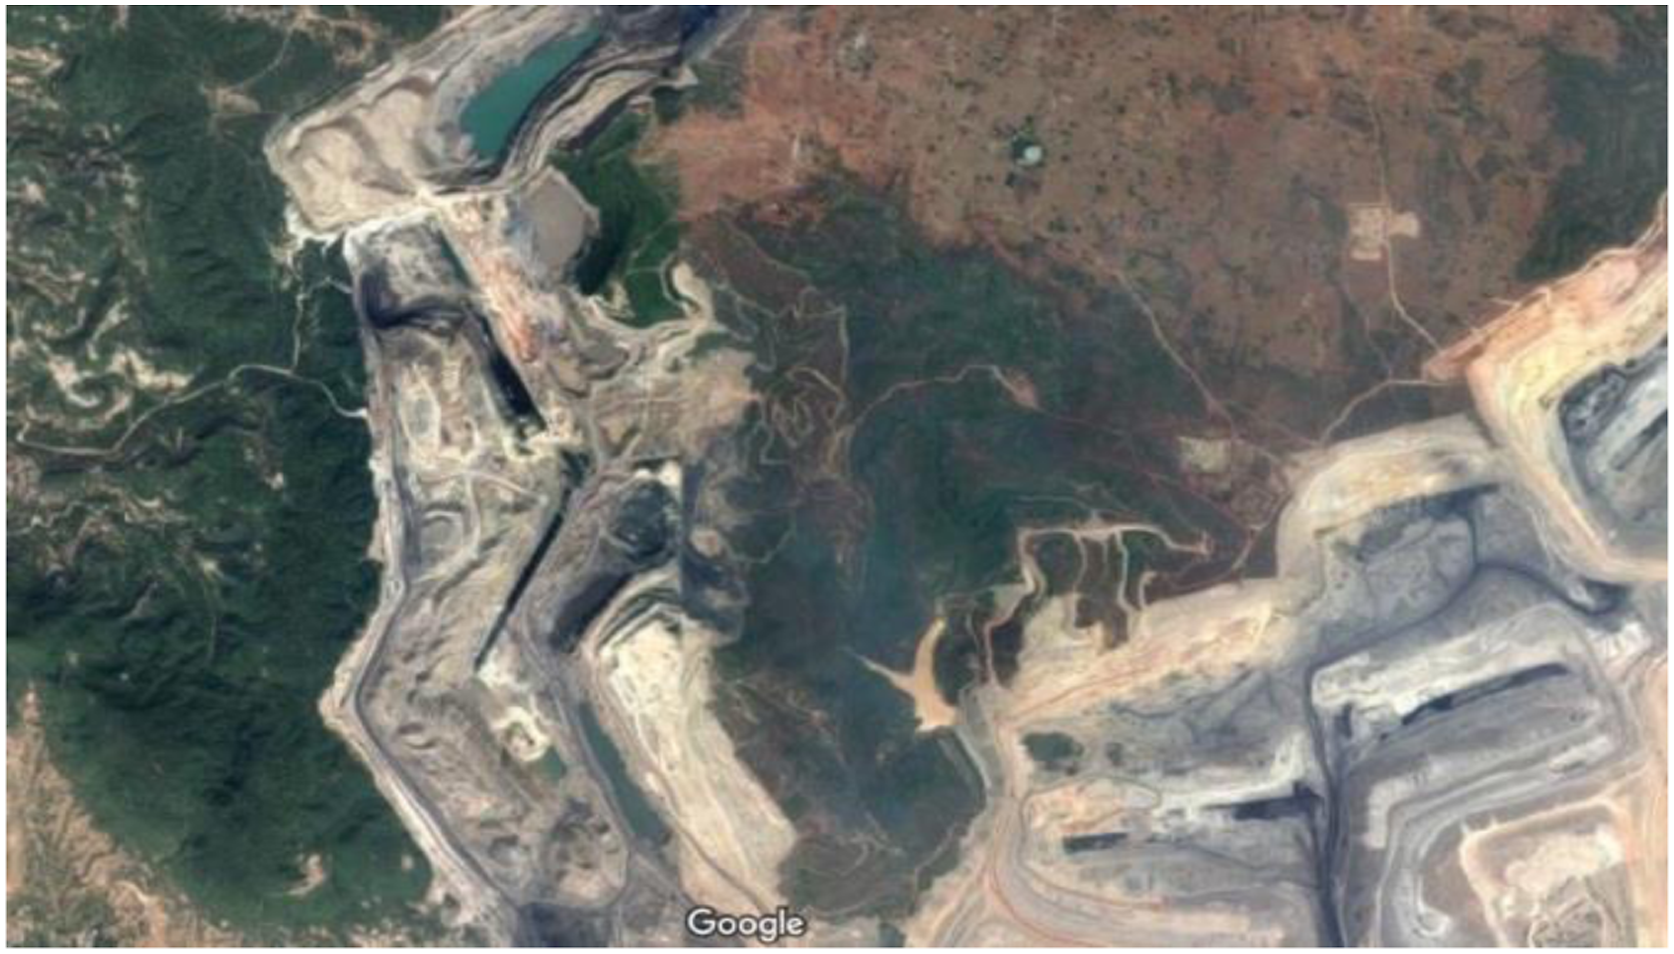
Summary of collected datasets.

Empirical vibration predictor models
Numerous academic professionals, eminent scientists, research investigators and mine field engineers proposed and adopted conventional vibration predictor equations
8
are illustrated in Table 1. Among them, one of adoptable predictor is United States Bureau of Mines (USBM) and established equation to determine the PPV as follows
16


The general equation of straight line is
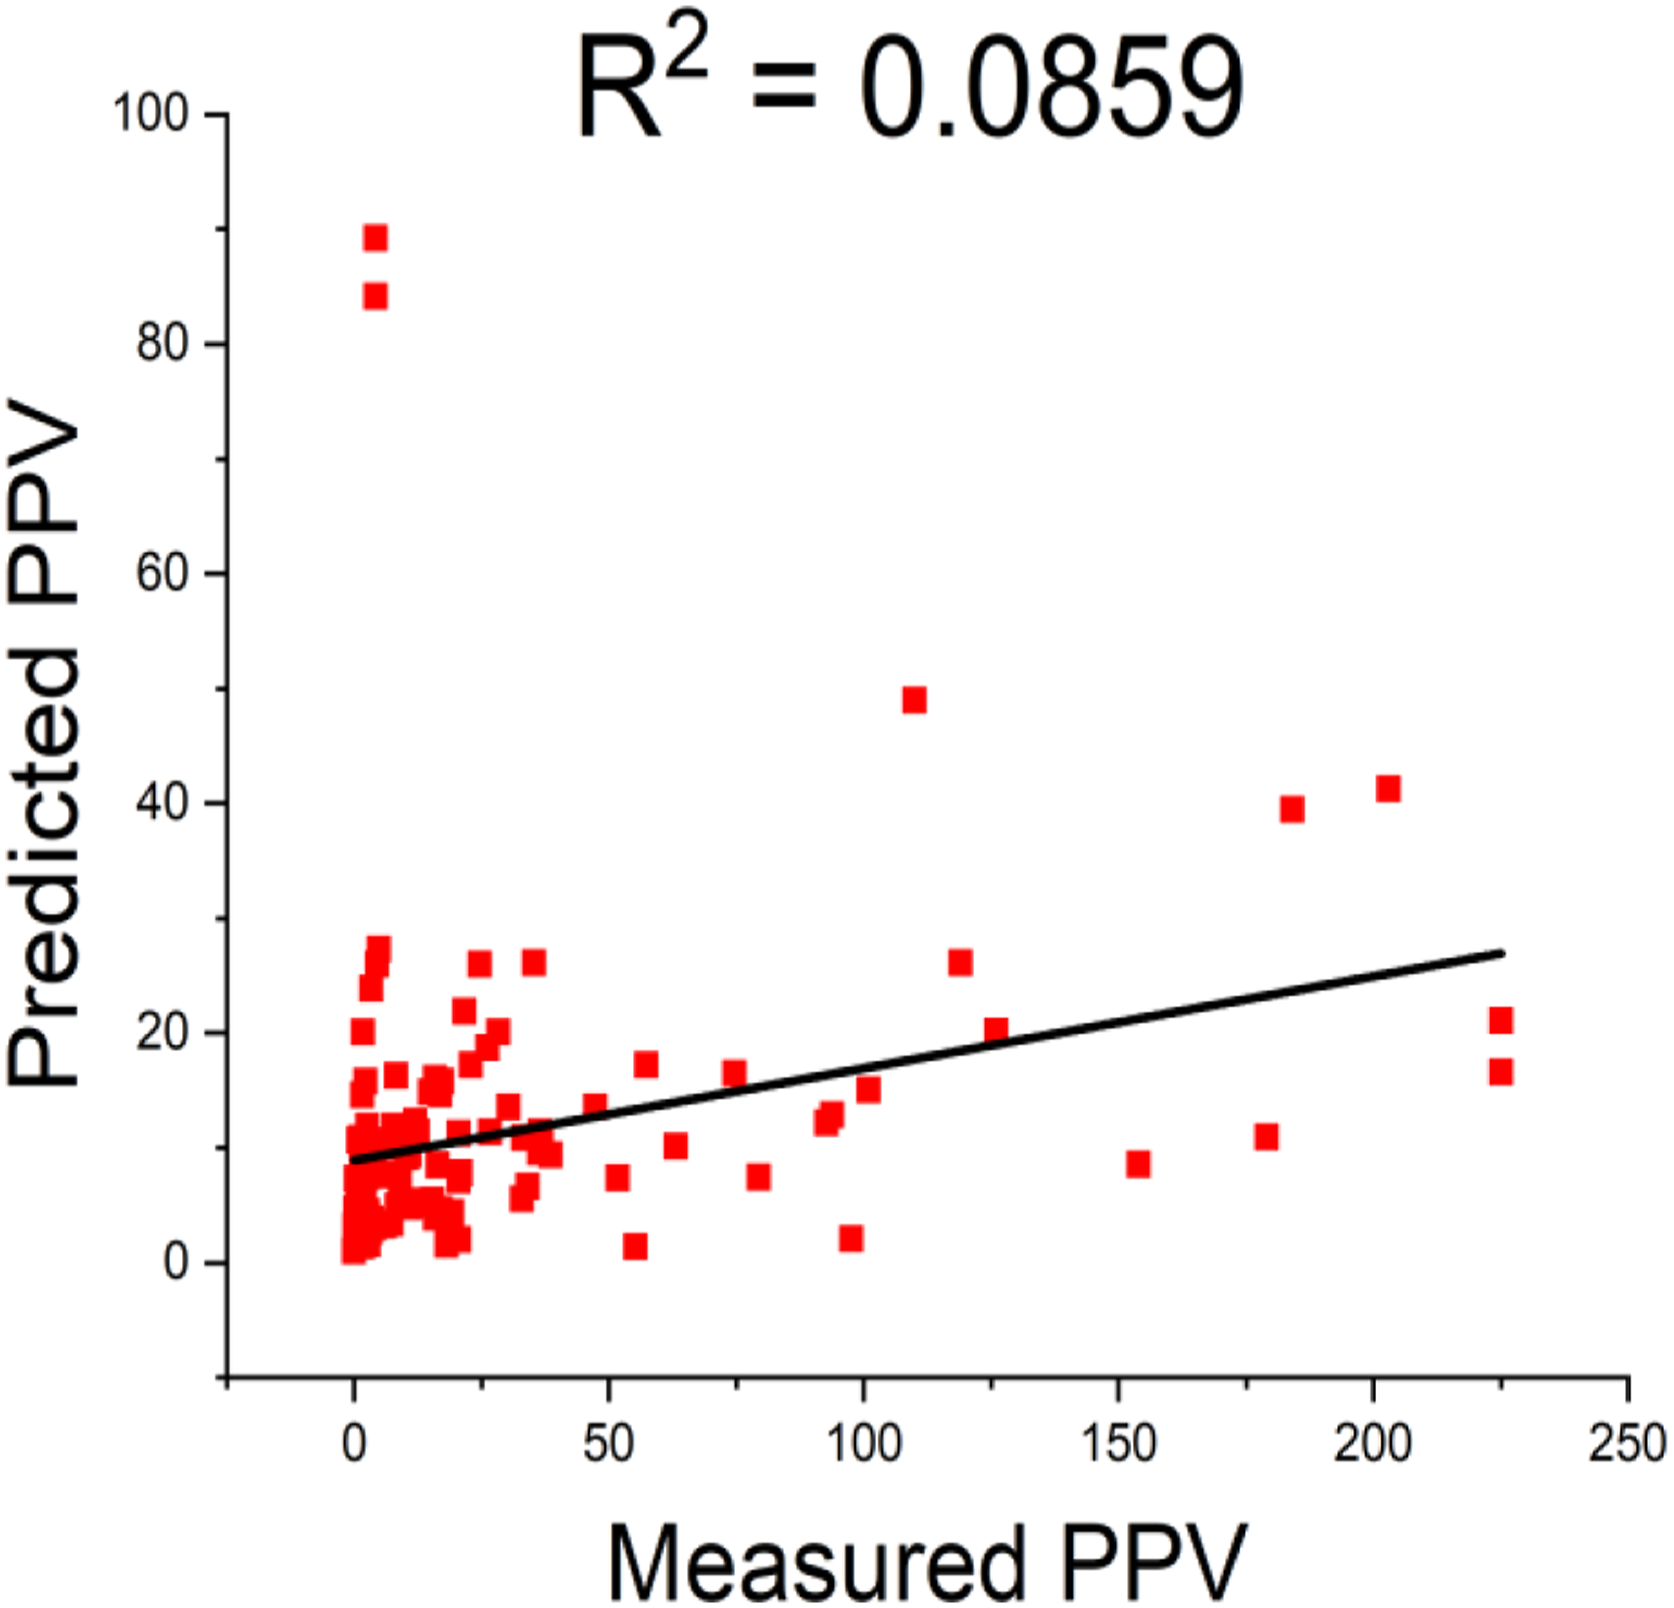
Figures 2, Figure 3, Figure 4 and Figure 5 demonstrate the relationship between measured and predicted PPVs by various SD laws and is summarized in Table 4. The site constants K, B, and n were obtained for distinct predictor equations depends on the determined PPV results. United States of Bureau of Mines predictor model. Langefors-Kihlstrom predictor model. Bureau of Indian standard predictor model. Central mining research institute predictor model. Calculated site parameters for different predictors. Note: K, B, n are site constants for distinct vibration predictor equations.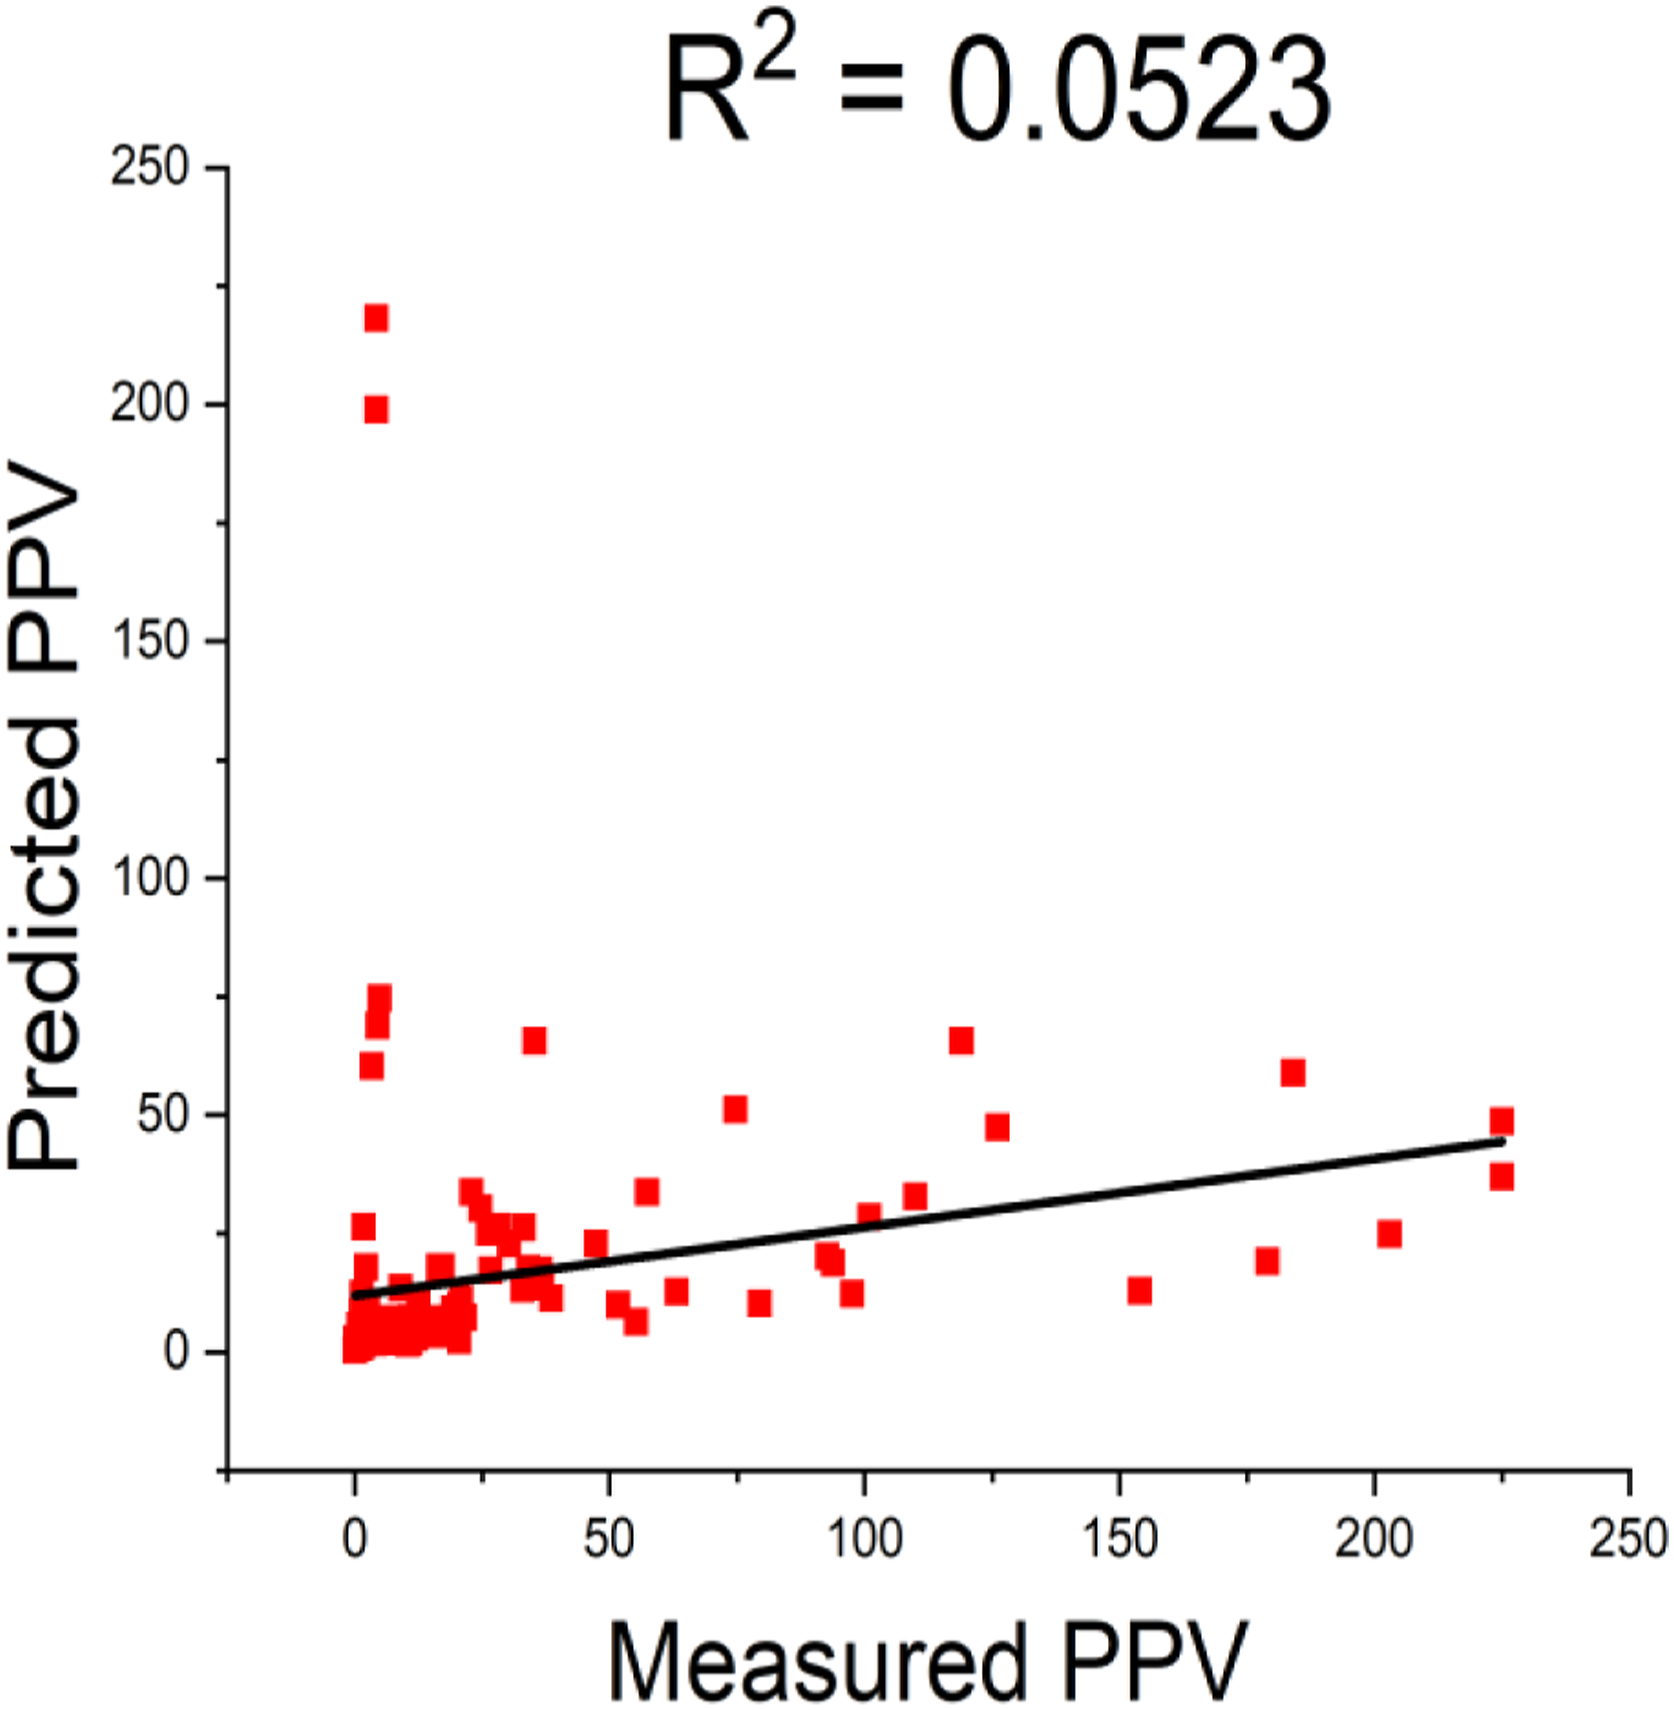


Overview of ensemble machine learning algorithms
eXtreme gradient boosting (XGBoost)
eXtreme gradient boosting (XGBoost) is an enhanced decision-tree-based ensemble machine learning algorithm that use a gradient boosting decision frame work.18-19 In 2016, Chen and Guestrin were created the XGBoost algorithm, which can compose boosted trees effectively.
20
It can be operated in parallel, and resolve both regressions as well classifier challenges. The key ability of the XGBoost method is the optimization of the value of objective function and develops models with help of gradient boosting framework.
21
It can be used to solve regression classification, rankings, as well as user-defined prediction models. It can support all kind of languages such as Python, C++, Java, Julia, and Scala. It has proved its mettle in data science issues in various applications in a speed and efficient method owing to supports parallel tree boosting and tree pruning. Usually, an object function comprises of two parts such as training loss as well as regularization
21
Working flow of XGBoost algorithm.
23



Random forest method
Random forest method is a integration of bagging ensemble algorithms taken from classification and regression tree (CRT) as well as random space model. It is also one of decision tree method introduced by Breiman. 24 It is popular owing to robust non-parametric statistical approach for regression as well as classification problems. On the contrary, it was considered as an ensemble model depends on the obtained results of decision trees to fulfill accuracy and efficiency of prediction. 25 For each and every observation, it amalgamates the predicted values of each decision tree in the forest to provide the optimum solution. In this method, each and every tree roles as a voter for the final decision of RF. 22 Based on the previous literature surveyed, RF regression key characteristics such as ntree, max. depth, subsample, and mtry are affect the performance of the developed RF model as well as used for reducing the error.26,27
Important characteristics of the XGBoost-RF ensemble algorithm when tunning for optimized results.
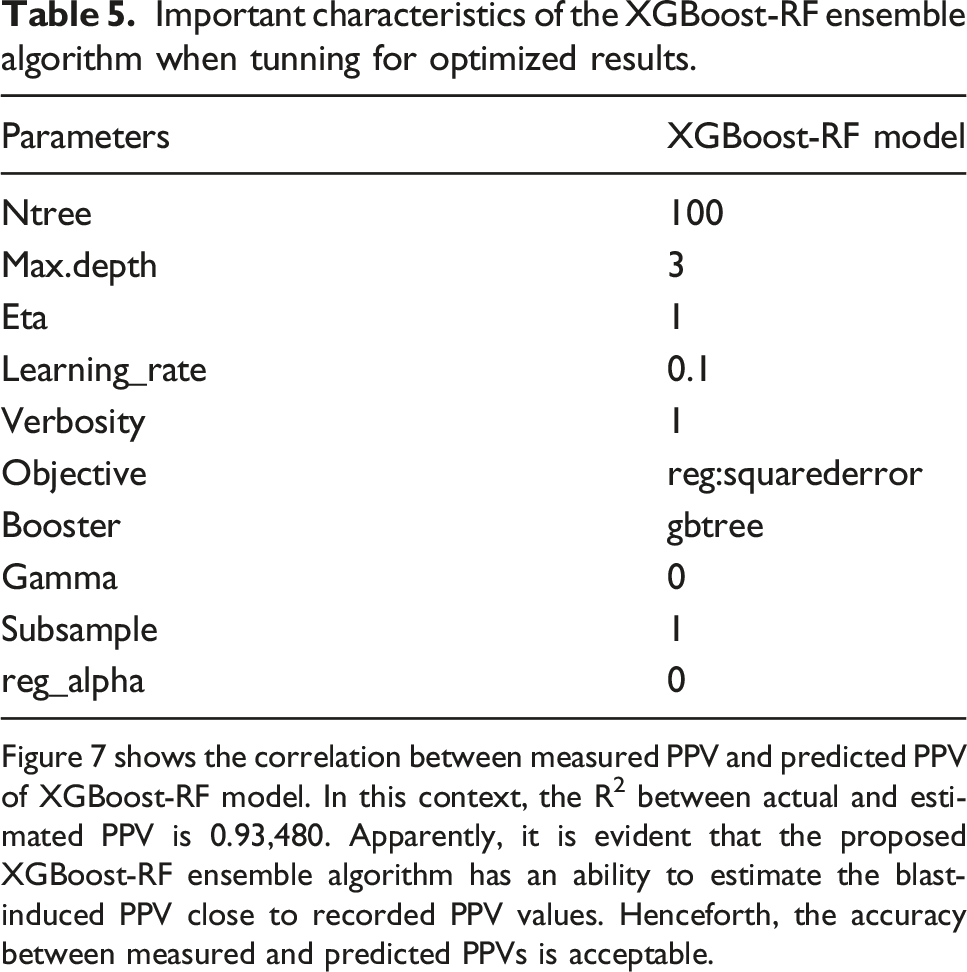
Figure 7 shows the correlation between measured PPV and predicted PPV of XGBoost-RF model. In this context, the R2 between actual and estimated PPV is 0.93,480. Apparently, it is evident that the proposed XGBoost-RF ensemble algorithm has an ability to estimate the blast-induced PPV close to recorded PPV values. Henceforth, the accuracy between measured and predicted PPVs is acceptable.
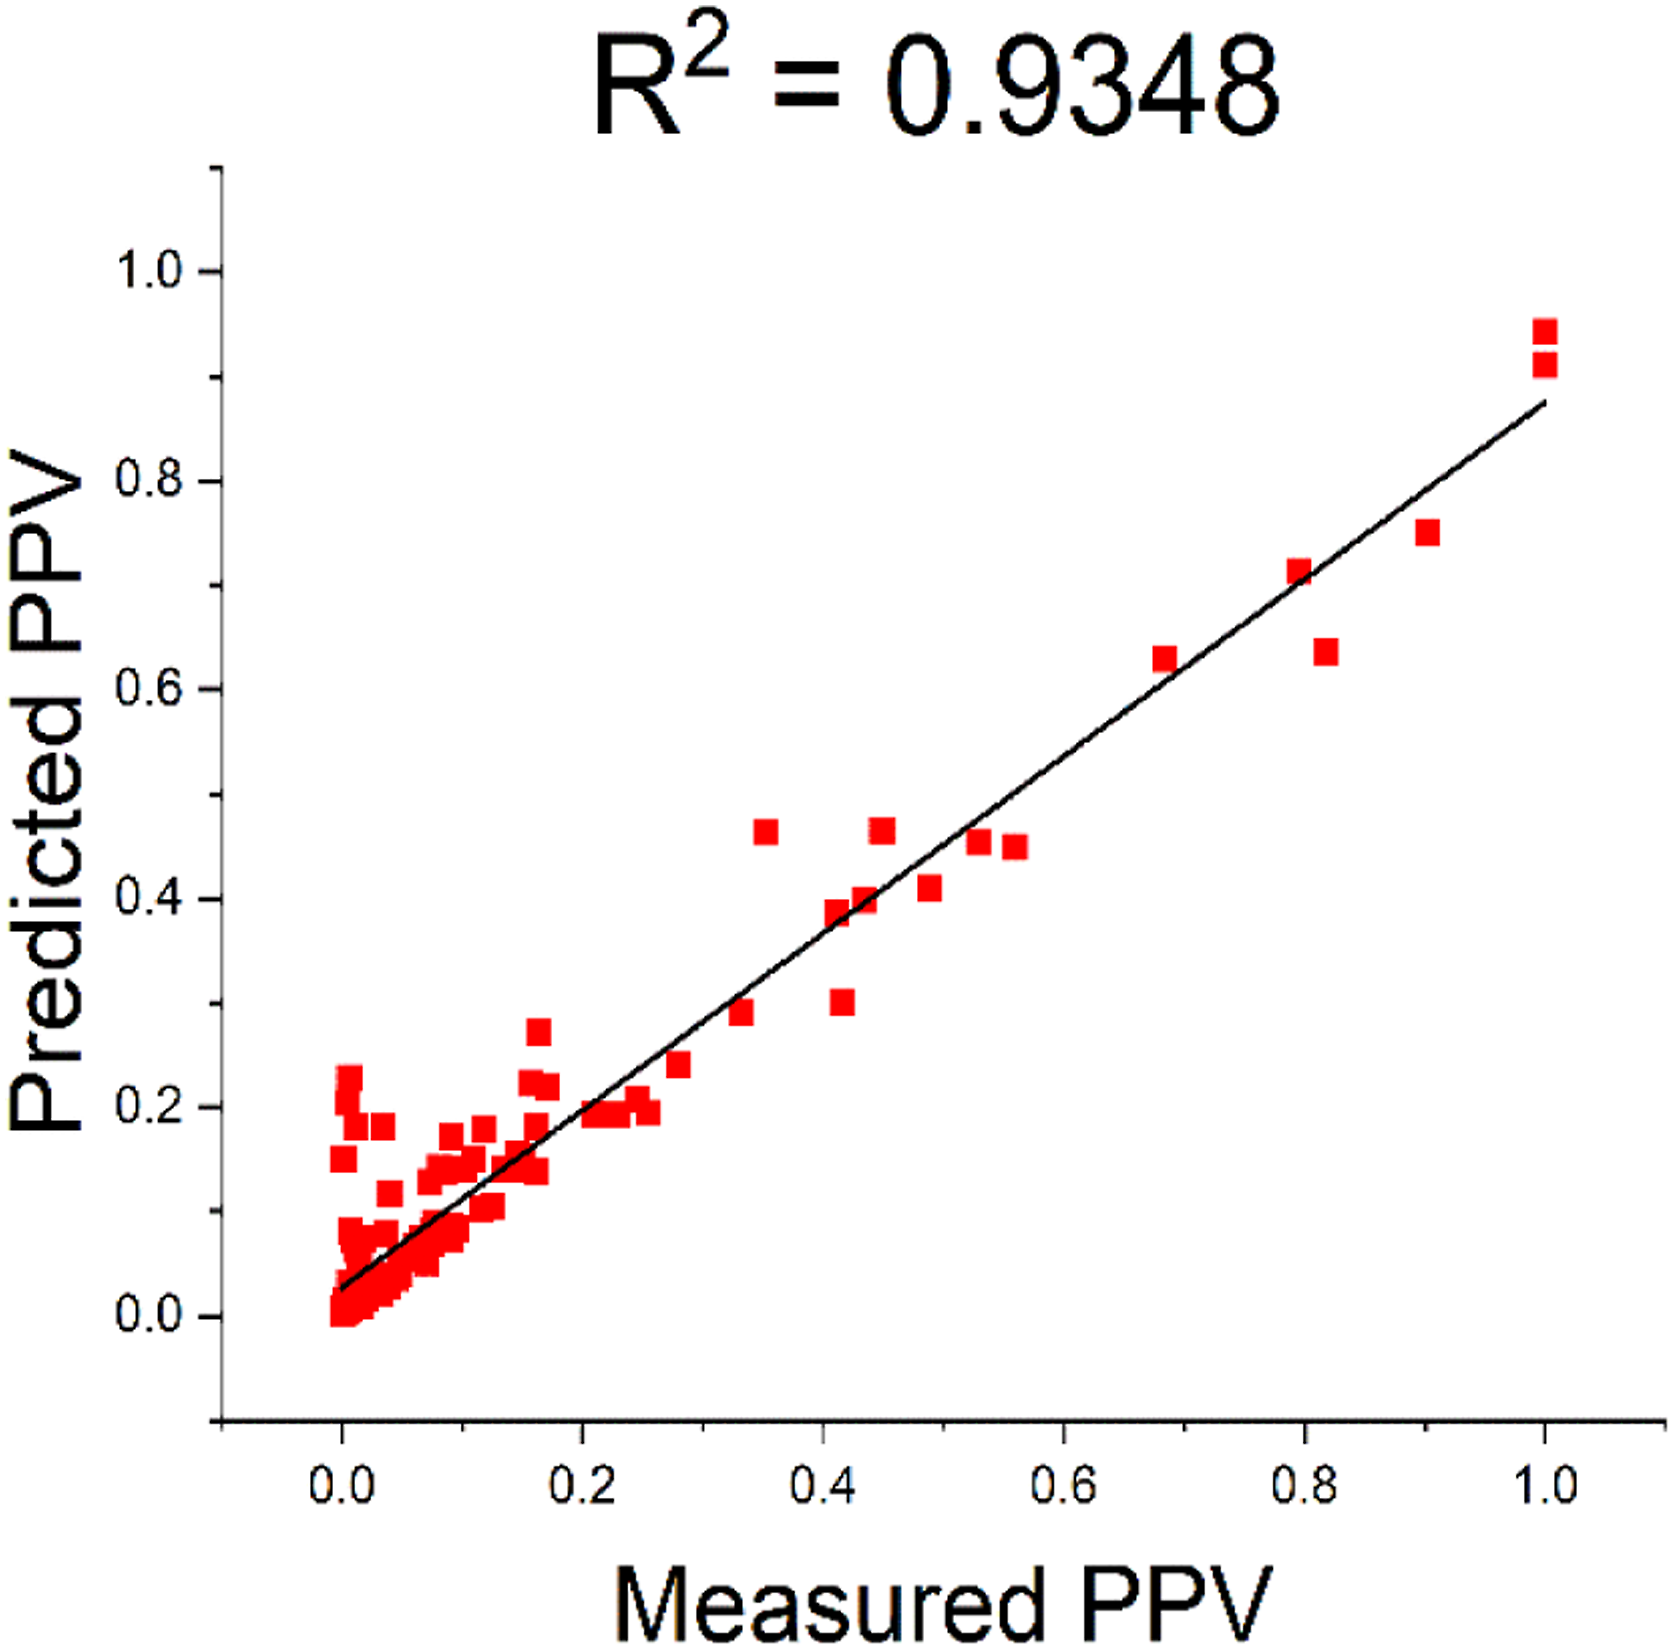
XGBoost-RF model.
Decision tree
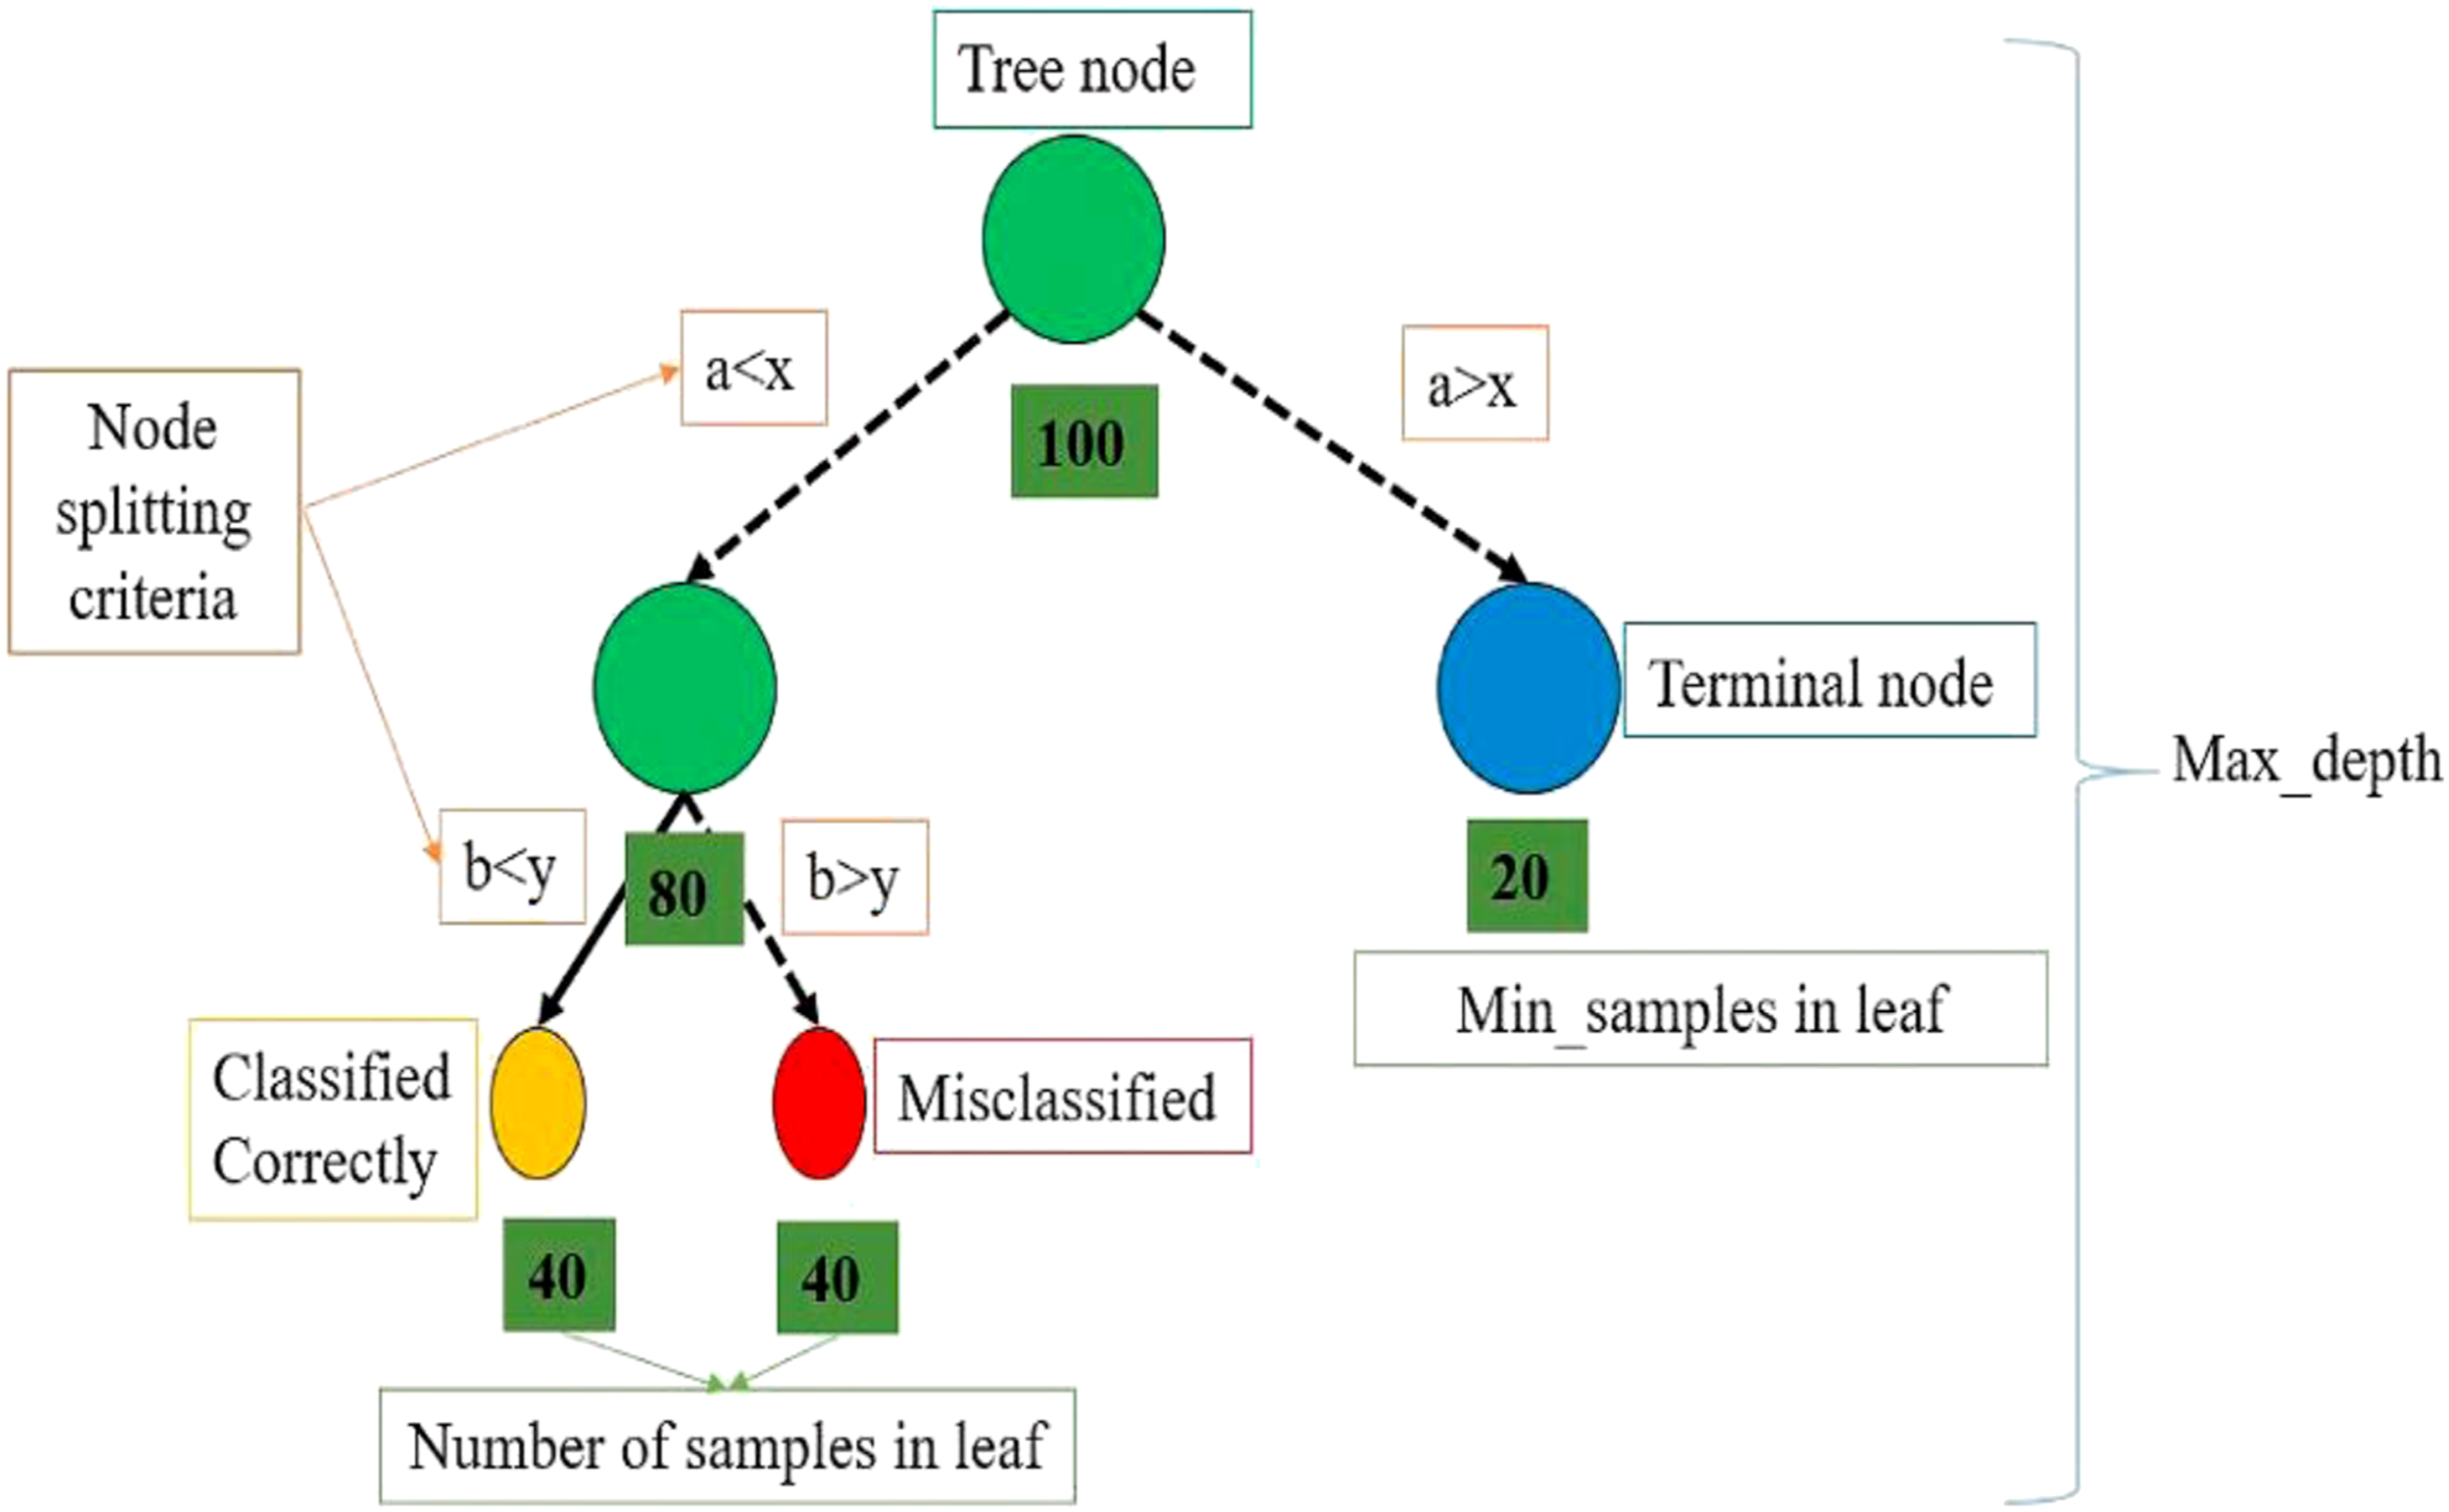
The decision tree algorithm is a supervised algorithm. It is a kind of popular non-parametric model which is used for both classification and regression problems. This model follows a tree like structure by taking some decisions and it follows top-down approach. In the process of constructing a model, it generally uses a set of binary rules to predict the target value. There are four parameters which are involved in constructing decision tree. They are the root node, decision node, branch, leaf node. The root node represents the whole data or sample, further it divides into different nodes. Every node in the tree represents an input feature from the dataset (see in Figure 8). Every splitting node is known as a decision node and a sub-tree called a branch. Leaf node is a node where further splitting is terminated and it represents the target value. In flow of decision tree construction, it involves asking a series of questions at every decision node based on a threshold value which is already chosen. Based on the answers, it will be categorized into different branches. This process occurs iteratively and finally it reaches to the leaf node which represents the target value.
28
Architecture of decision tree algorithm.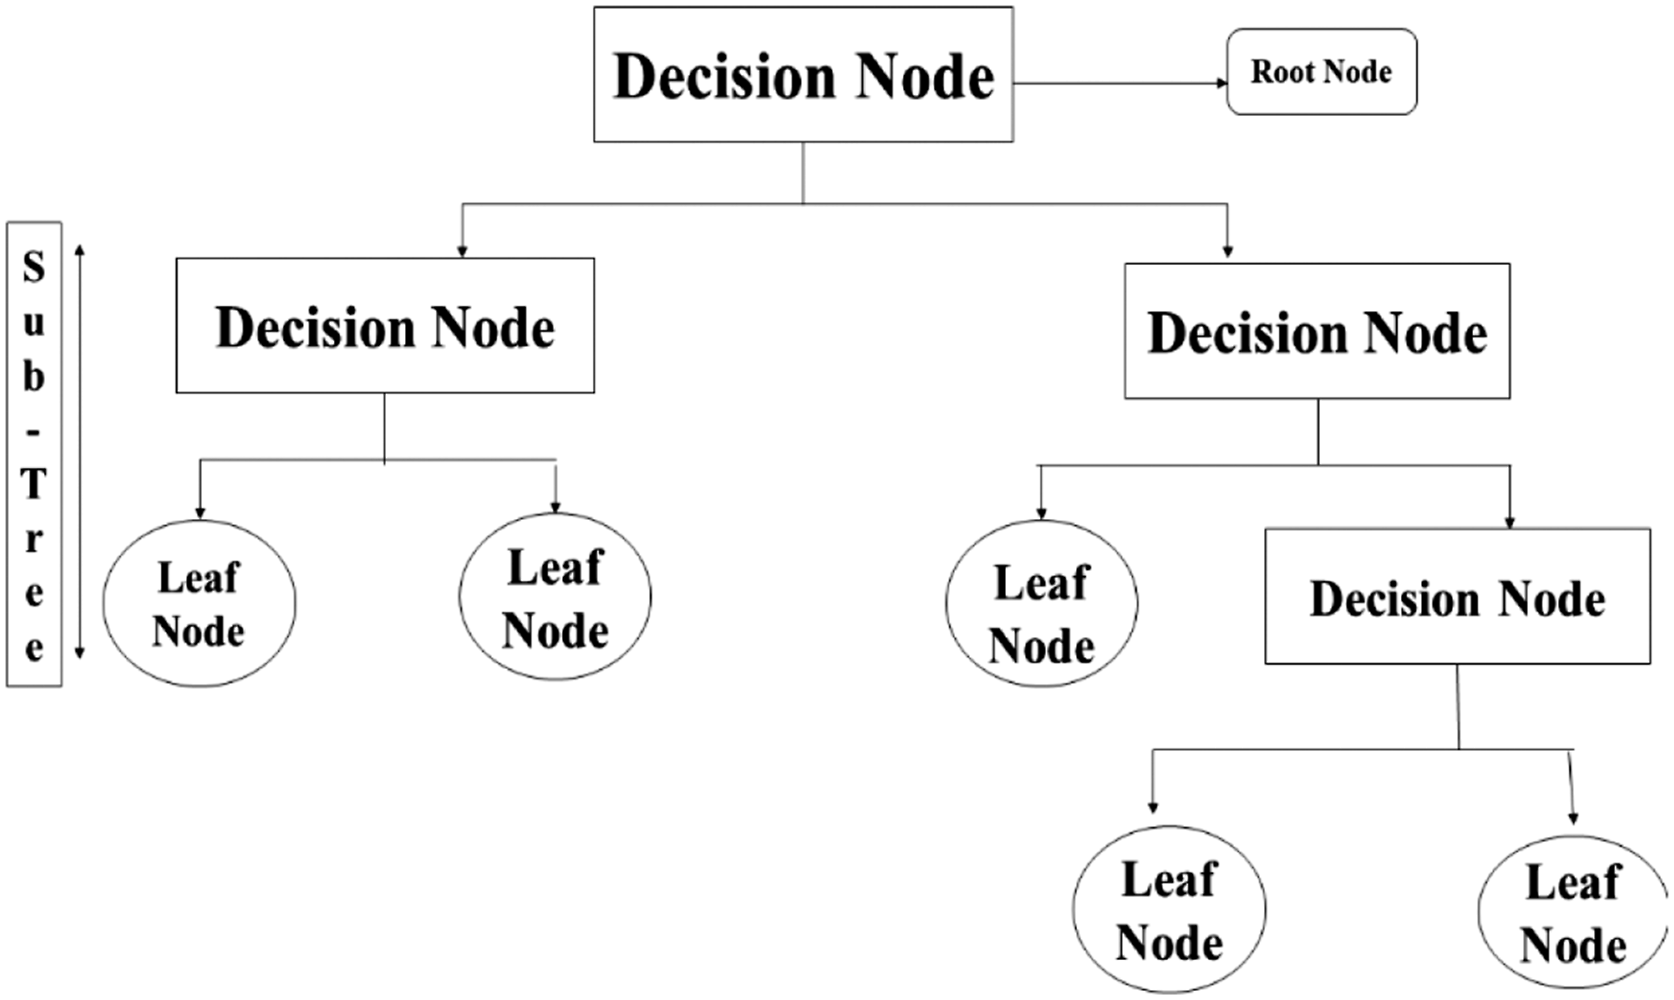
Usually, in decision tree regression splitting occurs by dividing the data into subsets based on one of the input features and then by calculating the averages of the subsets the tree chooses the subset with the smallest average value. For every feature in the dataset, choose different threshold values and calculates the averages and then finds the sum of squared residuals, by comparing the residual values and fix the threshold value which has lowest sum of squared residuals. After fixing the threshold values for every feature, select the feature with lowest sum of squared residuals and it splits data into subsets. At present, it selects the best feature for splitting the subset again. This process occurs until it has homogeneous samples. It can also mention the maximum depth of the tree before training the model. It ensures that the tree as the mentioned depth and it can mention some of the factors need like criterion (mean square error, absolute error, Poisson), number of minimum splits, minimum leaf nodes, splitter type (best, random). During the training of the model, it figures out the relations between data and target and it builds the best tree which is used at the time of testing the model. In this regard, decision tree algorithm was developed particularly to evaluate and predict the PPV accurately. In this model, 70% (approximately 84 blasting events) are considered for training, and the rest (37 events) are for testing. This algorithm was implemented using python language. Figure 9 shows the correlation between Measured PPV and predicted PPV of decision tree model. In this process, the R2 between actual and estimated PPV is 0.9549. It is infer that the proposed decision tree ensemble algorithm has an ability to assess the PPV close to measured PPV values. Hence, the accuracy between measured and predicted PPVs is significant. Decision tree model.
Model performance metrics
List of performance metrics. 8
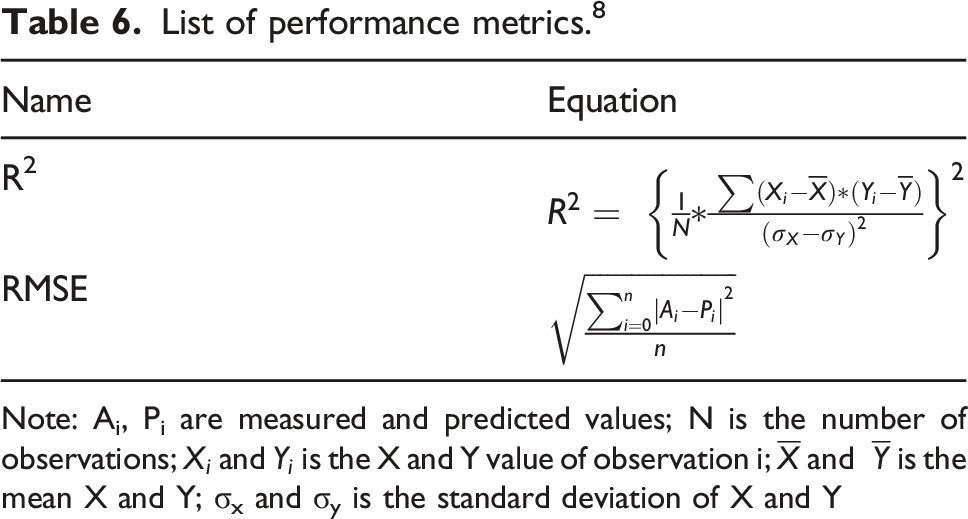
Note: Ai, Pi are measured and predicted values; N is the number of observations;
Sensitivity analysis
In this current work, sensitivity analysis is also performed to find the more affected input parameters on the amount of output parameter. Considered input parameters are: spacing; burden; top stemming, distance, explosive per charge, hole diameter, hole depth, number of holes and PPV is an output parameter. The following method was used for performing the sensitivity analysis
29
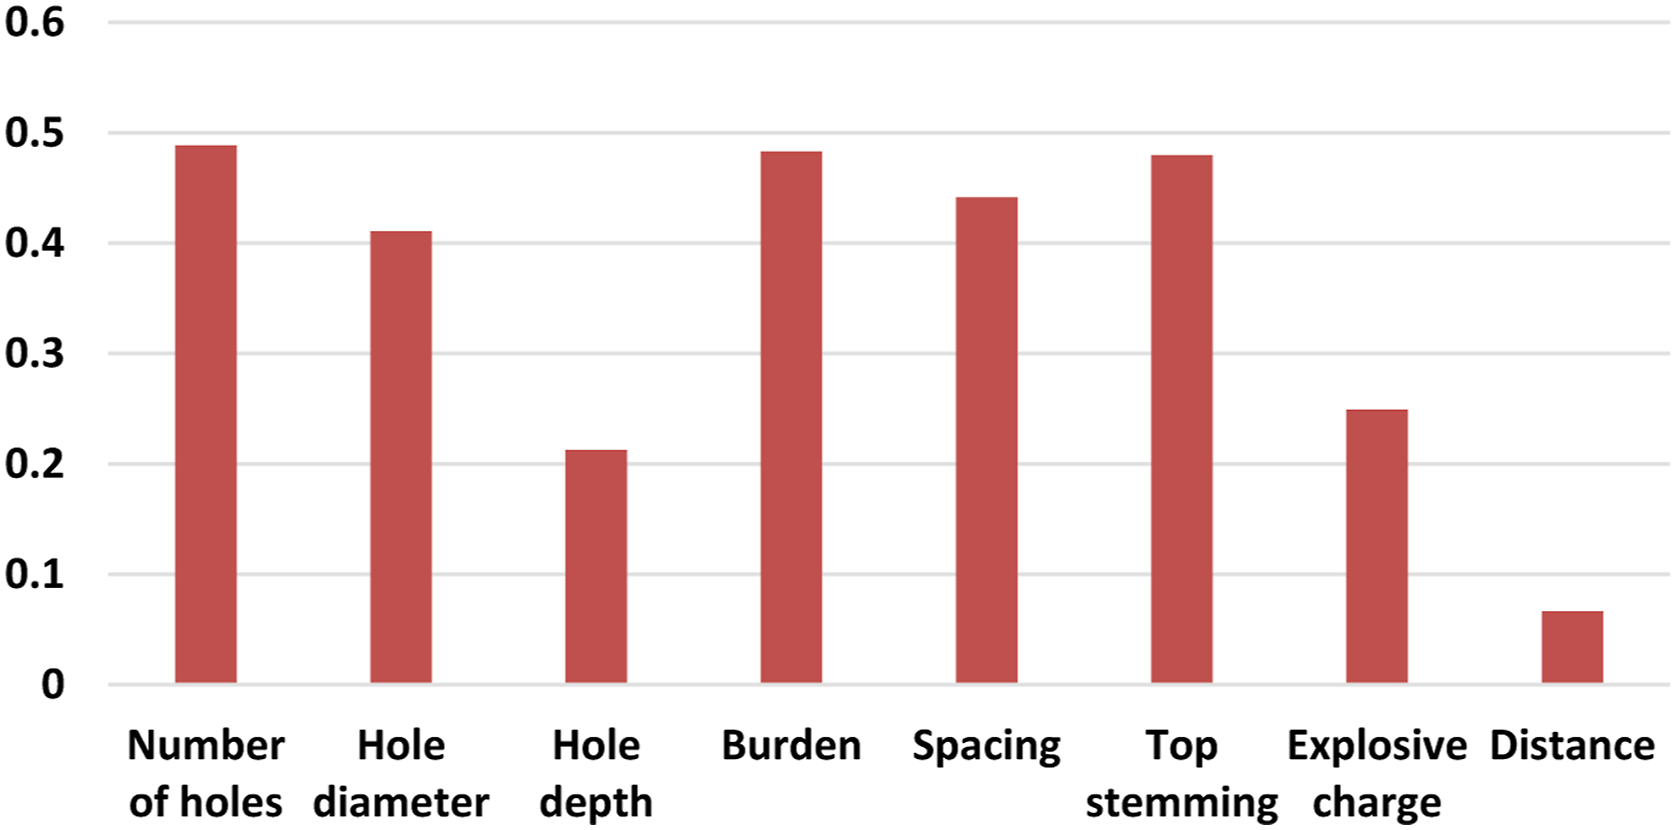
Sensitivity analysis for determining the effect of each input parameter on peak particle velocity.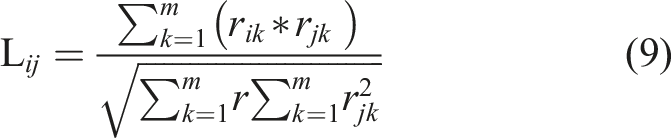
Results
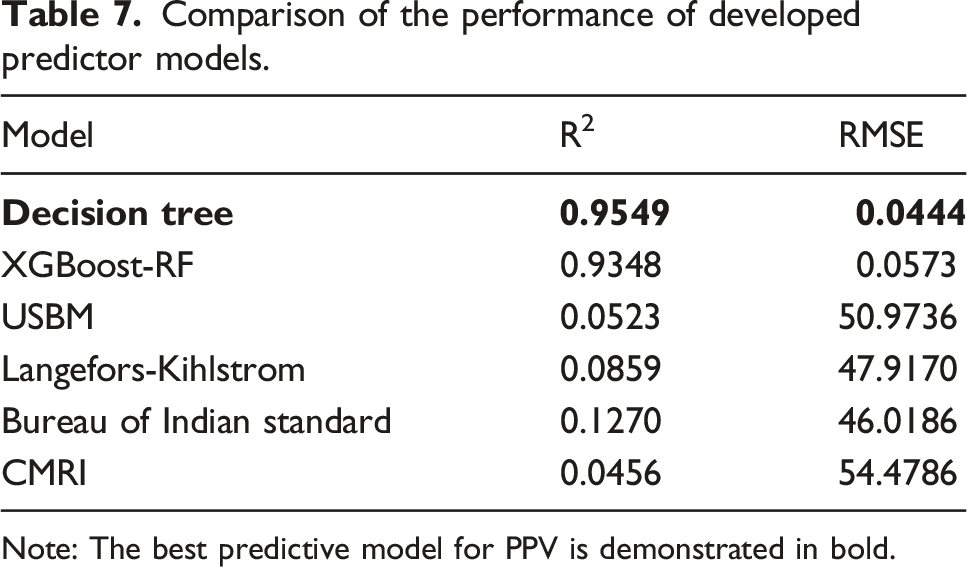
Comparison of the performance of developed predictor models.
Note: The best predictive model for PPV is demonstrated in bold.
Discussion
The key findings of this current indicated that ensemble machine learning models outperformed the conventional predictor models in estimating the amount PPV at Mine-A, India. It should be pointed that all the developed machine learning models performed effectively for 121 input datasets. Especially, the overfitting issues were not occurred during modelling. In this research, two popular machine learning models named as XGBoost-RF and Decision Tree algorithms were developed to estimate the intensity of PPV. The determined results inferred that Decision Tree model provided the most performant with significant R2 of 0.9549, and less RMSE of 0.0444. Furthermore, it provides better prediction results and acceptable accuracy between predicted and measured PPVs. However, the performance of XGBoost-RF model is also with R2 of 0.9348, and RMSE of 0.0573. Similarly, four conventional empirical predictor mdoels USBM, Langefors-Khilstom, Bureau of Indian standard, CMRI Predictor were applied for PPV prediction. The obtained results prove that the Bureau of Indian Standard model provides high R2 (0.1270) and low RMSE (46.0186) as compared to other conventional predictor equations. Table 7 summarized R2 and RMSE for Decision Tree, XGBoost-RF, and various conventional vibration equations. Based on the sensitivity analysis. In addition to that, a sensitivity analysis method was applied to determine intensity of influenced varible values (Lij) were determined as 0.489, 0.411, 0.213, 0.484, 0.442, 0.479, 0.249 and 0.067 for number of holes, hole diameter, hole depth, burden, spacing, top stemming, explosive charge per delay and distance. It’s evident that burden, number of holes and top stemming are the more influenced variables on output (PPV).
Conclusion
The current study of the BIGV recorded data with reference to PPVs (in mm/s) for diverse blast events in Mine-A was conducted. The following key analysis points are observed from the field test. They are: Recorded a blast of 121 events at Mine-A blast site using Instantel Minimate Plus instrument by placing at distinct strategic locations as well as collected the PPV values. The observed values are within the safe range as stated in DGMS Circular, India. Different conventional empirical predictor equations viz. USBM, Langefors-Khilstom, Bureau of Indian standard, CMRI Predictor were used for PPV prediction. The results evident that the Bureau of Indian Standard model shows high R2 (0.1270) and low RMSE (46.0186) as compared to other conventional predictor equations. In the XGBoost-RF model, there are several parameters are chosen and tested to enhance the predictability performance. Tunning the parameter seems encouraging to subside the loss problems such as overfitting and complexity. Hence, model parameters are tuned in such way to get optimum optimization (see Table 5). A database consists of 121 datasets, in that, 84 datasets used for the training process and testing process was carried out with 37 randomly selected datasets for all models. After trial-and-error method, the optimum Decision Tree ensemble machine learning model provides less RMSE and signficant R2 for prediction of PPV (RMSE = 0.0444 and R2 = 0.9549, respectively). Based on sensitivity analysis, it could be inferred that burden, number of holes and top stemming were more effective on output (PPV) parameter compared with the other input parameters.
Footnotes
Declaration of conflicting interests
The author(s) declared no potential conflicts of interest with respect to the research, authorship, and/or publication of this article.
Funding
The author(s) received no financial support for the research, authorship, and/or publication of this article.
