
Abstract
At present, target on eco-friendly acoustic material is decorated to diminish impact on environment due to adoption of synthetic material in acoustic application. In this paper, Taguchi method is enforced to find optimum parameters for sound absorbing coefficient of coconut fiber-based sound absorbing material. The influence of the various process parameters, i.e. Thickness, density, air gap and fiber percentage (%) on sound absorption coefficient (SAC) was studied. The settings of the parameters were determined by using Taguchi’s experimental design method. Orthogonal arrays (L25) of Taguchi, the signal-to-noise (S/N) ratio, the analysis of variance (ANOVA), and regression analyses were employed to find the optimal process parameter levels and to analyze the effect of these parameters on sound absorption coefficient values. Confirmation test with the optimal levels of parameters was carried out in order to illustrate the effectiveness of the Taguchi optimization method. Optimum parameters were found by using Taguchi method are which have 50 mm thickness, 0.0002539 g/mm3 density, 70% fiber percentage and 0 mm air gap. Also significant parameters are found which are thickness and density having p-value less than 0.05 and followed by fiber percentage and air gap. By using optimum parameters sound absorption coefficient is increased to 0.98 at frequency 2800–3500 Hz.
Keywords
Introduction
Motivation to use synthetic sound absorbing material is accelerated sound pollution in day today’s activity. Synthetic sound absorbing material causes harmful impact on environment and as a result of that research on natural sound absorbing material is trending.
Many researchers investigated the sound absorption properties of different natural materials like tea leaf fibers, cork, pineapple fiber etc. for different parameters like thickness, density, composition, air gap and fiber orientation.1–7
Ersoy et al. investigated the sound absorbing characteristics of tea leaf fibers. Study reveals sound absorption properties woven textile cloth and backing. 8 Xiang et al. investigated the sound absorption characteristics of kapok fibers. Study reveals acoustic characteristics of kapok fibers by considering variable density, thickness, fiber length. As kapok fibers have natural hollow structure inside which is responsible for good sound damping capacity. 9 Zulkifli et al. studied sound absorption characteristics of coconut coir fibers. Study reveals that use of porous backing improve sound absorption coefficient at high as well as low frequency. 10 Tang et al. studied the sound absorption characteristics of corn husk. 11 Bhingare et al. investigated the sound absorption properties of coconut coir fiber by varying parameters like thickness and density. Study shows that with increase in thickness sound absorption coefficient of coconut coir sample increased. For density increase sound absorption coefficients increased till certain amount and further trend is decreased. 12 In another study Bhingare et al. revealed the sound absorption characteristics of coconut coir-polyurethane resin (30%) based acoustic material. In study different thickness, density, composition and air gap are considered and their effect on sound absorption coefficient was evaluated. 13
Garg et al. 14 studied the effect of different parameters of sound transmission loss which is important acoustic properties measurement characteristic. Yang et al. studied the acoustic properties of natural fiber and their composite. This study revealed the sound absorbing characteristics of flax, ramie and jute fibers and their composite by using impedance tube method. This natural fiber shows good acoustic properties due to internal hollow structure and composite material shows good agreement with synthetic sound absorbing material. 15 Putra et al. studied the acoustic characteristics of pineapple leaf fibers. Samples of different density and thickness are prepared for testing and sound absorption coefficient was calculated by using impedance tube set up. From result it was visible that thickness and density are important parameters for improvement of sound absorption coefficient. 16 In another study Putra et al. investigated the sound absorption properties of sugarcane waste. Sound absorption coefficient of 0.65 was captured by using impedance tube set up which was fair enough when compared with synthetic sound absorbing material. 17
Based on literature, different parameters like thickness, density, air gap etc. are studied but very limited literature is available by considering Taguchi technique of optimization. To the authors knowledge no work or very limited work is available on optimization of four parameters which are thickness, density, air gap and fiber percentage to investigate the sound absorption coefficient by using Taguchi and ANOVA. Material used in this study is natural coconut coir fiber and polyurethane resin. In current investigation, parameters considered were thickness, density, air gap, fiber percentage and response variable was sound absorption coefficient. Furthermore, model was developed by using regression analysis and validity of model is also confirmed. Thickness, density, fiber percentage (composition) and air gap are selected based on literature review and pilot study. Above four parameters play crucial role on sound absorption characteristics as per literature review and a result of that above four parameters are selected for optimization and to obtain which parameters are most significant for sound absorption coefficient. Mathematical model is developed for sound absorption coefficient and further validated by conducing confirmation test.
Material and method
For current investigation material used was coconut coir fiber and polyurethane resin. Samples of different thickness, density and composition were prepared. Coconut coir fibers are easily available in India and used coconut coir fibers are having average diameter of 0.3–0.6 mm and average length 90–110 mm. Samples of different density, thickness and composition were prepared by using mould of diameter 35 mm. Coconut coir fibers and resin are filled in mould properly and mould is placed in furnace around 100–110°C for 10–15 min and it resulted to get desired shape samples as shown in Figure 1(a). Impedance tube method is used to measure the sound absorption coefficient as per ASTM ISO 10534–2 and ASTM E1050-98 standards. Impedance tube set up consist of tube having diameter 35 mm, 2 microphones and DAQ system as shown in Figures 1(d) and (e). Sample of varying thickness (10 mm, 20 mm, 30 mm, 40 mm and 50 mm), composition as fiber weight %: resin weight % (100:0, 90:10, 80:20, 70:30 and 60:40) and varying density (0.0001987 g/mm3, 0.0002156 g/mm3, 0.000233 g/mm3, 0.0002539 g/mm3 and 0.000273 g/mm3) were prepared. Polyurethane resin used are having specific gravity 1.10 g/ml and viscosity 697 m. Pa. s. (a) Coconut coir sample (b) SEM image of coconut coir fiber (b) SEM image of coconut coir and polyurethane resin sample (d) Impedance tube set up for measuring sound absorption coefficient (e) Samples fitted in sample holder of impedance tube set up.
Scanning Electron microscope images of coconut coir fiber shows internal porous structure of fiber which results into sound absorption properties as shown in Figure 1(b). Similarly, SEM image of coconut coir fiber and polyurethane resin is also shown in Figure 1(c).
From Figure 1(b) SEM image of coconut coir fiber surface was irregular having large number of pore structure. With the propagation of sound waves into fibrous materials, the airflow in the pores vibrate and rubs against walls of pores and covert sound energy into heat due to viscous effect. Figure 1(c) shows SEM image of sample prepared by polyurethane resin and fiber showing pores created in resin. Pore cavity converts sound energy into thermal energy due dissipation of sound waves into cavities. Below block diagram shows the flow of study.
Method of measuring sound absorption coefficient
Sound absorption coefficient is very important to define sound absorbing properties of material. In this study impedance tube set up is used to measure sound absorption coefficient of samples. Impedance tube set up shown in Figures 1(d) and (e). Impedance tube output is connected to external computer, from where we are getting sound absorption coefficient value at different frequency. Standards used to measure sound absorption coefficient are ISO 10534-2 and ASTM E1050-98 standards.
Results and discussion
Pilot study
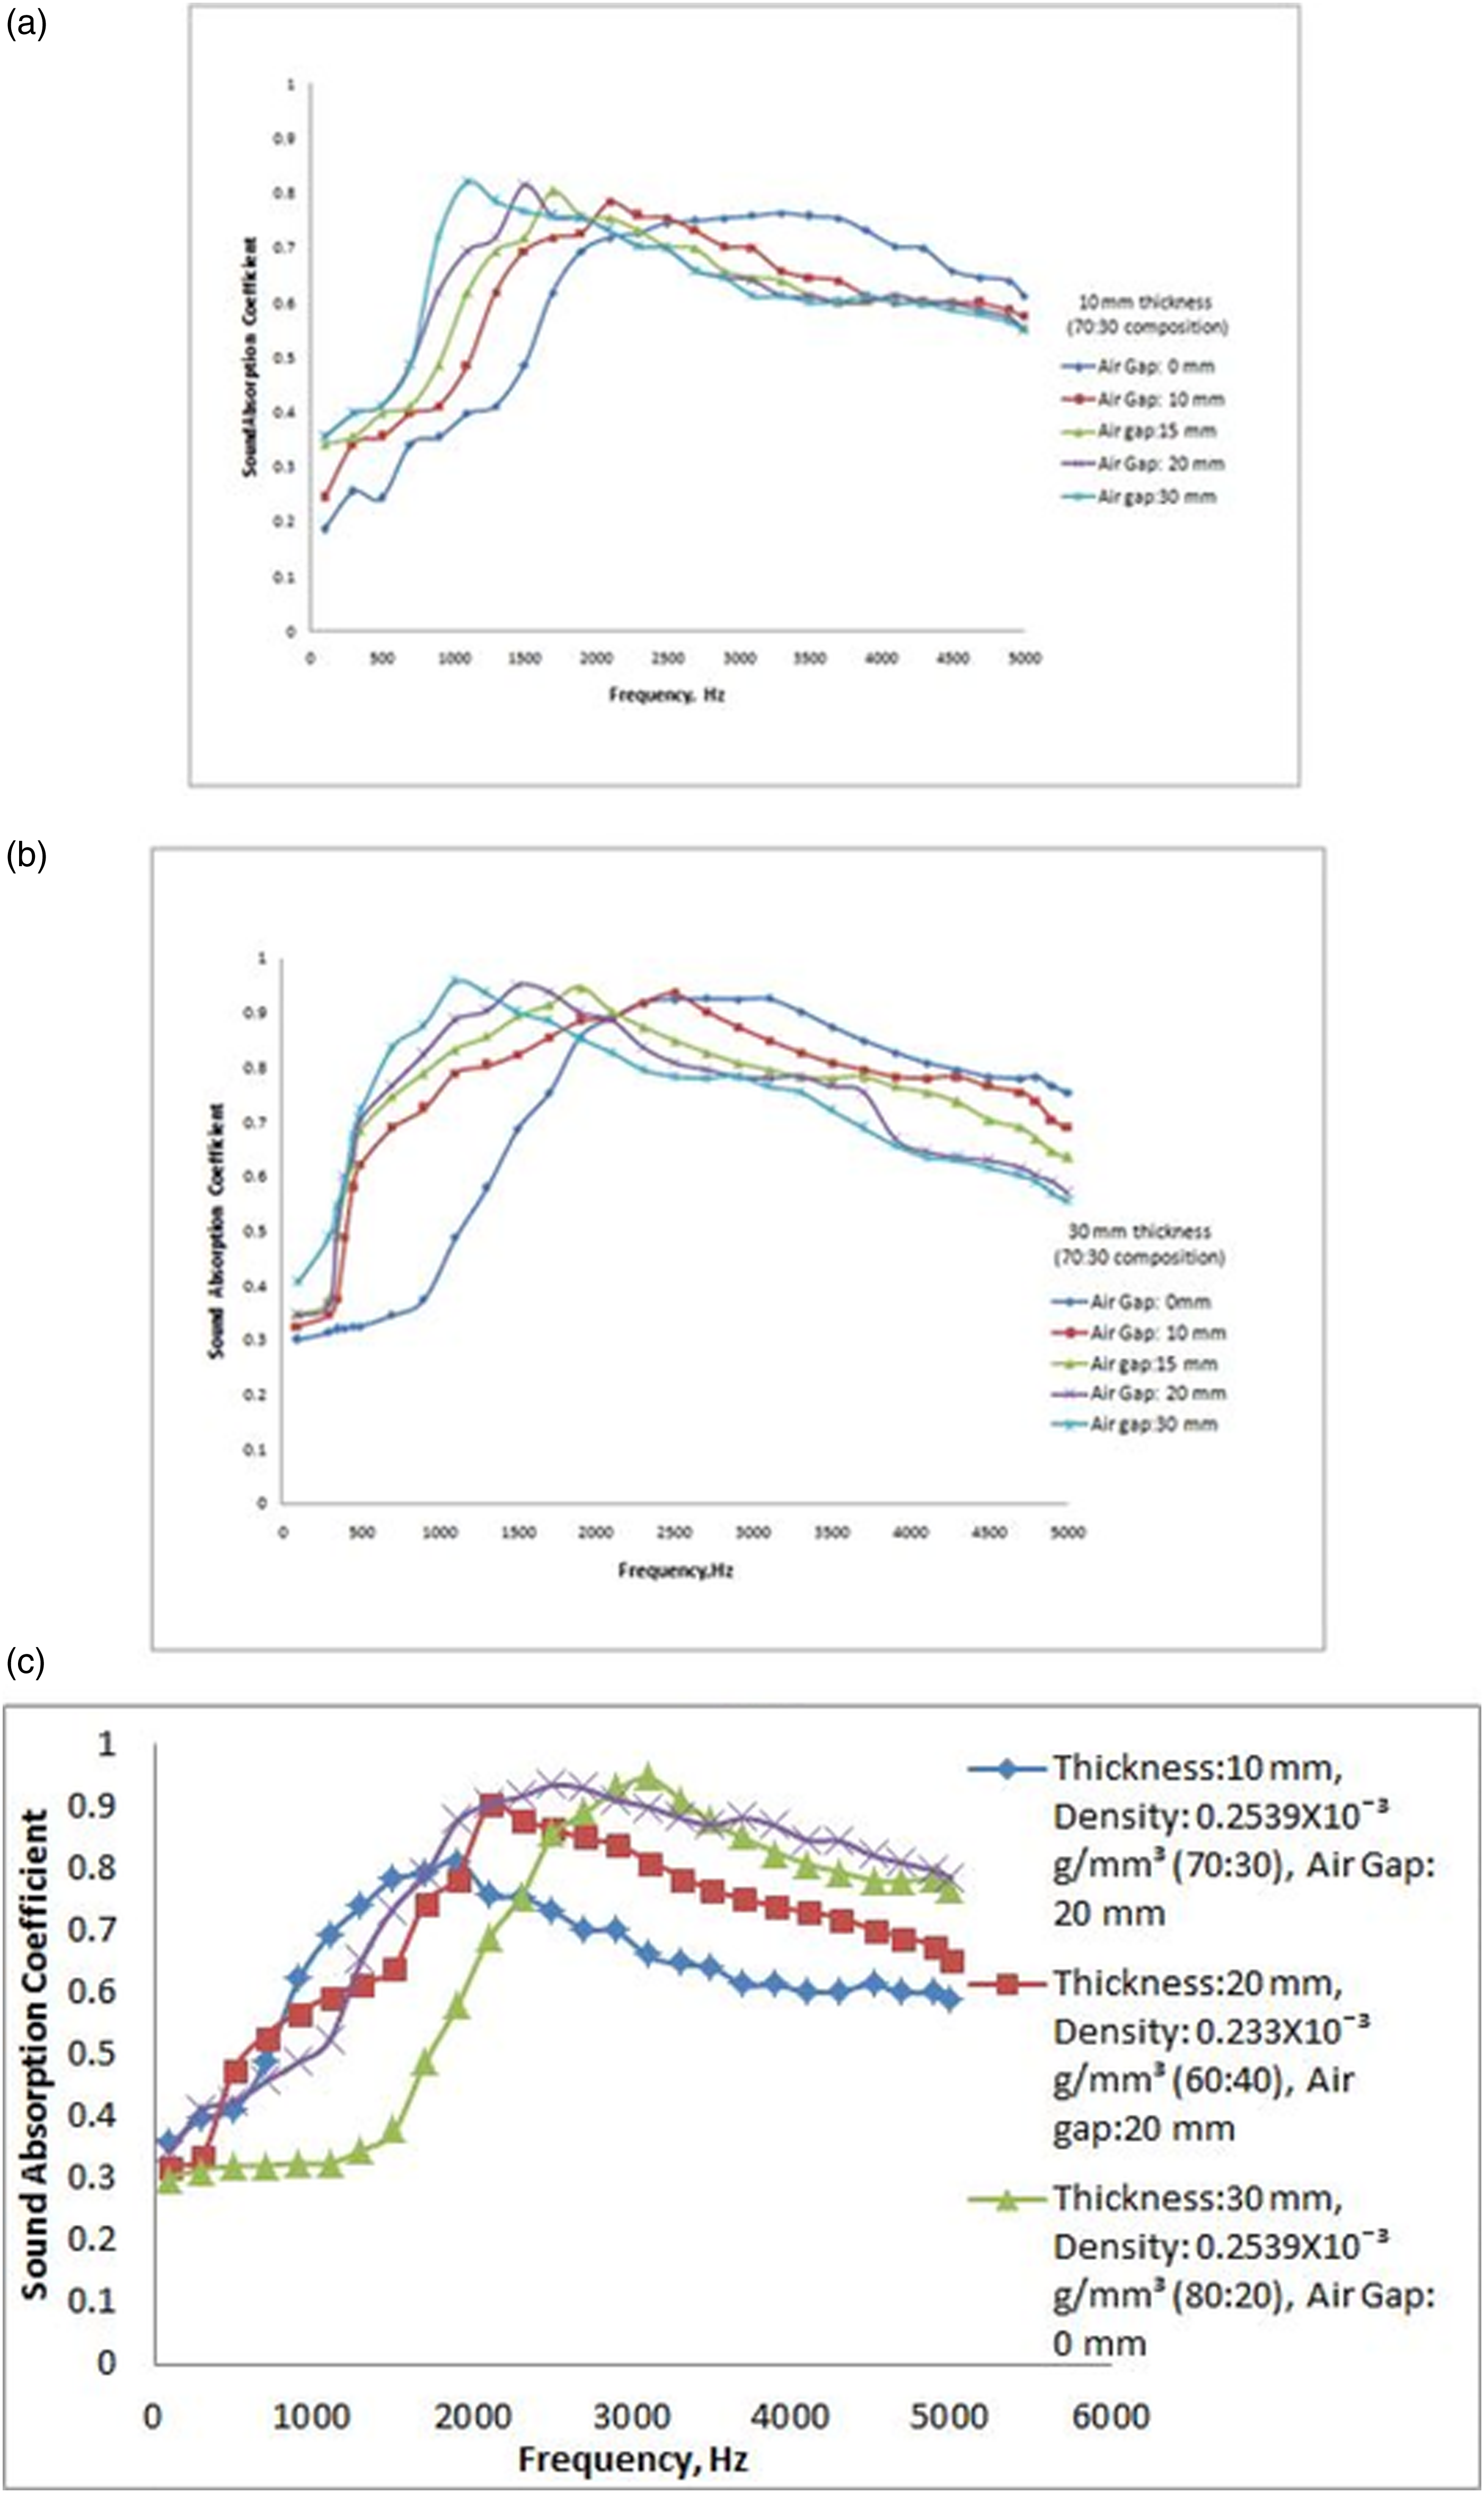
Pilot study has been carried out to study preliminary effect of different parameters. It was found that as thickness increased, sound absorption coefficient raised as shown in Figure 2(a). For density results shows increasing trend up to certain limit and then started decreasing as shown in Figures 2(b) and (c). For air gap it is clearly visible that as we have increased air gap, there is very slight increase in sound absorption coefficient but maximum peak is shifted towards lower frequency range as shown in Figures 3(a) and (b). (a) Effect of thickness on Sound Absorption coefficient (SAC) (b) Sound absorption coefficient for 30 mm thick sample with varying composition and density (c) Sound absorption coefficient for 40 mm thick sample with varying composition and density. (a) Sound absorption coefficient for 10 mm thick sample of 70:30 composition with 0.000253 g/mm3 density and varying air gap (b) Sound absorption coefficient for 30 mm thick sample of 70:30 composition with 0.000253 g/mm3 density and varying air gap (c) Sound absorption coefficient of experiment 4, 8, 14 and 19.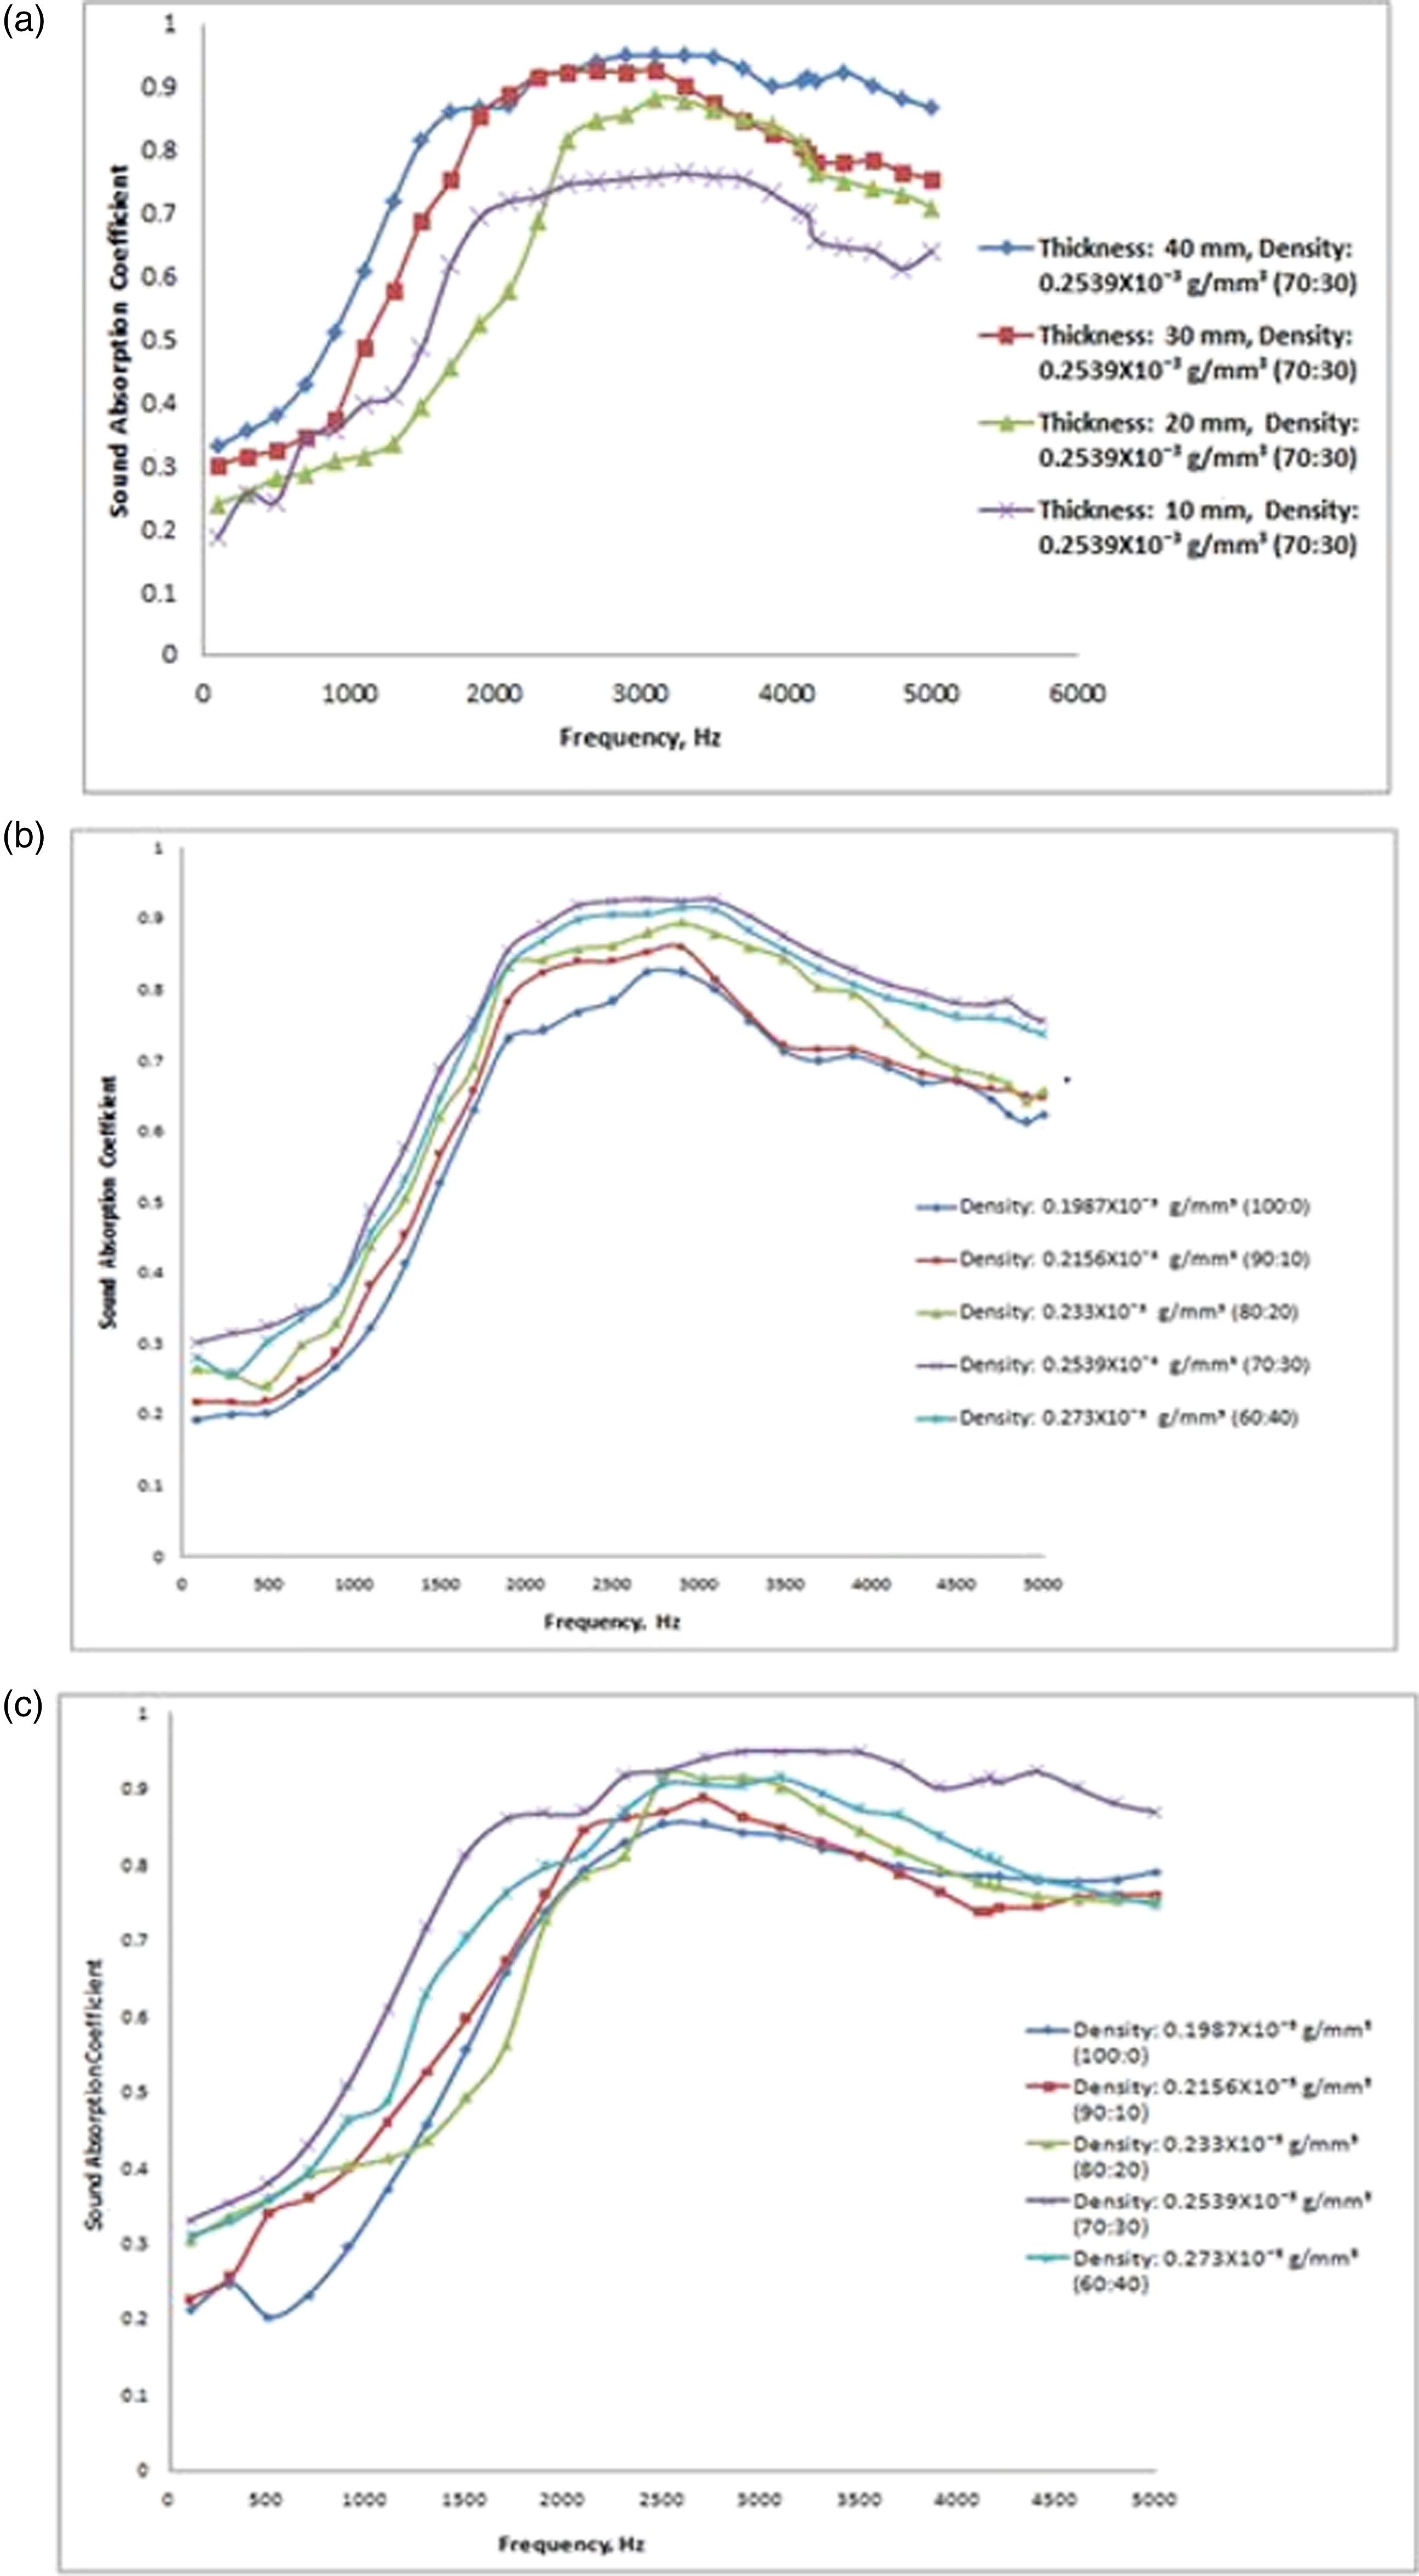
Taguchi experiment
Design of experiments is systematic approach that defines the relationship between factors affecting process and output of that process. It is method of designing experiments, in which selected number of experiments can be conducted.
Orthogonal array for experiments with result.
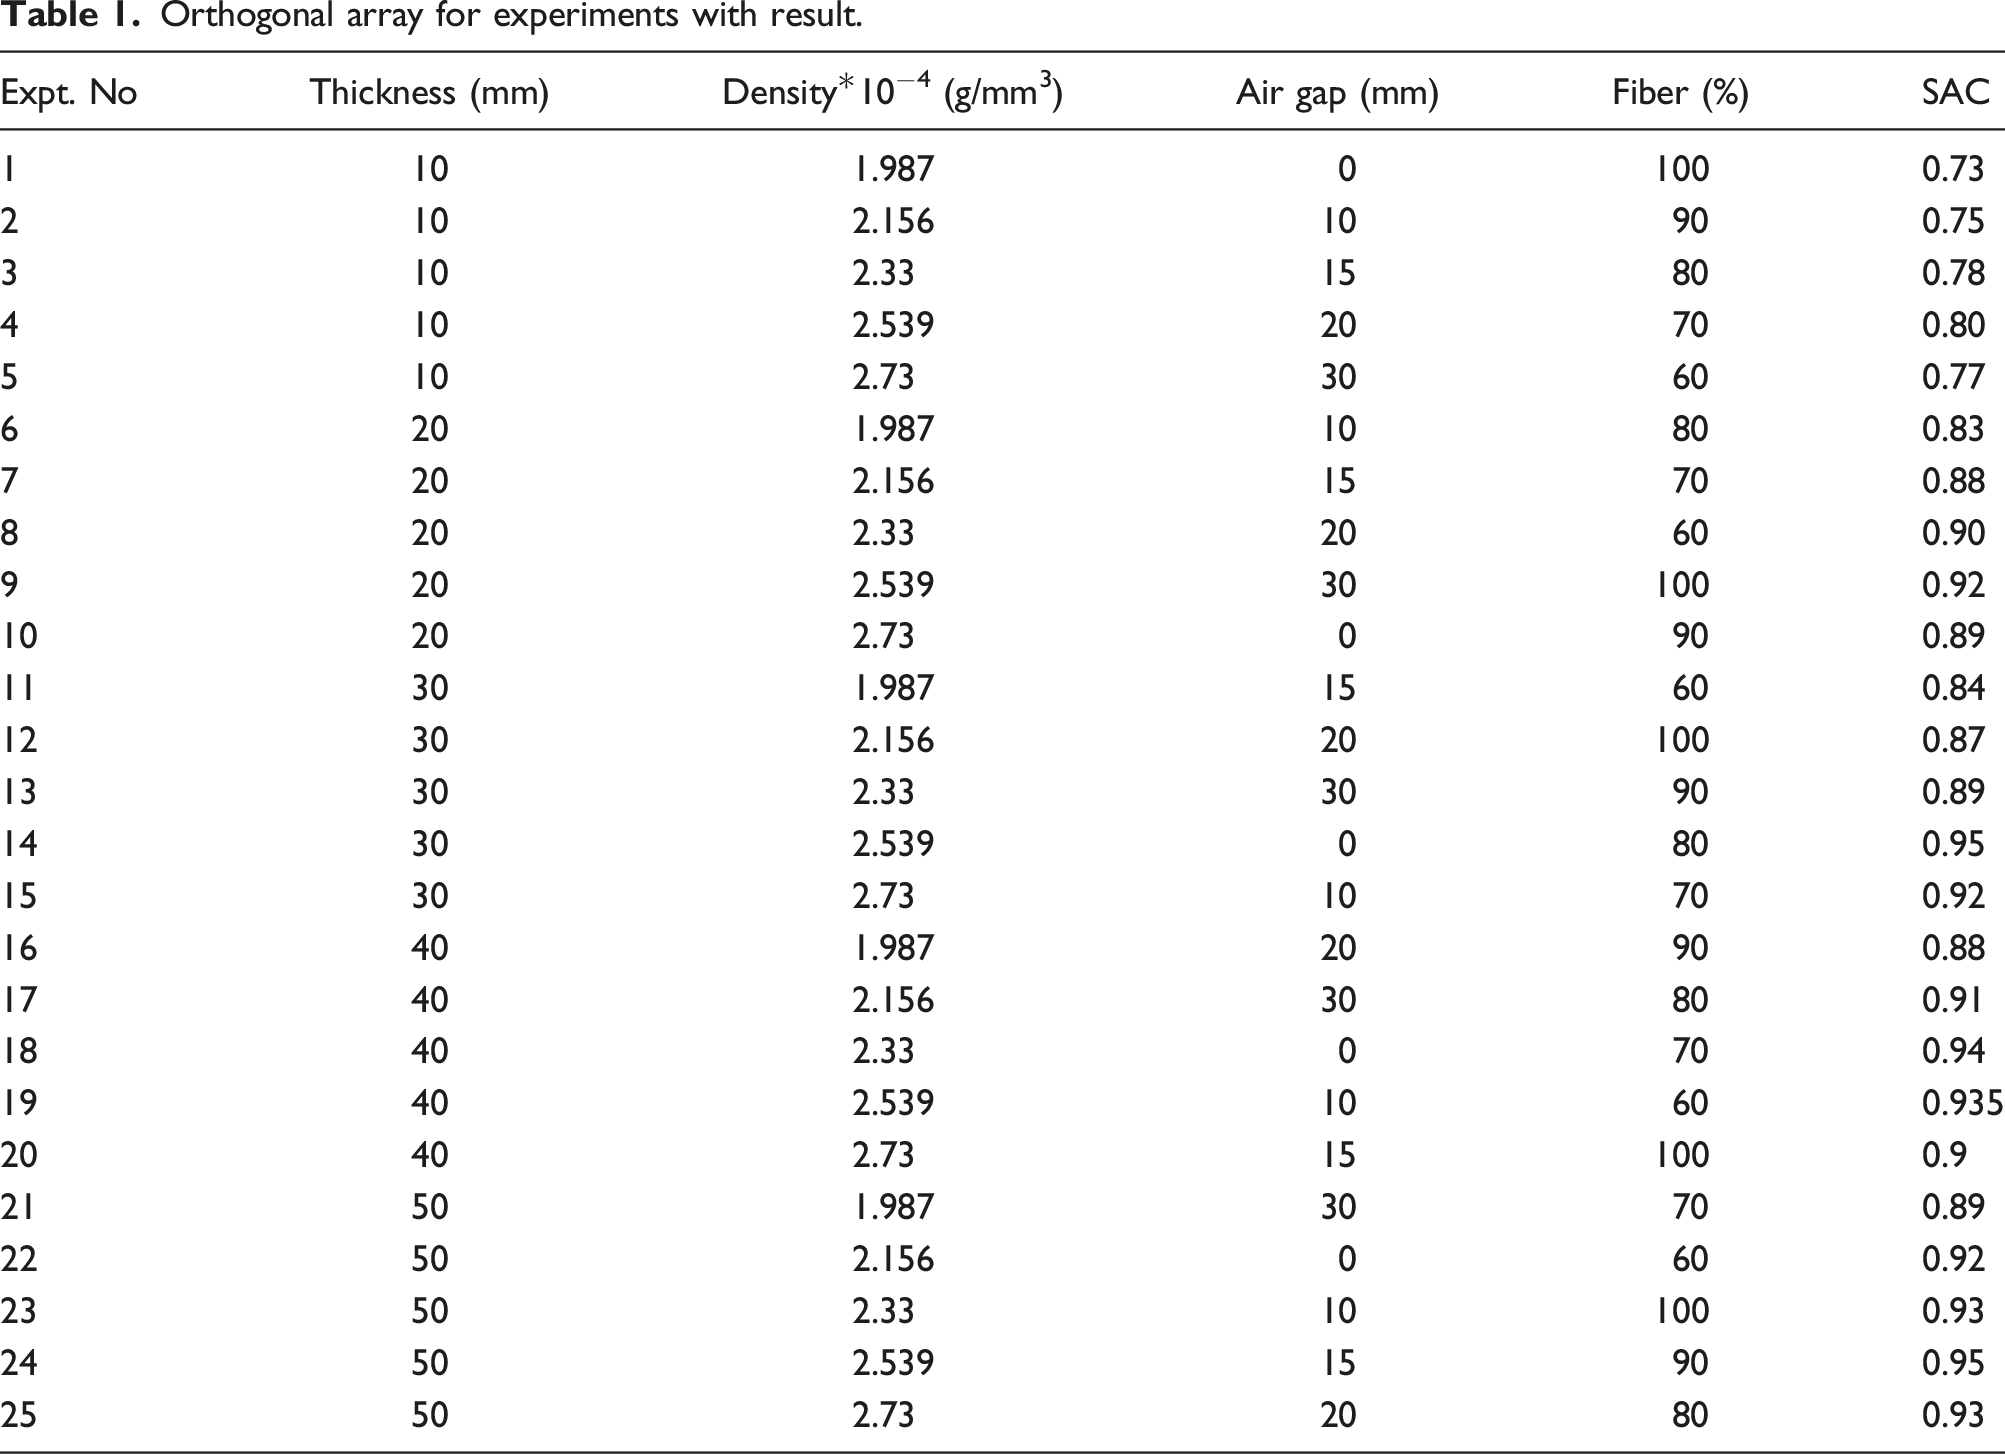
The values of response variable i.e. sound absorption coefficient (SAC) are given in Table 1. Sound absorption coefficients are measured by using impedance tube set up as per ISO 10534–2 and ASTM E1050-98 standard. Taguchi array is enforced to reveal optimum process parameter combination. In the present study, the sound absorbing coefficient is higher the better to enhance sound absorption property.
Effect of parameters of sound absorption coefficient
Sound absorption coefficient for all 25 sets of experiment is measured by using impedance tube set up and results are shown in Table 1. Graph of experiment 4, 8, 14 and 19 are plotted in Figure 3(c).
It was realized that sound absorption coefficient increases with increment in thickness. This is as a result of long path for sound waves to travel which causes more friction and loss of sound energy.13,16
It is noticed that sound absorption coefficient value increased with rise in density up to certain extend and then again started to decrease. Here we can observe as percentage of resin increased density is increased. Initially too low density means more porous material and sound waves easily passes through material with lack of friction and resulting low sound absorption. As density increases more friction and sound absorption coefficient is increasing. When resin quantity is increased to larger extend then too dense material exhibits low sound absorption capacity because some extend of porosity is required so sound waves can penetrate through material. As a result of that too dense material shows decreasing sound absorption coefficient.
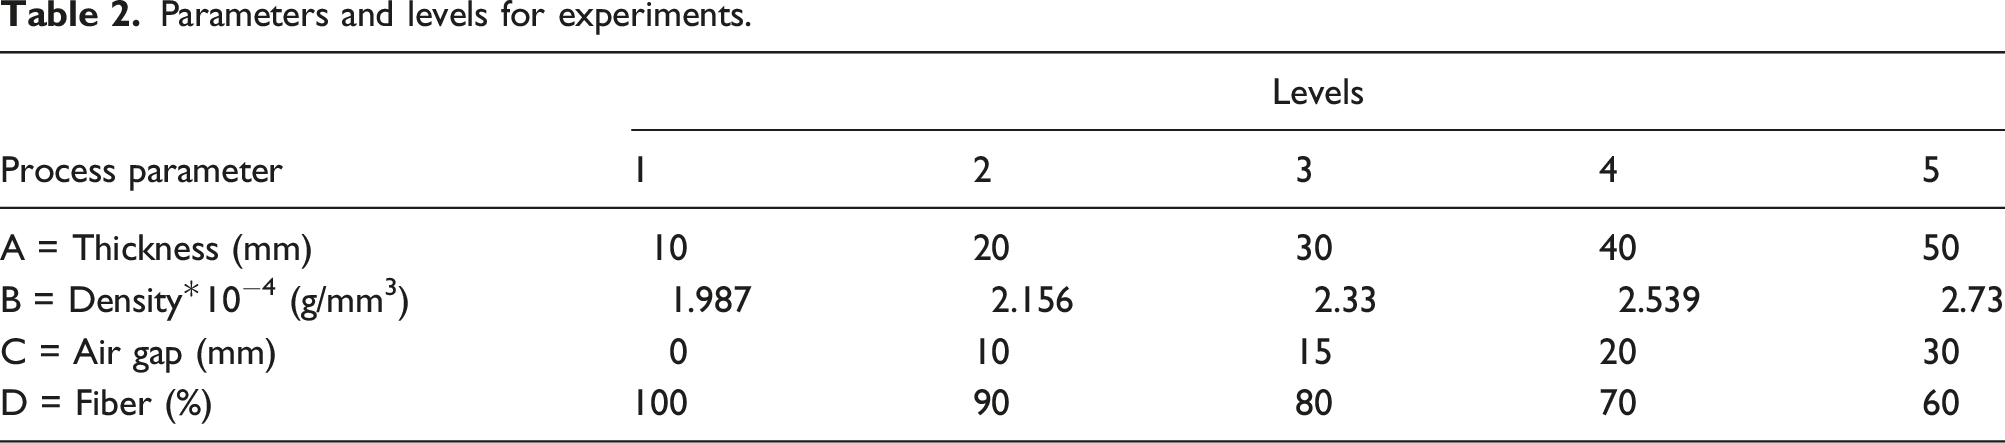
Parameters and levels for experiments.
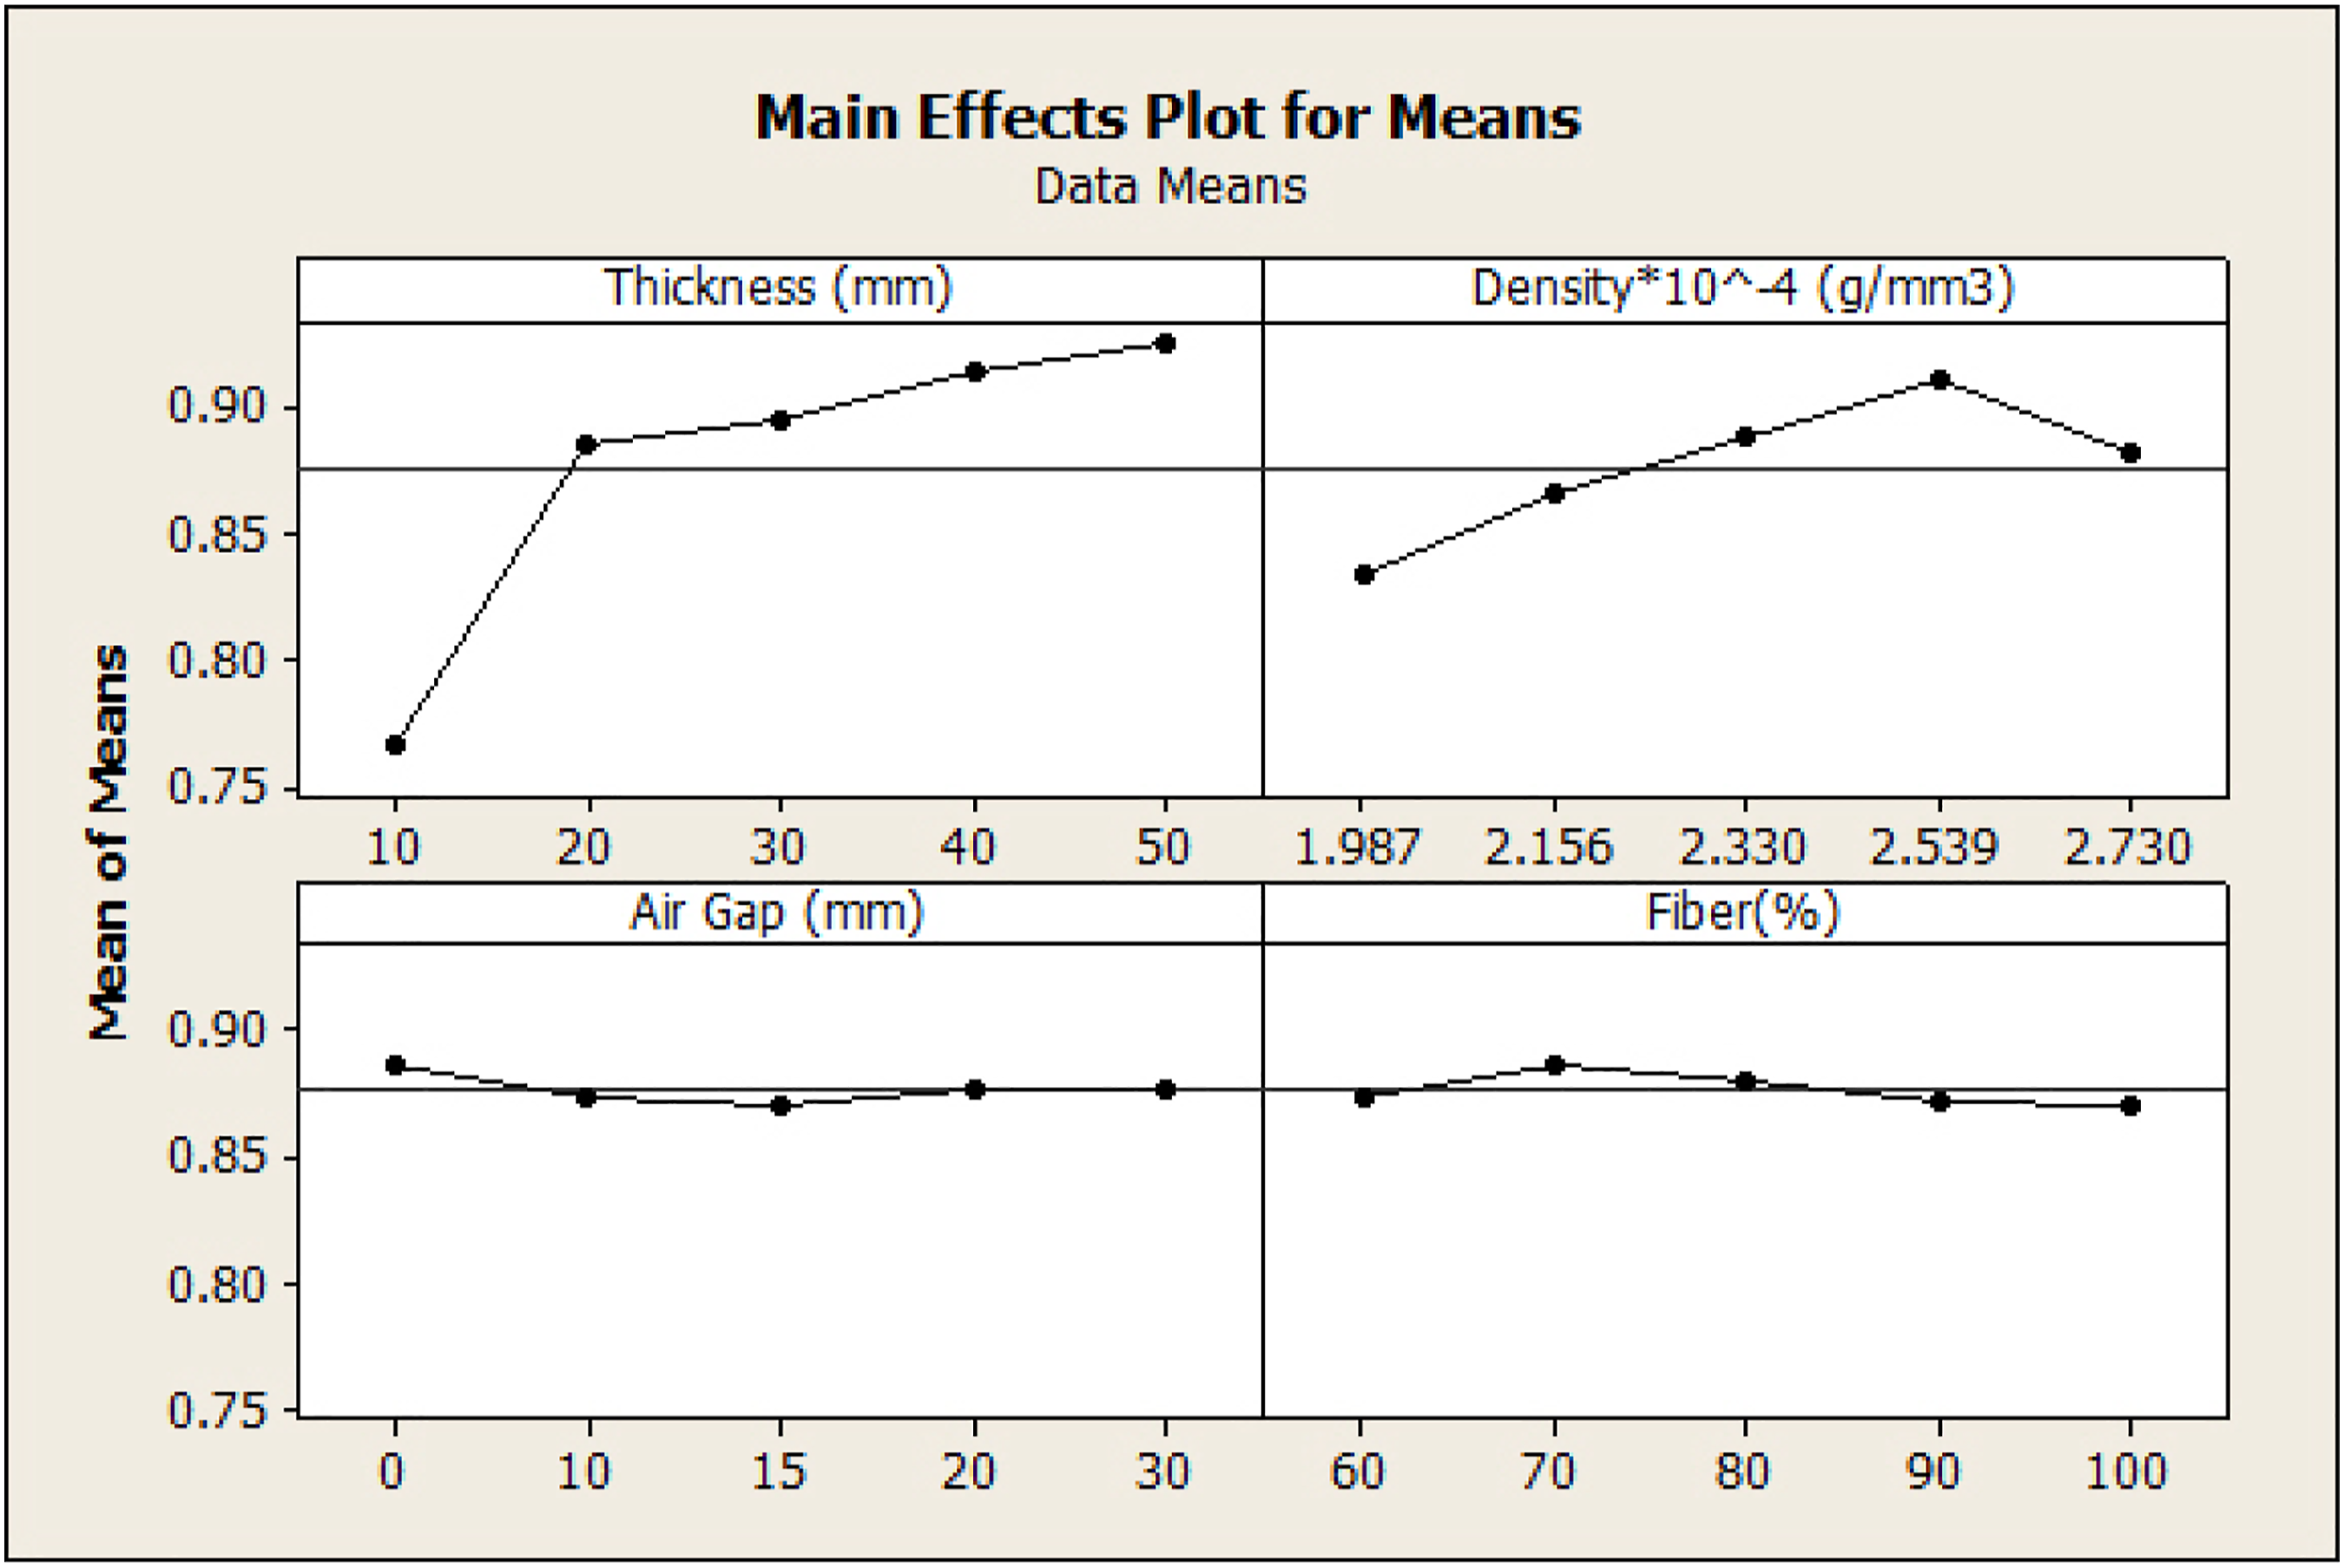
Main effects plot for means.
Selection of optimum parameters
Mean S/N ratio response table for SAC.
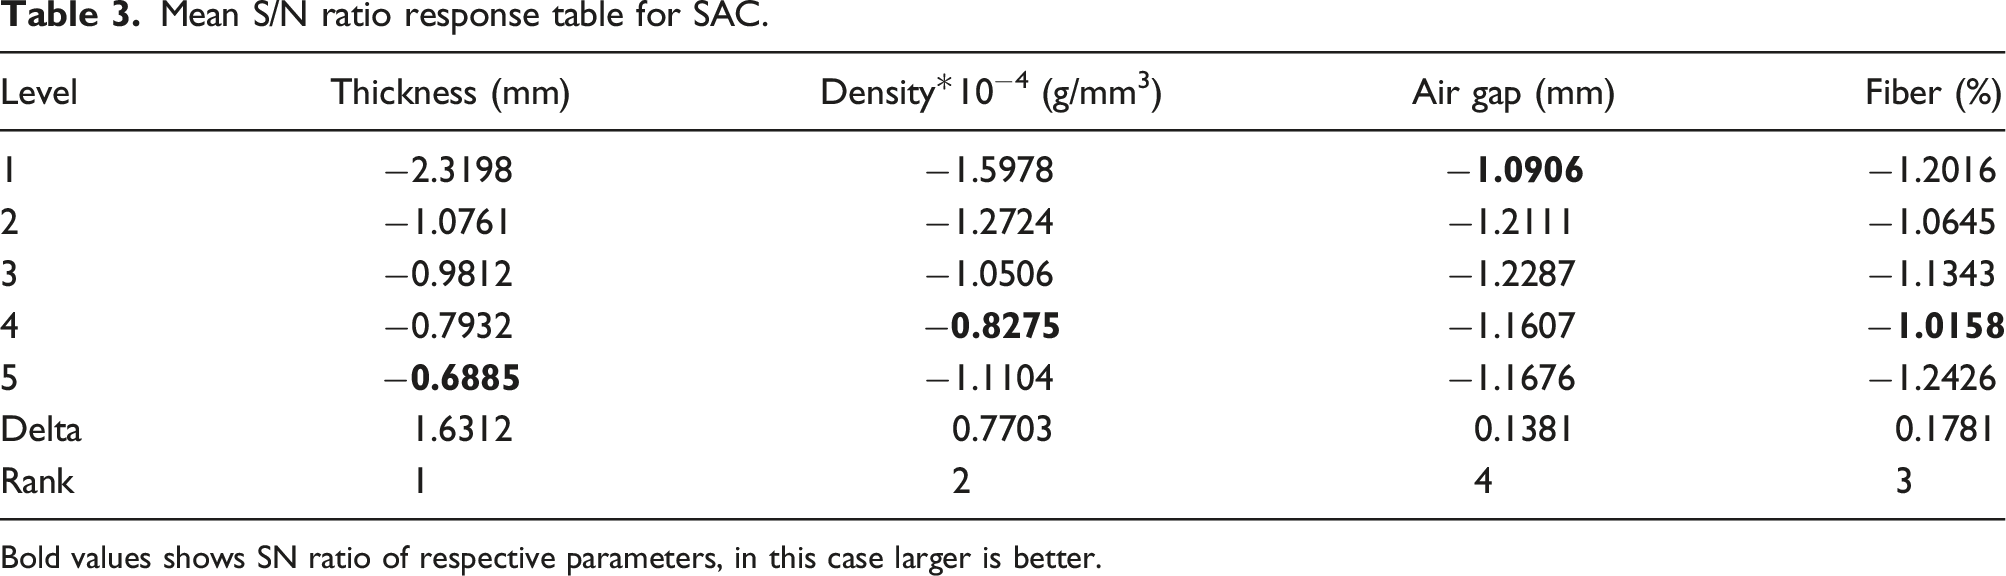
Bold values shows SN ratio of respective parameters, in this case larger is better.

Mean S/N ratio plot for Sound Absorption Coefficient (SAC).

Sound absorption coefficient of optimum parameters.
Confirmation test results for SAC.

Based on Table 1, experiment number 24 shows highest sound absorption coefficient with thickness = 50 mm, density = 0.0002539 g/mm3, air gap = 15 mm and fiber percentage = 90%. Now confirmation experiments were conducted for optimum levels obtained from Taguchi analysis and result of sound absorption coefficient. When experiment were conducted by considering optimum levels of parameters (thickness at 50 mm, density at 0.0002539 g/mm3, air gap at 0 mm and fiber percentage at 70%) sound absorption coefficient obtained is 0.98 which is higher than previous sound absorption coefficient 0.95 shown in Table 4.
Below is Response Table for Signal to Noise Ratios (Larger is better)
ANOVA for SAC
ANOVA for Sound absorption Coefficient (SAC).

S = 0.0390681 R-sq = 69.5% R-Sq (adj) = 63.4%. Bold value presents the p-value for respective parameter. p value less than 0.05 shows that parameter is significant.
Modelling
In current investigation, linear regression modeling in Minitab software has been used to develop predictive mathematical equation for sound absorption coefficient (SAC) as a function of thickness, density, air gap and fiber percentage. The equation obtained from regression analysis is shown below equation (1).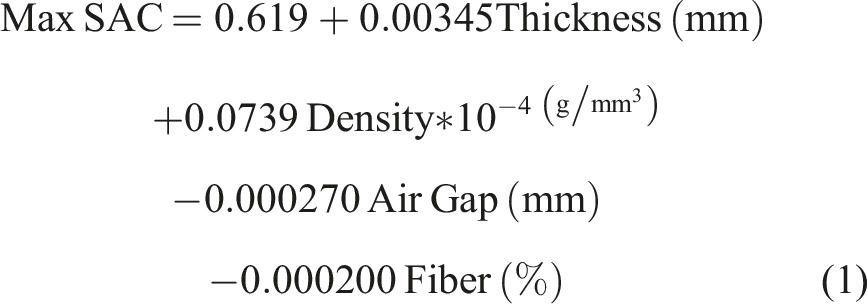
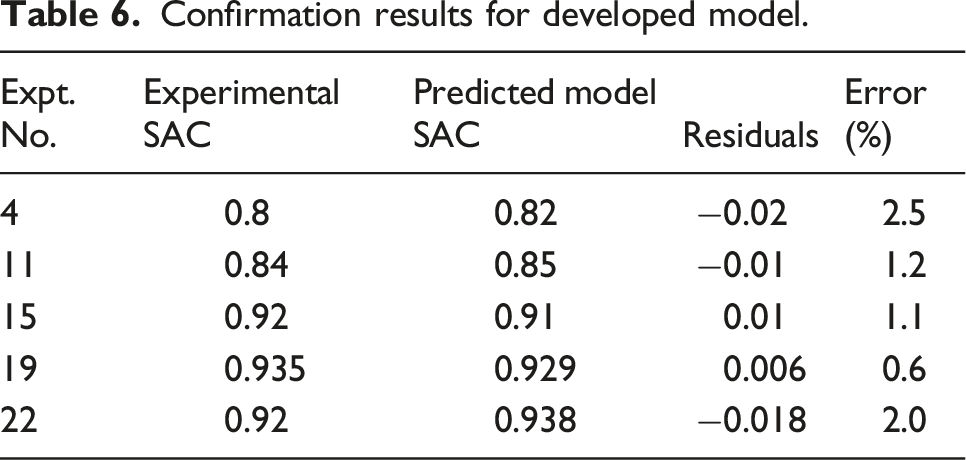
Confirmation results for developed model.

Normal probability plot for the residuals of sound absorption coefficient.
Conclusion
The subsequent conclusion are listed down from the investigation - Optimization of different parameters like thickness, density, fiber percentage (composition) and air gap were presented in this study. Also Scanning Electron Microscope (SEM) images of sample are also shown to reveal the internal microstructure of material. By using DOE and Taguchi method Signal to Noise ratio were calculated and subsequently optimum parameters for sound absorption coefficient are found by using Taguchi optimization method. Confirmation test were conducted to validate the results. It was observed that optimum parameters obtained by using Taguchi method improved the sound absorption coefficient from 0.95 to 0.98 at 2900 HZ. - In this study it is concluded that thickness and density are significant parameters as the P- value was less than 0.05. Air gap parameter is more useful to enhance sound absorption coefficient at lower frequency range. - In this study mathematical model for sound absorption coefficient was developed. Developed mathematical model by using regression analysis shows close agreement with experimental results. Hence the developed model can be used for proper selection of parameters. Confirmation test were conducted to check validity of mathematical model.
Footnotes
Declaration of conflicting interests
The author(s) declared no potential conflicts of interest with respect to the research, authorship, and/or publication of this article.
Funding
The author(s) received no financial support for the research, authorship, and/or publication of this article.