




Abstract
The research on vehicle sound quality is an emerging and highly promising field. This paper proposes a solution for sound quality improvement based on sensitivity analysis of psycho-acoustic parameters, in which the main acoustic techniques involved include noise signal acquisition, subjective and objective evaluations, sound quality modelling and prediction, parameter sensitivity and spectral analysis, and fuzzy comprehensive evaluation. In addition, taking 64 noise samples of electric bus as an application case, the presented sound quality analysis steps are implemented successively, and the obtained test results of improving the whole vehicle sound quality verify the feasibility and effectiveness of the proposed scheme.
Introduction
As the new energy vehicle, electric bus has a significant emission reduction effect and rapidly occupies a large market share in China. With the continuous improvement of health awareness, people expect bus to have good acoustic characteristics, in order to meet the constantly promoting demand of auditory comfort. Related studies show that the traditional A-weighted sound pressure level cannot reflect the subjective perception of human ear in multiple dimensions.1,2 However, what users feel most directly is sound quality, and the excellent interior sound environment has become the key factor affecting the purchase of vehicle products. 3 Therefore, the study of sound quality inside electric bus has gradually become an emerging research field, which has important practical significance.
Relevant studies have indicated that, due to the replacement of traditional engine by driving motor, the internal noise of electric bus is more prominent in the absence of engine masking effect, and many types of noise that are not easily detected in fuel vehicles, such as air conditioning noise, electromagnetic noise, tire noise and mechanism transmission abnormal noise, etc.4,5 The contribution of these noise sources to the vehicle interior sound environment under random excitations fluctuates greatly. In particular, the electromagnetic noise of motor has the characteristics of high current, frequency conversion, speed regulation and high magnetic density, and its characteristic order is higher, mainly composed of single frequency or less frequency components, which is often in the noise frequency band sensitive to human ear. Consequently, the subjective feeling is a kind of harsh noise, which has a significant negative impact on vehicle acoustic comfort. 6 Therefore, improving the interior sound quality is an inevitable and urgent trend in the development of electric buses. Current techniques mainly focus on the relationship between objective parameters and spectral components, and propose measures to improve sound quality, and the core of those techniques is to establish accurate mathematical mapping model between subjective evaluation index and objective psycho-acoustic parameters.7–9 In this paper, taking vehicle acoustic comfort as a subjective evaluation index, the commonly used linear sound pressure level (LSPL), A-weighted sound pressure level (ASPL), loudness, sharpness, roughness, fluctuation strength (FS), articulation index (AI), impulsiveness and relative approach (RA) are selected as psycho-acoustic parameters based on the objective evaluation researches of electric vehicle.10–13 Then, the sensitivity of objective parameters to acoustic comfort is analyzed through the prediction model established by gradient boosting decision tree (GBDT) with satisfactory fitting degree, so as to explore strategies for improving electric bus sound quality.
Establish database based on subjective and objective evaluations
Noise sample collection
Eight electric buses were selected and randomly numbered as A to H; according to permissible levels and test methods of bus internal noise (GB/T25982-2010), on-air and off-air conditioning were selected for two kinds of working condition, the driving and rear seat were two measuring positions displayed in Figure 1, and 30 km/h and 50 km/h were two constant speeds. During the test, all vehicles in turn were run individually on a professional runway and after stabilization, internal noise signals were collected using a handheld portable Squadriga II binaural acquisition system and a head-mounted BHS II in the same positions and operating conditions, as shown in Figure 2, and ultimately a total of 64 internal noise samples were obtained and randomly ranked from 1 to 64.
11
Distribution of two measuring points. Test scenes and acquisition instruments.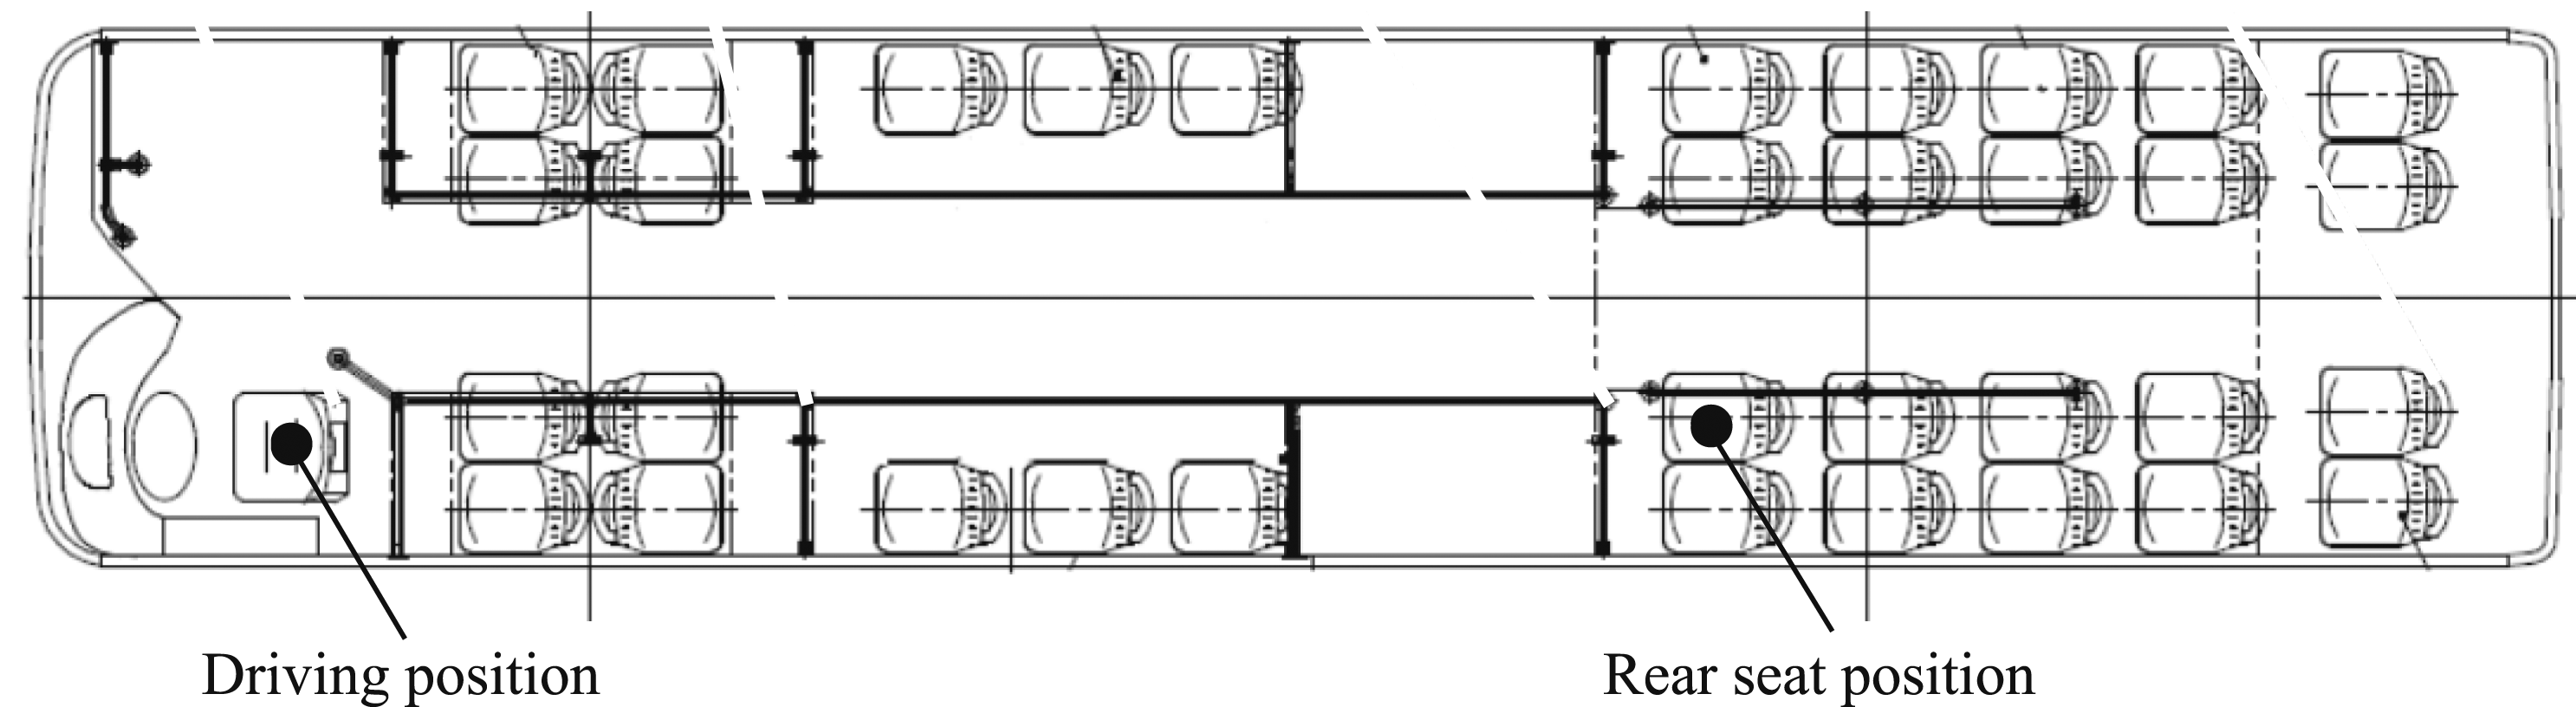

Calculation of psycho-acoustic parameters
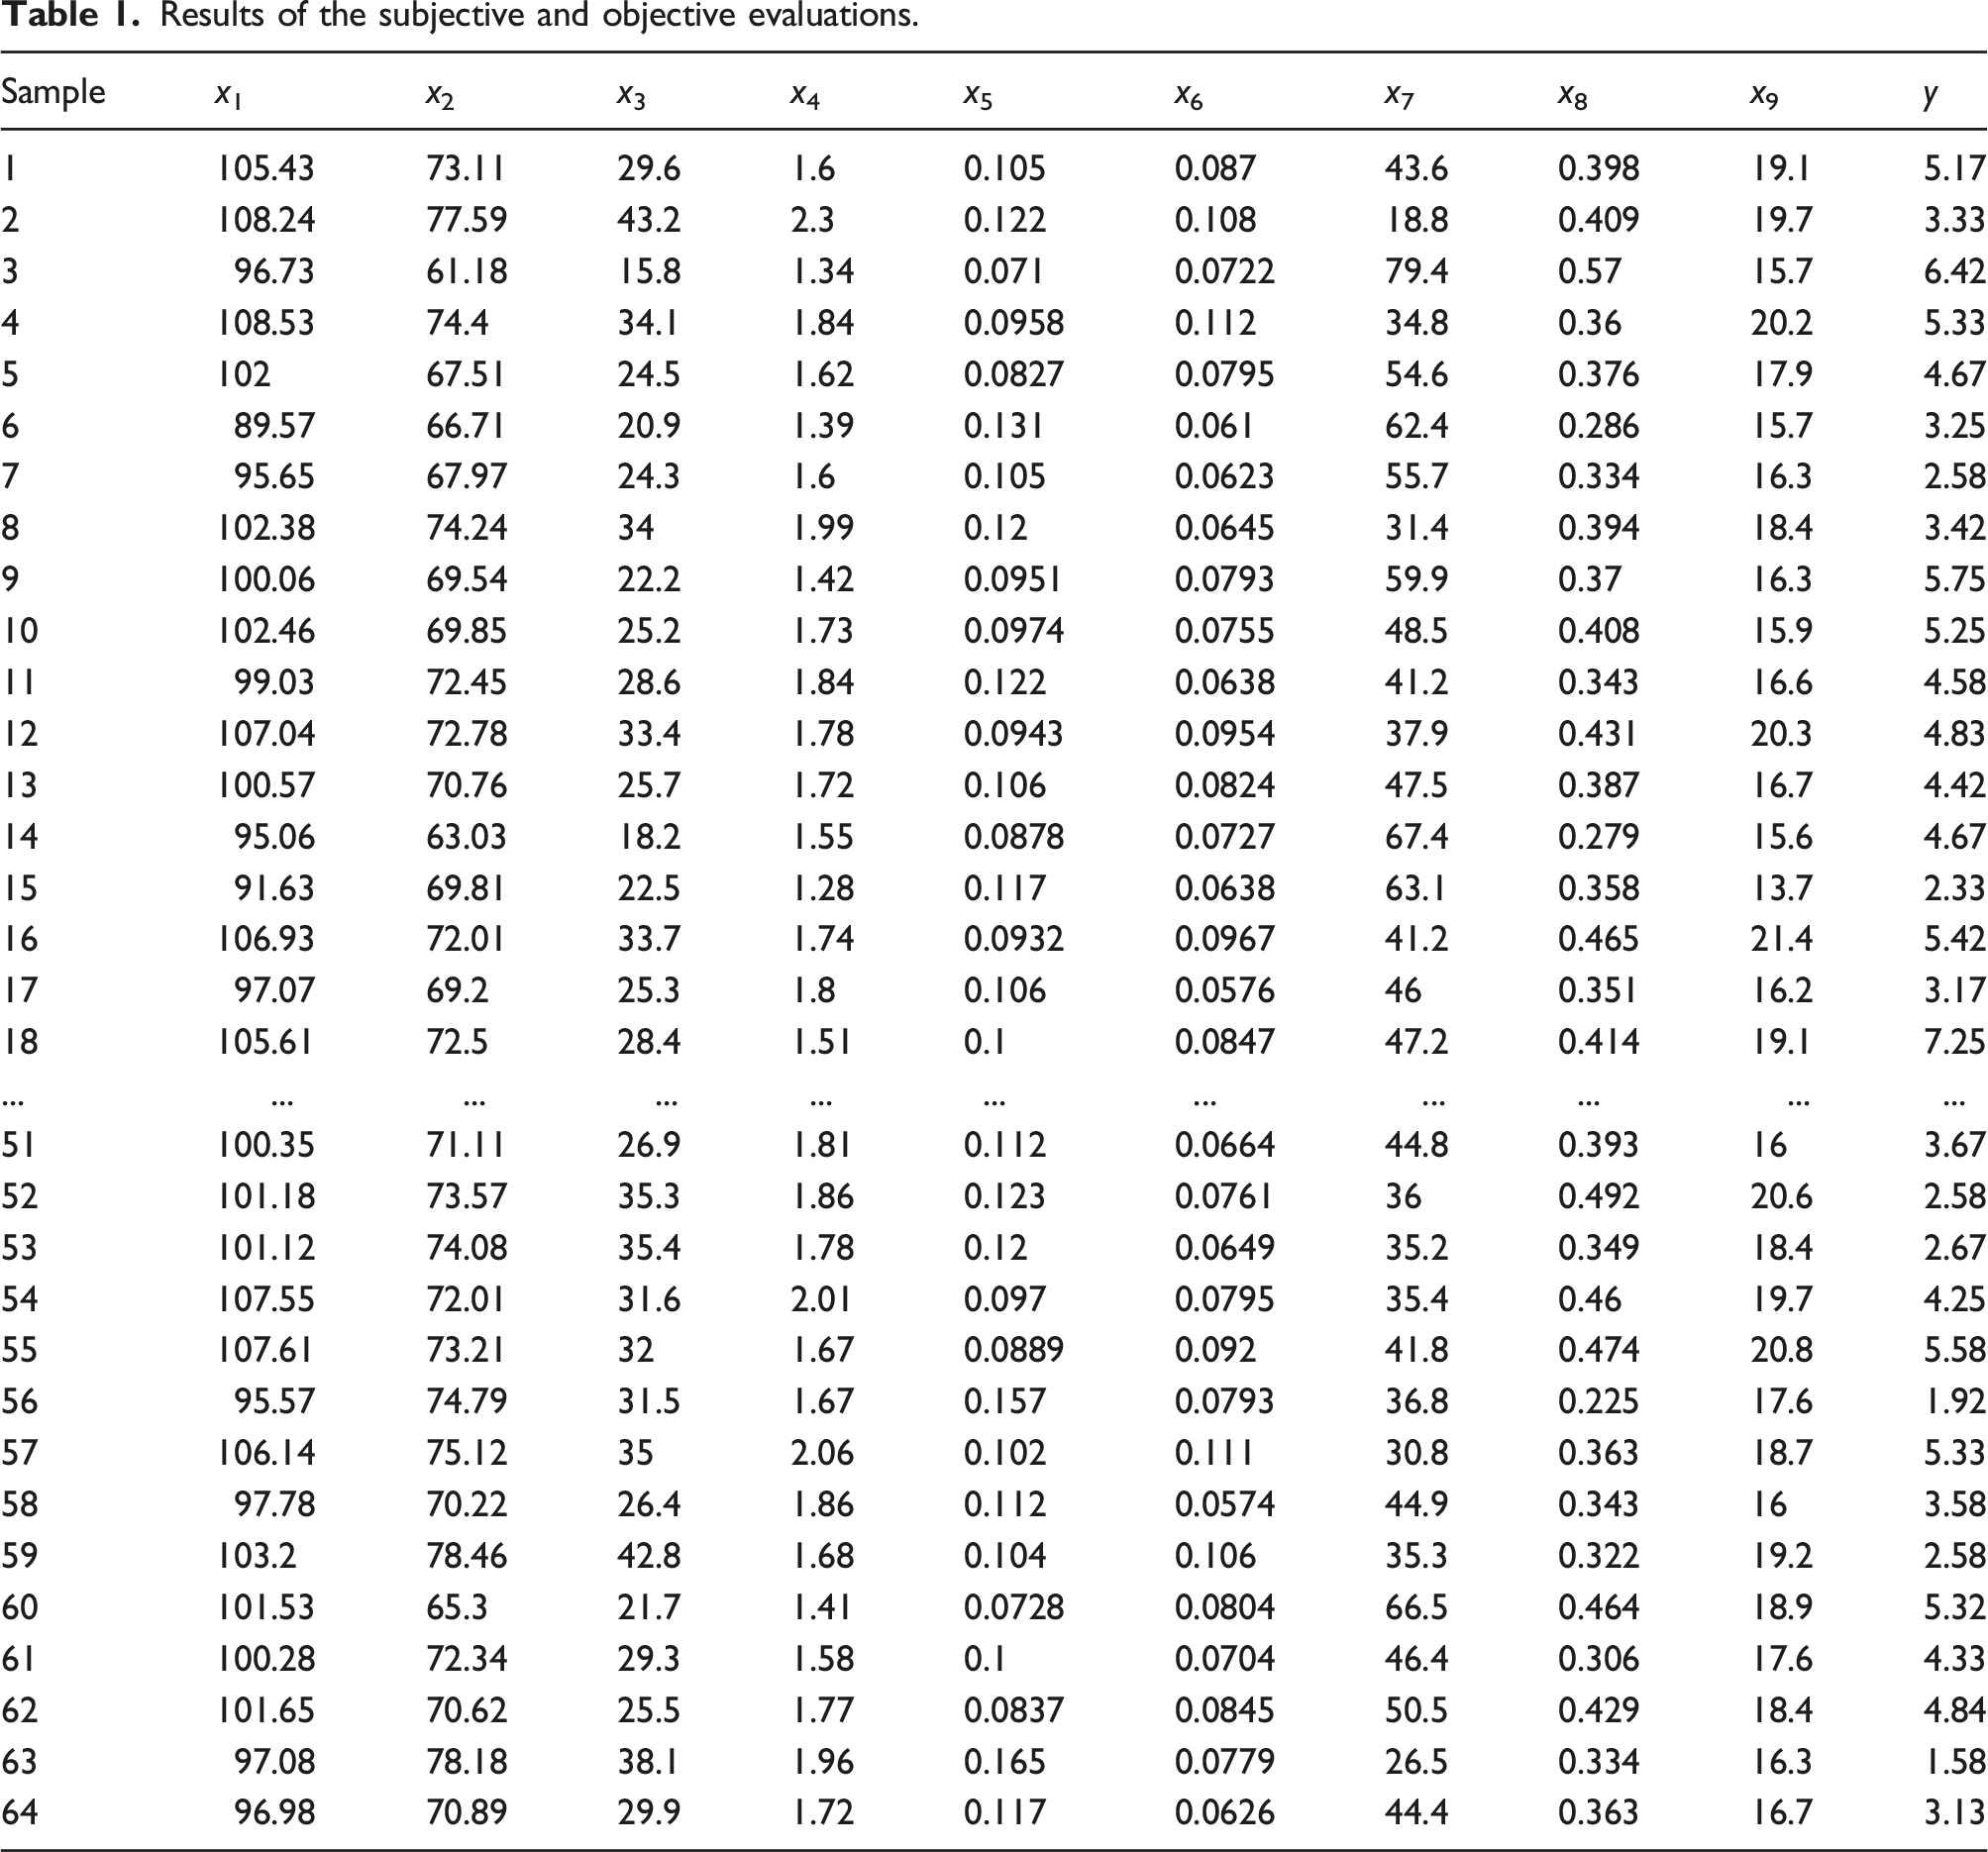
Results of the subjective and objective evaluations.
Subjective evaluation test
A jury composed of NVH engineers, drivers and experts was organized to conduct a subjective evaluation test on 64 noise samples of 5 s duration each. The acoustic comfort was divided into 10 levels using rank score comparison (RSC) method.2,11,14 In particular, to ensure the reliability of evaluation data, Spearman correlation coefficient and K-mean clustering method were used to statistically analyze the results of all evaluators, and then the comfort levels from effective evaluators were arithmetically averaged. Consequently, the acoustic comfort values of all noise samples were obtained, and their results were y listed in Table 1.
Sensitivity analysis of psycho-acoustic parameters based on GBDT
Basic theory of GBDT
The core of this algorithm, first proposed by Friedman, is to use loss function’s negative gradient as a residual approximation in the current model to fit a regression tree.15–17 Assuming that the sample set is (1) Initialize a weak learner f0(x), which minimizes the loss function L(y
i
,γ), i.e.

Usually, the mean square error is employed as the loss function in boosting process, which is mathematically expressed as (2) Iterative training m = 1, 2, ..., M trees. a) For each sample i = 1, 2, ..., N, calculate the negative gradient as b) Take the negative gradient r
im
as a new sample value, (x
i
, r
im
) as the next regression tree’s training data, and fit the new tree, whose leaf node region is R
jm
, j=1, 2, ..., J
m
, where J
m
is the number of leaf nodes. c) For each leaf node in the regression tree, its output value is calculated as


Update the strong learner by the following equation (3) Finally, output the final learner

Therefore, the weak learner’s residual error is constantly fitted to improve the model regression effect, and the predicted result gradually approaches the real value.
Acoustic comfort modeling
The predicted level of acoustic comfort.
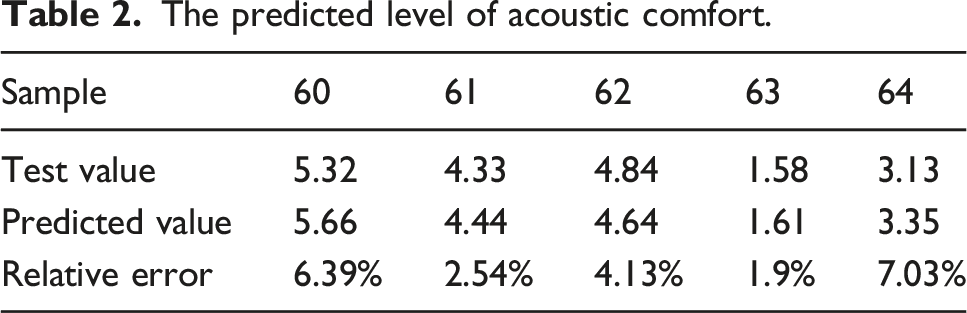
As can be seen from Table 2, on the basis of various training, the mathematical model established has high prediction accuracy, with the highest relative error of 7.03% and the average relative error of 4.4%, which is within the allowable range. This model provides a reliable technical means for subjective acoustic comfort prediction of the targeted prototype bus after the improvement test. Meanwhile, the influence of independent variables on the dependent variable in the model is illustrated in Figure 3. Significance analysis of objective parameters on acoustic comfort.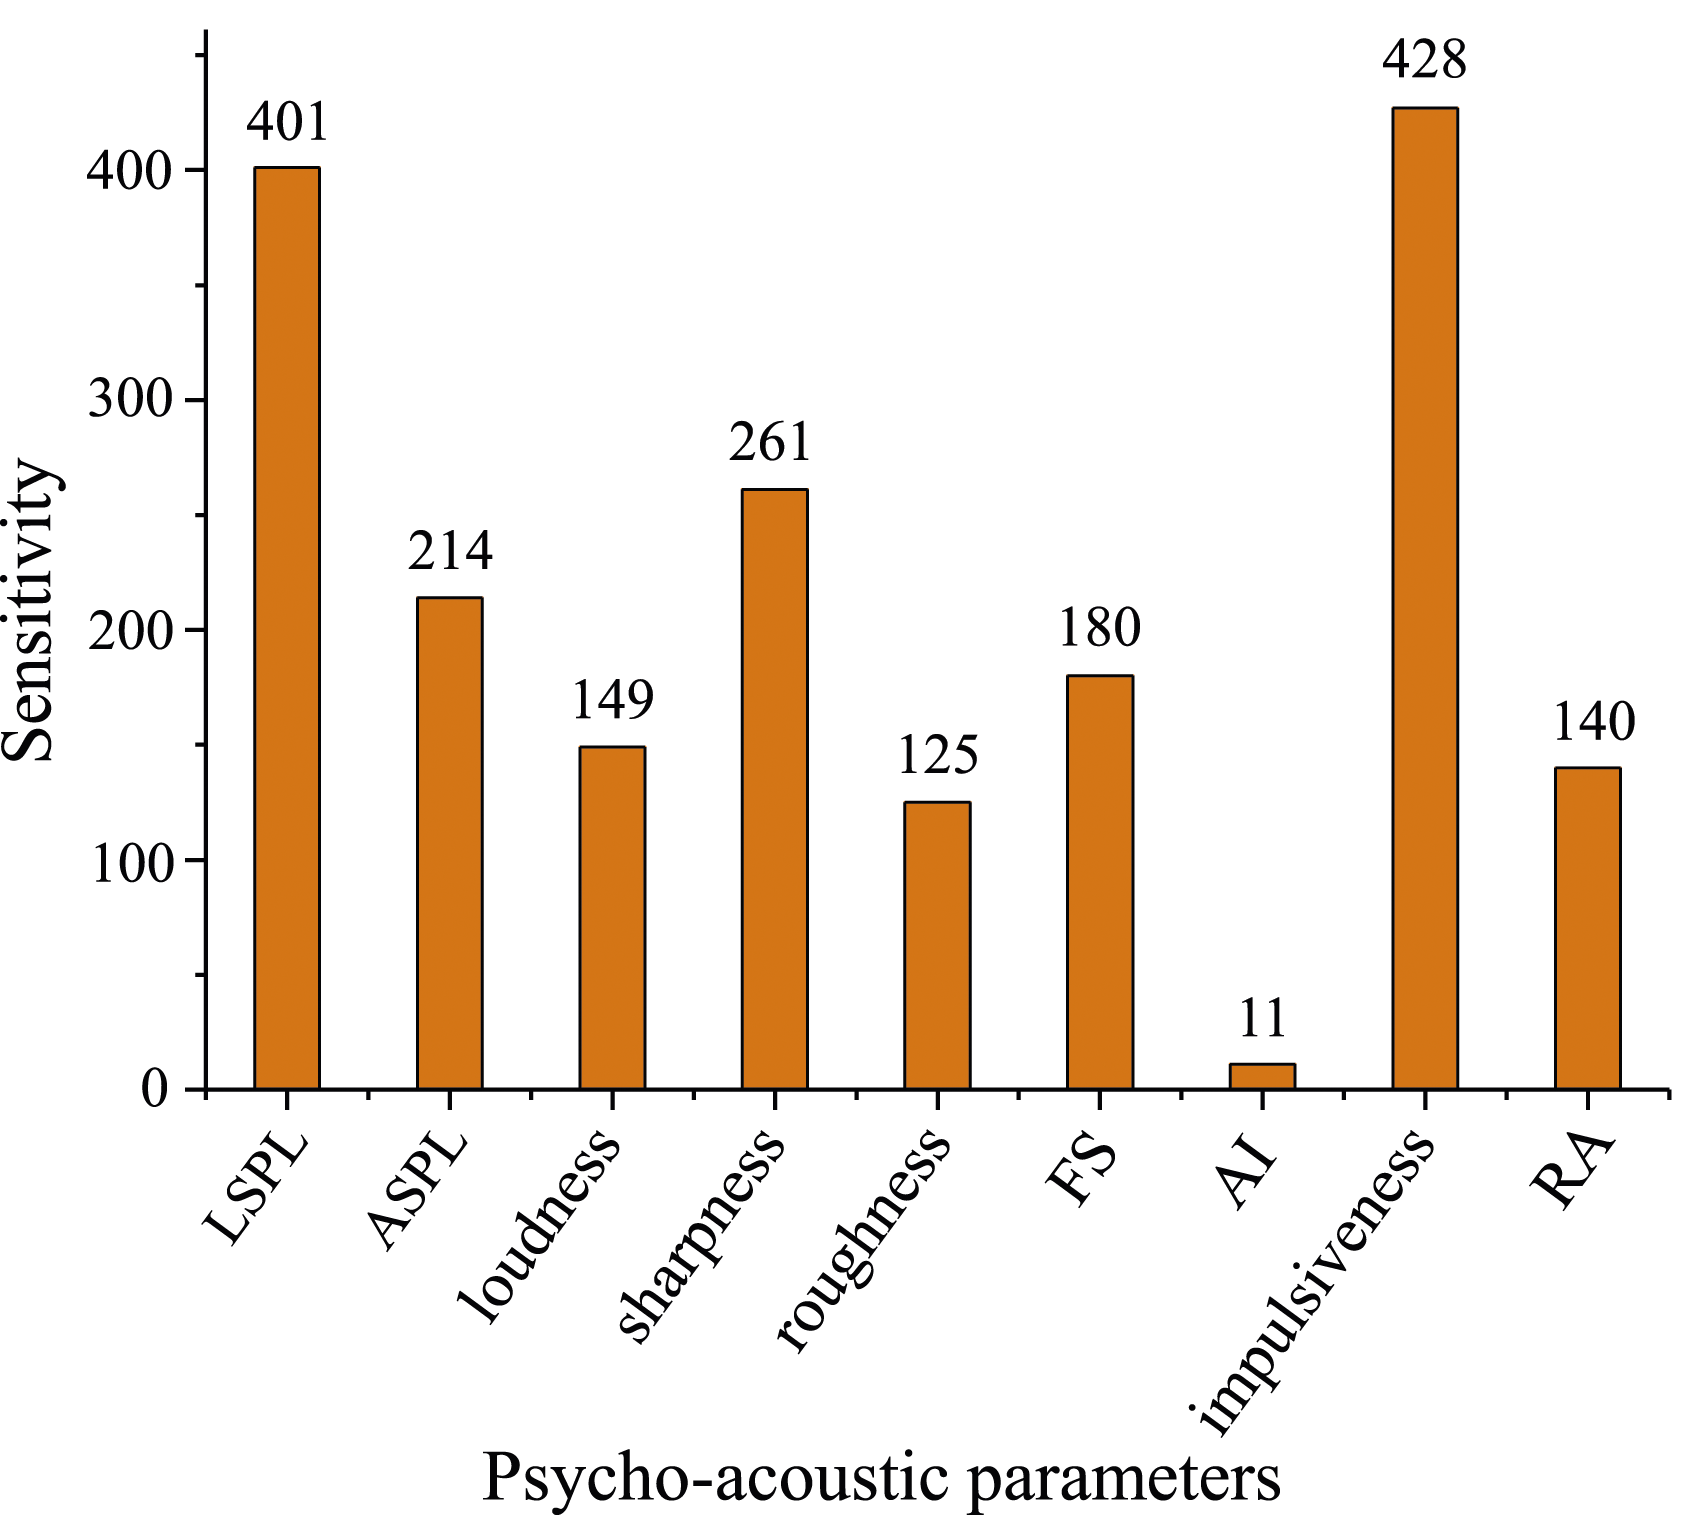
Figure 3 indicates that for the noise samples of these electric buses, the most significant psycho-acoustic objective parameter affecting acoustic comfort is impulsiveness (x8), which is mainly used to describe the subjective feeling of human ear caused by rapid and high-amplitude signal change; and the second is LSPL (x1). The next step is to study the relationship between significant parameters and noise spectrum.
Vehicle sound quality improvement test and results
Improved test and noise signal re-acquisition
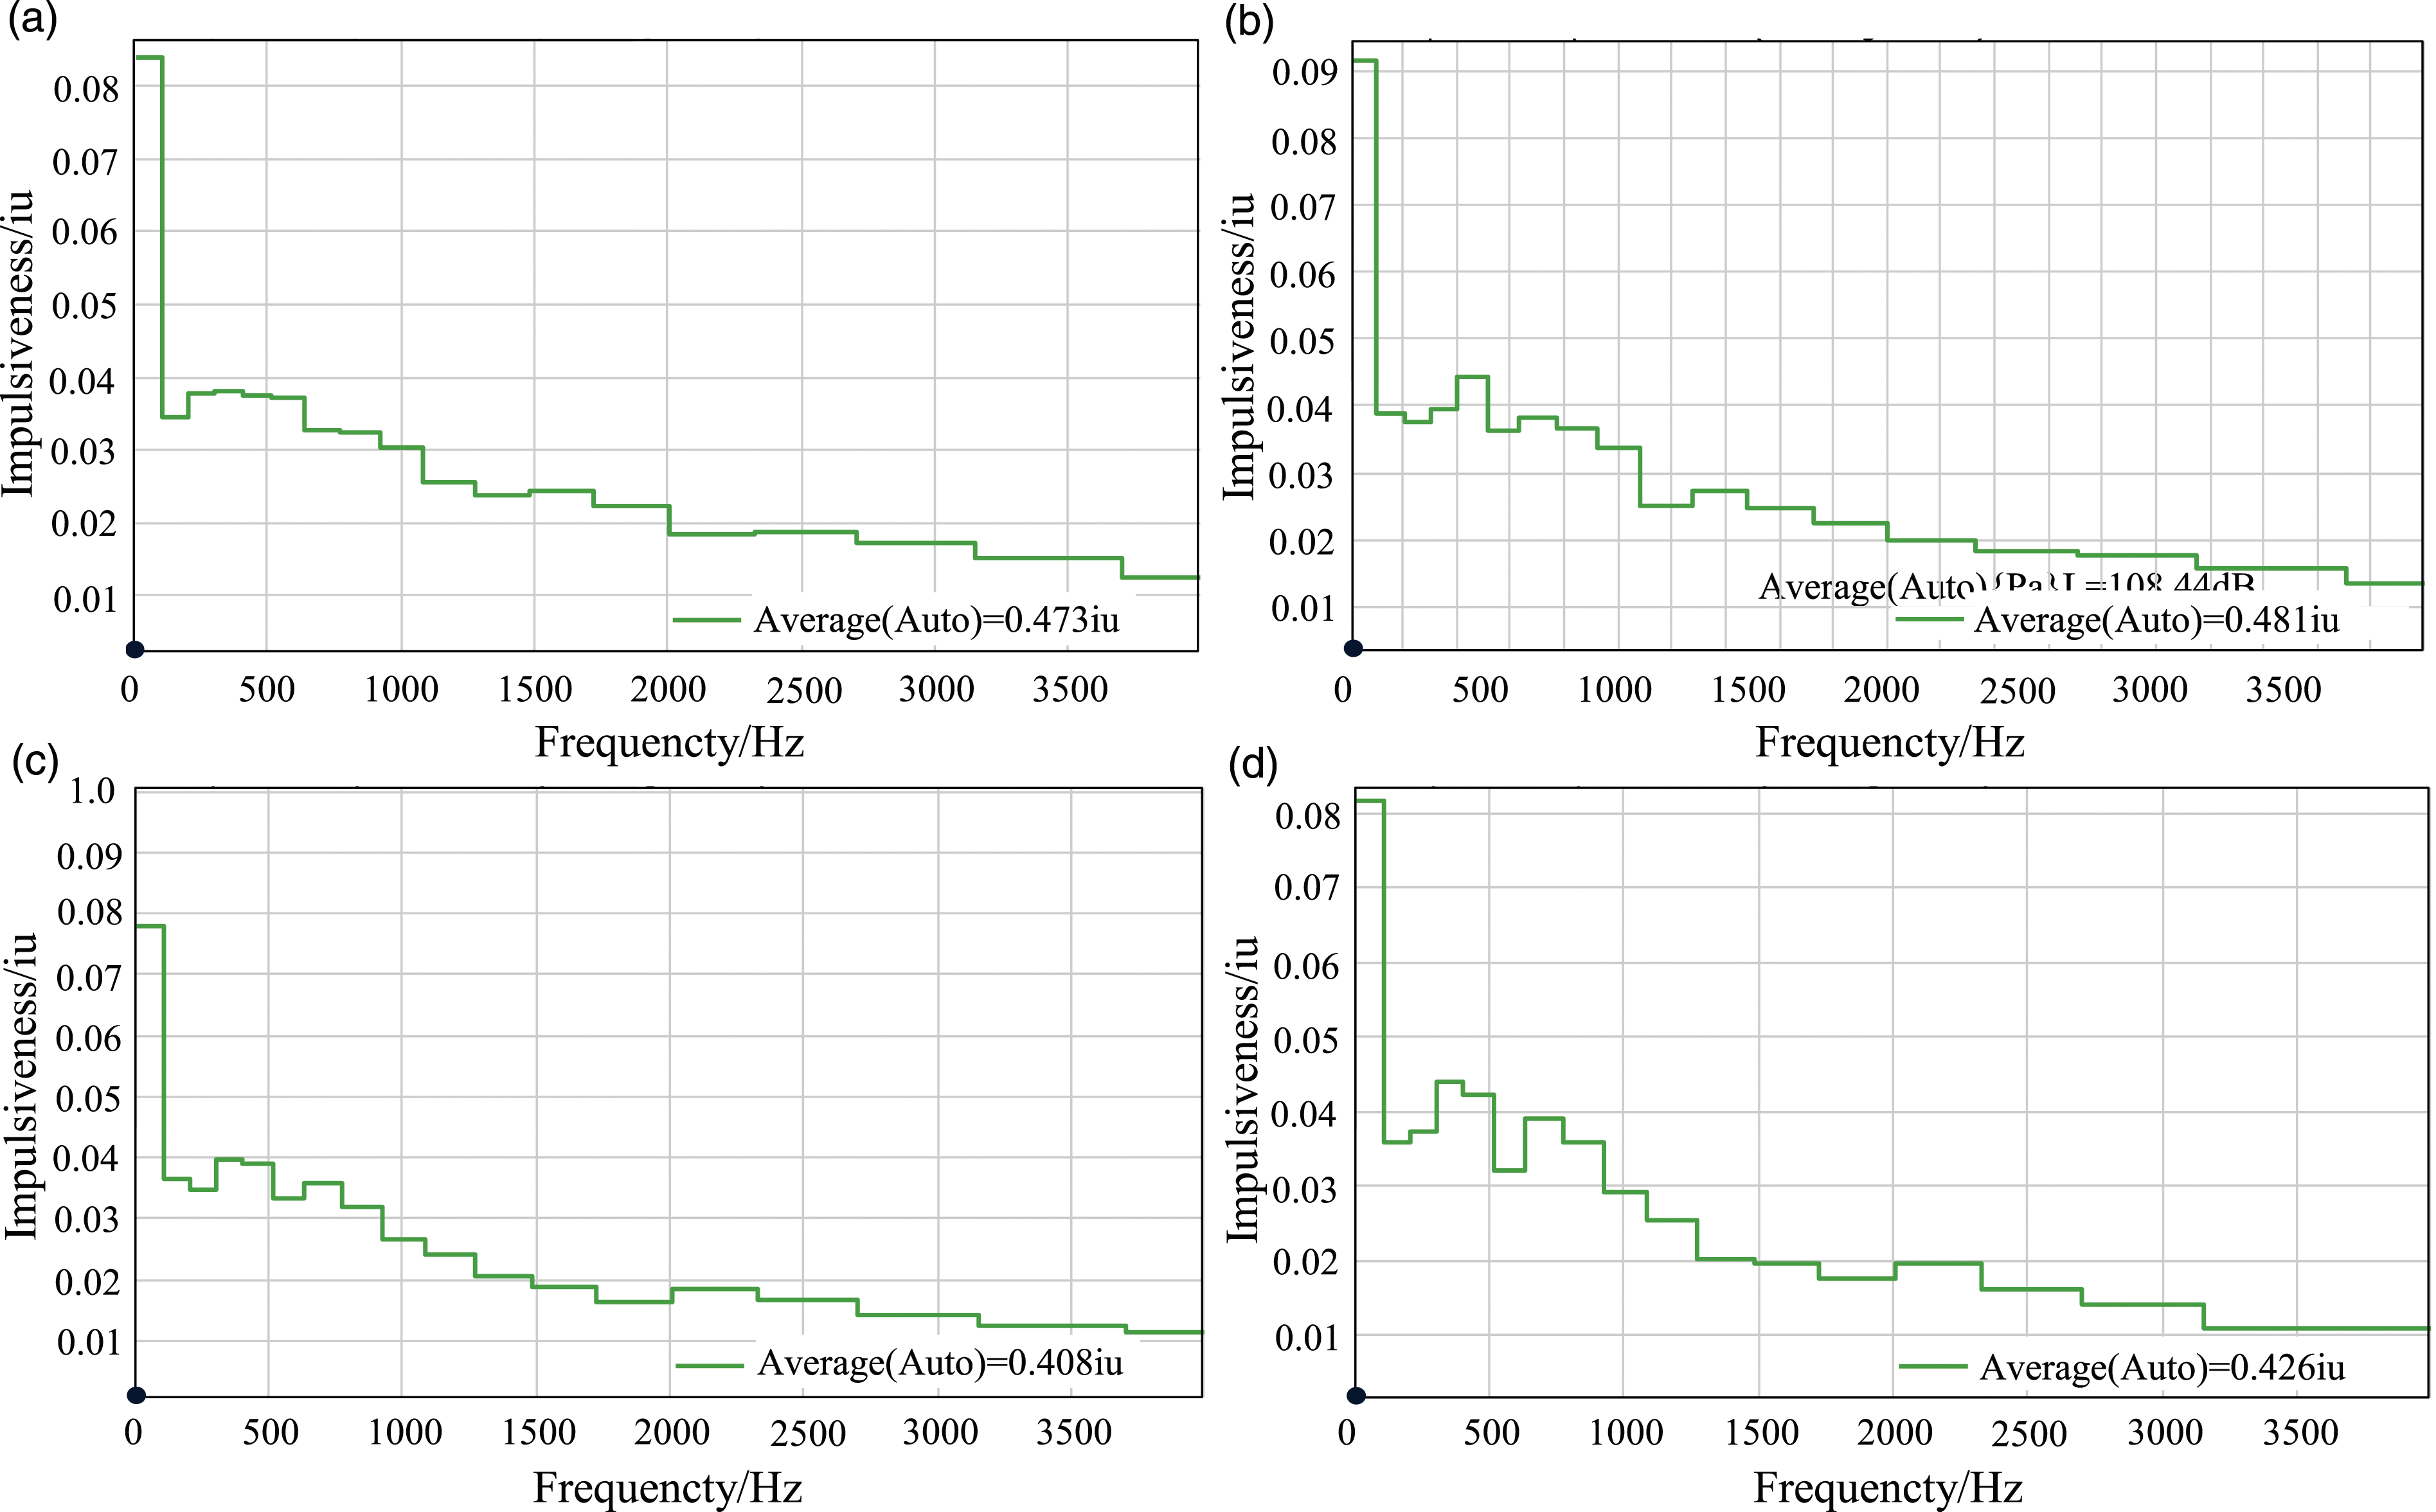
Taking bus C as the targeted prototype vehicle for improvement, through on-site noise testing, it is obvious that the abnormal noise inside the bus mainly comes from the iron leather box behind the driver’s seat. Figures 4 and 5 show that the influence of LSPL and impulsiveness on interior acoustic comfort under different working conditions and measuring points is mainly concentrated within the low frequency range of 100 Hz, where (a) to (d) correspond to noise samples from sample bus C with numbers of 24, 19, 10 and 26 listed in Table 1. After the passive control measures such as removing the abnormal noise structure were adopted, recollect the noise signals and calculate psycho-acoustic objective parameters, as shown in Figures 6 and 7 and Table 3. The relationship between LSPL and frequency spectrum for the original bus C (limited to length, only the first four are shown, and the same below). The relationship between impulsiveness and frequency spectrum for the original bus C. The relationship between LSPL and frequency spectrum for the improved bus C. The relationship between impulsiveness and frequency spectrum for the improved bus C. Psycho-acoustic parameters of improved noise samples.

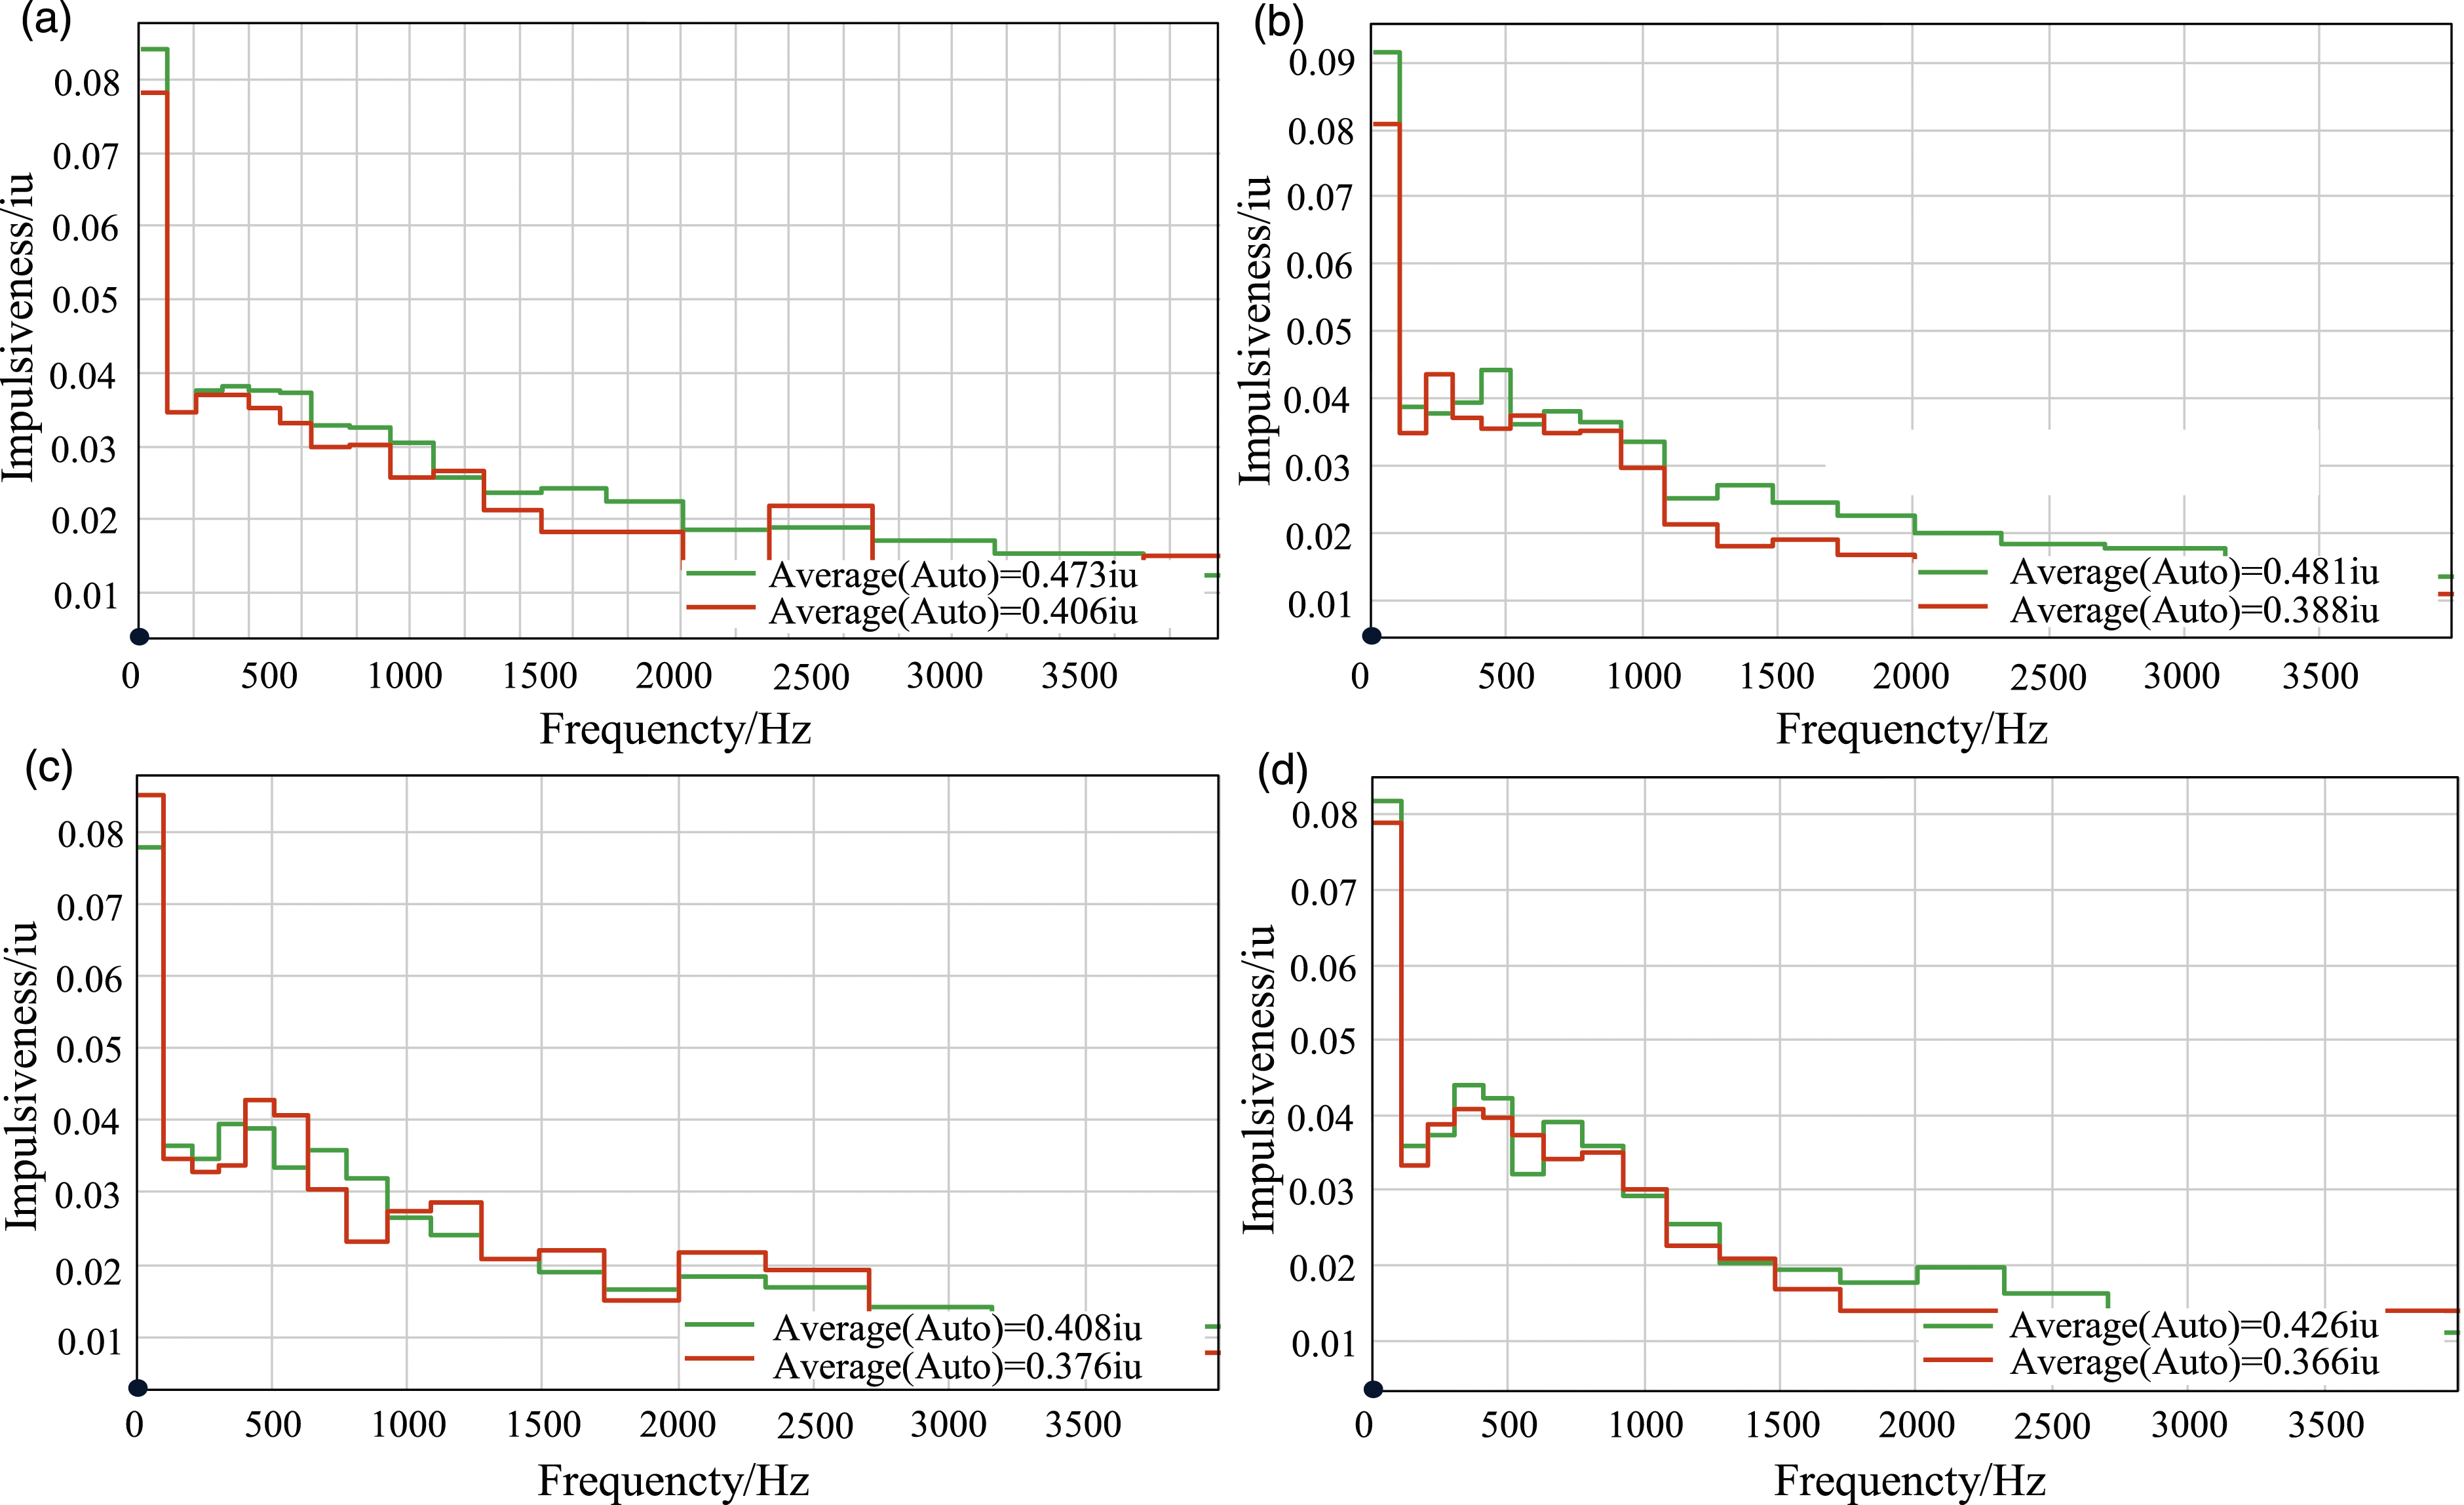
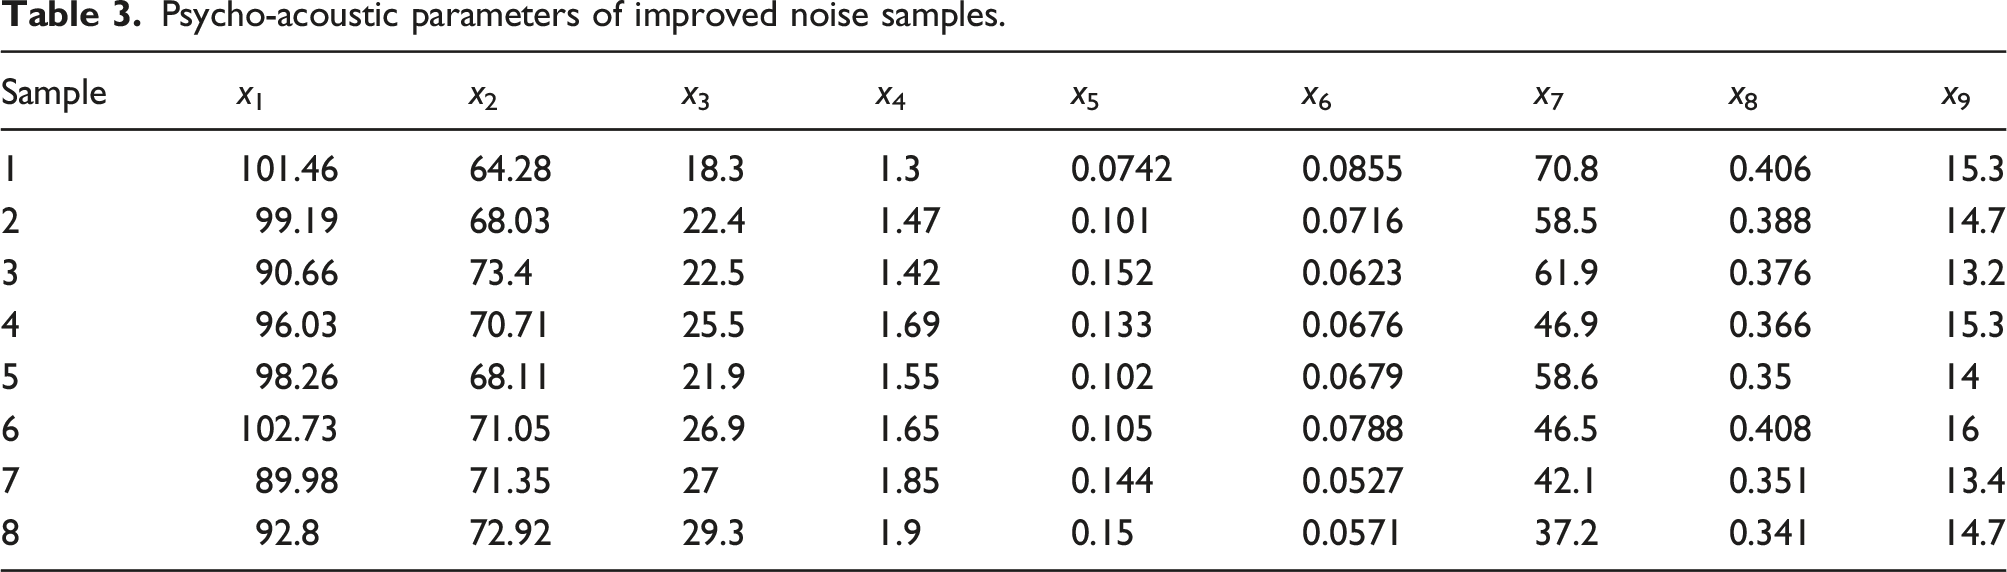
In Figures 6 and 7, the blue and red curves respectively describe the change relationship between significant psycho-acoustic parameters and frequency spectrum before and after improvements. It can be seen that except for the increases of impulsiveness amplitude and the sound pressure level of 500 Hz when the driver’s speed is 30 km/h under on-air conditioning, the parameter amplitude of other conditions and measuring points decreases, which indirectly indicates that the targeted bus interior sound quality has been further improved.
Acoustic comfort prediction
Acoustic comfort comparison of the bus C before and after improvements.
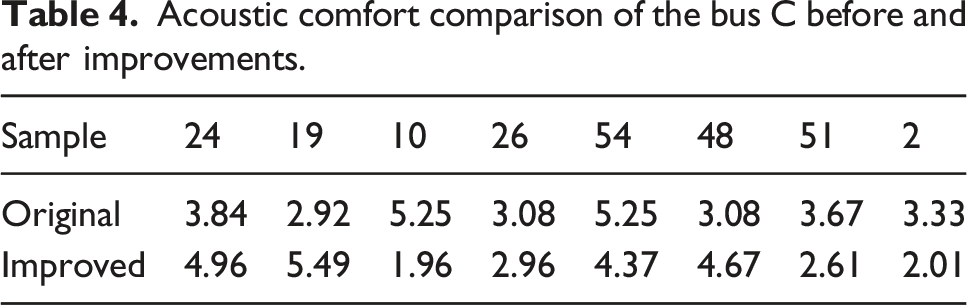
It can be summarized from Table 4 that after improvement, the interior acoustic comfort levels in the driver’s position with off-air conditioning (including 30 km/h and 50 km/h) and on-air conditioning at 50 km/h have been greatly improved, while the comfort of other measuring points and working conditions has decreased. Therefore, only comparing the comfort level before and after improvements of a single sample is difficult to judge the sound quality improvement effect of the whole vehicle. Thus, the following work was carried out on the acoustic comfort comprehensive evaluation.
Acoustic comfort comprehensive evaluation modeling and comparison
The widely used multi-fuzzy analytic hierarchy process (MF-AHP) was adopted to obtain the sound quality of the whole electric bus C by integrating different measuring points and different working conditions.18–20 The theoretical basis and details of the calculation process refer to previous research report. 14 In this noise acquisition test, the positions from driver and rear seat were selected as the observation points, and the constant driving speeds were 30 km/h and 50 km/h; on and off air conditioning were two kinds of working condition. Therefore, a fuzzy comprehensive evaluation system with three indexes is established.
Judgment matrix and weight of the first-level evaluation index.

Judgment matrix and weight of the second-level evaluation index.

Judgment matrix and weight of the third-level evaluation index.
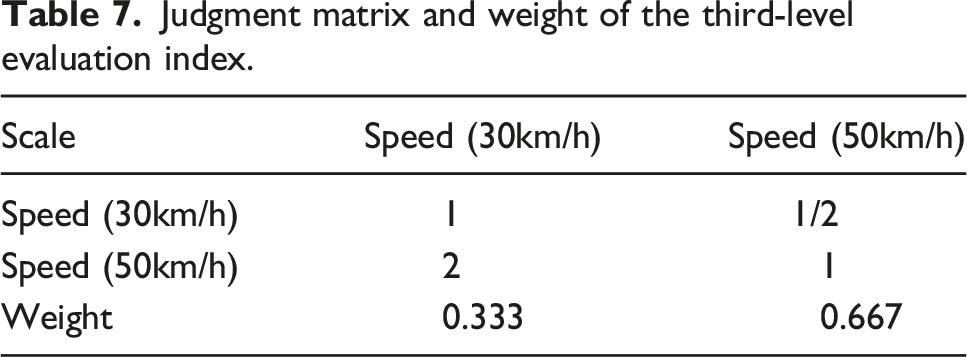
Based on the above index weights and subjective evaluation results, it can be obtained that the improved acoustic comfort of the bus C is 4.55, which is 31.12% higher than that of 3.47 before improvement, which further indicates that the interior sound quality of the targeted prototype electric bus has been effectively improved.
Conclusions and future work
The application of electric bus is gradually widespread, its interior sound quality is the most direct subjective feeling for passengers and users, which is one of the key indicators affecting product macro quality. This paper puts forward a set of relatively complete technical system of subjective evaluation, modeling prediction and comprehensive evaluation of interior sound quality, and to test its feasibility and effectiveness by applying the system through collecting 64 noise samples of electric buses.
(1) Firstly, all noise samples were randomly coded, and nine objective psycho-acoustic parameters were calculated, including LSPL, ASPL, loudness, sharpness, roughness, FS, AI, impulsiveness and RA; (2) with acoustic comfort as the evaluation index, a jury was organized and the developed subjective evaluation system based on RSC was adopted to complete the subjective evaluation test of all noise samples and obtain their corresponding comfort levels; (3) using GBDT algorithm, the first 59 noise samples data were trained to predicate acoustic comfort levels of the last five noise samples; (4) according to the relationship between significant psycho-acoustic parameters and frequency spectrum of the targeted bus, the improvement measures are put forward, and noise signal re-acquisitions are carried out; (5) the three-level evaluation index system and judgment matrices are established to calculate the weights of each index, so that indicate the overall bus sound quality is improved by 31.12%.
Future work is mainly reflected in two aspects: one is the use of intelligent algorithms such as particle swarm optimization to select the model parameters of XGBoost for further improving acoustic comfort prediction accuracy; the other is that the sound quality development strategy can also be applied to other types of buses, in which passive improvement measures are only implemented from abnormal sound sources to achieve certain sound quality improvement effect, but in order to adapt more flexibly to changes in working conditions, studying the dynamic characteristic of interior sound quality and its active control method will be the key research directions.
Footnotes
Declaration of conflicting interests
The author(s) declared no potential conflicts of interest with respect to the research, authorship, and/or publication of this article.
Funding
The author(s) disclosed receipt of the following financial support for the research, authorship, and/or publication of this article: This work was supported by the National Natural Science Foundation of China (12004136), Natural Science Foundation of Fujian Province (2023J011438), Natural Science Foundation of Xiamen City (3502Z20206024), Science and Technology Project for High-level Talents (YKJ22017R) and China Postdoctoral Science Foundation (2019M662252).
