
Abstract
This paper presents the findings of a comprehensive study of the effects of various design variables on the dynamic behavior and vibration characteristics of a front-loading washing machine. A multibody dynamics model of the washing machine with a set of 9 key design variables is developed using the commercial multibody simulation software Adams View. The design variables are implemented to enable automated modifications of the dynamics model for certain parameters such as the geometric orientations of the springs and dampers in the washing machine. This dynamics model is employed to perform a series of numerical simulations by considering a range of parametric values for the design variables. Numerical convergence analysis is performed to ensure that the simulation solutions are converged. Using the simulation solutions, the time histories of displacements at select points of the washing machine during operation (from transient till steady-state motion) are analyzed to understand how the natural frequencies of the washing machine are affected by various design variables. Finally, a sensitivity analysis is carried out to determine the design variables that have the strongest impact on the dynamic behavior of the washing machine. Of all the design variables affecting the dynamic behavior of the washer model, the weight balancer mass density and the damping coefficient were found to have the strongest effect.
Introduction
Washing machines have been one of the household products that have been studied by researchers in the past 20 years. Customer expectations have been raised tremendously as the technology has been advanced, urging manufacturers to meet customer demands by upgrading their products. Markets compete to develop lightweight washing machines with larger capacities and higher spin speeds. 1 However, higher capacities and operation speeds raise issues of intense mechanical vibrations in addition to concerns of increased cost. 2 The challenge is to develop new washing machines with lower cost and higher energy efficiency that satisfy customer expectations without adding extra side effects. To meet the challenge, one strong need is to have a clear understanding of how washing machine design variables affect the dynamic behavior and vibration characteristics of the washing machines.
There are two kinds of washing machine structures: front-loading (with a horizontal rotation axis) and top-loading (with a vertical rotation axis). Front-loading washing machines are popular among consumers due to their lower water, detergent and energy consumption compared to top-loading washing machines.3–6 Additionally, wear and tear to laundry is smaller in front-loading washing machines. 7 Due to their popularity, we will focus on front-loading washing machines in this paper.
Washing machine operations consist of three major processes: washing, rinsing, and spin-drying. 2 Understanding the dynamic behavior of the washing machine in these processes is critical for new designs that enhance performance. In each process, as the washing machine spins, the laundry, which in general is randomly and unevenly distributed, will generate a centrifugal imbalanced force and cause noise and vibration. During high-speed spinning, the vibration may be severe enough to create undesirable motion, such as shaking and walking in which the washing machine will move out of its place. Although considering the random force effect is challenging, researchers have utilized different methods in order to compensate for the unbalanced force and avoid unwanted vibrations as much as possible. To this end, it is noted that most of the existing studies of front-loading washing machines have been focused on developing active methods, passive methods, or combination of both methods to minimize unwanted washing machine motion caused by the unbalanced force, as discussed below.
Active methods directly reduce the unbalanced mass generated in the washing machine during spinning by using additional masses, such as balls or injected fluids, that react in the opposite direction of the rotating drum while the imbalance is affecting the system.8–10 There have been many efforts by researchers using different active methods to overcome the unbalance issue in the vibration of the washing machines. Chen and Zhang 8 studied an active method for a horizontal-axis washing machine with a ball balancer and four Magnetorheological (MR) dampers. They carried out a hybrid optimization scheme to obtain optimum design parameter values to enhance the walking resistance capability of the washer. Son, Lee and Choi 10 determined the optimal dimension of layers and the amount of salt water for an automatic liquid balancer in washing machines to minimize the maximum displacement. Their design optimization was created by employing radial basis function regression (RBFr) models that were based on experimental data at full factorial design points. Buskiewicz and Pittner 3 presented a new semi-active technique for vibration reduction of a washing machine frame during the spin cycle by using a new electromechanical damper and developed a dynamic model of the washing unit to simulate the motion of the system. They validated their new method by carrying out experiments at a stand dedicated to measuring the vibration of the washing unit suspended on original dampers and on new dampers. Jang et al 11 analyzed the vibration of a washing machine during the dehydration process with a rapid decrease of unbalanced liquid mass for reducing vibrations. Their dynamics model was developed in the multibody dynamics simulation software Adams View and based on experimental data of several components. Bui et al 12 investigated the hysteresis behavior of a front-loading washing machine with the design and manufacturing of a shear-mode MR damper to replace conventional passive dampers with an active method. One problem with active methods is that they may generate larger vibration in the transient response of the system. 3
Passive methods employ an optimized suspension system with additional counterweights and dampers and springs. Understanding the impact of critical parameters in the suspension system helps manufacturers to predict washing machine movement during operation in order to improve designs to avoid or minimize undesirable movement. Türkay, Kiray, Tugcu and Sümer 13 developed a computer code for parametric suspension design optimization of a horizontal-axis washing machine. They found formulations for the minimization of a weighted multi-objective function subject to the resistive stepping force constraint. Boyraz and Gündüz 1 presented a 2D dynamic model of a horizontal axis washing machine to examine the vibration characteristics of the spin-cycle and improve the design proposing an optimization scheme based on Genetic Algorithms.
Many studies have been carried out to analyze the dynamic behavior of different types of washing machines. Hoa, Khoa and Nguyan 14 studied the effect of the spring stiffness and damping coefficient of vibration system of the washing machine drum to analyze the flexible body dynamic response and provide a basis for optimal design of body structure. They built a Rigid-Flexible coupling model of the drum with parameterized characteristics in ANSYS and achieved a simulation of the system in the time domain and the frequency domain using the ADAMS/Vibration platform. Nygårds and Berbyuk 15 presented a computational model of a horizontal-axis washing machine using a theoretical-experimental methodology consisting of an integrated multibody system (MBS) formalism implemented in the commercial MBS environment Adams View. They investigated the possibility of automatic counterbalancing technology for reducing vibration output by computationally studying the vibration dynamics of washing machines, including the sensitivity of system dynamics with regard to suspension structural characteristics. Park, Jeong and Yoo 16 studied the reliability of a linear dynamic model of a front-loading washing machine and verified the model predictions using the numerical results obtained using the RecurDyn software. Argentini et al 17 presented a numerical model of a horizontal-axis washing machine and validated their finding through an experimental model. They developed an effective mathematical model that predicts the machine dynamics during steady-state spinning cycles, with a specific focus on the structural vibrations of the washing machine cabinet.
There are also studies of the dynamics of a washing machine with flexible components. Öztürk and Erol 18 used the commercial multibody simulation software Adams View to predict, evaluate and optimize the dynamic behavior of the horizontal-axis washing machine during the spinning period. Ma, Hu and Liu 26 studied the effect of the spring stiffness and damper’s damping coefficient to analyze the flexible body dynamic response and provide a basis for optimal design of body structure. Shao, Wang and Song et al. 19 investigated the dynamics characteristics of a washing machine vibration isolation system by using the Lagrange method for establishing dynamics and motion equations. They obtained the kinematics and mechanical characteristics of the dynamic simulation analysis using ADAMS software. Qu et al 20 established the dynamic model of a washing machine based on the Lagrange equation to study the suspension system and vibration and noise reduction of the washing machine. They verified the accuracy of the kinetic model by comparisons with finite element simulations and experiments. Buśkiewicz, Pittner and Barkzewski 21 examined the vibration of the washing machine drum using an unbalanced mass attached to the rotating unit. They derived the washing machine's motion equations and compared the numerical predictions with experimental data. Their analysis can be used to provide the foundation for determining an effective method of balancing the drum vibration. Jang et al 11 analyzed the vibration of a washing machine during the dehydration process with a rapid decrease of an unbalanced liquid mass for reducing vibrations. A vertical-axis washing machine was designed in ADAMS and a multibody dynamic model was established using experimental data of several components obtained using an MTS test machine. Chiad and Abdulla 22 studied the effect of the number and location of dampers in the suspension system on the vibration displacement at various spin rotation speeds. They found that shaking is more stable when the washer’s tub is supported by four dampers, two from each side.
It is noted that existing works on the dynamic behavior of washing machines are mostly devoted to analyzing the washing machine dynamic response by considering a limited number of parameters in the suspension system of the washing machine. Currently there is a lack of studies that provide a systematic parametric analysis and understanding of the effects of a wide range of design variables, including the weight balancer mass density, the spring stiffness, the spring orientation angle, the viscous coefficient of the dampers, and the location and orientation of the dampers.
In this paper, we present the results and findings of a comprehensive simulation-based study of the dynamic and vibration behavior of a front-loading washing machine. Nine design variables are considered, including damper parameters in the suspension system. This study will provide an understanding of the natural frequency variations with respect to various design variables. This understanding will contribute to the knowledge base and be useful to engineers who design washing machines. To facilitate this study, a multibody dynamics model of the washing machine is developed using the commercial code Adams View. The design variables are implemented in the model to enable automated modification of the washing machine design by considering a range of parameter values for the design variables. Using this dynamics model, a series of numerical simulations have been carried out. The numerical convergence of the simulation solutions is verified. The time histories of displacement solutions at select points of the washing machine are analyzed to understand how the natural frequencies of the washing machine are affected by the design variables. At the end, a sensitivity analysis is conducted to study which design variables have the strongest effect on the maximum X, Y and Z displacement amplitudes.
The layout of the paper is as follows. First, a description of a front-loading washing machine and its multibody dynamics model is given. Second, details of the numerical simulations and some key results are provided. Third, the numerical convergence of the simulation solutions is analyzed by studying the error tolerance sensitivity. Fourth, the full set of design variables, along with their range of values considered in this study, is listed. Fifth, the results of this study are presented and discussed. Sixth, a sensitivity analysis of the effect of the design variables on the maximum X, Y and Z displacement amplitudes is given. Finally, the main conclusions of this study are summarized.
A front-loading washing machine and its dynamics model
As shown in Figure 1, the front-loading washing machine being studied in this paper consists of a motor, a tub, a drum, front and rear weight balancers, two springs attached to the upper part of the tub, and four dampers attached to the lower part of the tub. The solid model of the washing machine is designed in a CAD software and the final multibody dynamics model for numerical simulation is created using the Adams View commercial multibody dynamics simulation software. The washing machine cabinet is assumed to be rigid and is fixed to the ground. Therefore, the washing machine frame in Adams View in this case is taken to be the ground. The drum and tub are considered as rigid bodies, and the stiffness effect of these parts are neglected. The left and right springs are symmetrical with respect to the Y-Z plane, and the front and rear dampers located at the left and right sides of the washer are also perfectly symmetrical with respect to the Y-Z plane. The washer consists of ten moveable bodies: the drum body, the tub body, and the piston and cylinder for each of the four dampers. A front-loading washing machine created in Adams View (middle) with schematic drawings (left and right) showing the spring angle α, the front damper angle β1 (of the front dampers) and the front damper angle β2 (of the rear dampers) and the side damper angle γ1 (of the front dampers) and the side damper angle γ2 (of the rear dampers).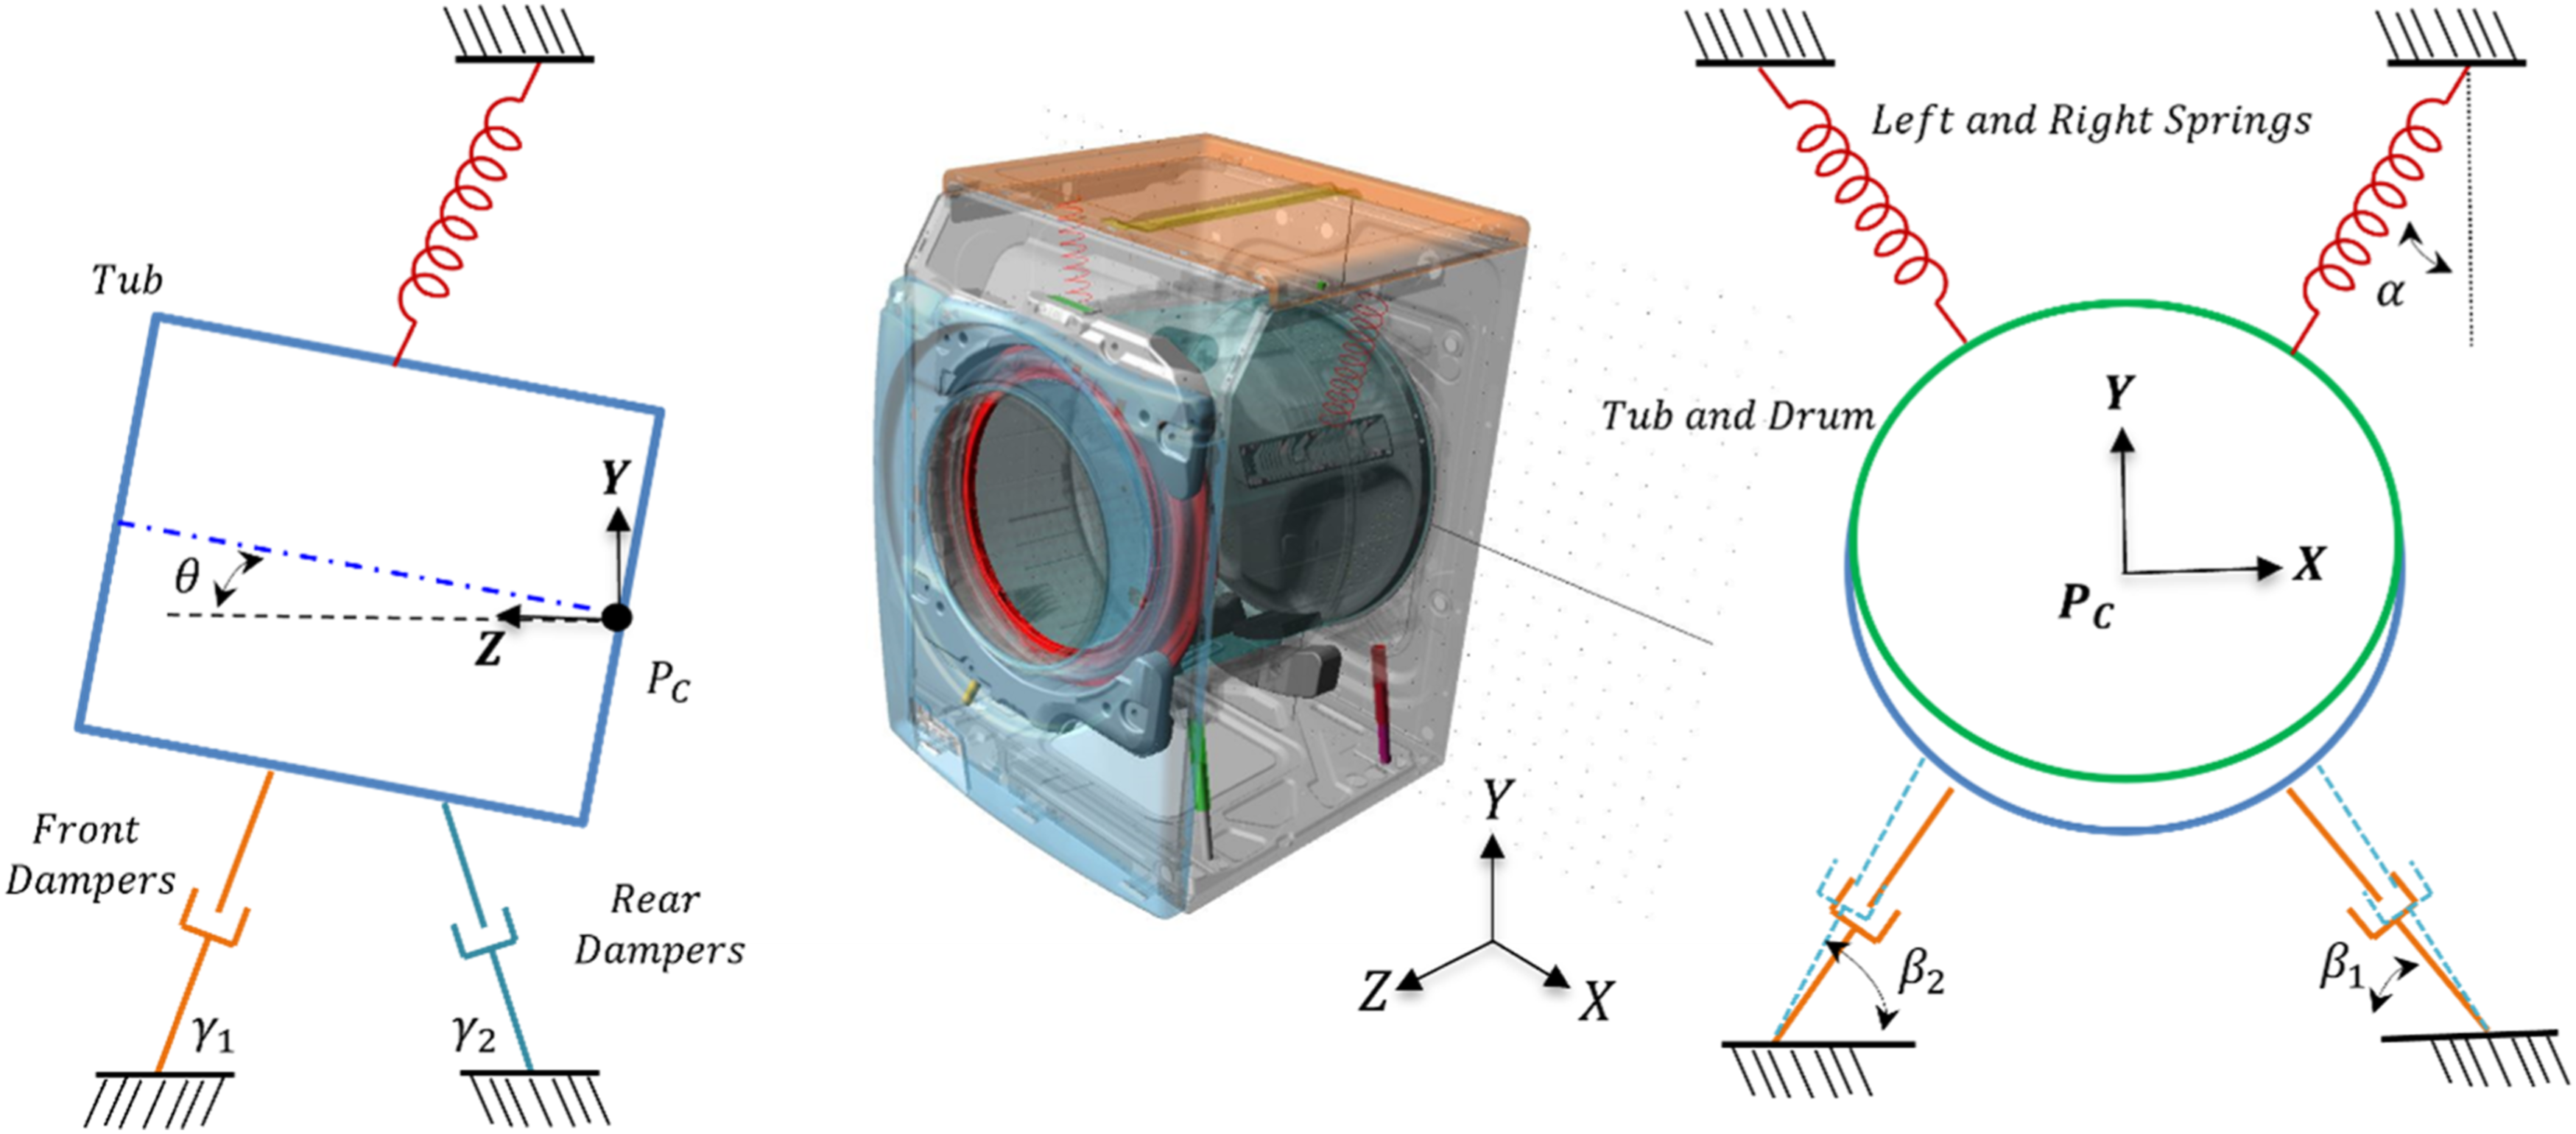
In Adams View, the dynamics solver utilizes the Gruebler equation to determine the total number of degrees of freedom (DOF) for a mechanical system as given below:

The movable body count does not include the ground body since it does not contribute to any DOF. A total number of 14 constraints are applied to the suspension system at the bottom part of the washer model: one revolute joint, eight spherical joints, four translational joints and one general motion applied to the revolute joint. The general motion is prescribed to the system at the same point where the revolute joint is applied, and together they remove 11 DOFs. The model has eight spherical joints (each damper has two spherical joints at its two ends), and each spherical joint removes 3 DOFs. There are four translational joints for the four dampers which connect the piston to the cylinder in each damper, and each translational joint removes 5 DOFs. Finally, based on the Gruebler equation introduced earlier (Equation (1)), we are left with 5 DOFs for the dynamics model in total. This means the model has five modal shapes (and five natural frequencies), including two rotational modes and three translational modes.
Numerical simulation details
Numerical simulations are carried out in Adams View, in which the dynamic simulation mode is chosen for running the simulations. All simulations are performed for a duration of 120 s with the spin or rotation speed of the drum varying monotonically from zero at the start of the washer operation to its maximum value DV_w as shown in Figure 2, which is given by the function (time, 1,0, 101,-DV_w*6d) in Adams View, where d refers to degrees and DV_w represents the designated rotation speed (rpm) during steady-state washer operation and is specified by the user before each simulation. Washer drum rotation speed variation with time.
Nine design variables implemented in the adams view dynamics model for the washer.

It is noted that the weight balancer mass density listed in Table is only for the front weight balancer. The mass density of the rear weight balancer is related to that of the front weight balancer in such a way that the mass center of the complete washer tub-drum assembly does not change when the mass density of the front weight balancer is varied in design. Also, for convenience, the damper side angles are implemented in Adams View in terms of their equivalent Z coordinates of the damper end points connected to the washing machine’s bottom frame.
When a simulation is performed with all DVs set to their standard values, the washer model is said to have the standard configuration. In all simulations, the simulation time duration is set to 120 s, which is found to be sufficient to reach the steady-state washer operation. The time step size is set to be 0.001 s (which means a simulation involves 120,000-time steps). For the Adams View solver, the solution category is set to be dynamic and the simulation option GSTIFF (S2) is chosen for its integrator. The integrator GSTIFF (S2) is selected because a solution with this integrator avoids singularity, and the simulation response takes less time to obtain when a high number of steps are set in the simulation setting. The time step size of 1.0E-03 s is chosen after it is verified that numerical convergence occurs with this time step (i.e., the simulation results do not change if the step size is further reduced). In order to measure the dynamic response of the washing machine, two sensors are attached to the tub of the washer model studied in this paper: the front sensor is attached to the front top, and the rear sensor is attached to the back top of the tub (Figure 3(a)). After performing a FFT analysis on the time history response of each sensor in terms of the X, Y and Z displacements, we can gain an understanding of the vibration characteristics, such as the resonance zone and vibrational modes of the washer model. Figure 3(b)–(d) present the frequency spectrums for the front and rear sensors’ X, Y and Z displacements. The peak with the highest amplitude represents the excitation frequency. As expected, it is observed that the X, Y and Z displacements lead to the same excitation frequency of 21.66 Hz, which corresponds to the drum rotation speed of 1300 r/min. The agreement of the major peak value of 21.66 Hz seen in Figure 3(b)–(d) for the X, Y and Z displacements’ frequency spectrum with the drum rotation speed of 1300 r/min indicates that the simulation solution captures the dynamic response of the washing machine very well. (a) The front and rear sensor’s location; the identified natural frequencies from the displacement responses at the front and rear sensors: (b) X displacement, (c) Y displacement and (d) Z displacement.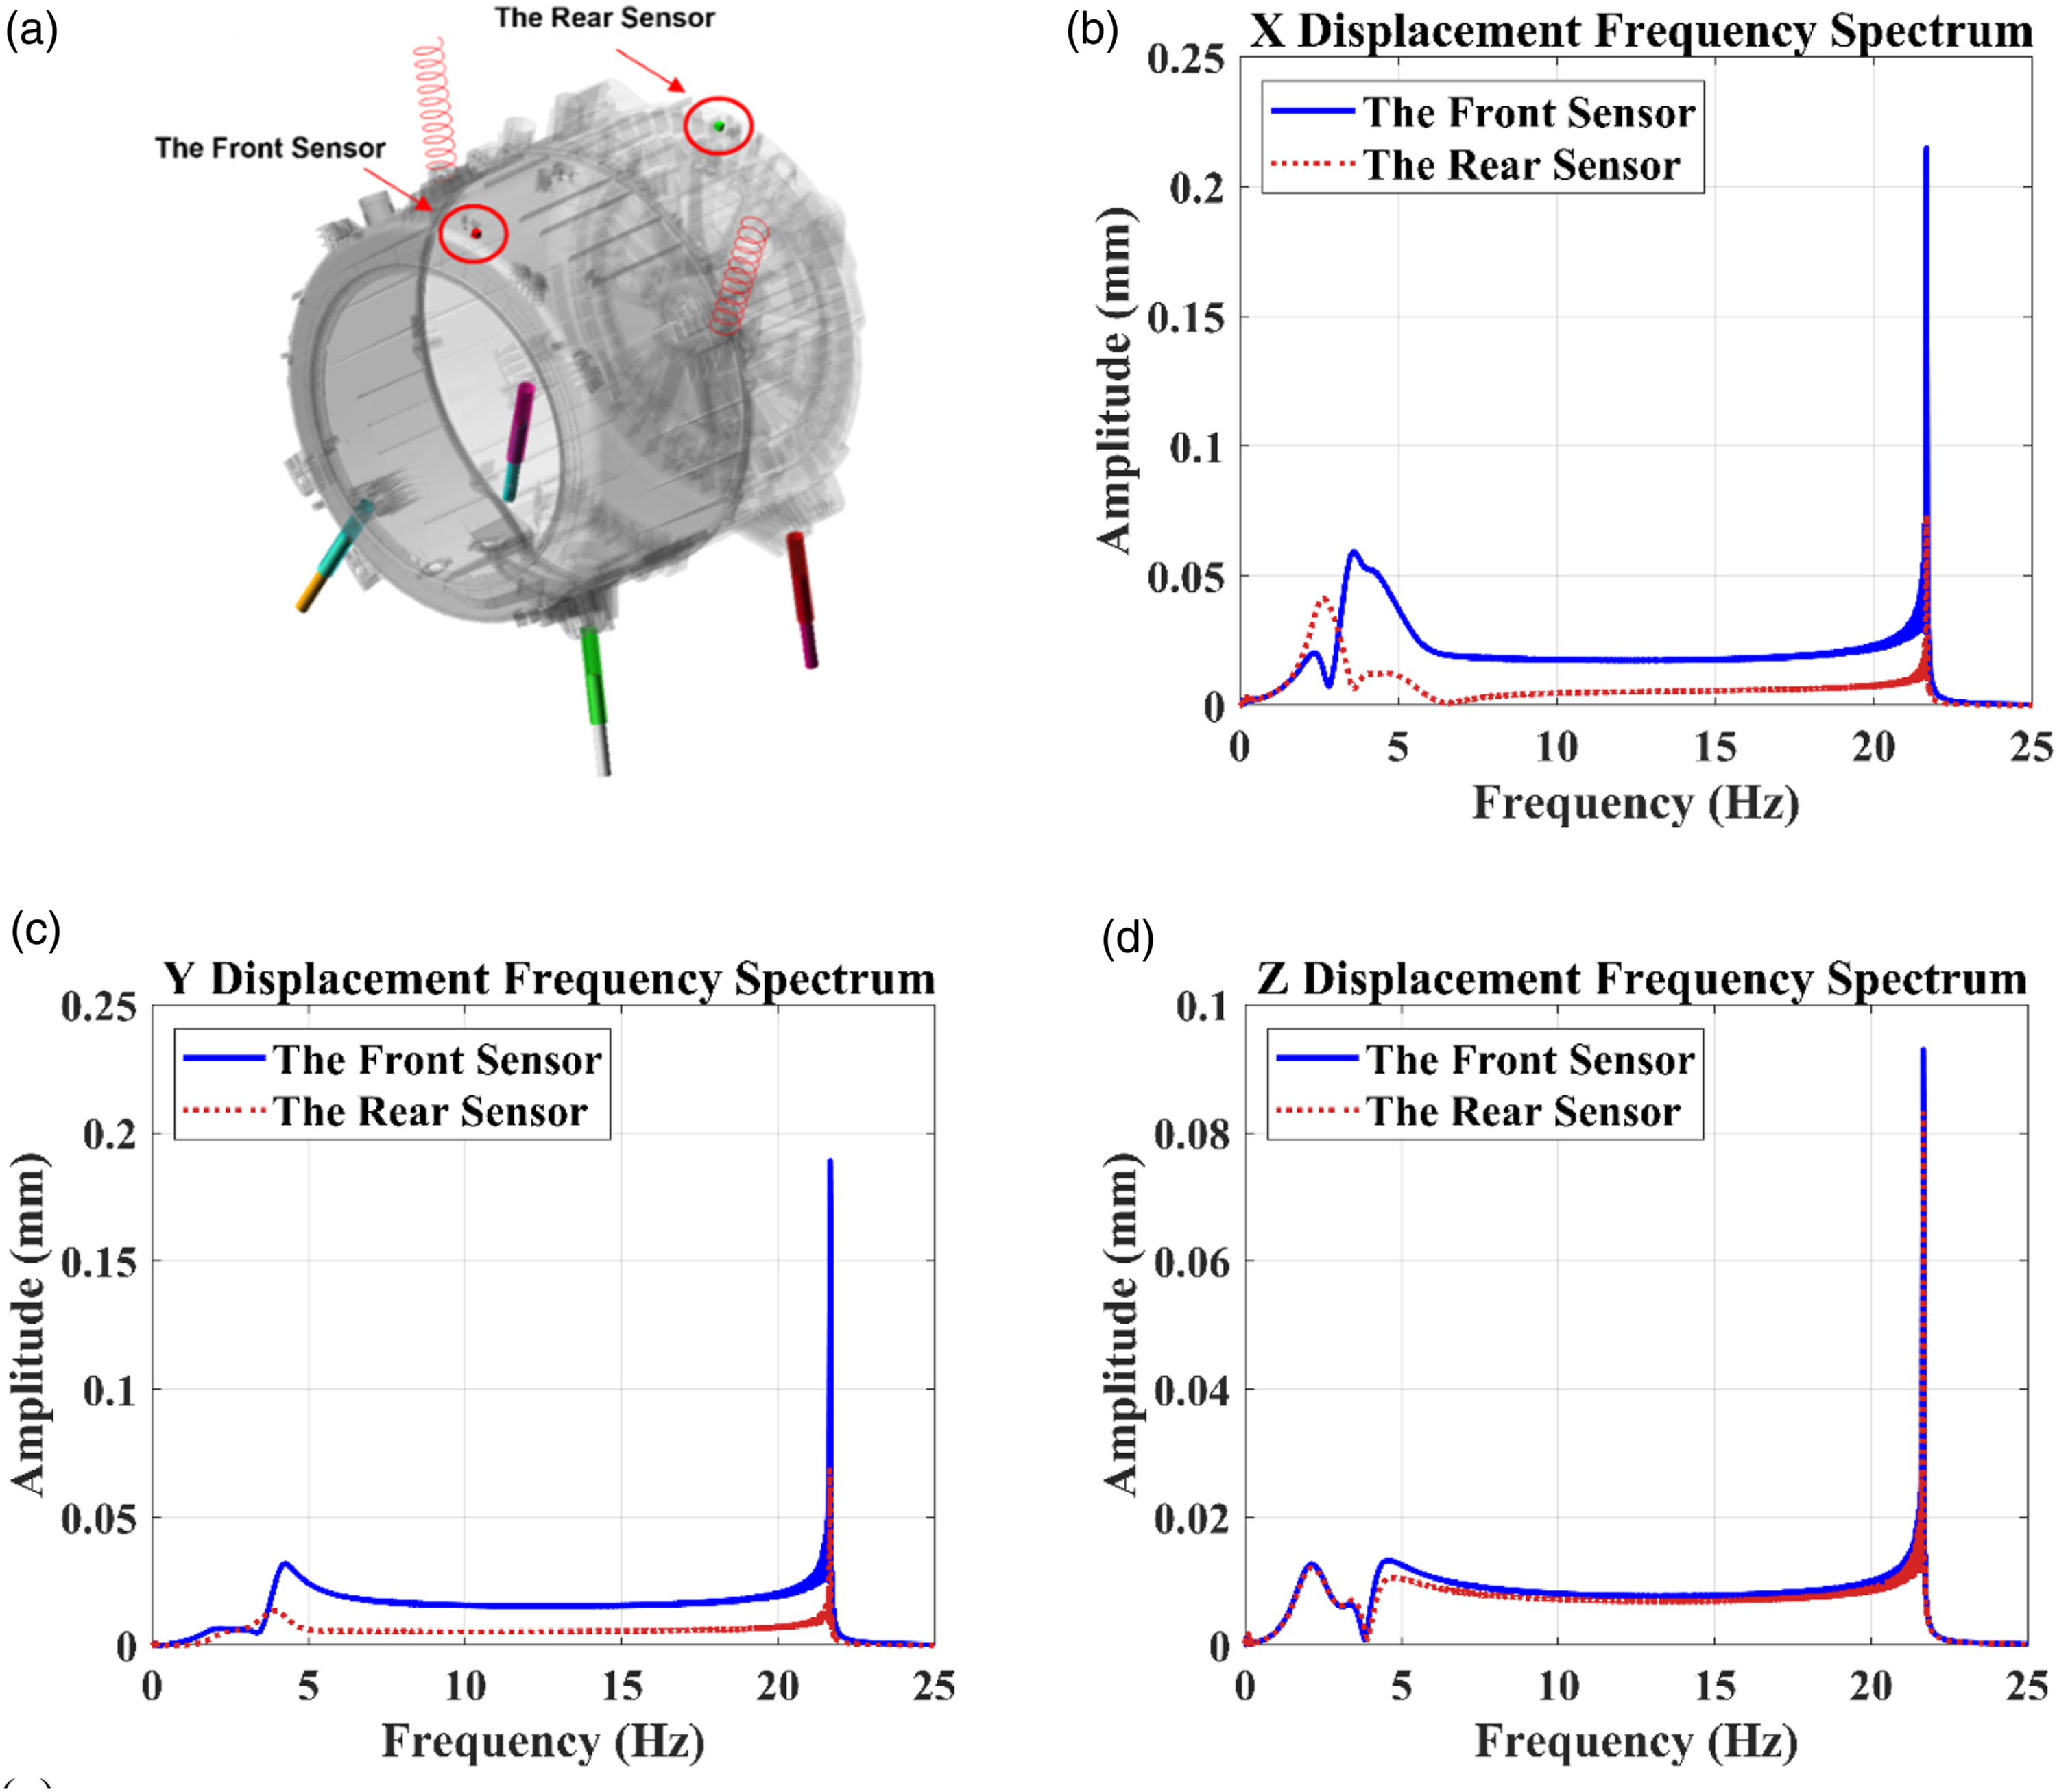
The number of major peaks in the frequency spectrum for each sensor is five, which is equal to the total number of the DOFs in the washer system for its five modal shapes. The frequency responses from the X displacement at the front and rear sensors lead to two peaks, which are the washer model’s natural frequencies (NFs) corresponding to two DOFs. 23 The first NF from the X displacement corresponds to the first rotational mode, and its second NF corresponds to the first translational mode. Additionally, the Y displacements at the front and rear sensors lead to one peak representing the third NF, which corresponds to the second translational mode. The Z displacements at the two sensors have two peaks that are the fourth and fifth NFs. The first NF from the Z displacement corresponds to the second rotational mode, and its second NF corresponds to the third translational mode.
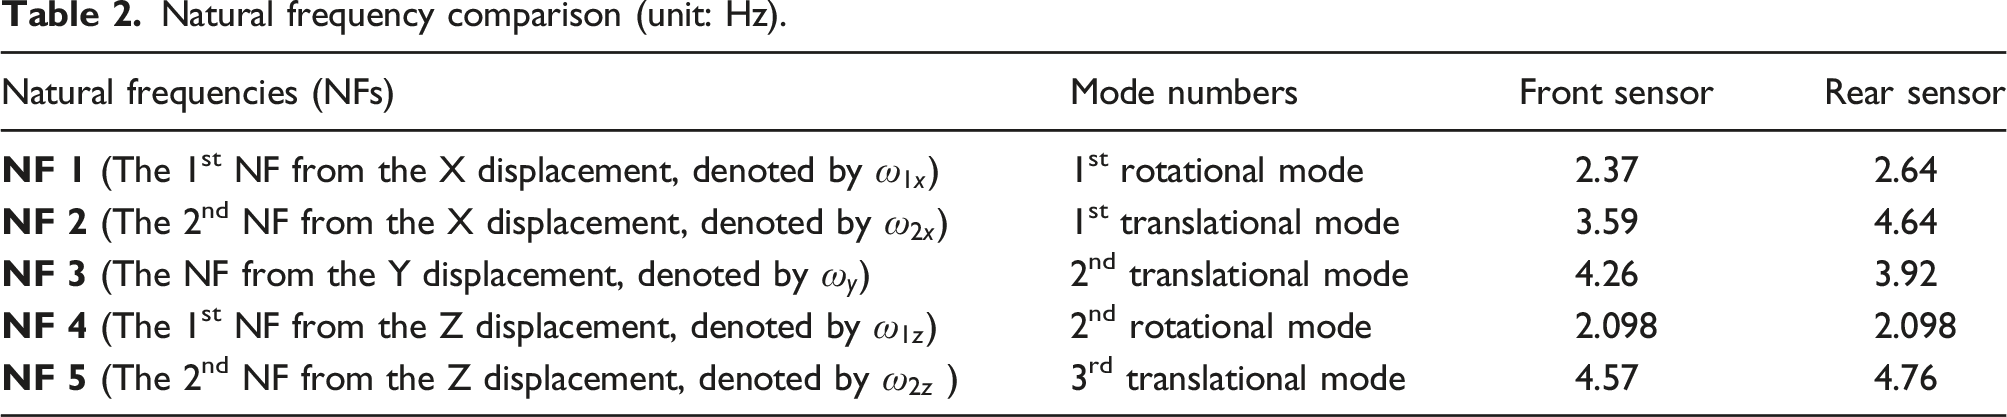
Natural frequency comparison (unit: Hz).
Error tolerance sensitivity
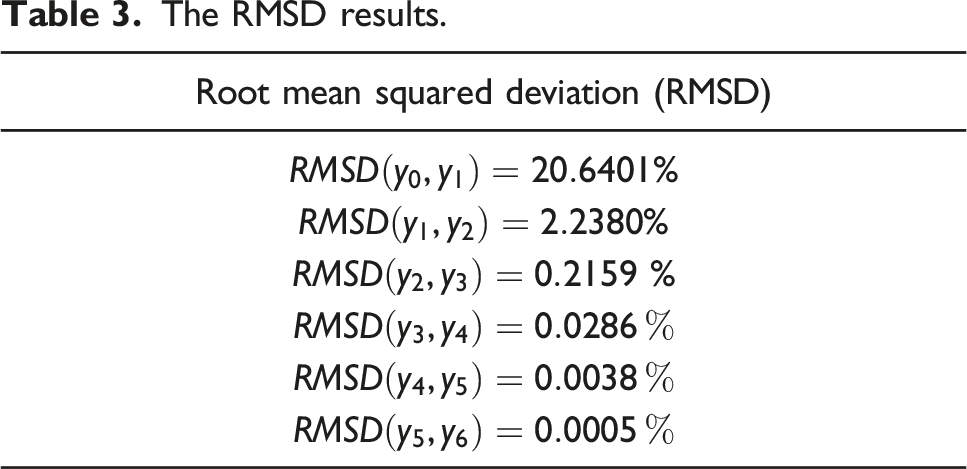
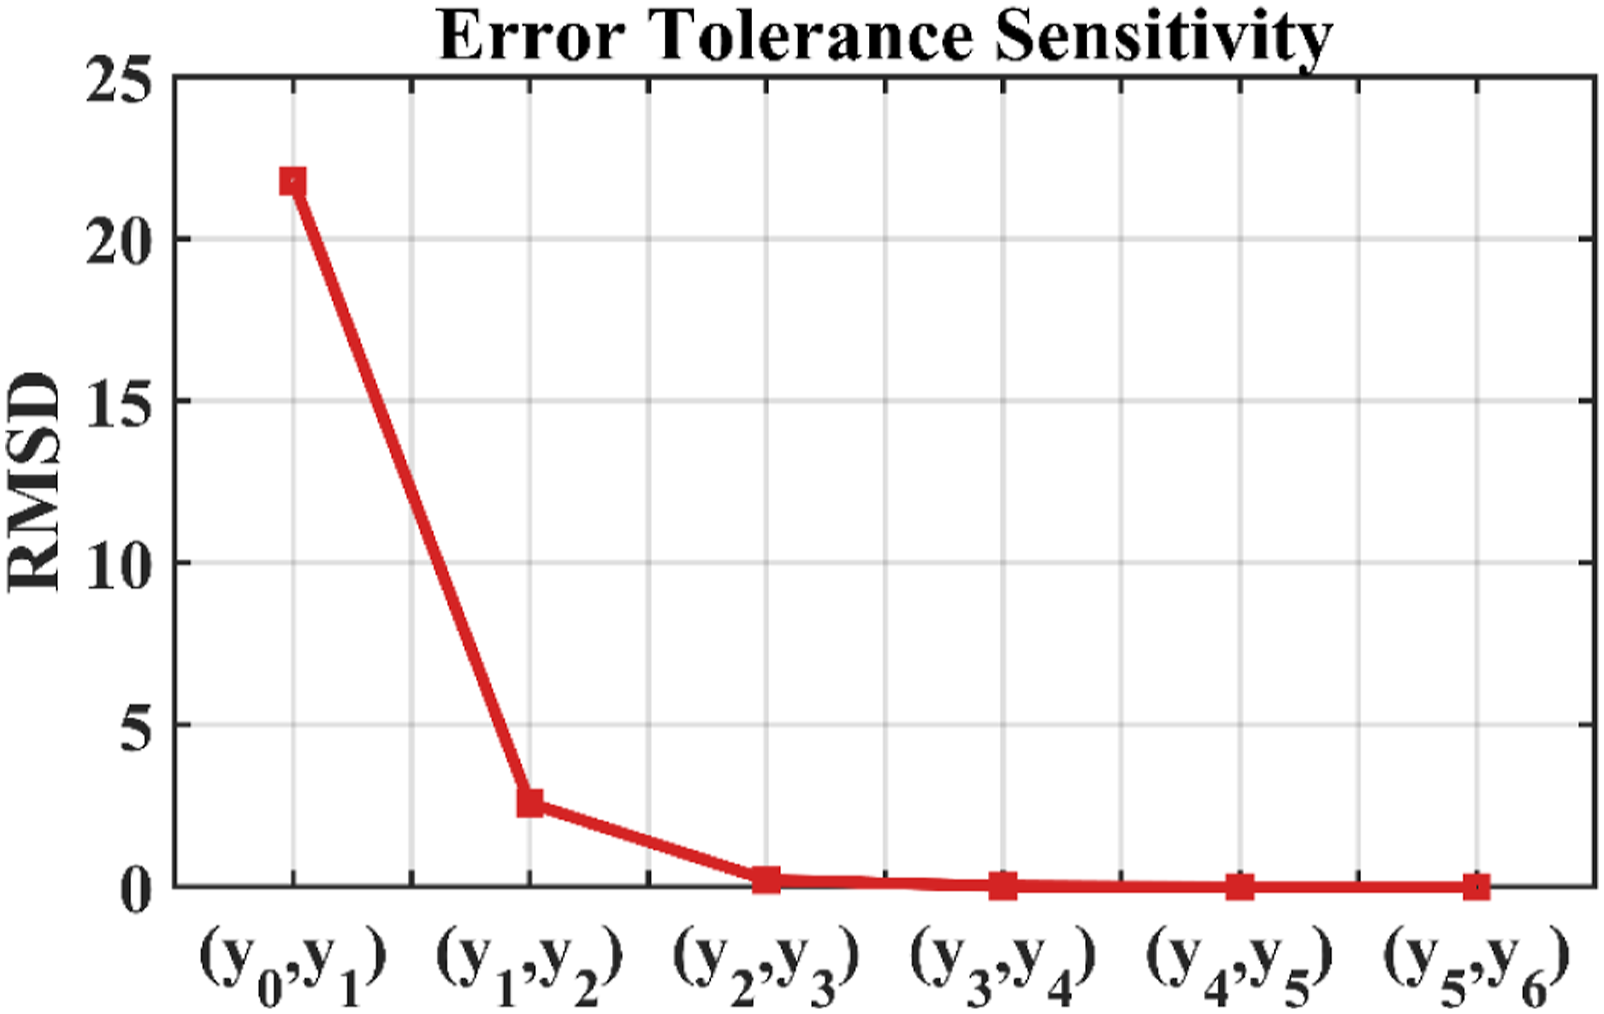
As explained earlier, the dynamic mode is chosen in the Adams View solver setting to run all simulations. It was found that the simulation results are quite sensitive to the error tolerance value chosen in the solver. In order to ensure that the error tolerance chosen in the simulation setting is adequate, an error tolerance sensitivity analysis is carried out. To this end, the error tolerance is varied from 1.0E0 to 1.0E-06 sequentially, and the effect of the variation of the error tolerance on the displacement response at the front sensor is studied. A convergence study has been done by implementing the root mean squared deviation (RMSD) between the displacement response of the front sensor associated with two sequential error tolerance values. In each set of simulations, the error tolerance is varied in the dynamic solver setting, while the other solver parameters take their default values and kept unchanged. All simulations are performed for a time duration of 120s, and the number of time steps is kept at 44,000 for all responses.
The RMSD results.
The dynamic response sensitivity to the error tolerance.
The first natural frequency of the washer system, as error tolerance is decreased from 1.0E-02 to 1.0E-06, is presented in Figure 5. Since the simulation predicted natural frequency does not change when the error tolerance is lower than 1.0E-03 and the RMSD between error tolerance values of 1.0E-03 and 1.0E-04 is sufficiently close to zero (e.g., less than 0.03%), we can safely conclude that convergence occurs at the error tolerance of 1.0E-04. As such, the error tolerance value of 1.0E-04 is chosen for all simulations. Representation of the simulation response with the variation of the error tolerance.
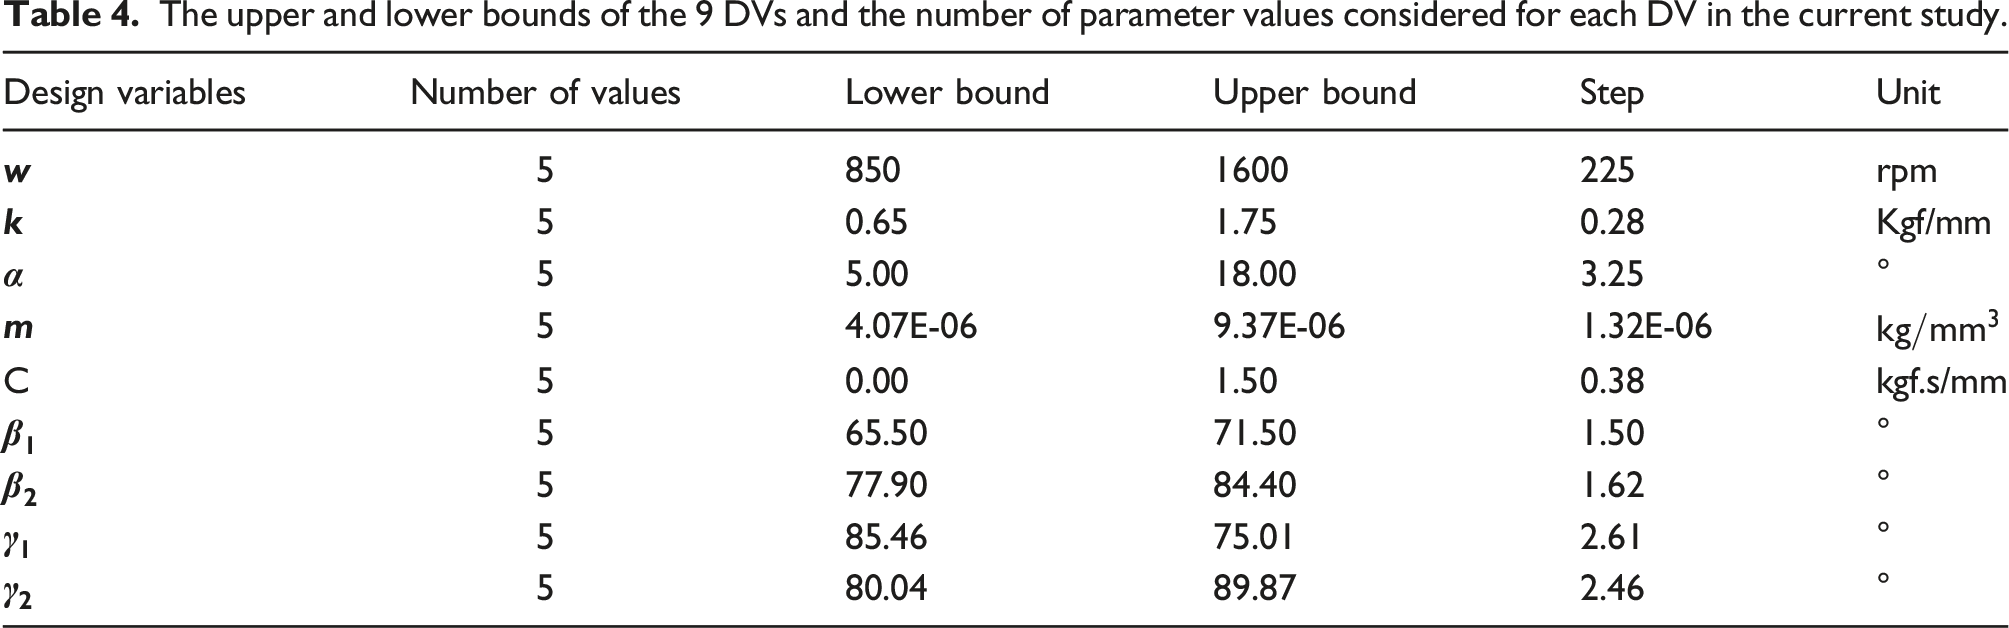
Range of design variable values
The upper and lower bounds of the 9 DVs and the number of parameter values considered for each DV in the current study.
Results and discussions
The aim of this section is to investigate the effect of various design variables on the dynamic behavior of the front-loading washer machine based on the Adams View simulation solution. To facilitate the visualization of the effect of the design variables on the dynamic behavior, several sets of simulations are conducted. In each set, the value of one design variable is varied from one simulation to another, while the other design variables take their standard values and are kept unchanged. As stated previously, all simulations are performed for a time duration of 120 s and using a simulation error tolerance of 1.0E-04. The simulation step size is 1.0E-03 s.
From each simulation solution, the displacement response at the front sensor on the washer tub will be utilized. The time history of the X, Y or Z displacement will be analyzed using FFT. From the frequency spectrum, the NFs will be determined.
Effect of rotation speed on natural frequencies
To begin with, the steady-state spin rotation speed of the horizontal washer machine is varied from its minimum value of 800 r/min to its maximum value of 1700 r/min. Figure 6 shows the variation of the frequency response determined from the front sensor X displacement, with respect to the variation of the rotation speed. Variation of the frequency response with the rotation speed.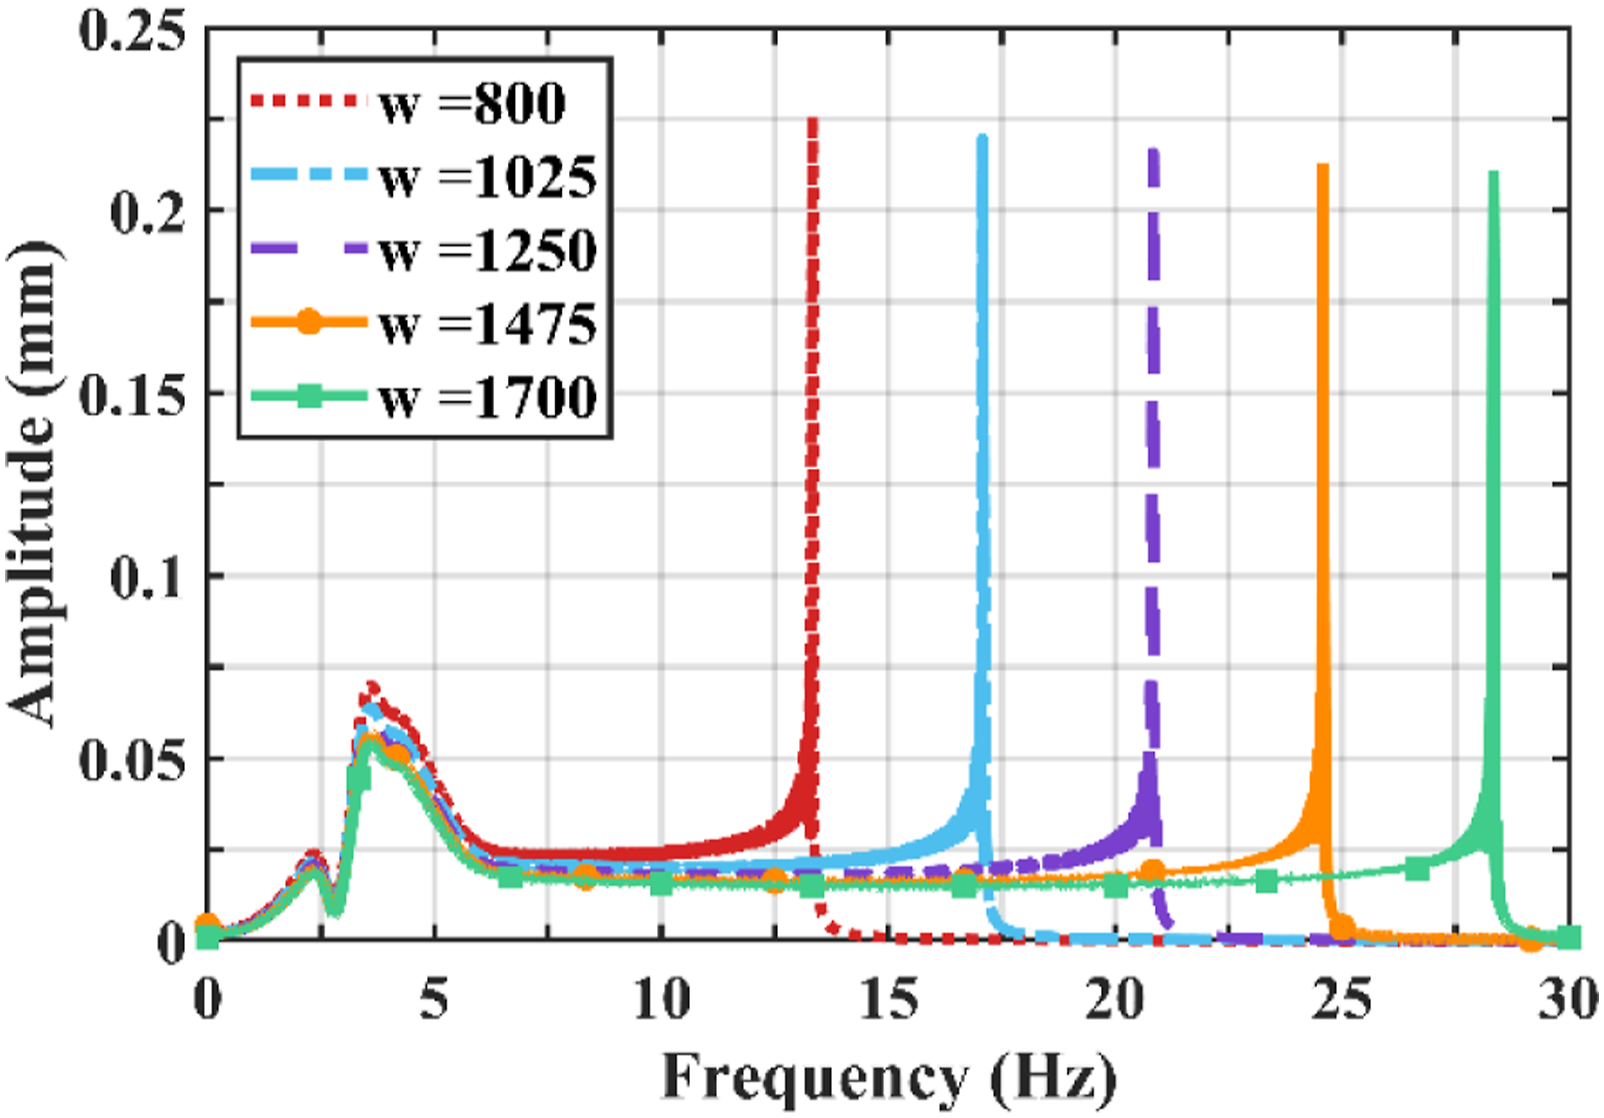
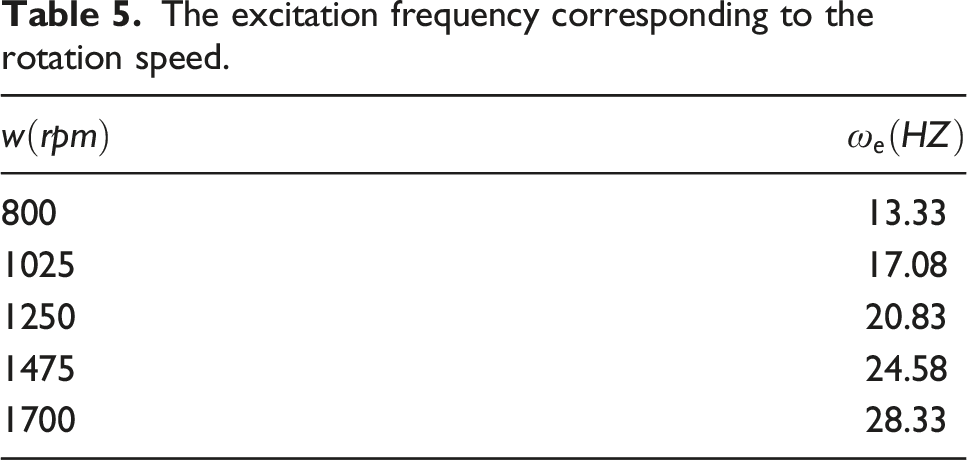
In Figure 6, for each rotation speed, the frequency spectrum of the front sensor X displacement has three peaks, representing the natural frequencies and excitation frequency of the system. The first two peaks for each rotation speed are the first and second natural frequencies, and the third peak (the highest peak) represents the excitation frequency (which is also shown in Figure 7 as monotonically rising straight lines). The excitation frequency, which is due to the laundry loading and is identified as the third frequency peak, is found to depend on the rotation speed, and it increases as the rotation speed increases (see Table 5 and Figure 7). It is related to the rotation speed as Frequency variation with the rotation speed. The excitation frequency corresponding to the rotation speed.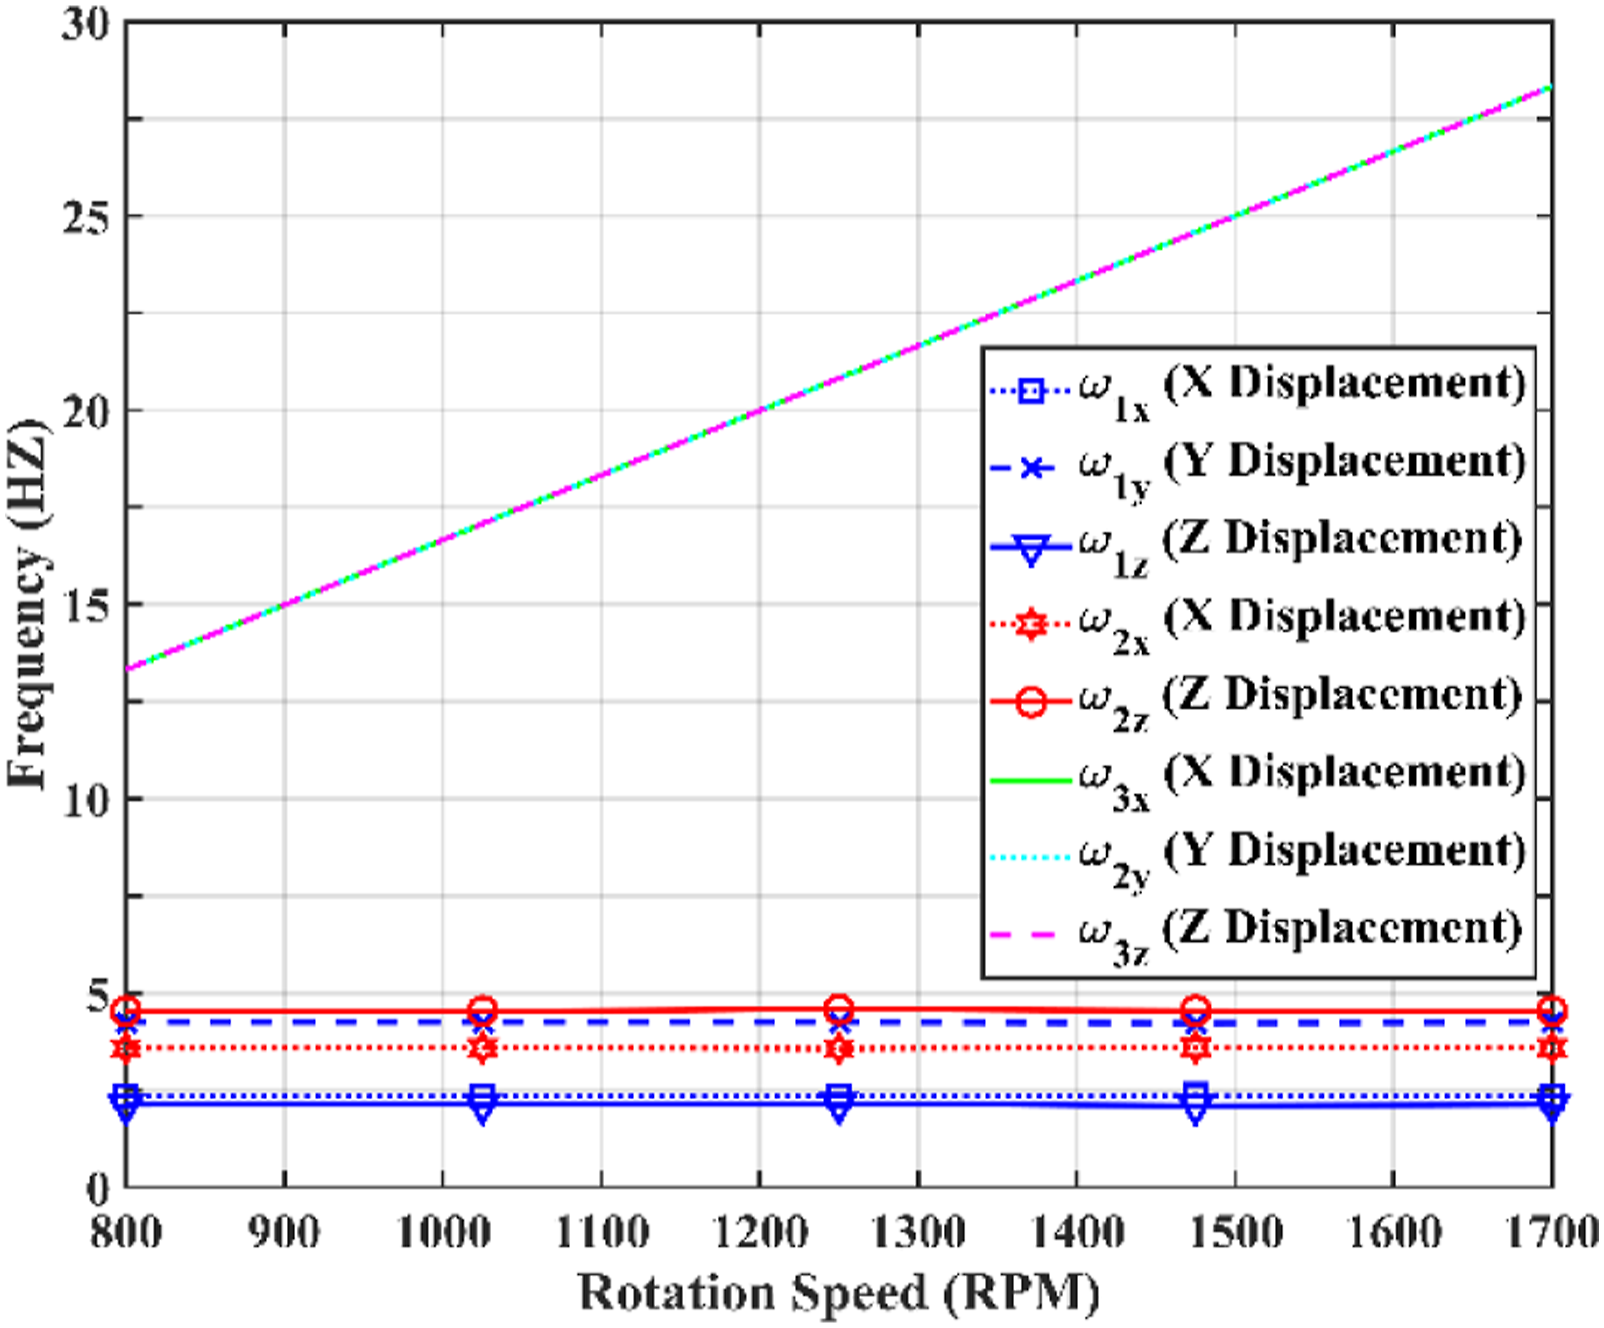
Effect of spring stiffness on natural frequencies
Keeping all other design variables at their standard values, the spring stiffness is varied from its minimum of 0.65 (kgf/mm) to the maximum of 1.75 (kgf/mm). As it is seen from Figure 8(a), the natural frequencies are flat or increase slightly as the spring stiffness increases. The front sensor X displacement amplitude-frequency plot confirms that the natural frequencies do not significantly change with the spring stiffness variation (see Figure 8(b)). Frequency variation with the spring stiffness.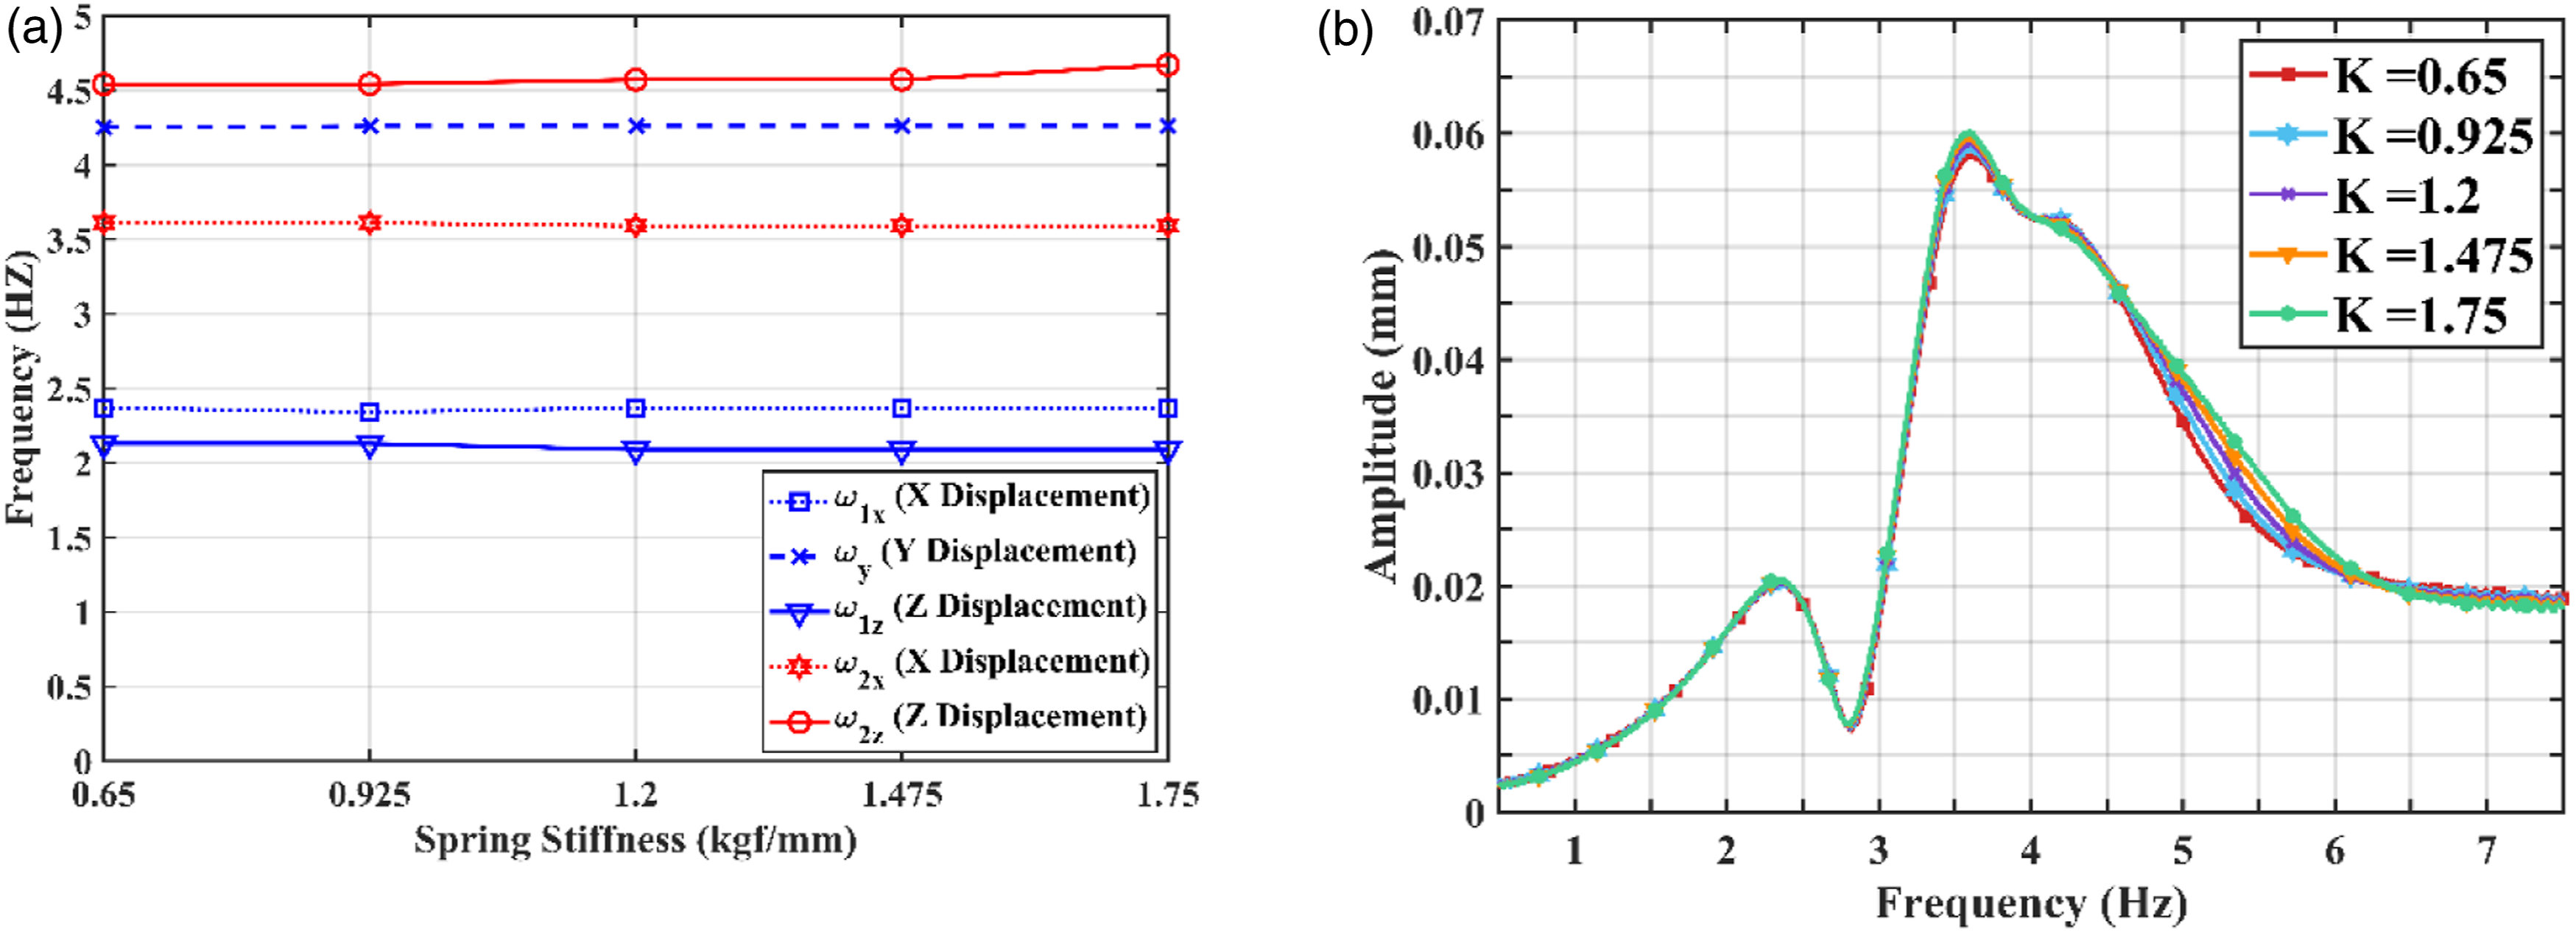
Effect of the front weight balancer mass density on natural frequencies
Keeping all other design variables at their standard values, the mass density of the front weight balancer is varied from its minimum of 4.07194E-06 Frequency variation with the front weight balancer mass density.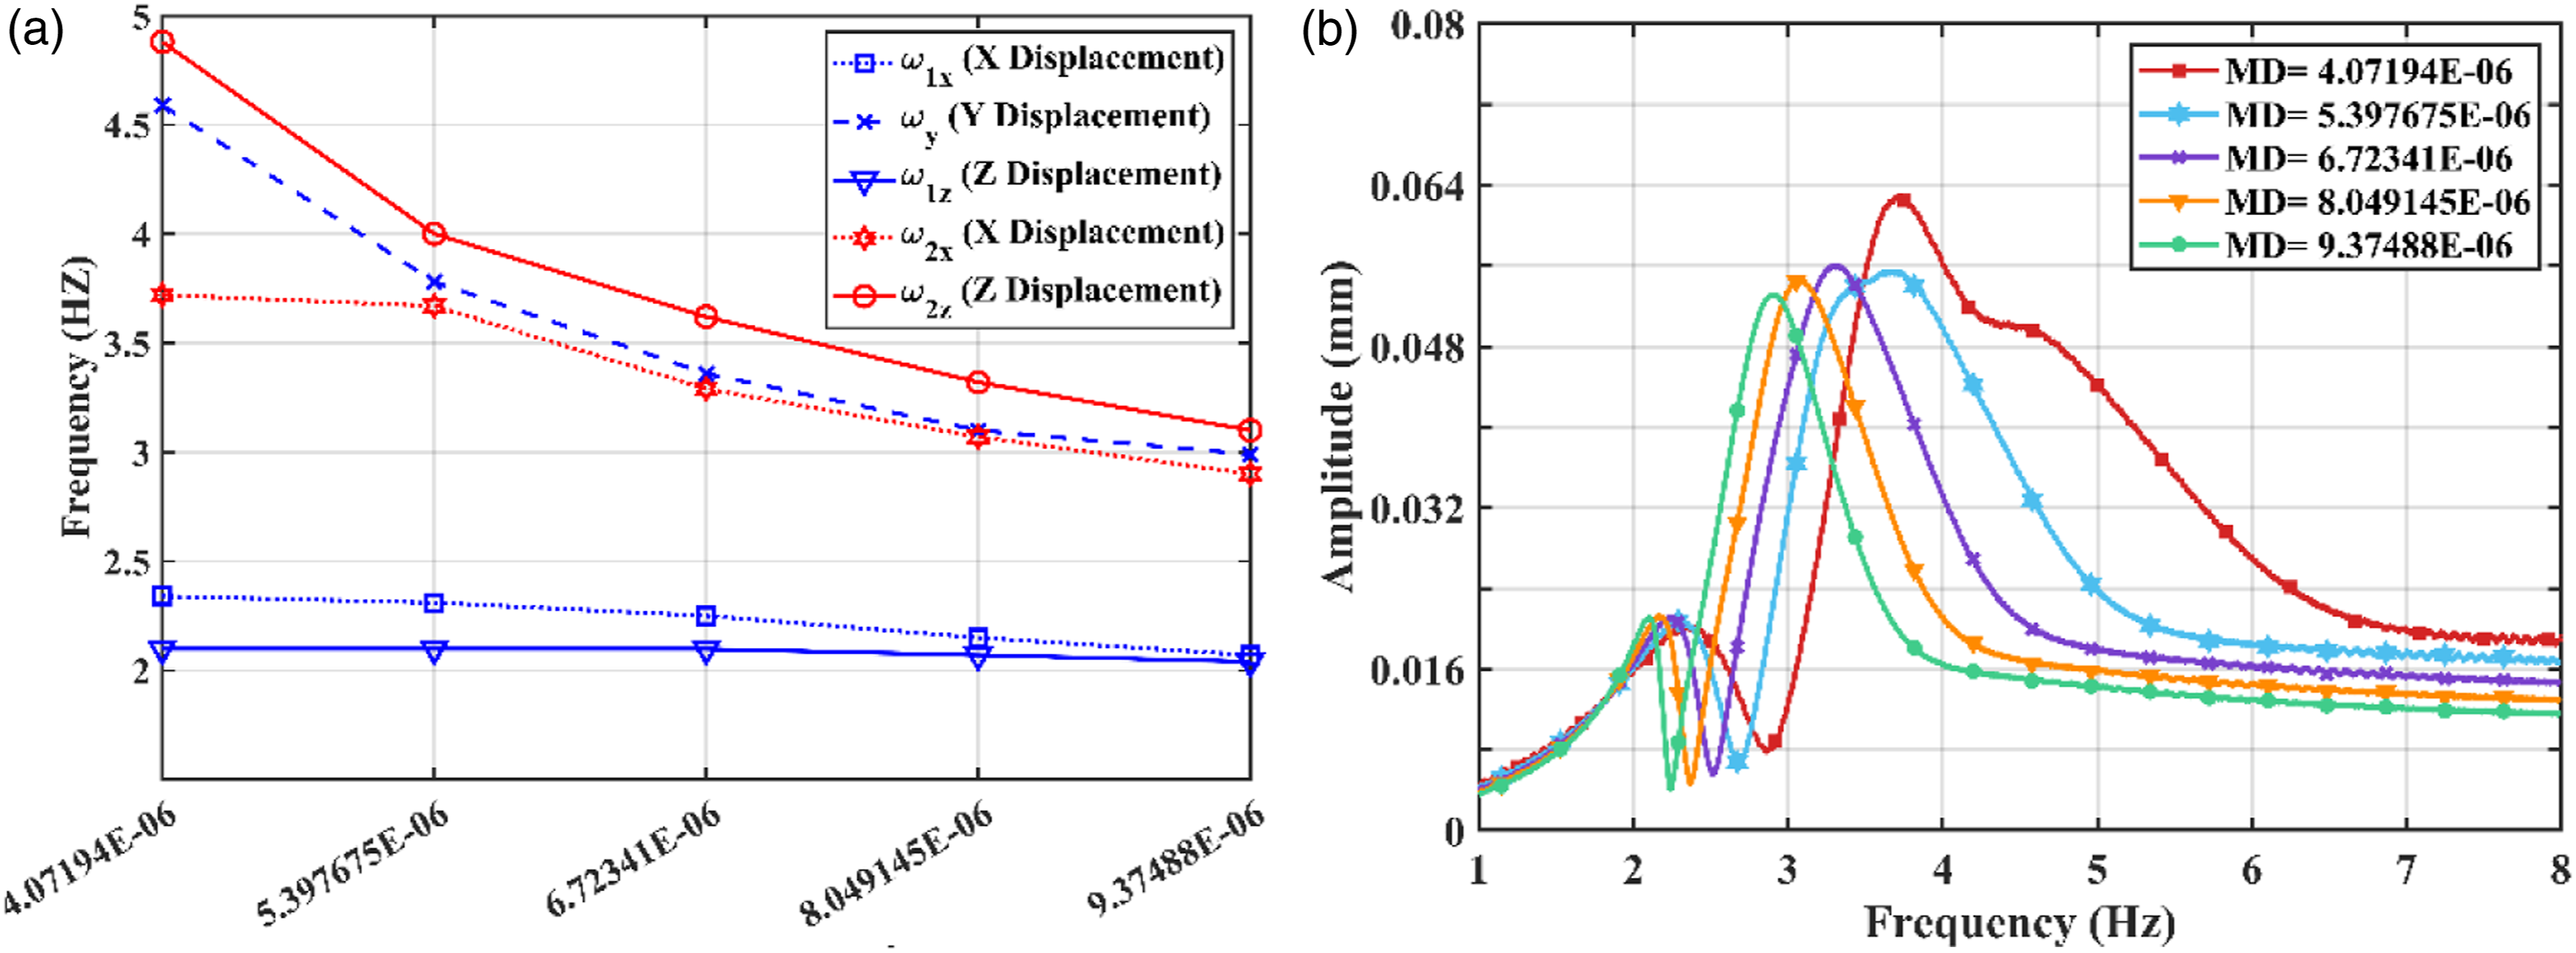
Effect of spring angle on natural frequencies
Keeping all other design variables at their standard value, the spring angle (introduced as Frequency variation with the spring angle.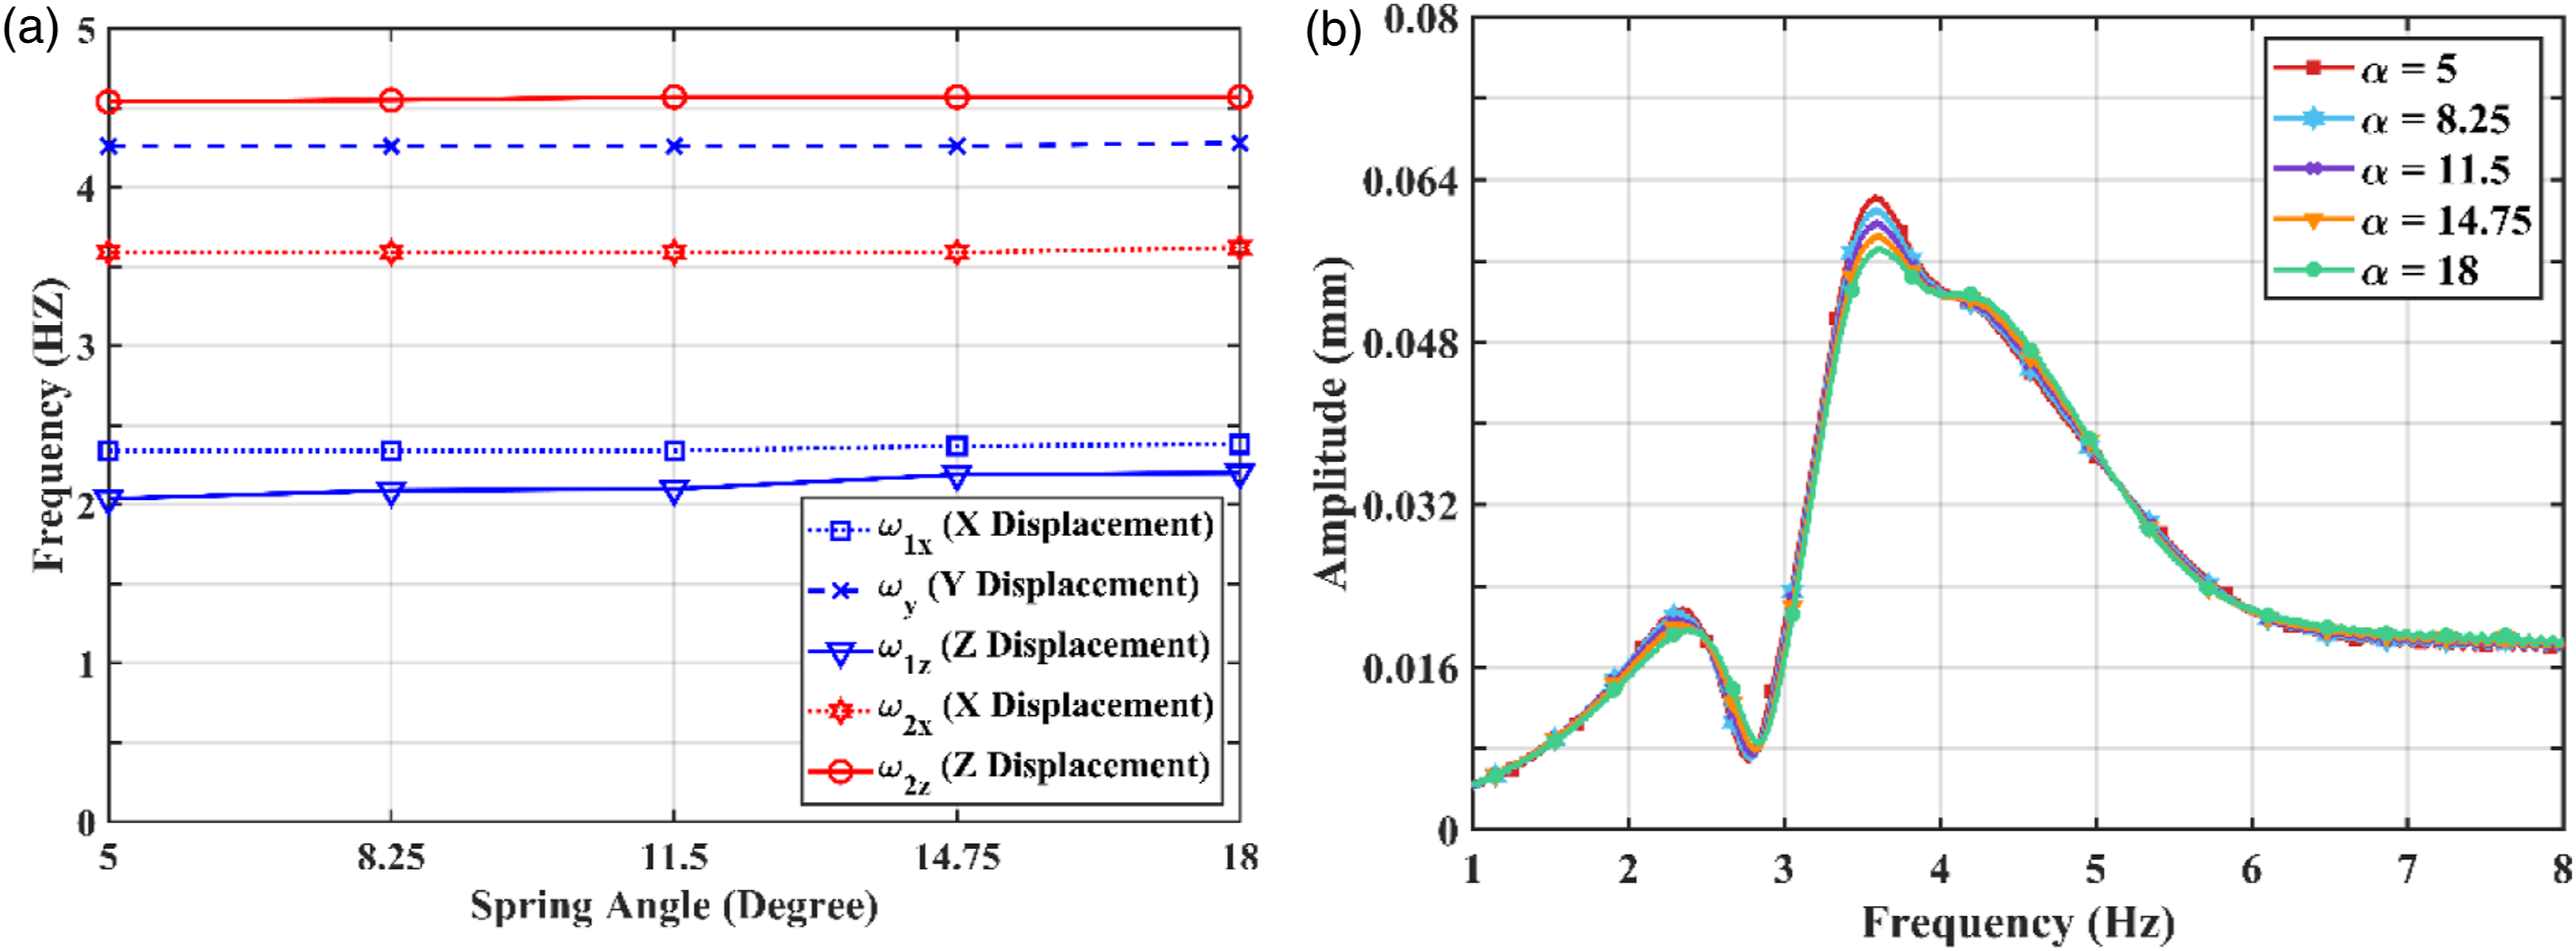
Effect of the front and rear damper side angles on natural frequencies
Keeping all other design variables at their standard values, the front damper side angle (introduced as Frequency variation with the front and rear dampers side angles.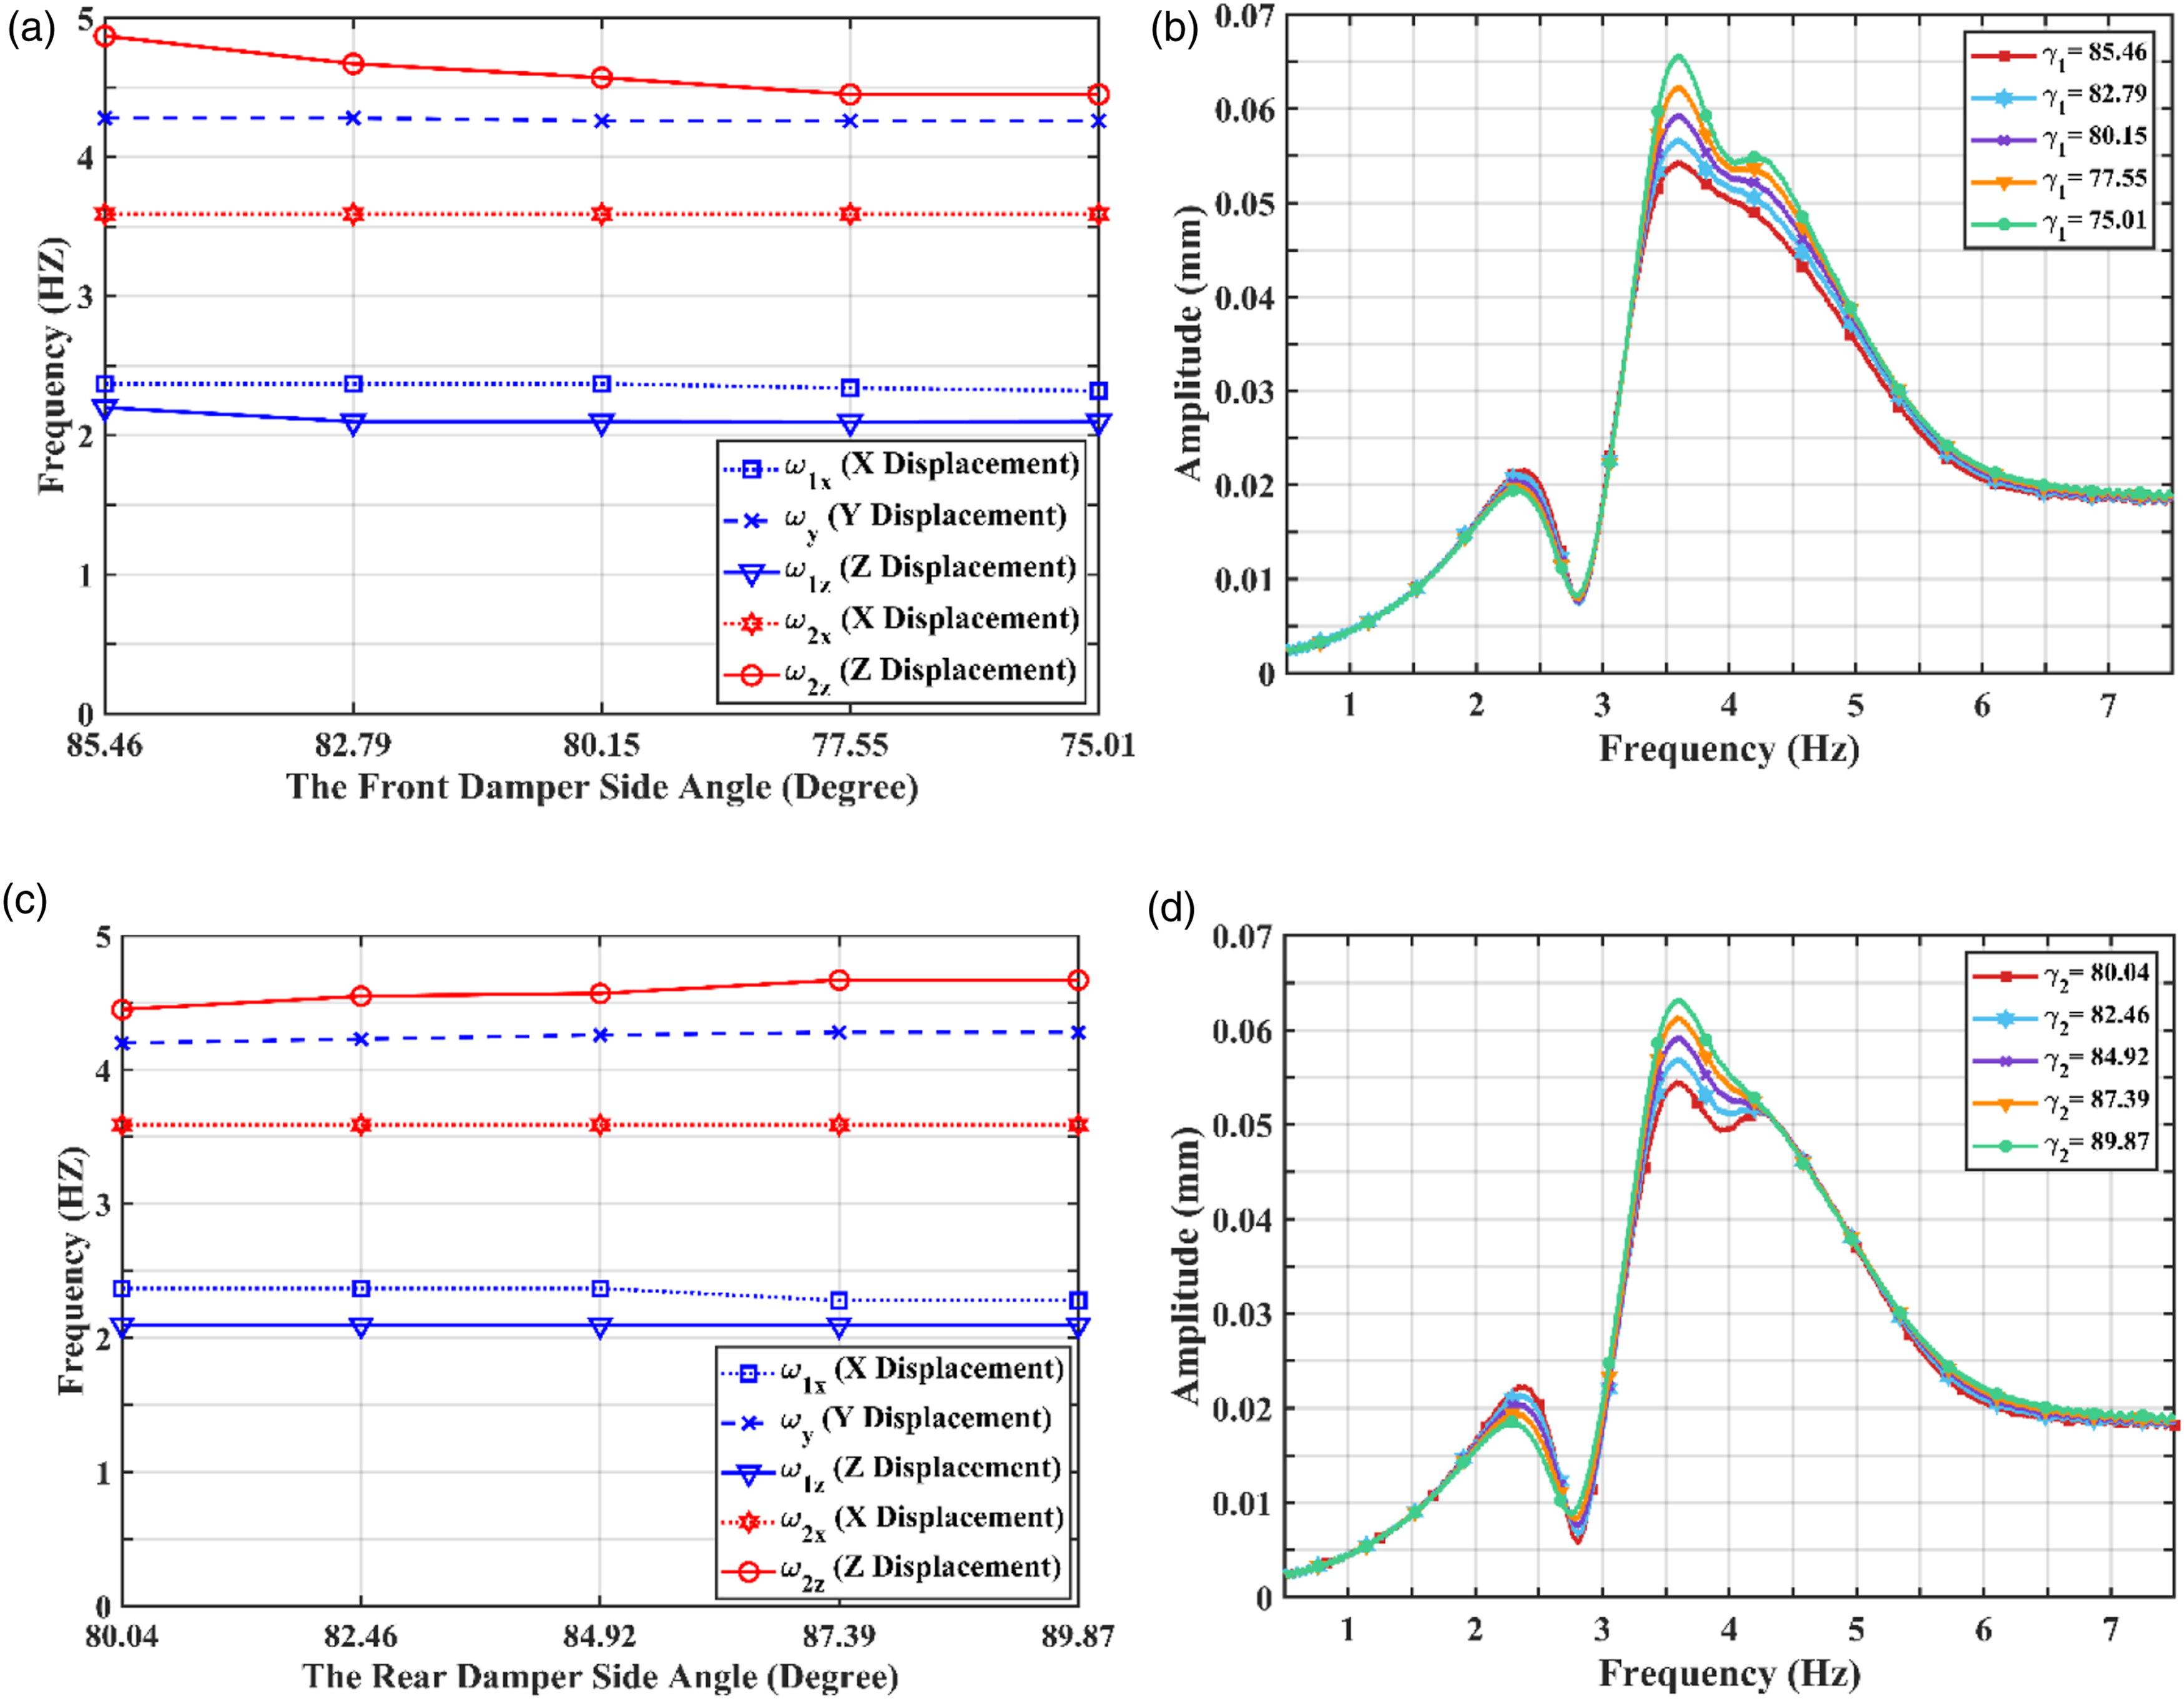
Effect of the front and rear damper front angles on natural frequencies
The front damper front angle (introduced as Frequency variation with the front and rear damper front angles.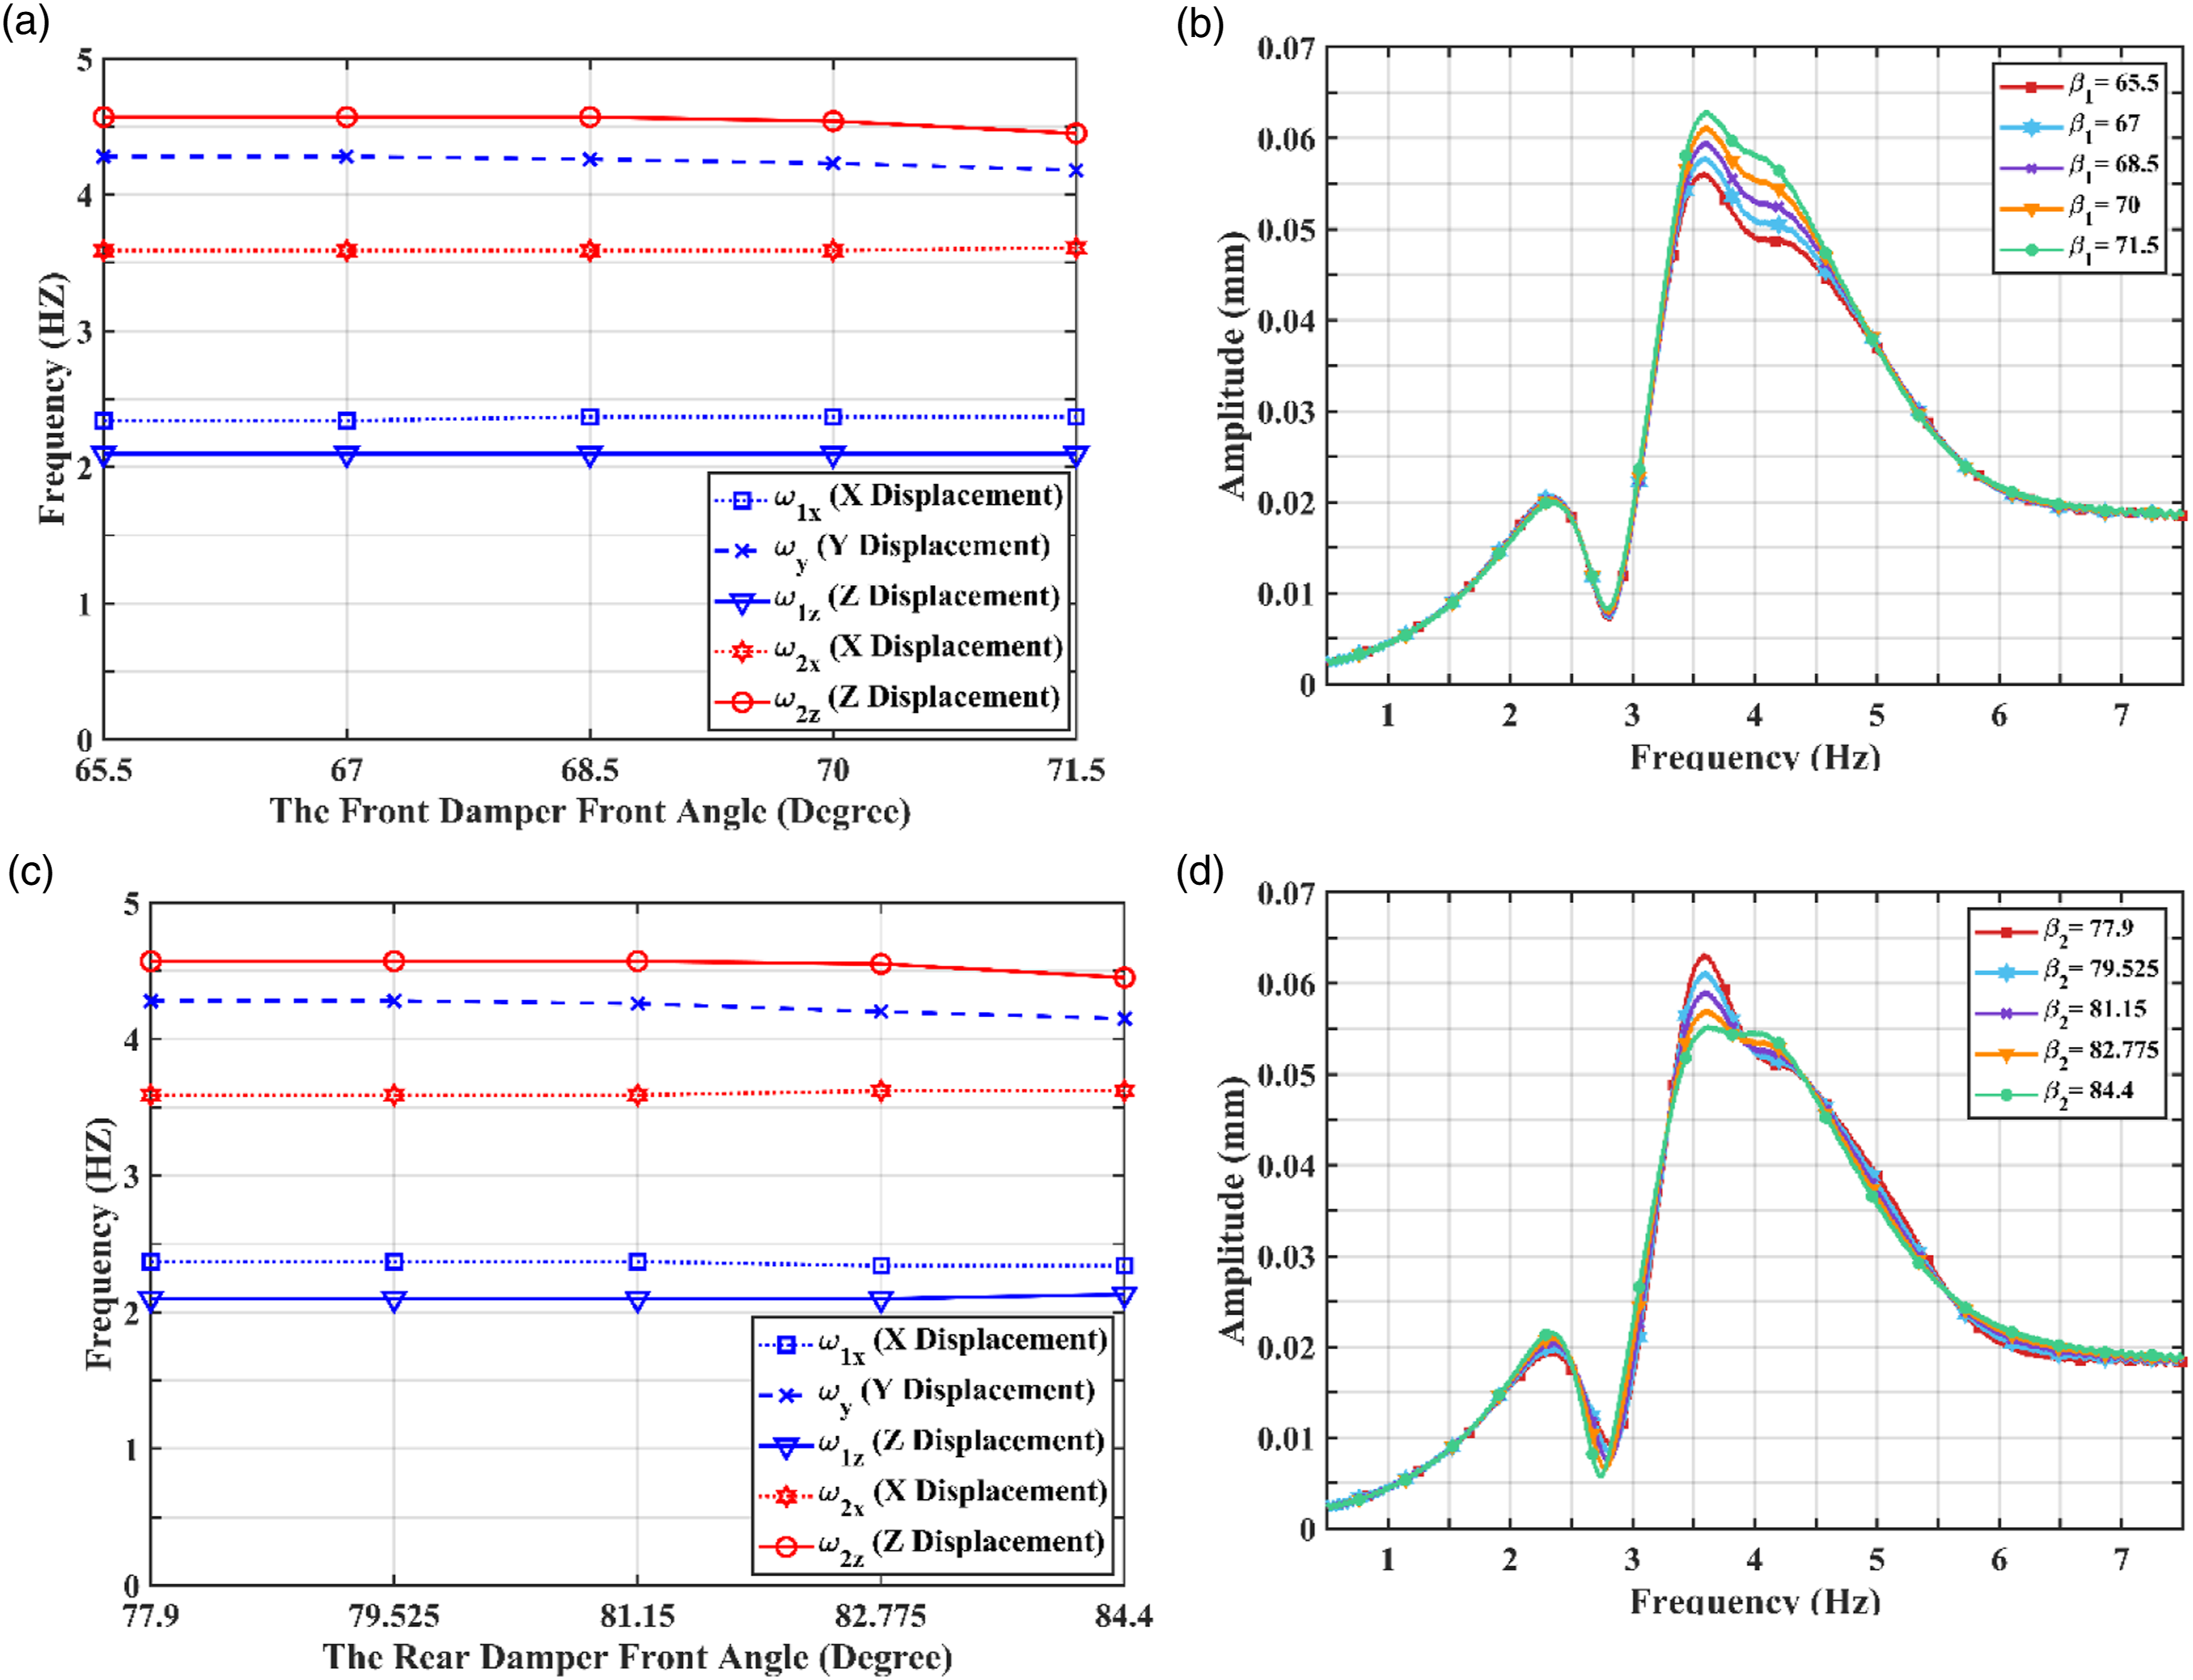
Effect of the damping coefficient on natural frequencies
The damping coefficient of all dampers is varied from its minimum value of 0 to its maximum value of 1.5 (kgf.s/mm) while all other design variables are kept unchanged and take their standard values. It can be seen from Figure 13(a) that while the natural frequencies Frequency variation with the damping coefficient.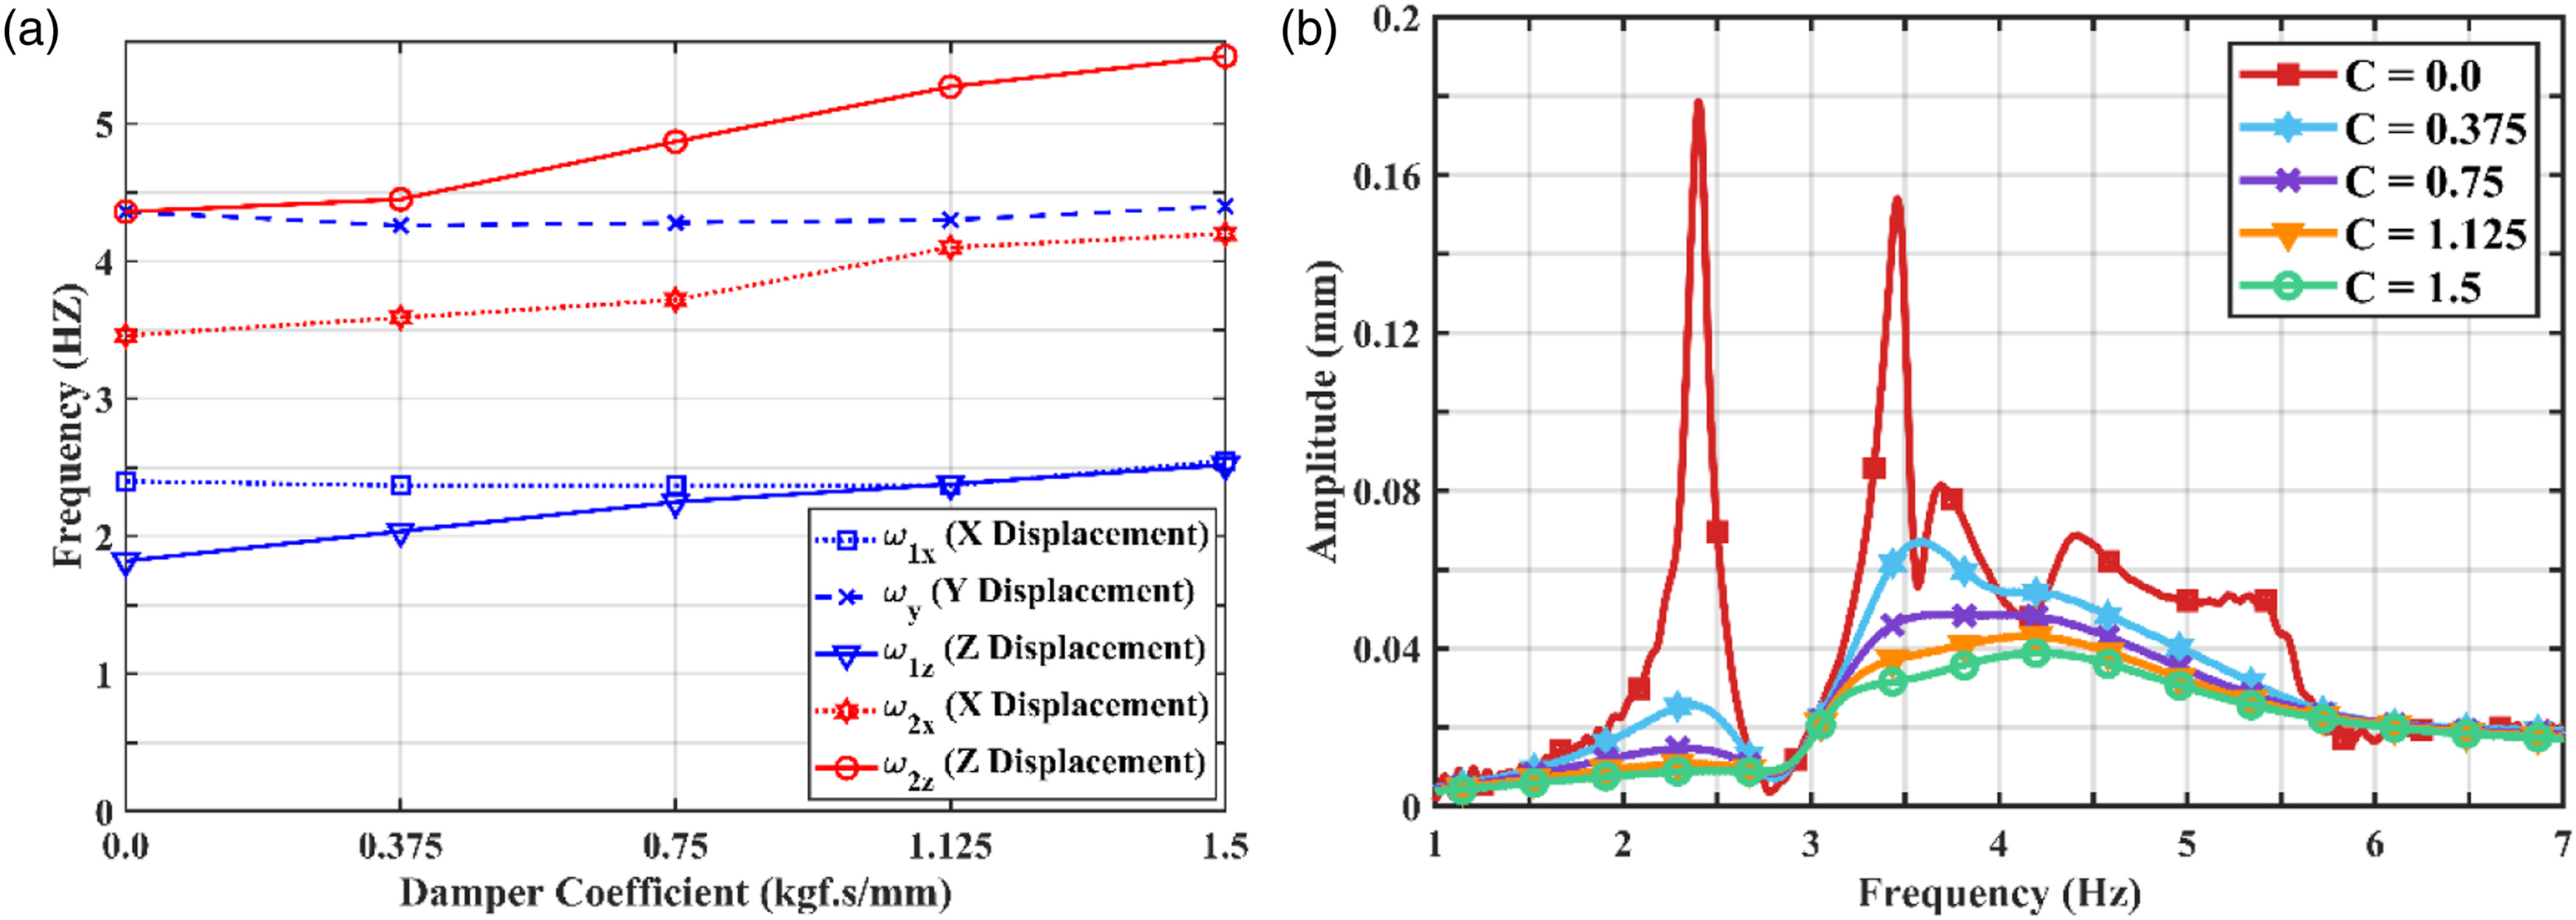
Sensitivity Analysis
As mentioned earlier, the simulation model with all design variables (DVs) set to their standard values is called the standard configuration. A sensitivity analysis is performed on the simulation results to study how the X, Y and Z displacement amplitudes at the front sensor location vary with a DV as its value is changed relative to the standard configuration while all other DVs hold their standard values. Since the displacement amplitudes vary with time during the washing machine operation, we will focus on the maximum displacement amplitudes in X, Y and Z directions, which can be taken as a measure of the effect of washing machine vibration during operation and will provide useful information in design optimizations to minimize the displacement amplitude during washing machine operation. To this end, the term “The maximum displacement sensitivity” for a displacement component along X, Y or Z direction is defined as the maximum displacement amplitude for a case in which a DV value deviates from its standard value minus the maximum displacement amplitude in the case of the standard configuration. As such, a maximum displacement sensitivity value of zero means the maximum displacement amplitude has no sensitivity to the DV in concern, and a nonzero maximum displacement sensitivity value means that the maximum displacement amplitude is sensitive to this DV—and the more the maximum displacement sensitivity value is away from zero, the higher the sensitivity.
Figure 14(a)–(h) below provide a summary of how the maximum displacement amplitude sensitivity for each of the three displacement X, Y and Z components varies with each of the nine DVs as the DV increases from its lower bound value to the upper bound value while the other DVs take their standard values. Based on the maximum displacement amplitude values obtained for the standard configuration and for configurations that deviate from the standard configuration, the maximum displacement sensitivity is calculated. In the figures presented below, the maximum X displacement amplitude is denoted by Results of sensitivity analysis with respect to different DVs.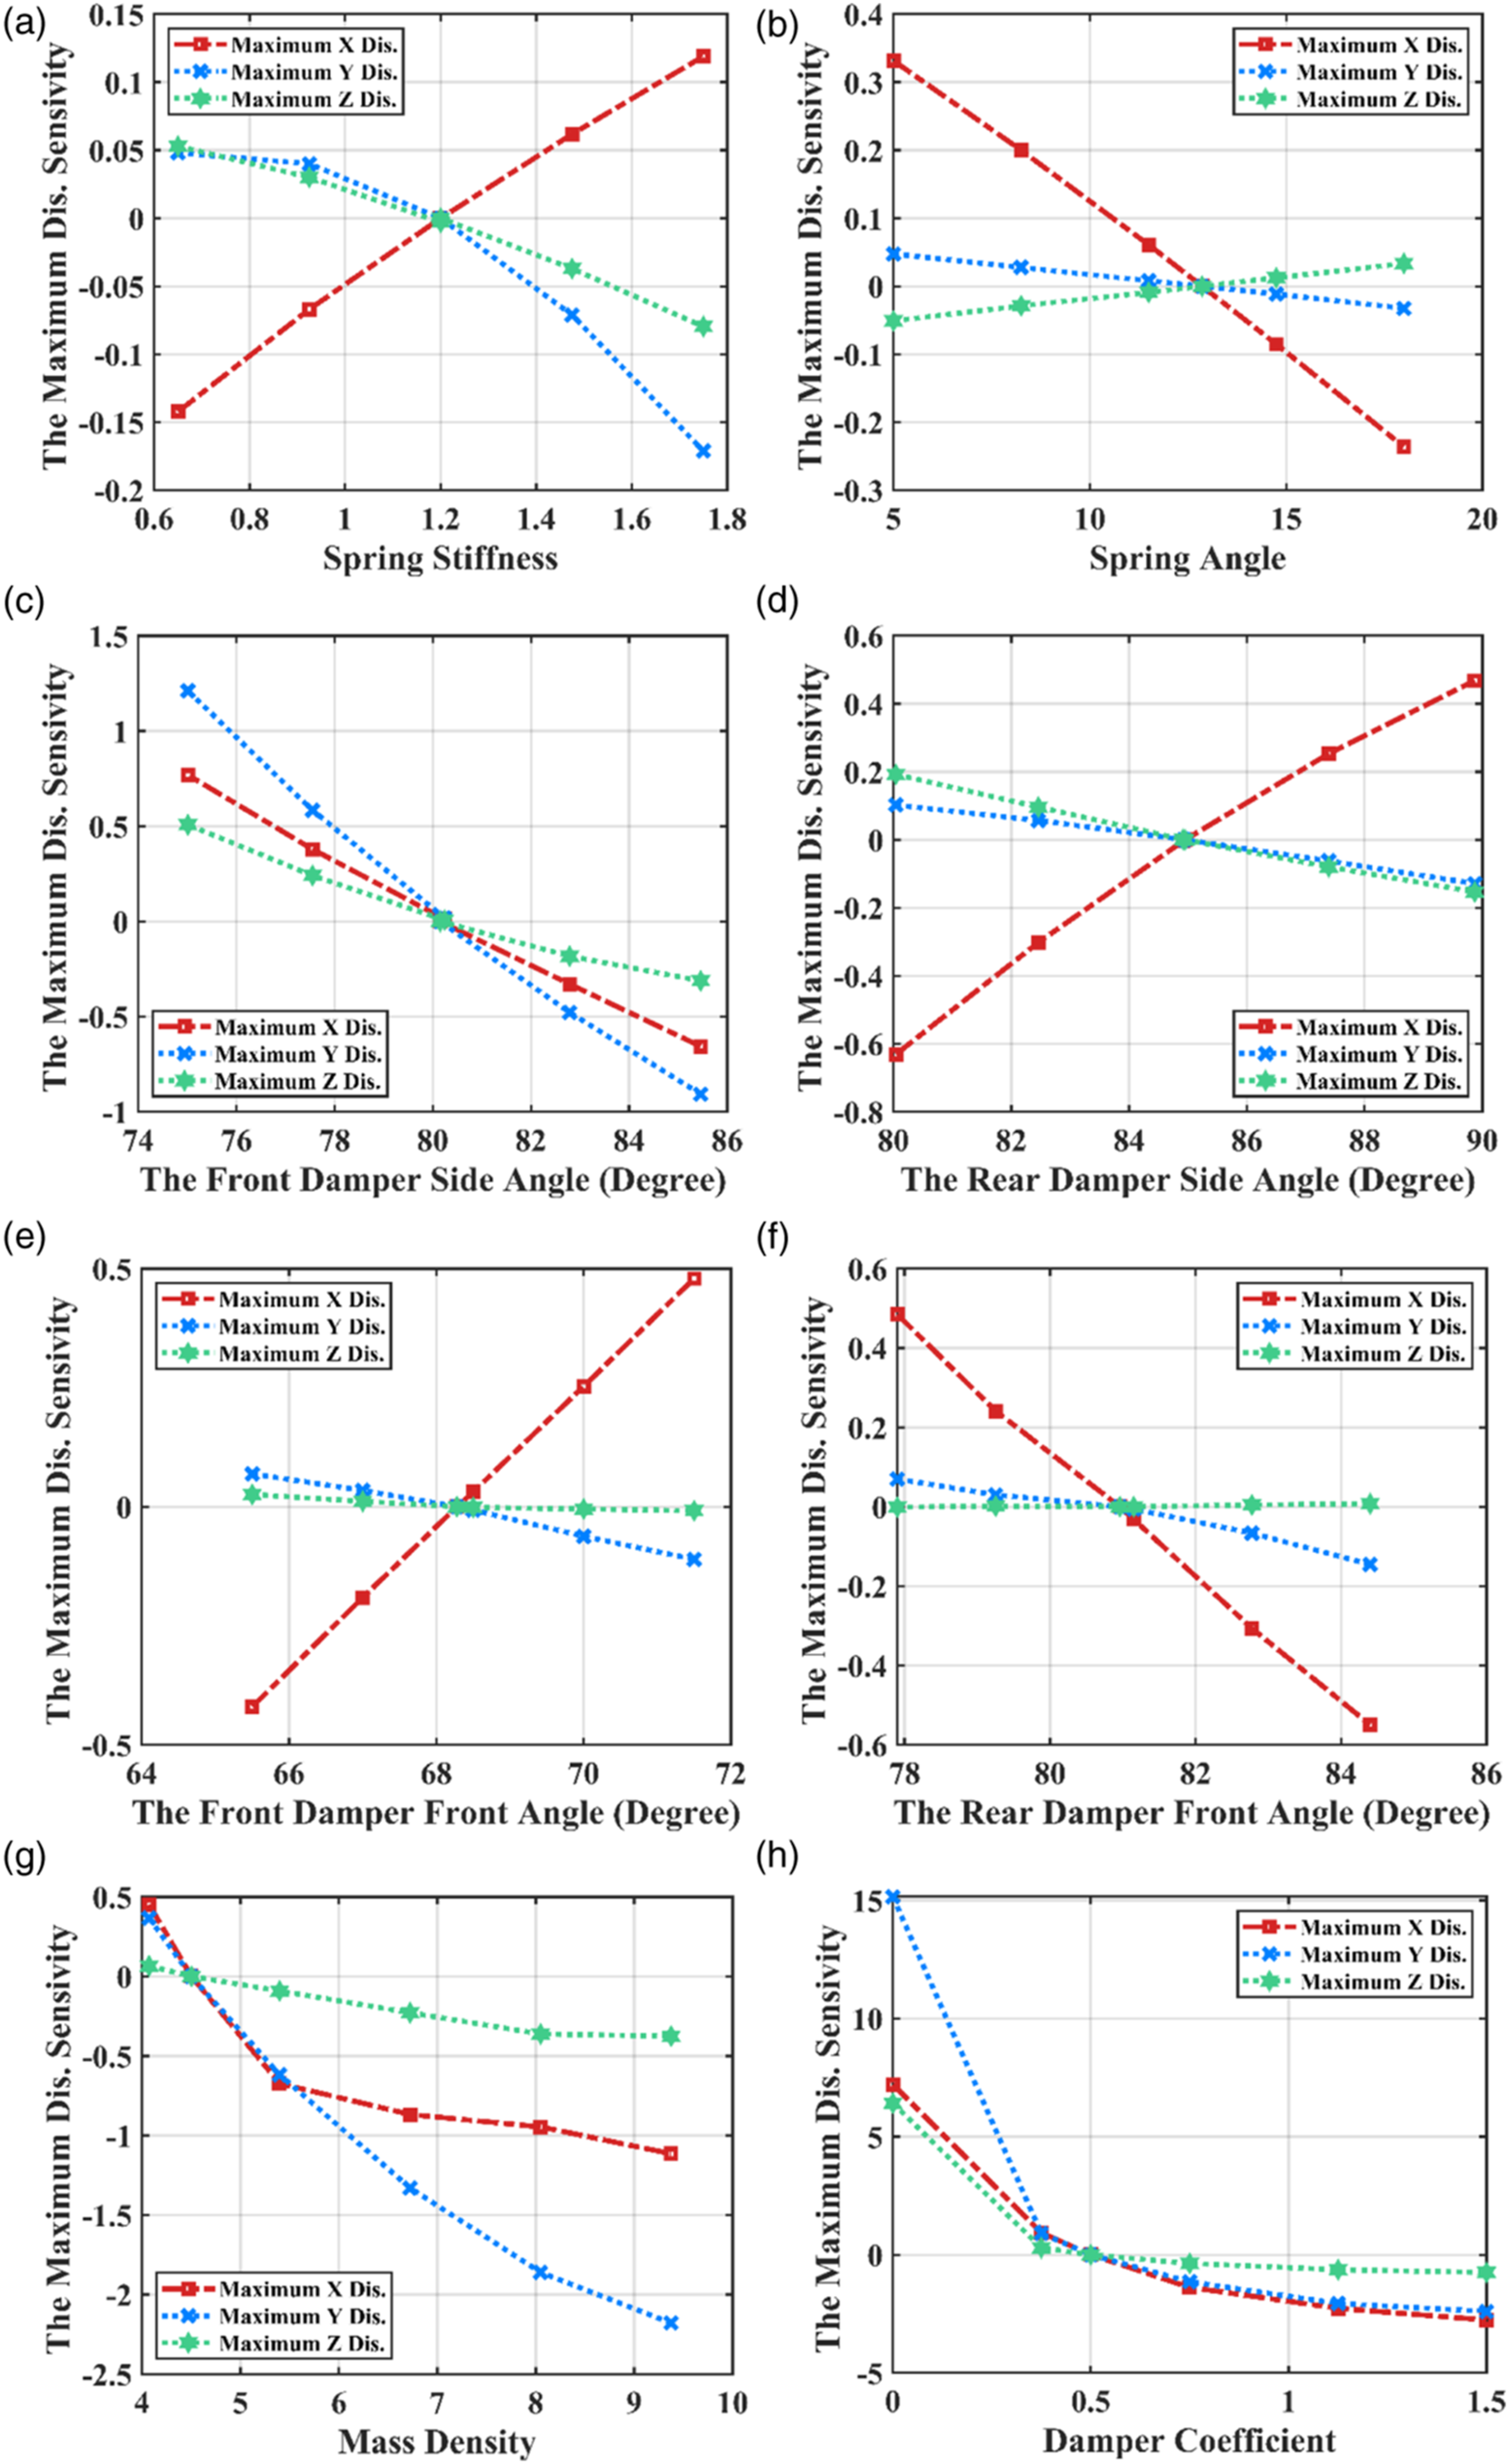
Figure 14(a) presents the maximum displacement amplitude sensitivity to the spring stiffness. It is seen that the maximum X, Y and Z displacement amplitudes are all sensitive to the spring stiffness. The maximum X displacement amplitude has the highest sensitivity.
Figure 14(b) shows the sensitivity to the spring angle (
Figure 14(c) reveals the maximum displacement amplitude sensitivity to the front damper side angle
Figure 14(d) illustrates the maximum displacement amplitude sensitivity to the rear dampers side angle
Figure 14(e) shows the maximum displacement amplitude sensitivity to the front damper front angle
Figure 14(f) presents the maximum displacement amplitude sensitivity to the rear damper front angle
Figure 14(g) shows the maximum displacement amplitude sensitivity to the mass density of the front weight balancer
Figure 14(h) reveals the maximum displacement amplitude sensitivity to the damping coefficient
A summary observation from Figure 14 is that all nine DVs affect the maximum X, Y Z displacement amplitudes, and the mass density of the front weight balancer (m) and the damping coefficient (C) have the strongest effects on the maximum X, Y Z displacement amplitudes within the parameter ranges considered in this study. Additional observations are given in the Conclusions section.
Conclusions
In this work, a front-loading washing machine with two springs and four dampers has been studied to understand the effects of various design variables on the dynamic behavior and vibration characteristics of the washing machine. This simulation-based investigation utilizes a multibody dynamics model of the washer using the commercial multibody simulation software Adams View to perform a series of numerical simulations. To facilitate a comprehensive parametric study, nine design variables (DVs) affecting the suspension structure of the washer have been implemented in the model with consideration of a range of parametric values for the DVs. From the simulation solutions of the washer operation from transient motion to steady-state motion, FFT analyses are performed on the time histories of displacements at select sensor locations to understand the effects of the DVs on the natural frequencies (NFs) of the washing machine. The sensitivity of the maximum X, Y and Z displacement amplitudes to the DVs is evaluated. The main results of this study are summarized below: • Of the nine DVs and the range of the parameter values considered, the mass density of the front weight balancer (m) and the damping coefficient of the dampers (C) have the strongest effects on the NFs. Other DVs have weak effects on the NFs. • The mass density of the front weight balancer and the damping coefficient also have the strongest effects on the maximum X, Y Z displacement amplitudes. • The NFs have the highest overall sensitivity to m and C. All NFs decrease as m increases and increase as C increases. • The maximum displacement amplitudes along X, Y Z directions are sensitive to all nine DVs. • The amplitude in the amplitude-frequency plot decreases quickly as the damping coefficient increases.
It is worth noting that, although experimental data are not available for direct validation of the results of the current study, there are published studies with findings that provide relevant support. For example, in the study by Chen and Zhang, 8 it was observed that the mass of the motor-drum-tub assembly was one of three most influential parameters. This observation is consistent with the result of the sensitivity analysis in the current study that the mass density of the weight balancer (which directly affects the tub assembly mass) was one of two parameters with the strongest effect on the dynamic response of the washer model. Also, in the study by Boyraz and Gündüz, 1 it was found that the damping coefficient was one of the most effective parameters affecting the steady state and vibration behavior of front-loading washers. In the current study, it was also found that the damping coefficient was one of two parameters with the strongest effect.
Footnotes
Declaration of conflicting interests
The author(s) declared no potential conflicts of interest with respect to the research, authorship, and/or publication of this article.
Funding
The author(s) disclosed receipt of the following financial support for the research, authorship, and/or publication of this article: This work was supported by The authors would like to thank Samsung Electronics, Co., LTD (10009279), and the South Carolina Department of Commerce (10009132).