
Abstract
The influences of the seat suspension on the comfort level, and stability of the bus driver are analyzed using a three-degree-of-freedom (3DOF) quarter-vehicle model. The influences are analyzed through the effects of seat suspension damping ratio ξ se on driver frequency weighted acceleration a w (m/s2) (comfort level) according to ISO 2631:1-1997 standard, the ratio of driver acceleration and gravitational acceleration a/g (vertical stability). With random excitation according to ISO 8608, considering the same vehicle speed value v (km/h) (in the region of 10 – 20 (km/h)), the decrease of ξ se increases the a w value, this result leads to the reduction of comfort level; Considering the same ξ se value, a w value decreases as increasing v value. With transient excitation according to IRC 99 – 1988, considering the same v value, the smaller ξ se creates the larger a/g value; Considering the same ξ se , the value of a/g increases and reaches the extreme in the vehicle speed range 20 – 30 (km/h), outside this speed range the value of a/g decrease.
Introduction
Bus drivers work many hours daily, continuously exposed to whole-body vibration while operating vehicles.1,2 Vibration mostly comes from the uneven road surface, the engine, acceleration and deceleration.3,4 This vibration affects the driver’s productivity, feelings, and health.1,2,5,6 The driver seat’s suspension system is an essential structure that directly affects the above factors.7–10 The suspension system can deform to absorb vibration and improve comfort level. However, this effect decreases the driver’s vertical stability by changing the relative position between the seat surface and the steering wheel.9,10
Computational simulation models are proposed to optimize the driver seat’s suspension system to ensure effective vibration isolation and stability.11–15 Optimizing the bus driver seat’s suspension system with a 10DOF whole-vehicle model subjected to harmonic and random excitation signals. 11 Improving the driver seat’s suspension system performance using a 1DOF model with a vibration absorber under random excitation signals. 12 Optimizing the behaviour of the driver and the seat suspension system through optimizing the vehicle suspension system with a 3DOF quarter-vehicle model subjected to random excitation signals. 13 Research to improve comfort and reduce the impact of vibration on driver’s health with a 12DOF bus model. 14 Optimizing the driver acceleration response and relative displacement of the seat suspension system with a decomposed driver model using a 7DOF model under random excitation. 15
The above studies simplify the technical specifications of the elements that make up the driver’s seat suspension system, such as the stiffness of elastic elements and the damping coefficients of dampers in the form of constants. The behaviour of an elastic element, like an air spring, under the effect of external forces is nonlinear and can be determined through experimental measurements.9,10 Besides, the above studies11–15 ignore the guiding mechanism’s kinematic influence or set a constant reduction ratio for all working situations. 9 In reality, the force transmission direction of the elastic and damping elements changes according to the relative displacement of the suspension system through the guiding mechanism, so it is necessary to incorporate the dynamics of the guiding mechanism into the calculation model to achieve high accuracy.
Passive seat suspension systems are commonly used on buses in Vietnam. However, investigating and calculating research to determine optimal technical parameters for specific working cases for seat suspension systems in Vietnam still have not been focused. Most studies use simple models with elastic element - damper acting in the vertical direction only and do not consider the kinematic influences of the guiding mechanism. In addition, the actual nonlinearity in the behaviour of the air spring concerning deformation has not been explored in depth for a specific suspension system. Therefore, this study models a seat suspension system with a nonlinear air spring with technical parameters measured from experiments; the damping force transmission direction change according to the model’s kinematics is combined. From there, the model specifications according to operating cases are clearly analyzed.
Simulation model and model parameters
Simulation model
DOF quarter-vehicle model
Where:
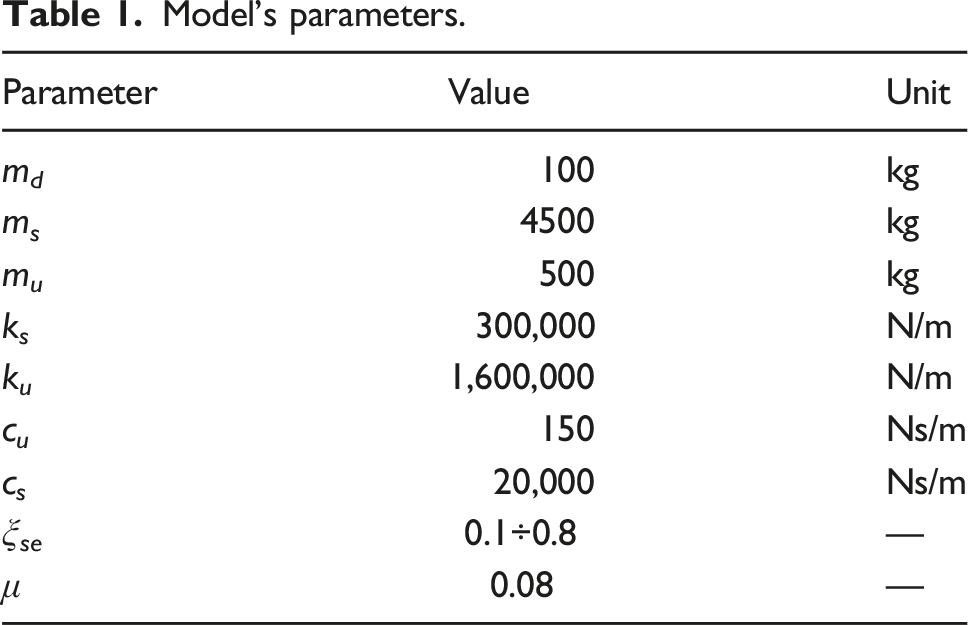
m u , m s , m d : The mass of the unsuspended part, the vehicle’s body and the total mass of the driver and seat frame (kg), respectively
c u , c s , c d : The damping coefficient of the wheel, the damping elements of the vehicle suspension, and the seat suspension (Ns/m), respectively
k u , k s , k d : The stiffness of the wheel, the elastic elements of the vehicle suspension, and the seat suspension (N/m), respectively
x u , x s , x d : The vertical displacement of the unsuspended part, the vehicle’s body and the driver (m), respectively
y (t): The vertical excitation over time (m)
α, φ: The angle between the guide bar, damper, and horizontal (degree), respectively.
g: Gravitational acceleration (m/s2)
μ: Friction coefficient between slider and sliding rails
The 3DOF quarter-vehicle model analyzes the vibration of the driver and the seat suspension system subjected to excitation y (t), as described in Figure 1. The seat suspension system has a scissor-shaped guide mechanism installed on the vehicle floor. The seat suspension system has an elastic element in the form of an air spring with nonlinear stiffness k
d
and a damping element in the form of a hydraulic damper with a damping coefficient c
d
. This study investigates the influences of c
d
through the seat suspension damping ratio ξ
se
. 3DOF quarter-vehicle model with driver seat’s suspension system.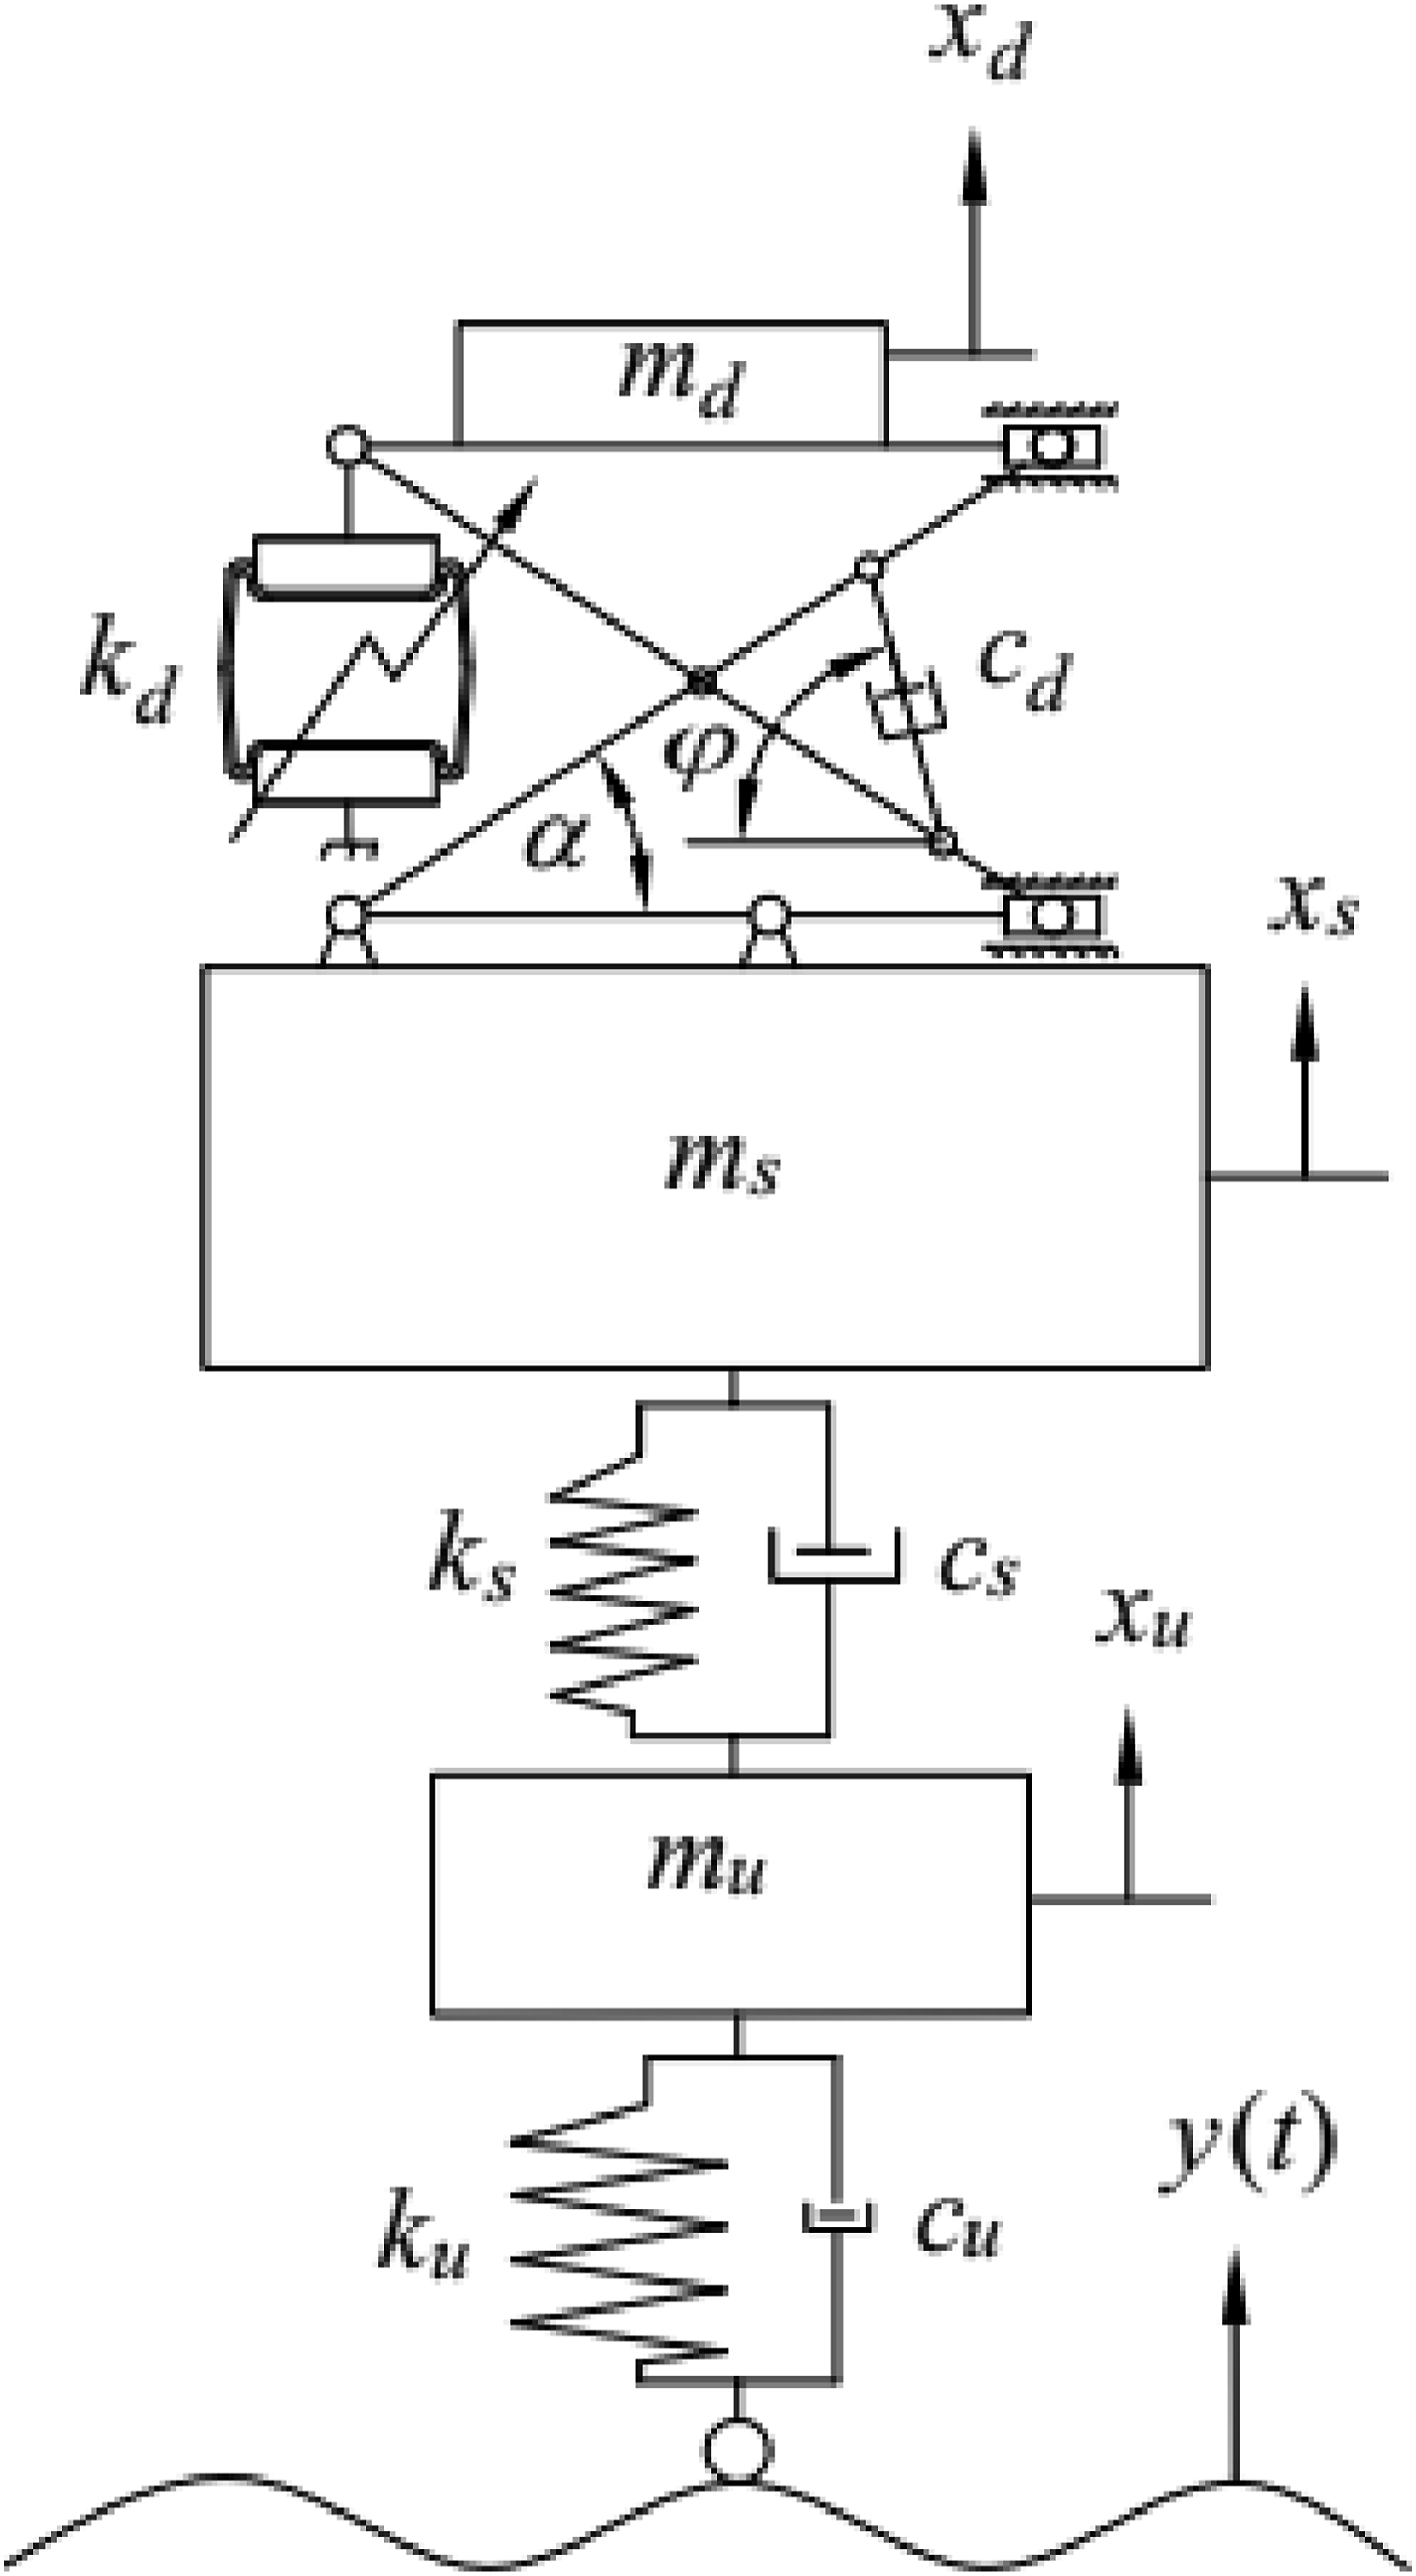
Mathematical model
Equivalent model
The values of α và φ over time can be calculated as eq. (1) and eq. (2).

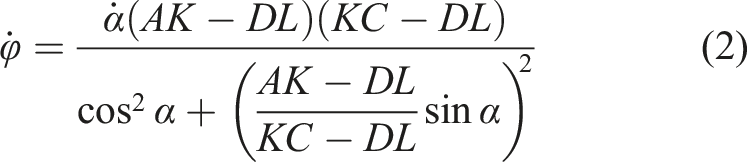
The seat suspension system model with a scissor-shaped guide mechanism has a damper installed on the guide wings at positions K and L and an air spring installed below the seat surface frame at position B. These elements create damping force F c and elastic force F bh that prevent the system’s movement. Perform joint separation at the connection positions A, B, C, D, K, and L to obtain a reaction force model, Figure 3.
Where:
F Ax , F Ay , FBx1, FBy1, FBx2, FBy2, FCy1, FCy2, F Dy : Reaction force (N) in x and y directions at joints A, B, C and D, respectively
F msC1 , F msC2 , F msD2 : Friction force between slider and sliding rail at joints C, D, respectively
Perform kinematic and dynamic analysis of the model in Figure 2 according to the diagram in Figure 3 to obtain the dynamic differential equation of the seat suspension system eq. (3). The equivalent seat suspension model with the kinematic conversion factors of the damping and elastic elements U, V. Kinematic and dynamic analysis model of the seat suspension system.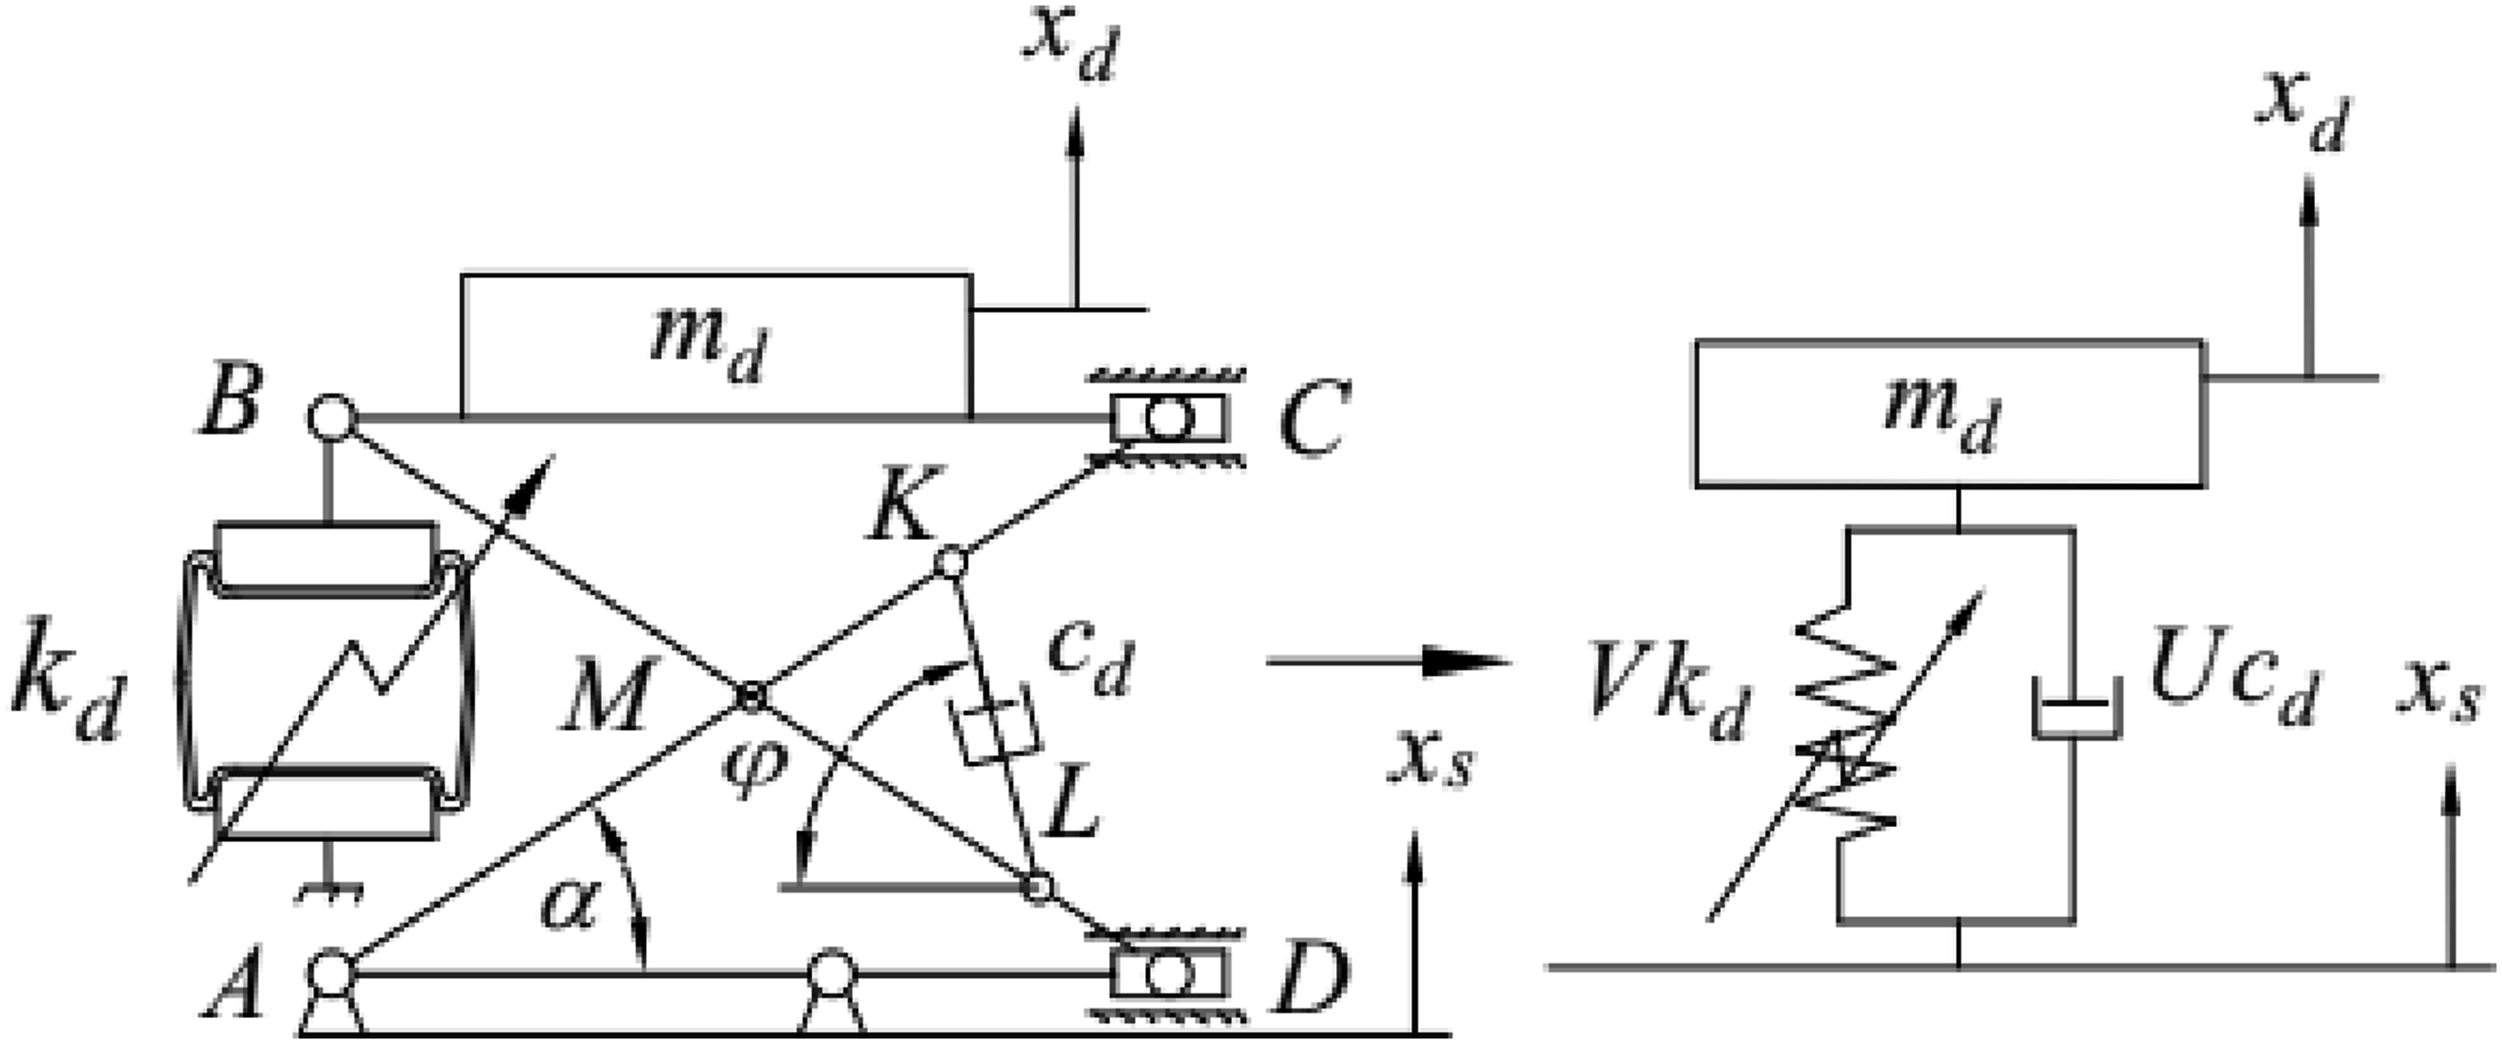


The value v
KL
is the relative velocity between point K and point L in the direction of KL, calculated as Eq. (4). Both Eq. (3) and Eq. (4) have modelling time’s step based on the step of excitation time y (t) 0.001 (s).

The equivalent damping force and elastic force acting on m
d
in the vertical direction can be converted from F
c
and F
bh
with the conversion factors U and V calculated according to Eq. (5)–(7), respectively.


System dynamics equation
Applying Newton’s II law according to the force analysis diagram at the mass elements m
u
, m
s
, and m
d
in Figure 4 to obtain the system’s dynamic differential equations Eq. (8): Free body diagram of the driver, sprung and un-sprung mass elements.


Nonlinear air spring model
Experimental method
The experimental model in Figure 5 with initial parameters shown in Figure 6, such as compression pressure (gauge) P0 = 1 (bar), volume V0 = 7.05 × 10⁻⁴ (m3), height h0 = 0.14 (m), and excitation signal with amplitude A
x
= 0.025 (m), excitation frequency f = 0.01 (Hz). Experimental model for measuring driver seat’s air spring parameters. Frequency weighting filter w
k
.
2

Air spring stiffness calculation
The air spring reaction force F
bh
(N) can be calculated through the pressure (gauge) inside the air spring P (N/m2) and the equivalent area A
ef
(m2) as Eq. (9).
16

A polytropic process is assumed for the experiment of air spring with polytropic index γ = 1.2.
16
The relationship between the pressure P (N/m2) inside the air spring and the volume V (m3) containing air is calculated according to Eq. (10) with the atmosphere pressure P
at
= 105 (N/m2).
16

The stiffness of the air spring k
d
(N/m) is the derivative of the force F
bh
(N) with the deformation z (m), Figure 6, calculated according to Eq. (11).
16

Linear asymmetric damper model
The linear asymmetric damper model describes the reaction behaviour of the damping element of the seat suspension according to relative speed v. 17
The mathematical model describing the characteristics of the damping coefficient of the asymmetric damper is calculated as Eq. (12).
17
+ β = 7/3: The damper asymmetric ratio
17
+ c0: The selected symmetric damping coefficient value (N.s/m), calculated corresponding to the damping ratio ξ
se
as Eq. (13).
18
k
d_eq
: Air spring stiffness at the equilibrium position (N/m) U
eq
: Conversion factor at the equilibrium position


Calculation parameters
Input parameters
Excitation signal
Random excitation signal
The random excitation signal (C class) y (t) (m) is simulated according to ISO 8608 standard
19
with the mathematical model Eq. (14). Ω
i
: The wavenumbers that are chosen to lie at N equal intervals ψ
i
: The different sets of uniformly distributed phase angles in the range between 0 and 2π (rad)

Φ0: the value of the power spectral density at the reference wavenumber Ω0 = 1 (rad/m) w = 2: the drop in magnitude
Transient excitation signal
The transient excitation signal y (t) (m) is simulated according to IRC 99-1988 standard
20
with the mathematical model Eq. (16), where d1 = 3.7 (m), d2 = 0.1 (m) and vehicle’s velocity v (km/h).
Assessment standards
Comfort level

Driver comfort estimation under different acceleration intensities. 2

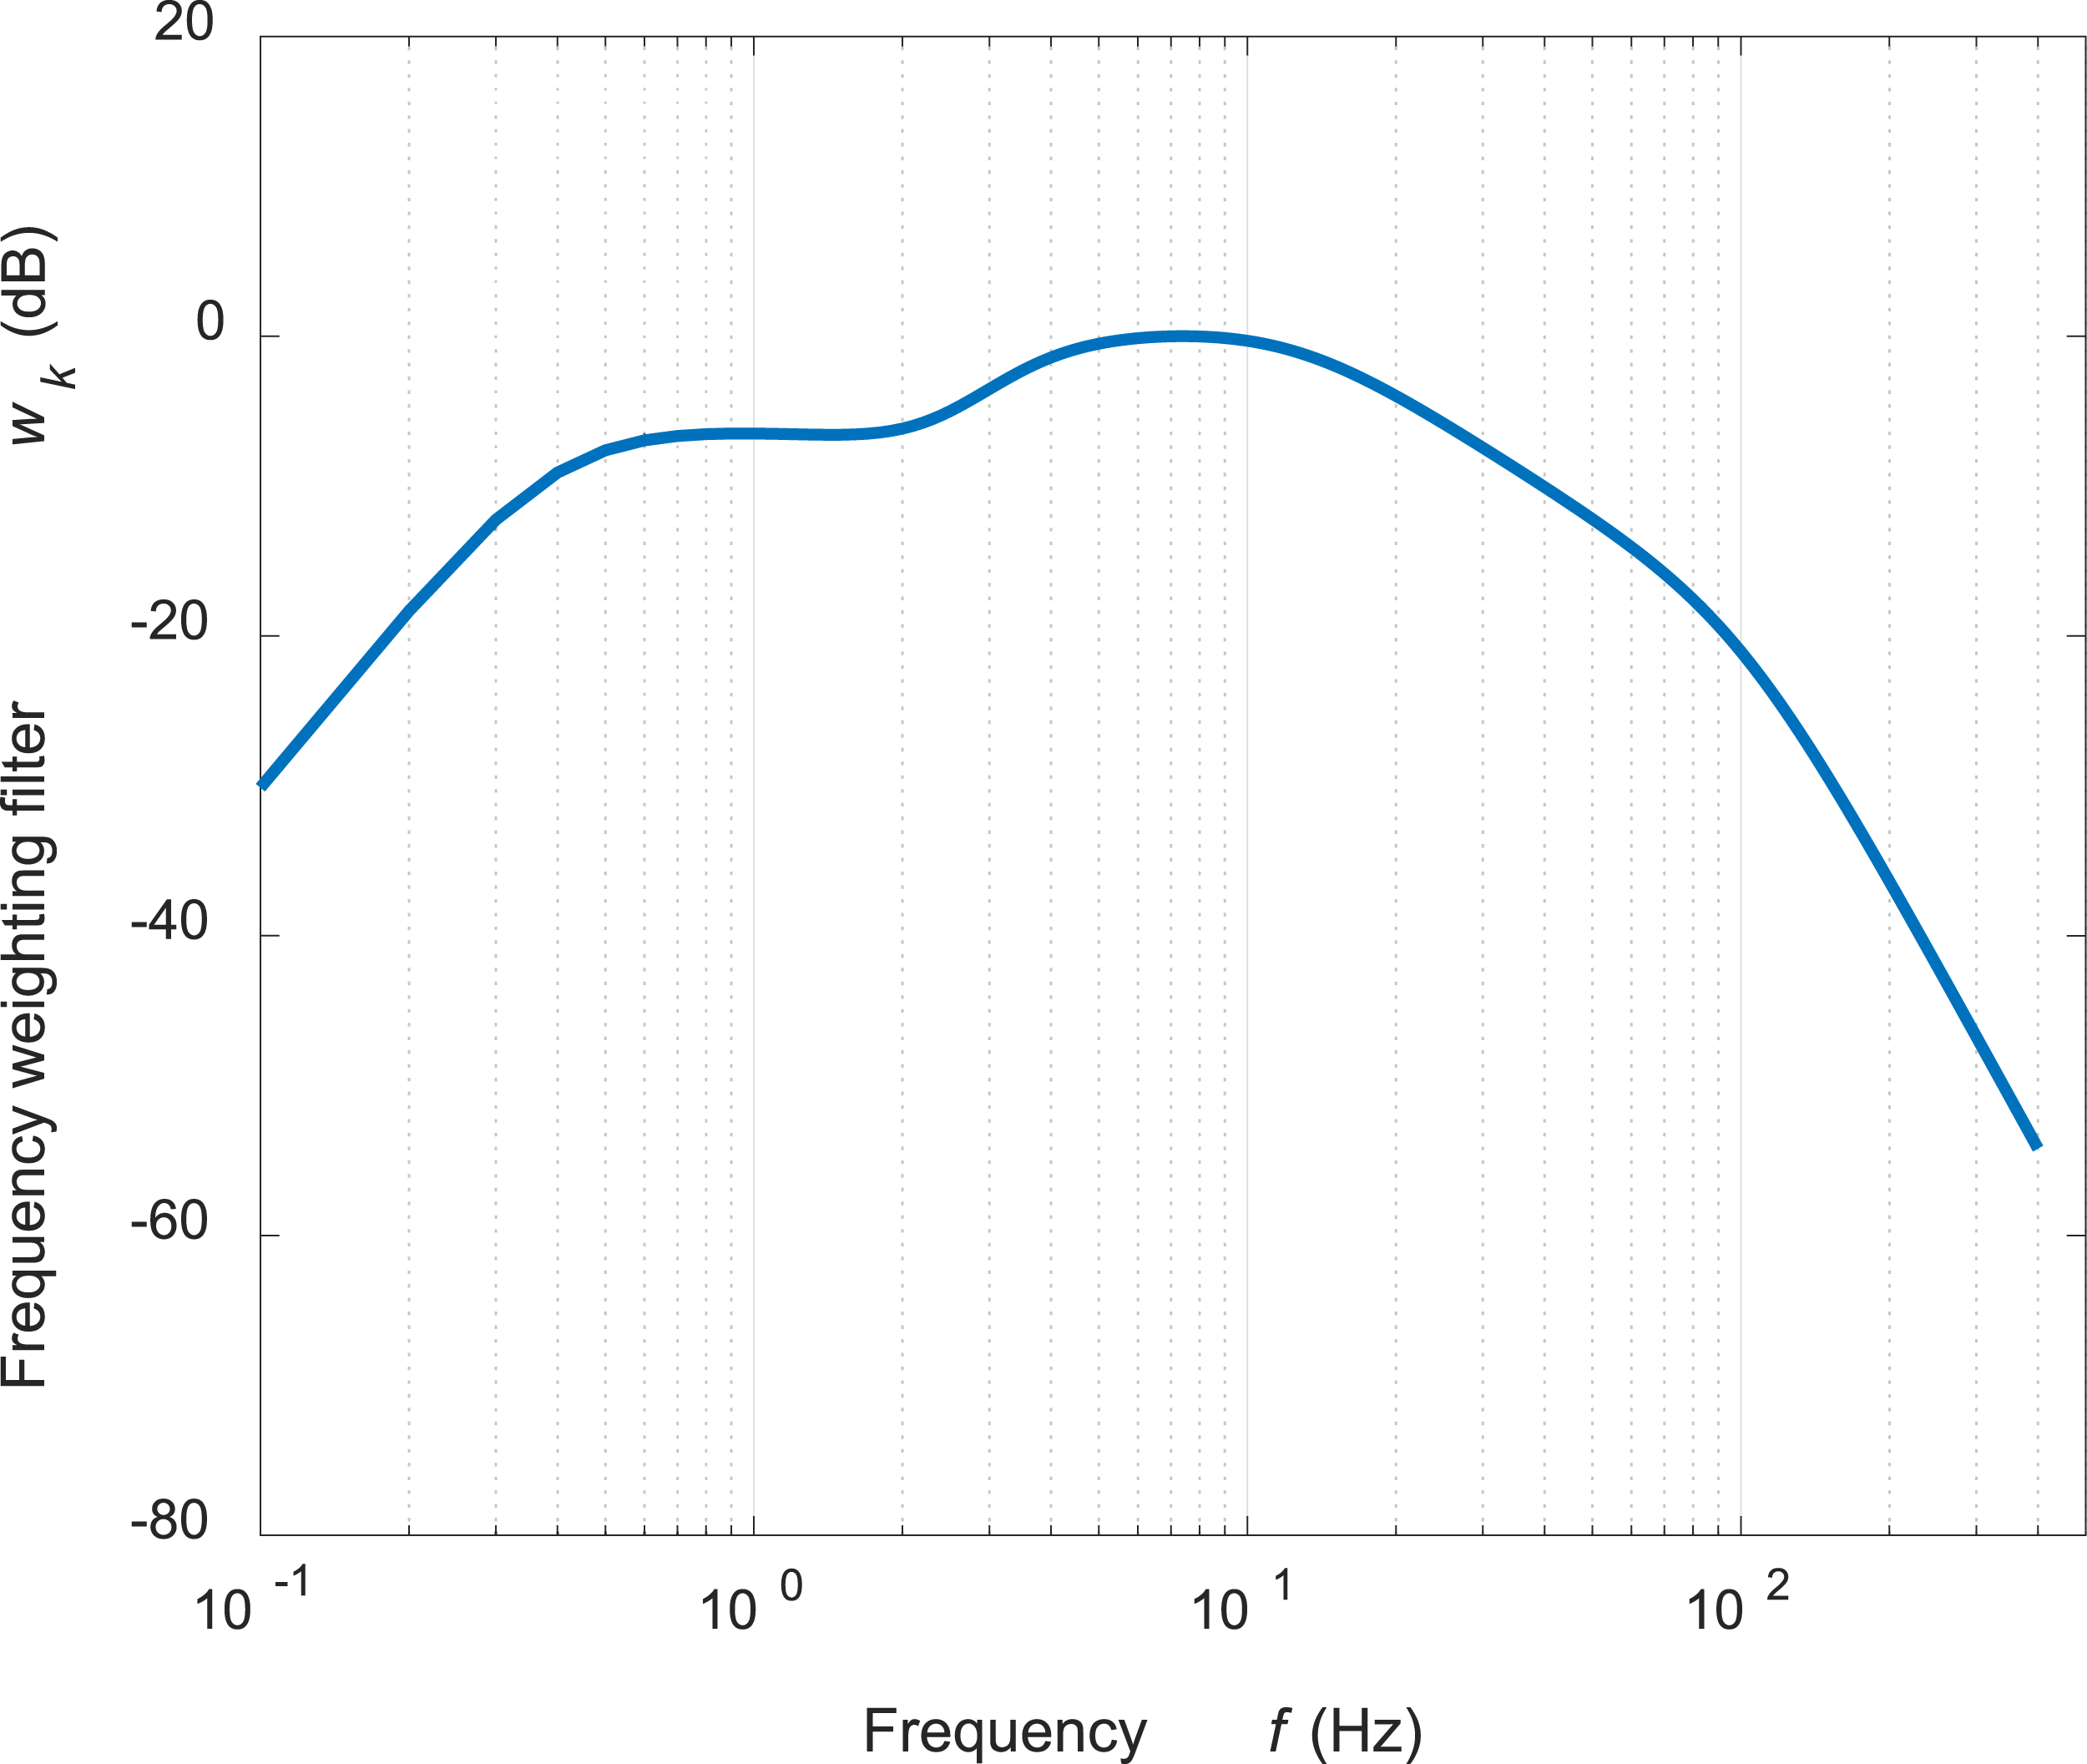
The value of the weighting filter w
k
at frequency f (Hz) can be calculated as Eq. (18)
2
:
Stability
The driver’s vertical stability under transient excitation can be assessed through a/g, calculated as Eq. (19).
The condition to ensure that the driver can be stable in the sitting position is that the a/g value does not exceed 1.
Results and discussion
Experiment’s results
The experimental results of measuring the air spring parameters according to the measurement process in Figure 5 are shown in Figure 7. The change of air spring pressure P (N/m2), Figure 7(a), according to the deformation z (m), is a nonlinear curve with a magnitude varying from 1 (bar) at the beginning to approximately 3 (bar) at the end of the measurement. Besides, with z (m) value in the range 0–0.025 (m), the P (N/m2) value changes less (approximately 0.75 (bar)) than with z (m) value in the range 0.025 – 0.05 (m). In this range, the P (N/m2) value changes more significantly (about 1.25 (bar)). The fact that the air spring pressure P (N/m2) changes nonlinearly with the deformation z (m) shows that calculating and simulating the vibration of the seat suspension system with the air spring requires combining experimental data to achieve high accuracy. The change of P (N/m2) according to z (m) in Figure 10 is digitized using a third-order polynomial mathematical model with “Matlab Toolbox Fitting.” Change according to the deformation z (m) of: (a) the air spring pressure P (N/m2), (b) the stiffness k
d
(N/m).
Similar to the results in Figure 7(a) and(b) shows that the air spring stiffness k d (N/m) changes nonlinearly with the air spring deformation z (m). With z (m) deformation of 0–0.015 (m), the air spring stiffness, with an initial value at the compression starting point of k d = 30,000 (N/m), decreases and reaches a minimum k dmin = 11,000 (N/m) at the deformation of z = 0.015 (m). As the deformation z (m) increases from 0.015 (m) to 0.05 (m), the air spring stiffness k d (N/m) gradually increases and reaches its maximum k dmax = 90,000 (N/m).
Responses in the time domain
Random excitation
Figure 8(a) shows that with the same value of damping ratio ξ
se
= 0.4, vehicle speed v = 10 (km/h), the driver’s acceleration value a
w
(m/s2) has a higher fluctuation amplitude than when the vehicle moves at a speed of v = 40 (km/h). The driver’s level of feeling with v = 40 (km/h) is evaluated according to aw1 = 0.140 (m/s2), which is in the comfortable zone. In contrast, the driver’s level of feeling with v = 10 (km/h) evaluated by aw2 = 0.475 (m/s2) is 3.3 times larger than aw1, which creates a slightly uncomfortable feeling. The acceleration value a
w
at low-speed v = 10 (km/h) is more significant than at high-speed v = 40 (km/h), considering the same value ξ
se
= 0.4, is due to the seat suspension system at low speed is affected by low-frequency vibrations more than high frequencies, and this is combined with the fact that the natural frequency of the passive seat suspension system is in the small region of 1.5 – 4 (Hz),8,9 specifically with the suspension system considered in this research is 1.5 – 2 (Hz) according to Figure 9, should cause vibrational resonance at low frequencies. Driver’s frequency weighted acceleration a
w
(t) over time (a) with ξ
se
= 0.4, v = 10 (km/h) and v = 40 (km/h), (b) with v = 10 (km/h), ξ
se
= 0.1 and ξ
se
= 0.4. Gain response of seat acceleration.
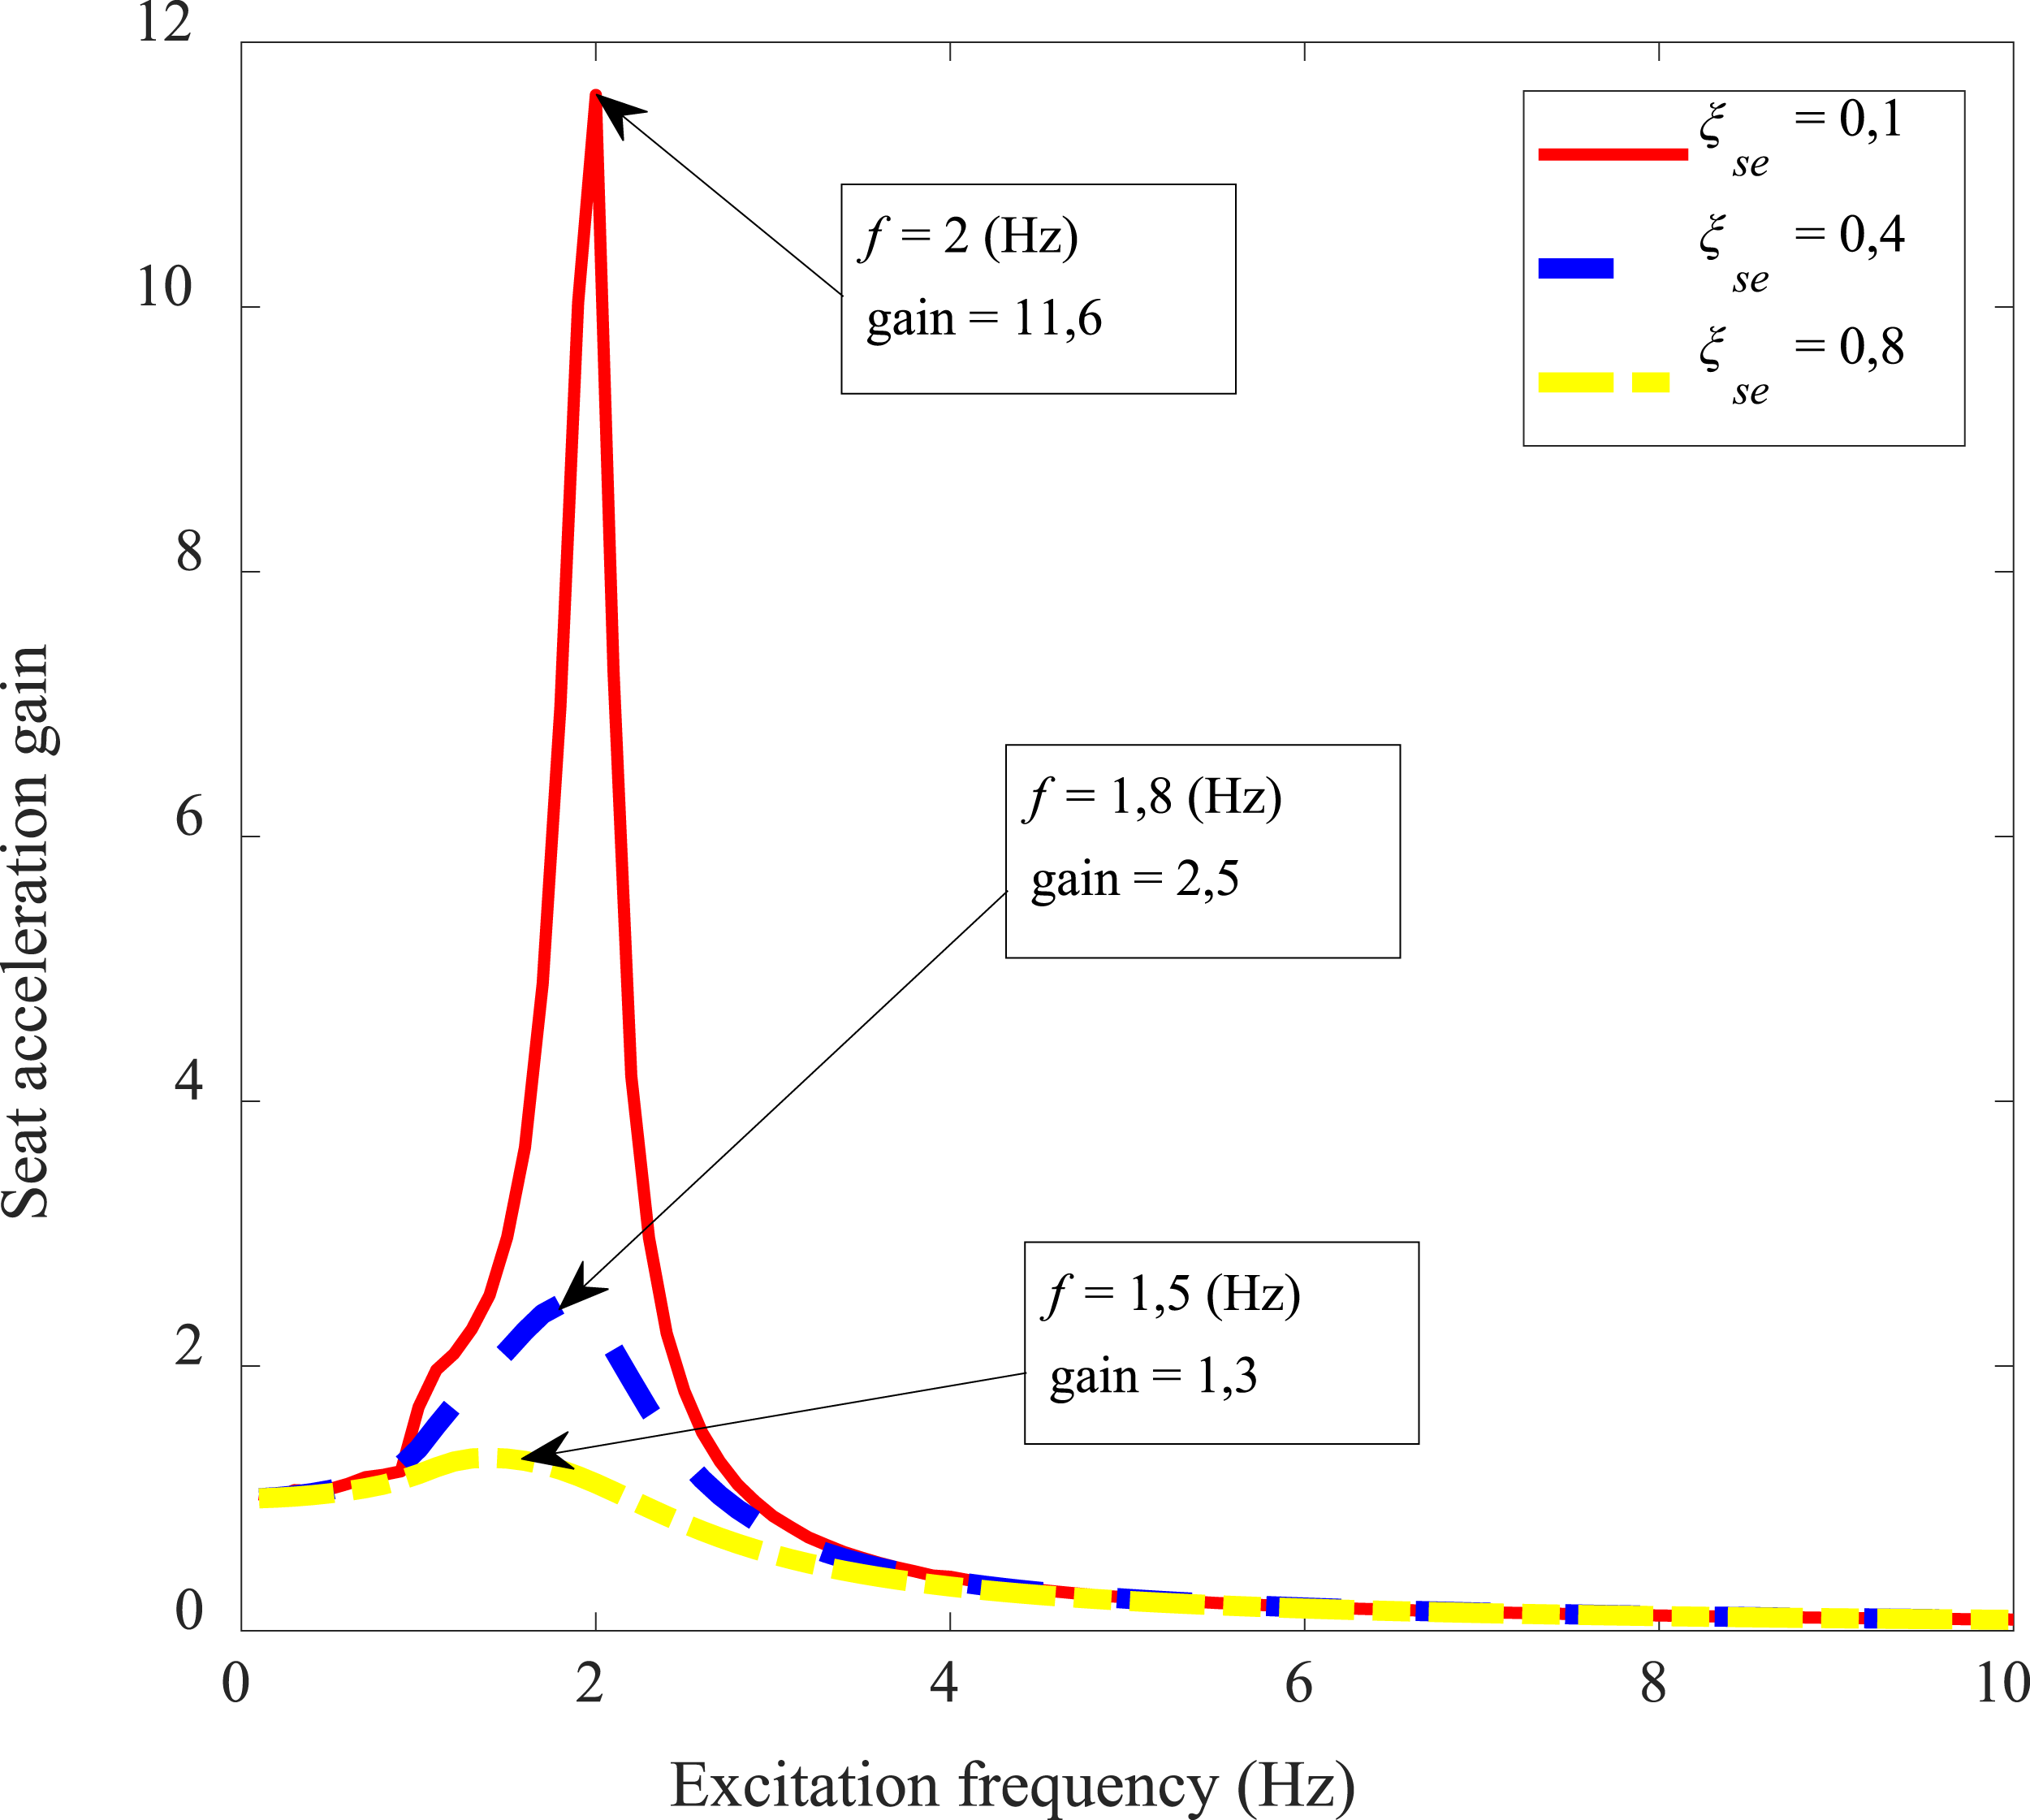
Figure 8(b) shows that, when considering the same vehicle speed v = 10 (km/h), the driver acceleration value a w (t) over time with damping ratio ξ se = 0.1 has higher fluctuation amplitude than ξ se = 0.4. This result occurs because the damping ratio ξ se varies linearly with the value of the damping coefficient c d according to Eq. (12) and Eq. (13). The difference in damping coefficient causes a slight difference in the natural frequency of the seat suspension system. However, it has a considerable influence on the vibration amplitude of the system, 13 Figure 9. According to the results of Figure 9, with ξ se = 0.4, the amplitude around the resonance frequency 1 – 3 (Hz) is cut down more than with ξ se = 0.1. From there, the amplitude value with ξ se = 0.4 in Figure 8(b) is also cut down more when the excitation frequency is in a low range, as moving at a speed of v = 10 (km/h). Specifically, with ξ se = 0.1, the driver’s acceleration aw1 = 0.955 (m/s2) causes an uncomfortable feeling and is larger than the driver’s acceleration aw2 = 0.475 (m/s2) with ξ se = 0.4 approximately 2.01 times.
Transient excitation
Figure 10(a) shows that, with the same damping ratio ξ
se
= 0.4, the value a (t)/g in two cases of vehicle speed v = 10 (km/h) and v = 40 (km/h) does not exceed 1, this means the driver is stable in the seat and does not bounce off the seat surface. Besides, the vehicle moves over a bump at the speed of v = 40 (km/h), causing driver acceleration larger fluctuation amplitude than the speed v = 10 (km/h). This result can be explained by the fact that when exposed to bump at high-speed v = 40 (km/h), the vehicle body and floor surface move vertically faster than v = 10 (km/h). This process causes the seat suspension system’s damper to deform at a higher speed with v = 40 (km/h), which in turn causes a more significant damping force acting on the system and creates greater acceleration, according to Eq. (5). At speed v = 10 (km/h), the most significant value a (t)/g is less than 0.025, Figure 10(a), this means the driver’s acceleration in the vertical direction does not exceed 2.5% of the gravitational acceleration g. Similarly, when the vehicle moves over a bump at a speed of v = 40 (km/h), the most significant value of a (t)/g is less than 0.1 (approximately four times higher than when v = 10 (km/h)) or the driver’s vertical acceleration does not exceed 10% of the gravitational acceleration g. Ratio of driver acceleration and gravitational acceleration over time a (t)/g over time (a) with ξ
se
= 0.4, , v = 10 (km/h) and v = 40 (km/h), (b) with v = 40 (km/h), ξ
se
= 0,1 and ξ
se
= 0.4.
Figure 10(b) shows that, when considering the same vehicle speed v = 40 (km/h), the a (t)/g with the damping ratio ξ se = 0.1 has a higher amplitude fluctuation than with ξ se = 0.4. This result happens when the vehicle, in the two circumstances, exposes a bump at the same speed; the circumstance with a greater ξse has the system’s energy dissipated more, leading to being stable faster. Specifically, with ξ se = 0.1, the most significant ratio a (t)/g value reaches amax1/g = 0.23 and is larger than the case of ξ se = 0.4 with the largest a (t)/g reaching a max2 /g = 0.1, nearly 2.3 times.
Responses in the velocity domain
Random excitation
Driver acceleration and relative displacement of the seat suspension system were expanded and investigated throughout the vehicle speed range v 10 – 80 (km/h), corresponding to the vehicle’s actual working speed. The RMS of driver frequency weighted acceleration according to ISO 2631 standard a
w
(m/s2) corresponding to each vehicle speed value is summarized in Figure 11. RMS of driver frequency weighted acceleration a
w
(m/s2) in velocity domain v (km/h).
When considering the same vehicle speed, corresponding to ξ se = 0.1, ξ se = 0.4 and ξ se = 0.8, in the speed range 10 – 40 (km/h), the a w value, Figure 11, gradually decreases. In the speed range 40 – 80 (km/h), the difference between a w values in three cases of ξ se = 0.1, ξ se = 0.4 and ξ se = 0.8 is very small. Besides, when considering the same seat suspension damping ratio value ξ se , the a w value reach it’s maximum at v = 10 (km/h) and gradually decreases with increasing vehicle speed. The most significant decrease occurs in the speed range 10 – 20 (km/h).
The deviation between the driver’s acceleration value a w and the standard value 0.315 (m/s2) at ξ se = 0.1, ξ se = 0.4 is at least 50% larger than the standard value 0.315 (m/s2) (especially with ξ se = 0.1 the deviation reaches 203 (%)) and 0% at ξ se = 0.8. This deviation shows that, with ξ se = 0.1, ξ se = 0.4, when the vehicle moves at a slow speed (<10 (km/h)) in the city on road class C, it can easily cause discomfort compared to ξ se = 0.8. On the contrary, when vehicle’s speed v = 20 (km/h), the driver always feels comfortable because the deviation is less than 0%, and the best performance is at ξ se = 0.8 with −30.2%.
Transient excitation
Figure 12 shows that, when considering the same vehicle speed (for all speed values in the range 10 – 80 (km/h)), the value a
max
/g gradually decreases, respectively, to ξ
se
= 0.1, ξ
se
= 0.4 and ξ
se
= 0.8. When considering the same damping ratio value ξ
se
, a
max
/g value increases as increasing the vehicle speed in the range 10 – 30 (km/h) and reach it’s maximum value at [a
max
/g]max,. In the speed range of 30 – 80 (km/h), the a
max
/g value decreases as increasing vehicle speed. Maximum ratio of driver acceleration and gravitational acceleration a
max
/g (m/s2) in velocity domain v (km/h).
Corresponding to the cases ξ se = 0.1, ξ se = 0.4, and ξ se = 0.8, the values of a max /g reach their maximum in the vehicle speed range 20 – 30 (km/h). However, the driver is always guaranteed to sit stably and not be separated from the seat surface vertically as [a max /g]max is at least 75% smaller than 1 at all vehicle speed values. The best performance is at ξ se = 0.8 for the driver’s vertical stability.
Conclusions
Through experimental measurements, the technical parameters of the air spring were determined, and the influences of the seat suspension damping ratio ξ
se
on the level of comfort, vertical stability, and safety under random and transient excitation were analyzed with a 3DOF quarter-vehicle model. The results show that: + The vehicle moves on class C road according to ISO 8608 standard: In the speed range v 10 – 20 (km/h), when considering the same speed value v (km/h), the increase of damping ratio ξ
se
creates the decrease of driver’s acceleration a
w
(m/s2), and this result leads to the improvement of the comfort level. With the same damping ratio ξ
se
, as increasing vehicle speed v (km/h), driver acceleration a
w
decreases. These effects help improve comfort level. + The vehicle moves through a bump (transient excitation) according to IRC 99-1988 standard: When considering the same vehicle speed v (km/h), the decrease of the damping ratio ξ
se
creates larger a
max
/g values, these effects lead to the reduction of vertical stability. When considering the same value of damping ratio ξ
se
, in the vehicle speed range v 10 – 30 (km/h), the values of a
max
/g increase as increasing v; with v 30 – 80 (km/h), the values of a
max
/g decrease as increasing v.
Footnotes
Acknowledgement
We acknowledge Ho Chi Minh City University of Technology (HCMUT), VNU-HCM for supporting this study.
Declaration of conflicting interests
The author(s) declared no potential conflicts of interest with respect to the research, authorship, and/or publication of this article.
Funding
The author(s) received no financial support for the research, authorship, and/or publication of this article.