
Abstract
Rolling bearings are widely used in rotating machinery in modern industry, and ensuring their stability during operation is one of the prerequisites for the overall safety of the equipment. Predicting performance degradation can play a key role in preventing accidents and extending equipment life. With the development of big data and deep learning, more trend prediction methods are emerging in the field of performance degradation prediction of rolling bearings. Therefore, this paper reviews the evaluation indicators and performance degradation prediction models for rolling bearing performance degradation prediction. The advantages and disadvantages of physical degradation indicators, and virtual degradation indicators are analyzed. It is presented to utilize the powerful feature self-extraction ability and nonlinear function characterization ability of deep learning methods to construct bearing evaluation indicators. It also analyzes the research progress of traditional performance degradation prediction models and deep learning prediction models. In this review, future developments in rolling bearing performance degradation prediction are summarized in this paper as deep learning-based, digital twin correlation, high dimensionality, and adaptive, which guide researchers and practitioners to effectively identify suitable performance degradation prediction models.
Keywords
Introduction
The rapid development of modern industry cannot be separated from each part of construction machinery, even if the direction of intelligent, complex, efficient development, rolling bearings always have an irreplaceable position. Such as all kinds of engines, the power system of the carrier always applies rolling bearings as one of the important core components of the transformation movement and power transfer. 1 Rolling bearing operation is to change the sliding friction between the shaft and the shaft seat into rolling friction, generally by the outer race, inner race, rolling element, cage composition. Its failure form mainly has fatigue spalling, wear, plastic deformation, corrosion, fracture, gluing, cage damage, and so on. Long-term operation in poor working conditions, rolling bearings performance degradation to a certain extent will lead to its working condition from normal operation to complete failure, which will cause equipment failure and even the occurrence of engineering accidents.
According to research reports, about 30% of mechanical failures in rotating machinery using rolling bearings are caused by rolling bearings failures. 2 To ensure the safe and stable operation of high-speed trains, urban rail vehicles, heavy-duty trains, engineering vehicles, and other means of transportation. It is necessary to carry out intelligent maintenance of its key components’ rolling bearings to achieve an accurate assessment of the health state and reliable prediction of Remaining Useful Life (RUL). 3 For this reason, it is very important to predict the performance degradation of rolling bearings before the occurrence of a rolling bearing operational failure accident. As an essential aspect of bearing health management, health state assessment and life prediction methods have already come to the hotspot of present research. The traditional method of extracting individual time-domain and frequency-domain features to characterize the performance degradation stage for rolling bearings and recognize the degradation start location has some shortcomings. These include the inability to accurately predict the start of performance degradation and the loss of some information about the degradation process. The fusion model of the traditional method requires learning the calculation method of the relevant methods and having practical experience before prediction. There are still researchers and scholars who combine multiple time feature indicators and frequency domain feature indicators, thus improving and applying the traditional prediction methods. Deep learning is an end-to-end learning process. It goes in through the input of data to get to the target result without the need to manually design rules. Researchers and scholars can optimize the loss function to learn the rules, mining the potential features of the performance degradation data. In addition to this, there are distributed feature representations of the data found by combining lower-level features to form more abstract higher-level representations of attribute classes or features. The use of deep learning methods saves time while being able to improve the understanding of the method in the field of performance degradation. Predicting the performance degradation of rolling bearings along with predicting their remaining life enables timely maintain and replace rolling bearings. Additionally, it provides data for investigating defects in the manufacturing process and structural design of rolling bearings. There are two main problems in the construction process of performance degradation: how to use monitoring data to construct performance degradation indicators; and how to use performance degradation indicators to identify and classify the degradation stage. Different from the mechanical equipment fault diagnosis field extracted features are mainly used for identification and classification, the performance degradation indicators are categorized as a class of feature indicators for assessing the health status of mechanical equipment. Its main role has two points: quantitative assessment of the mechanical equipment operating state; to divide the performance degradation curve into degradation stages at different moments to provide basic data for remaining life prediction. Therefore, the assessment of performance degradation indicators includes not only the assessment accuracy but also the assessment indicators of the performance degradation curve, such as monotonicity, trend, robustness, and so on. Feature value can quantitatively characterize the health condition of the mechanical equipment. It connects the feature value of different operating moments in chronological order to obtain the performance degradation curve, which provides simple basic data for remaining life prediction. However, the features are collected directly from the sensors, and thus sometimes face problems such as inaccurate identification of features and difficulty in identifying them, resulting in the inability to classify degradation stages or identify degradation states. Therefore, it is necessary to use feature value for the construction of performance degradation indicators. The use of performance degradation indicators is becoming more prevalent nowadays as they offer advantages over the direct use of feature quantities in identifying degradation states, stages and predicting bearing life.
Currently, rolling bearings performance degradation trend prediction is mainly categorized into physical model-based prediction and data-driven prediction. Physical model-based approaches rely on expert empirical knowledge and include Bayesian models, stochastic process models, etc. With both the volume of full-life data and the amount of labeled data being limited leading to poor generalization performance, deep learning-based prediction methods have come to the fore. Rolling bearings performance degradation trend prediction key difficulties: construct rolling bearings performance degradation indicators; establish rolling bearings performance degradation trend prediction model. Given the above rolling bearings performance degradation prediction information, this review successively composes and classifies the rolling bearings performance degradation indicator construction methods, and rolling bearings performance degradation prediction models, and finally summarizes and prospects the future development trend.
Method for construction rolling bearings performance degradation indicators
In a variety of complex mechanical equipment, the bearing performance degradation process is often difficult to visually observe. The state and stage of degradation can be analyzed with the help of various sensors that collect data. In the process of data collection, the feature value extracted by the sensors can be used as performance degradation indicators after correlation processing. At present, the ideas for constructing performance degradation indicators include two main categories: methodologies for constructing physical degradation indicators and methodologies for constructing virtual degradation indicators. With the continuous development of sensor technology and deep learning methods, deep learning-based performance degradation indicator construction methods have gradually come to be a research hotspot. 4
Methodology for the construction of physical degradation indicators
Physical degradation indicators construction methods contain time-domain correlation, frequency-domain correlation, entropy, and so on. Time domain analysis or entropy correlation algorithms were mainly used for indicator construction in most of the studies using traditional methods. From the monitoring signals collected by sensors, a class of indicators is extracted using statistical methods or signal processing methods, such as root mean square (RMS), spectral kurtosis, information entropy (IE), and so on. Time domain vibration signals, as the original waveforms collected, contain the most complete and comprehensive information content. Its statistical characteristics (peak value, RMS, kurtosis, etc.) are often used to reveal the degradation process of bearings performance. 5
Time domain analysis is the classic method for constructing performance degradation indicators. Time domain analysis is based on the vibration signal after time sorting for the corresponding description, usually calculating the signal reflecting the rolling bearings operation state of various feature values. It includes time domain features, frequency domain features, IE, time-frequency domain features, and so on. Time domain features include RMS, kurtosis, maximum value, peak-to-peak value, skewness, etc.; frequency domain features include the Centroid Frequency, mean square frequency, spectral coefficient of variation, etc.; IE includes wavelet packet energy entropy, amplitude spectral entropy, singular value spectral entropy and so on. Since time-domain signals can be relatively easily collected by sensors, the time-domain feature RMS and kurtosis are often used as rolling bearing performance degradation indicators in the study of bearing degradation prediction and life prediction. These indicators characterize the overall operating condition of the rolling bearing, which in turn predicts the life and performance degradation trend of the bearing. Among them, the RMS of the time domain signal describes the signal strength, which can reflect the overall damage to mechanical equipment. It is used to characterize the process of degradation of the performance of mechanical equipment because it is more sensitive to the degree of failure development of the mechanical components. Zhang et al. 6 take the difference between the RMS of the residual series obtained from the autoregressive model and the multivariate state estimation technique as an indicator of the degree of performance degradation. Zhang et al 7 used RMS, skewness, and Kurtosis for the construction of health indicators of degradation trends in the prediction model. Frequency domain analysis obtains frequencies reflecting the degradation characteristics of rolling bearings from time domain signals by using Fourier transform decomposition. Wu et al. 8 used the moment-centered value of power spectral density as the performance degradation characteristic. Meng et al. 9 obtained indicators for the monitoring indicator of the initial fault and the monitoring indicator of the degradation stages through the cumulative sum of coefficients of variation. Time-frequency domain analysis method combines the time domain and frequency domain information of the signal which is remarkably effective for nonlinear and nonsmoothed vibration signals. Wang et al. 10 used the stack autoencoder (SAE) method to integrate the time domain indicators and frequency domain indicators to construct the performance degradation feature indicators. Zhu et al. 11 used time-frequency domain features and other features to construct a comprehensive set of bearing degradation features. Although the above methods can better reflect the degradation characteristics, all of them have poor monotonicity and the early failure characteristics are not obvious.
Entropy-based nonlinear dynamics theory is a powerful tool, which has been heavily used in the degradation feature extraction of rolling bearings in recent years. Various entropy-related algorithms are being proposed. Entropy is a method to characterize the complexity of vibration signals with explicit physical meaning. 12 The entropy value is sensitive to distinguish between vibration signals and background noise. 13 The entropy value is high at the beginning of the bearing operation due to the random nature of the acquired signals; when the faults are more serious, the impact signal will cover part of the interference noise, which leads to the corresponding lower entropy value. The permutation entropy (PE) is not sensitive to the amplitude of vibration signals, and thus cannot accurately reflect the energy distribution of vibration signals in different frequency bands. Zhang et al. 14 proposed the Entropy Energy Ratio as a performance degradation assessment indicator based on the PE. Cheng et al. 15 proposed composite multiscale grey entropy (CMGE) with a weak dependence on the length of the acquired signals under the premise of effectively describing the degradation trend of rolling bearings. In addition, when constructing indicators, researchers have used entropy-related methods such as relative sample entropy, 16 fusion gray entropy, 17 relative energy entropy, 18 modal decomposition-transfer entropy, 19 multivariate multi-scale fuzzy entropy, 20 probability distribution correlation, 21 fusion composite indicators, 22 and the entropy weight method, 23 and so on.
Although the entropy-related method has achieved some results in rolling bearings degradation prediction, there are still several problems that need to be solved. The calculation results are inconsistent with the real nonlinear dynamical system and thus lead to errors; the calculation results are inconsistent in different scales; the length of the data required for calculation is long. Therefore, the use of virtual degradation indicators can solve these problems to a certain extent.
Methodology for the construction of virtual degradation indicators
Virtual degradation indicator refers to a class of indicators that characterize the operation state of mechanical equipment obtained by fusing multiple physical degradation indicators or sensor data. At present, there are two main types of ideas for virtual health factor construction methods: data fusion-based ideas and similarity-based ideas. 24 The research based on the idea of data fusion mainly includes principal component analysis (PCA), kernel principal component analysis (KPCA), local linear embedding (LLE), restricted Boltzmann machine (RBM), etc. The principle is to obtain a new virtual degradation indicator after fusion and dimensionality reduction of multiple physical degradation indicators or sensor data.
PCA has been frequently mentioned in recent years as a powerful technique for extracting intrinsic structures from high-dimensional datasets. By extracting the main features of the original spatial data, the data is processed in a low-dimensional feature space, removing noise and redundancy from the data. The dimensionality reduction of the original data is achieved while maintaining a large amount of the original information. Thus, the PCA method can achieve a small number of irrelevant composite features in place of the original high-dimensional features and most of the information of the original variables is contained in these composite features. A few studies in recent years have used it to deal with feature variables. Currently, the use of PCA for dimensionality reduction25–29 is one of the main uses, which helps to clearly show the changes in faults over time. Other researchers have used PCA for the fusion of feature indicators,30–34 which helps to fully utilize the various features for predicting the degradation trend. Other researchers have used it for sensitive characterization, 35 analyzing failure data, 36 multi-dividing life evolution intervals, 37 correcting prediction results, 38 and so on.
Since the PCA is a linear technique, it cannot deal with complex nonlinear structures between the data. Therefore, nonlinear generalization has been proposed, i.e., introducing kernel methods into PCA. The resulting method is called KPCA, which is used to calculate the principal components of a nonlinear mapping to a high-dimensional feature dataset. The implementation process of KPCA is as follows. The original data are transformed into a new space by nonlinear mapping. Then PCA is performed in the new space and low dimensional features of the samples are extracted. Kang et al. 39 used KPCA to remove the redundancy of information between the filtered features, to construct an approximated feature matrix for input to support vector regression (SVR). Akpudo et al. 40 proposed the use of the KPCA feature fusion technique for degradation assessment and a deep learning model for prognostic assessment. Cao et al. 41 applied KPCA to construct indicators and state classification. Guo et al. 42 proposed a hybrid use of Adaptive Noise and KPCA. In practical applications, empirical errors arise because of the need to manually select kernel functions.
LLE is an unsupervised dimensionality reduction method. Compared with the PCA dimensionality reduction method, the low-dimensional data after LLE dimensionality reduction has a similar neighborhood structure as the original data. The idea of dimensionality reduction in LLE is to assume that the data is linear in the local range. Each sample point can be expressed linearly in terms of neighboring points, thus not changing the structural information of the original sample set, i.e. not changing the corresponding sample weights. For example, when the initial sample set is a spiral-shaped nonlinear structure, PCA dimensionality reduction will make the original structure greatly changed. Linear dimensionality reduction cannot express such nonlinear results as spirals, so LLE can be used to better fit such original sample sets without losing the essential data structure. In terms of dimensionality reduction algorithms for LLE, Xin et al. 43 used an LLE dimensionality reduction algorithm to extract features. Wang et al. 44 combined the LLE nonlinear feature reduction method with fuzzy C-means. Liu et al. 45 incorporated the neighborhood parameter adaptive selection feature into the LLE algorithm for extracting the performance degradation features. In addition to these studies, LLE is also used for data fusion on high-dimensional data46,47 and so on. Researchers mostly use the LLE method in data dimensionality reduction, which can effectively reflect the reliability and stability of the original state performance.
The locality preserving projections (LPP) algorithm is an unsupervised dimensionality reduction algorithm commonly used for high-dimensional data. Its purpose is to eliminate redundant information in high-dimensional data. By reconstructing the axes of one, the original data points are projected onto the new axes, i.e., similar samples in the high-dimensional space can be as close as possible to the low-dimensional space. The measure of the practical effectiveness of the method is how to find the optimal axes that maintain the original important features and increase efficiency. Zhang et al. 48 used LPP to preserve the local structure of the data streaming pattern and then established negative log-likelihood probabilities based on a continuous hidden Markov model (CHMM) as a new performance degradation indicator. Peng et al. 49 fused feature vectors to features by LPP. Li et al. 50 used LPP to reduce the dimensionality of the general feature set while preserving the main information. The negative log-likelihood probability based on the two-dimensional hidden Markov model (HMM) is constructed as a new degradation index. The LPP typically fuses useful information and reduces the dimensionality.
RBM is a probabilistic graphical model with a network structure consisting of two layers, a visible layer and a hidden layer. The visible layer is used to describe the inputs to the neural network. The hidden layer is used to describe the dependencies (non-linear) between the input data of the visible layer. For feature fusion and dimensionality reduction. The restricted Boltzmann machine uses the training data to adjust the node connection weights and bias parameters so that the probability distribution represented by the corresponding restricted Boltzmann machine is as similar as possible to the training data. Cheng et al. 51 normalized magnitude spectra are used as training samples to build RBM, and the output is used as the basis for the construction of degradation indicators. Sun et al. 52 organically integrated a rolling bearing performance degradation mechanism model into a constrained RBM term in order to integrate multiple types of physical health factors and thus improve factor performance. Zhang et al. 53 obtained the virtual health indicator through restricted RBM. Liu et al. 54 Combined RBM and convolutional layers with feature processing for fault identification. As with PCA, monotonicity, trend, and robustness are neglected because it is mainly used for fusion and dimensionality reduction.
Methods based on the similarity idea include self-organizing map (SOM), Mahalanobis distance (MD), support vector data description (SVDD), etc. The historical monitoring data are input into the model for training, and then test data are input into the trained model. The virtual health factors of the test data were obtained and finally processed into virtual degradation indicators. The basic assumption of the idea is to calculate the degree of deviation of the monitoring characteristics of the performance degradation phase from the normal phase. It is positively correlated with the degree of performance degradation.
MD refers to the covariance distance of the data with good affine invariance. The MD was improved to address the insufficient matching problem of the Euclidean distance. Zheng et al. 55 calculated the MDs in the feature vectors and used these MDs as the bearing performance degradation indicators, which were fed into the gated recurrent unit model for predicting the degradation trend. Dong et al. 56 used the deep autoencoder (DAE) and t-distribution stochastic neighbor embedding (t-SNE) models for extracting, expressing, and approximating the performance degradation features of the bearing signals. Then the MD in low-dimensional feature space as a performance degradation indicator. In addition to constructing indicators using MD alone, Yang et al. 57 combined the kernel-independent component analysis with the MD to calculate the degradation indicator. Zhang et al. 58 used MD successively for fault identification and performance degradation assessment indicators construction, which effectively tracked the performance degradation. MD has also been used as indicators to construct B-spline weight health indicators (BSWHI), 59 to evaluate model classification performance, 60 etc.
The main idea of SVDD is to find an optimal hypersphere that contains the minimum volume of all or most of the targets. For a set of target class samples, find the optimal hypersphere that contains all or most of the target class samples. The training samples are then mapped from a low-dimensional space to a high-dimensional space by a nonlinear transformation, which provides a better description of the target samples in the new high-dimensional space. Cheng et al. 61 used the feature vectors in a normal state extracted from the unsupervised pretraining part of the deep belief networks model as training samples to build an SVDD evaluation model and obtain performance degradation indicators for rolling bearings. Pan et al. 62 fused features into performance indicators (PI) using SVDD that require appropriate penalty parameters C and kernel parameters. The Sparrow Search Algorithm (SSA) is introduced into the parameter optimization process of the SVDD, which is then combined with DBN for detecting the early degradation of the bearing. Wang et al. 63 used SVDD to adaptively process degradation indicators. Other improved SVDD methods are the Fruit Fly Optimization Algorithm-Wavelet Support Vector Data Description (FOA-WSVDD) model, 64 Improved Whale Particle Swarm Support Vector Machine Based (HWPSO-SVDD) model, 65 hypersphere radius of multikernel support vector data description (MKSVDD), 66 and combination of fuzzy support vector data description (FSVDD) and running time, 67 multi-strategy optimized support vector data description 68 and so on. All the above improvements are based on the way SVDD is better than the original model, and the anti-noise performance is partially optimized.
SOM is an important class of unsupervised learning methods. It updates the connection weights between neurons based on the activated neurons, thus dividing the pattern of the input space based on the similarity between the input samples. Its main function is to map the high-dimensional spatial structure of the data to the low-dimensional space. Luo et al. 69 used the continuous wavelet transform (CWT) and the convolutional autoencoder (CAE) for the feature extraction method and then applied the SOM approach to get the Degradation Indicator (DI), and finally achieved the improvement of prediction accuracy. To avoid the high subjectivity of the screening rules for degradation features, Liu et al. 26 used the SOM method to cluster the statistical features and then obtained the fused degradation feature set by dimensionality reduction through the PCA method. Cheng et al. 70 adaptively fused the time-domain statistical features, spectral features, intrinsic mode function energy features, and wavelet packet frequency band energy features of health indices using the multiple growing self-organizing mapping (GSOM). Lv et al. 71 used leveraging multi-domain feature extraction and SOM networks to construct initial health indicators.
However, the similarity-based methods need to use a large amount of historical monitoring data for model training, and the small sample size of monitoring data does not apply to this idea.
Indicator construction methods based on deep learning
In recent years, deep learning methods have been developing rapidly. Relying on its ability to have powerful feature self-extraction and non-linear function characterization, it provides a way of thinking for constructing bearing degradation indicators that are different from the traditional construction methods. Deep learning to construct indicators is through various types of deep learning methods on the original acquisition signal self-learning to construct performance degradation indicators, which contains unsupervised learning and supervised learning to construct performance degradation indicators. Deep learning methods include convolutional neural networks (CNN), recurrent neural networks (RNN), auto-encoders (AE), deep belief networks (DBN), and so on. Unsupervised learning is mainly used for network pre-training, dimensionality reduction, etc. Supervised learning, on the other hand, utilizes data labels to deeply mine the feature information inside the data. Supervised deep learning algorithms mainly include CNN and RNN. Unsupervised deep learning algorithms mainly include AE and DBN.
CNN is one of the most widely used research hotspots in the field of deep learning, which has three major advantages: local connectivity, weight sharing, and spatial pooling. The typical structure of a CNN includes a convolutional layer, a fully connected layer, an input layer, an output layer, and a pooling layer. In this paper, the working principal diagram of one-dimensional convolutional neural network (1D CNN) is given as shown in Figure 1. The Convolutional layer is the core of the network structure of a CNN, the main role is to achieve the dimensionality reduction of the data processing and can be used to automatically extract the characteristics of the original data. The pooling layer further reduces the size of the data by spatially sampling the dimensions of the input data and makes the input data locally linearly transform invariant. After the convolutional and pooling layers are processed, the fully connected layer nonlinearly combines the feature information that has been extracted thus obtaining the output. CNN is commonly used for feature extraction, Jiang et al.
72
used CNN to extract the low-dimensional degradation features of rolling bearings and further extracted its high-dimensional degradation features for prediction. Yang et al.
73
proposed a method to improve the construction of one-dimensional deep CNN bearings performance degradation indicators based on a combined loss function, which was experimented on both publicly available and real-world datasets to verify its effectiveness and feasibility. Improvements to CNNs include mining deep features reflecting degradation performance,
74
automatic extraction of local abstract information from data,
75
and hybrid dimensional convolutional neural network with bi-directional long short-term memory (DCNN-BiLSTM) input networks.
76
The diagram of 1D CNN.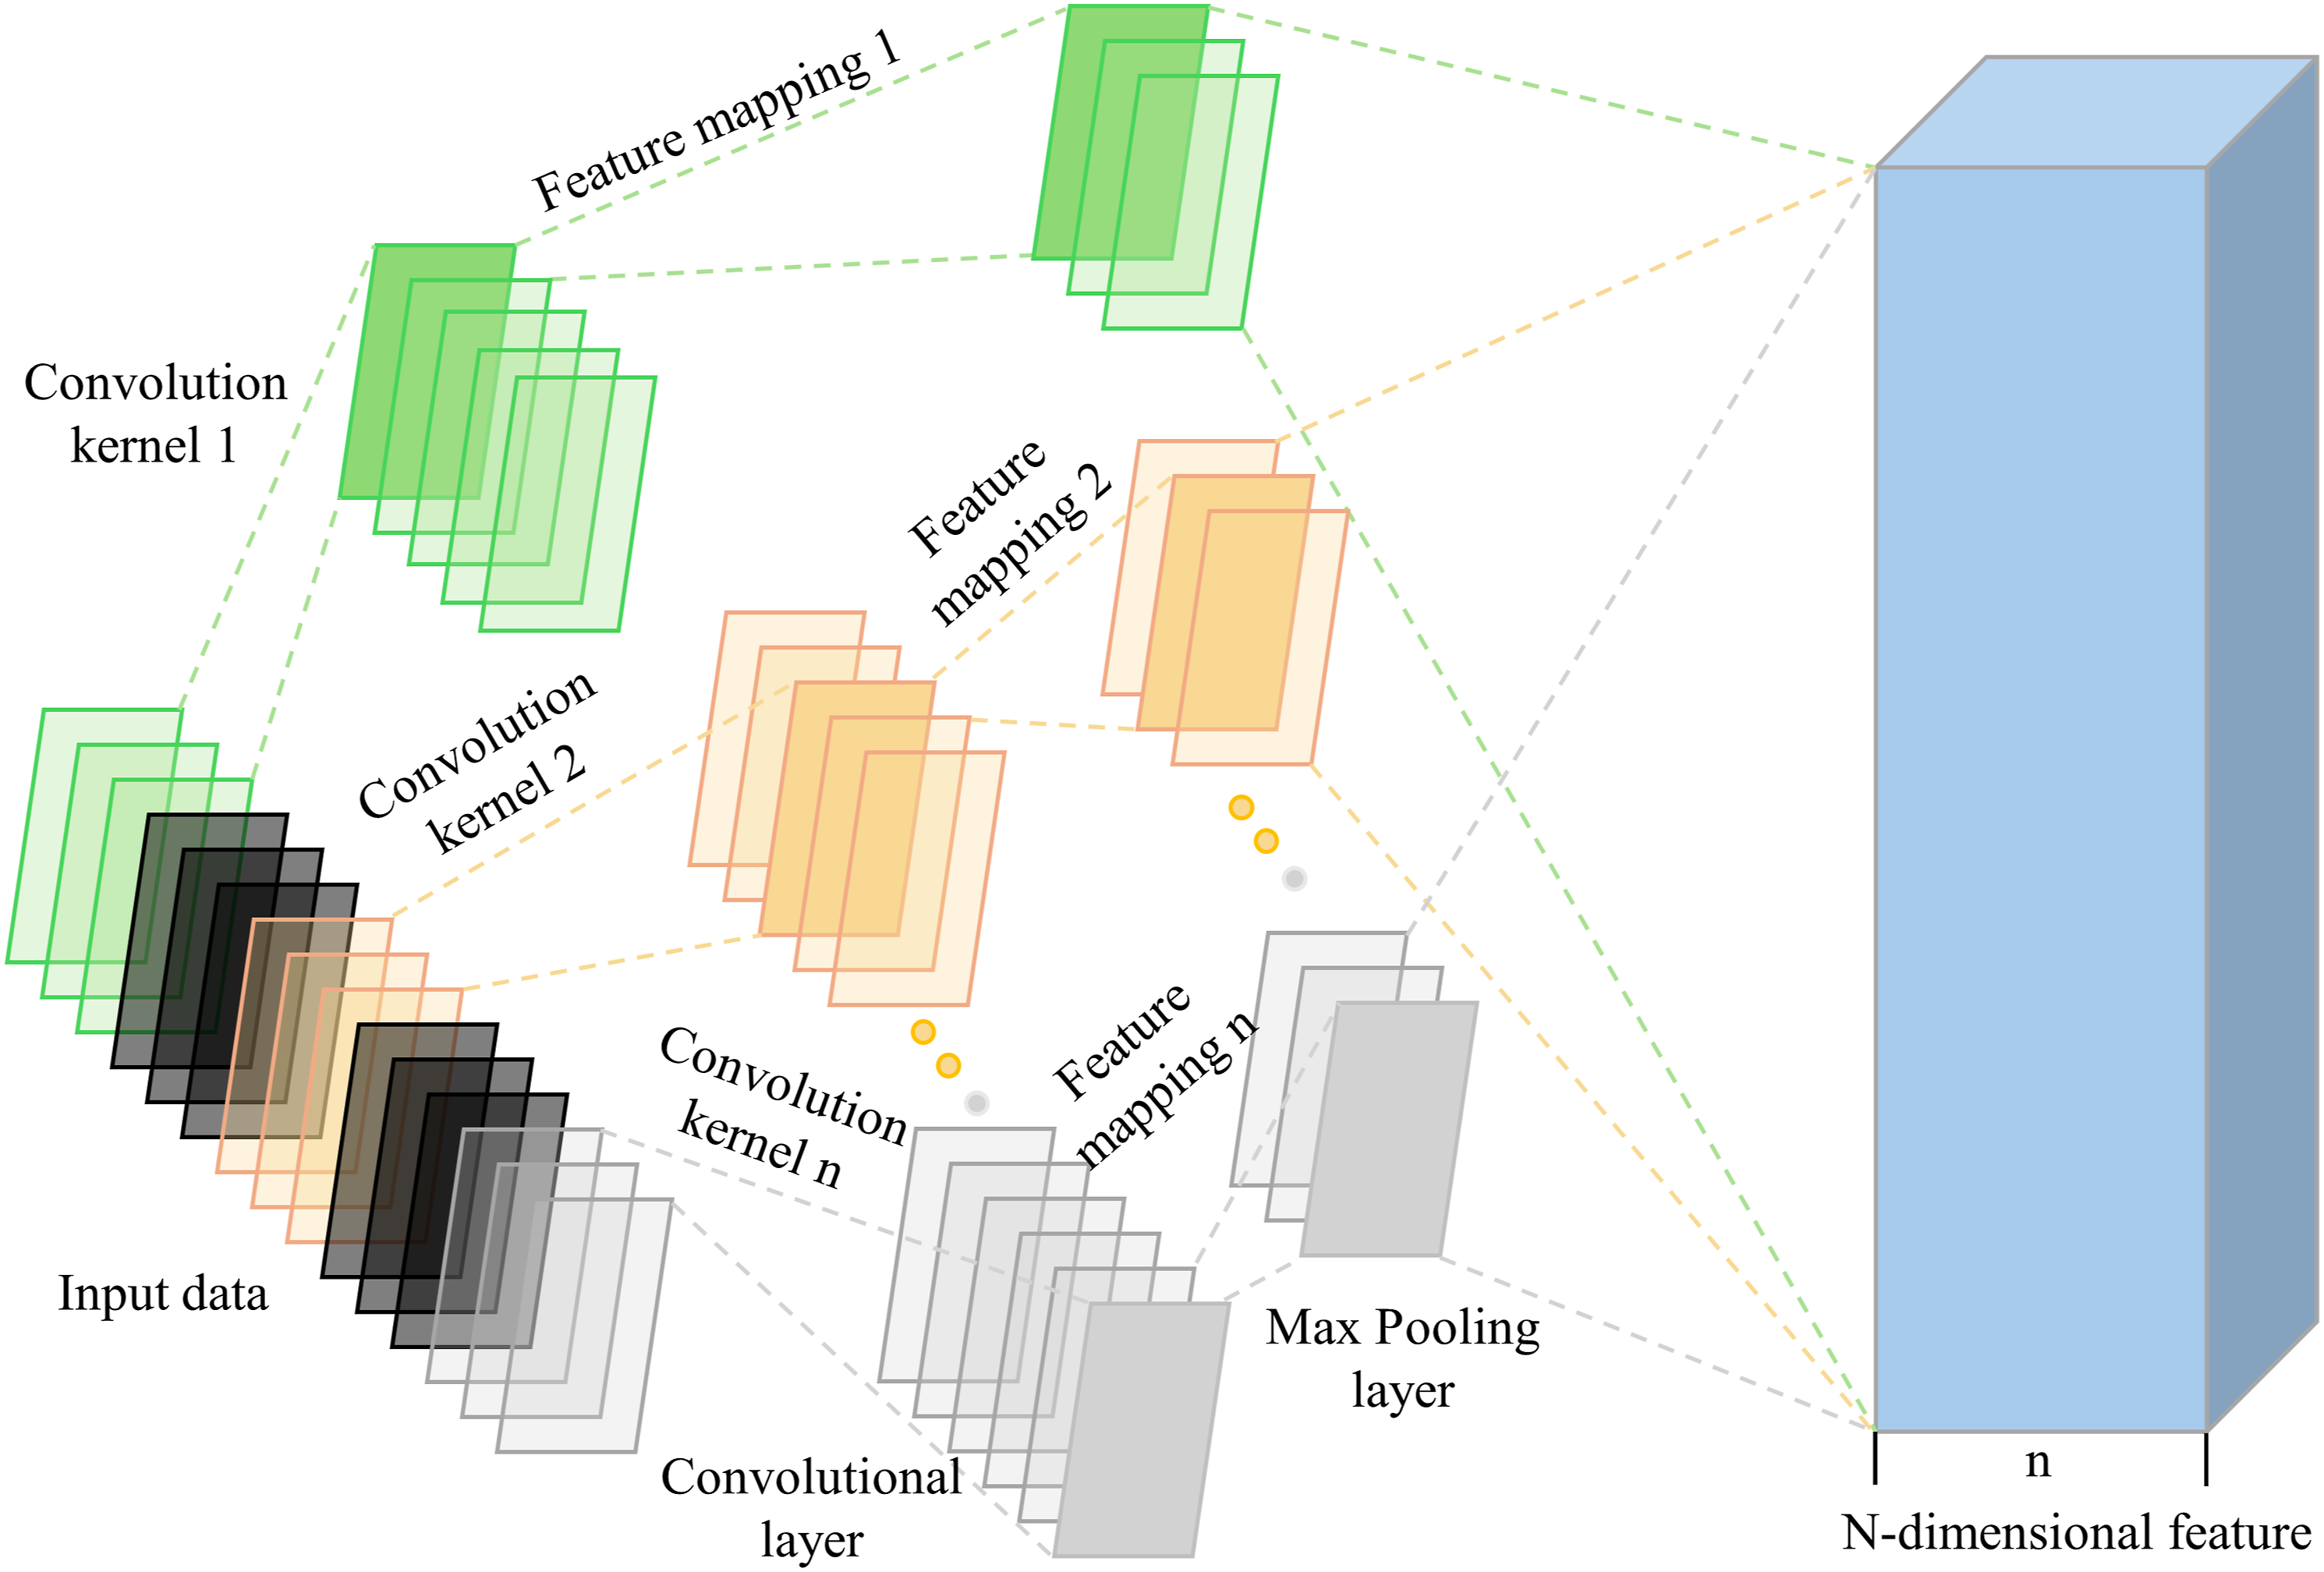
Traditional machine learning models suffer from the problem of memory deficit, so RNN models are proposed for processing sequence data. RNN integrates the structure of feedback connections and possesses the function of long-term memory. A major RNN structure unfolding is given below as shown in Figure 2. Ning et al.
77
used the Mean Impact Value (MIV) algorithm for feature selection, realized secondary feature selection by correlation coefficient identification calculation, and finally obtained bearing degradation curves by RNN. Cheng et al.
78
proposed the use of autoencoder quasi-recurrent neural networks (AEQRNN) containing a convolutional component that can process the input data in parallel, and a pooling component with two LSTM-like gate structures to process time series data. The model automatically extracts hidden features from the monitored signals. Upon its experimental results, the method is shown to have superior prediction performance and training speed compared to various related methods. Li et al.
79
used reinforcement learning to select the hidden number of layers and the number of hidden layer nodes fitted to the RNN of the corresponding monotone trend unit. Then the nonlinear approximation ability and generalization performance of the enhanced reinforcement learning unit matched recurrent neural network (RLUMRNN). Although the high prediction accuracy and computational efficiency of RNN-related methods are reflected in all the above methods, traditional RNNs cannot deal with the problem of long-term dependence on time series, as it leads to gradient explosion or gradient disappearance. A basic RNN structure expansion diagram.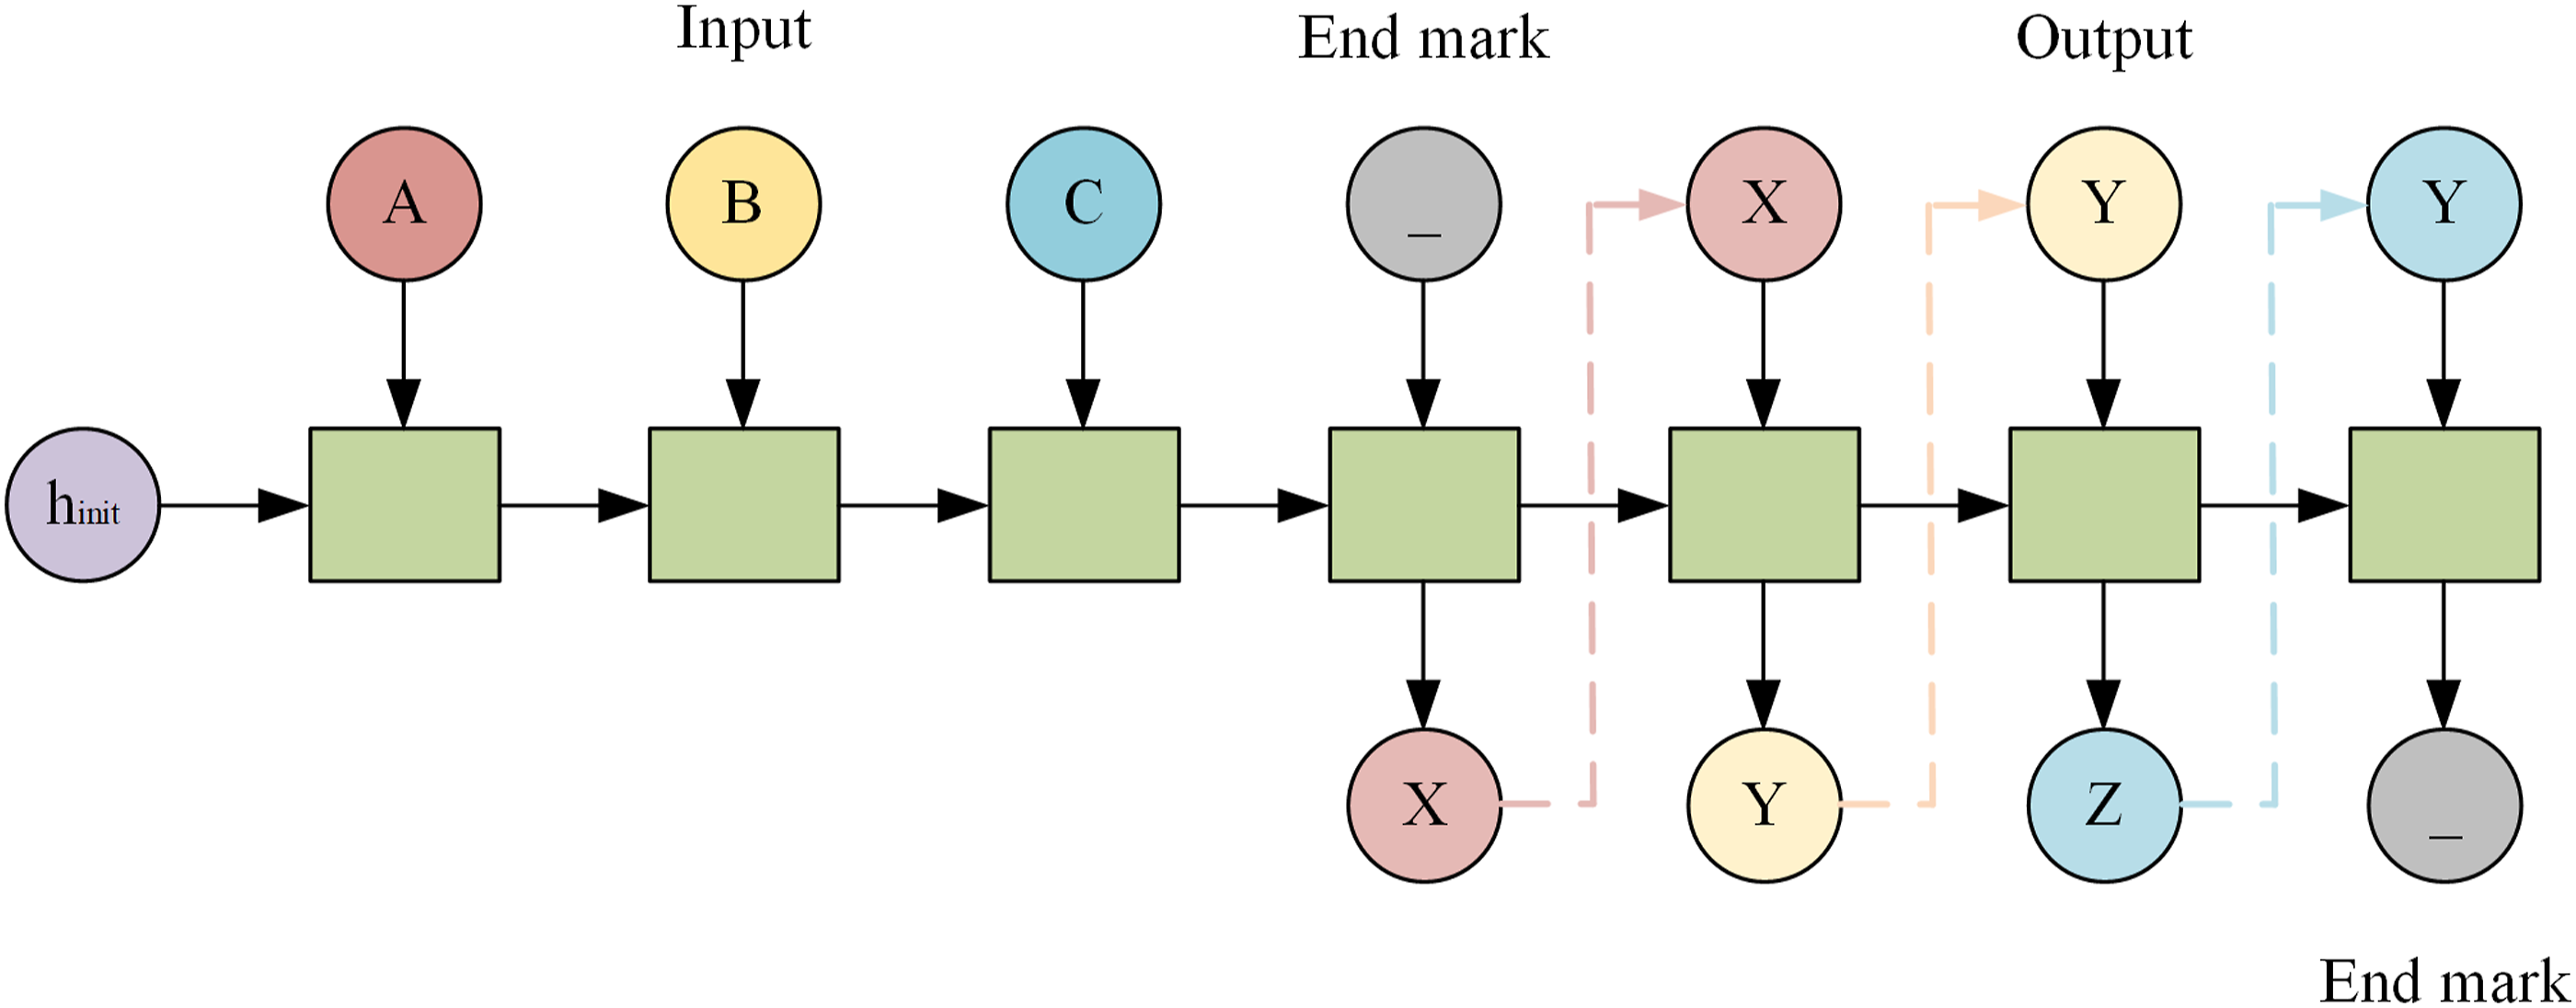
AE is an unsupervised generative network. It can automatically extract effective features from a large amount of input data and is commonly used for dimensionality reduction processing or feature learning of data. The working principal diagram of the AE is shown in Figure 3. The traditional AE uses the full connection between hidden units. The difference is that the convolutional auto-encode (CAE) model replaces the matrix multiplication operation between hidden neurons in the AE with the convolutional operation and pooling operation. Where the convolutional layer acts as a filter and the pooling layer is used to extract invariant features. The AE acts similarly to PCA, but the AE can characterize nonlinear transformations and is suitable for situations where nonlinear data are handled. To better handle spatial information of 2D data, researchers have proposed convolutional auto-encoders, which use convolutional and pooling layers instead of the traditional fully connected layers. Chen et al.
80
used a CAE to adaptively extract a coded feature set from rolling bearings frequency domain signals, then selected high-quality features to construct health indicators. In addition to being used to extract features, Li et al.
81
used time-domain frequency-domain features to construct high-dimensional feature vectors and constructed degraded feature indicators by CAE dimensionality reduction. To effectively improve the evaluation indicators, Qin et al.
82
proposed a deep convolutional auto-encoder (DCAE) network. A stacked auto-encoder can effectively extract data features, and adding sparse constraints to it can effectively reduce the training overfitting problem. Therefore, Yuan et al.
83
performed deep feature learning and feature compression to construct degenerate feature vectors by using a stacked sparse auto-encoder. Xu et al.
84
proposed to use of a deep stacked denoising auto-encoder accumulator to obtain the vibration accumulation sequence values, and finally obtained the cumulative health indicators by normalizing the vibration accumulation sequence values. Wang et al.
85
used a single-layer Nonnegativity Constrained Autoencoder (NCAE) network with the SOM to construct health indicators. Due to the fast training speed and high generalization ability of extreme learning, Lan et al.
86
used samples of bearings health states to train an extreme learning machine auto-encoder, using the loss between reconstructed and original data as indicators. Xu et al.
87
used a stacked noise auto-encoder with multiple hidden layers for noise cancellation in HI. Lu et al.
88
proposed a variance variation and SAE feature dimensionality reduction method for redundancy elimination. An autoencoder schematic diagram.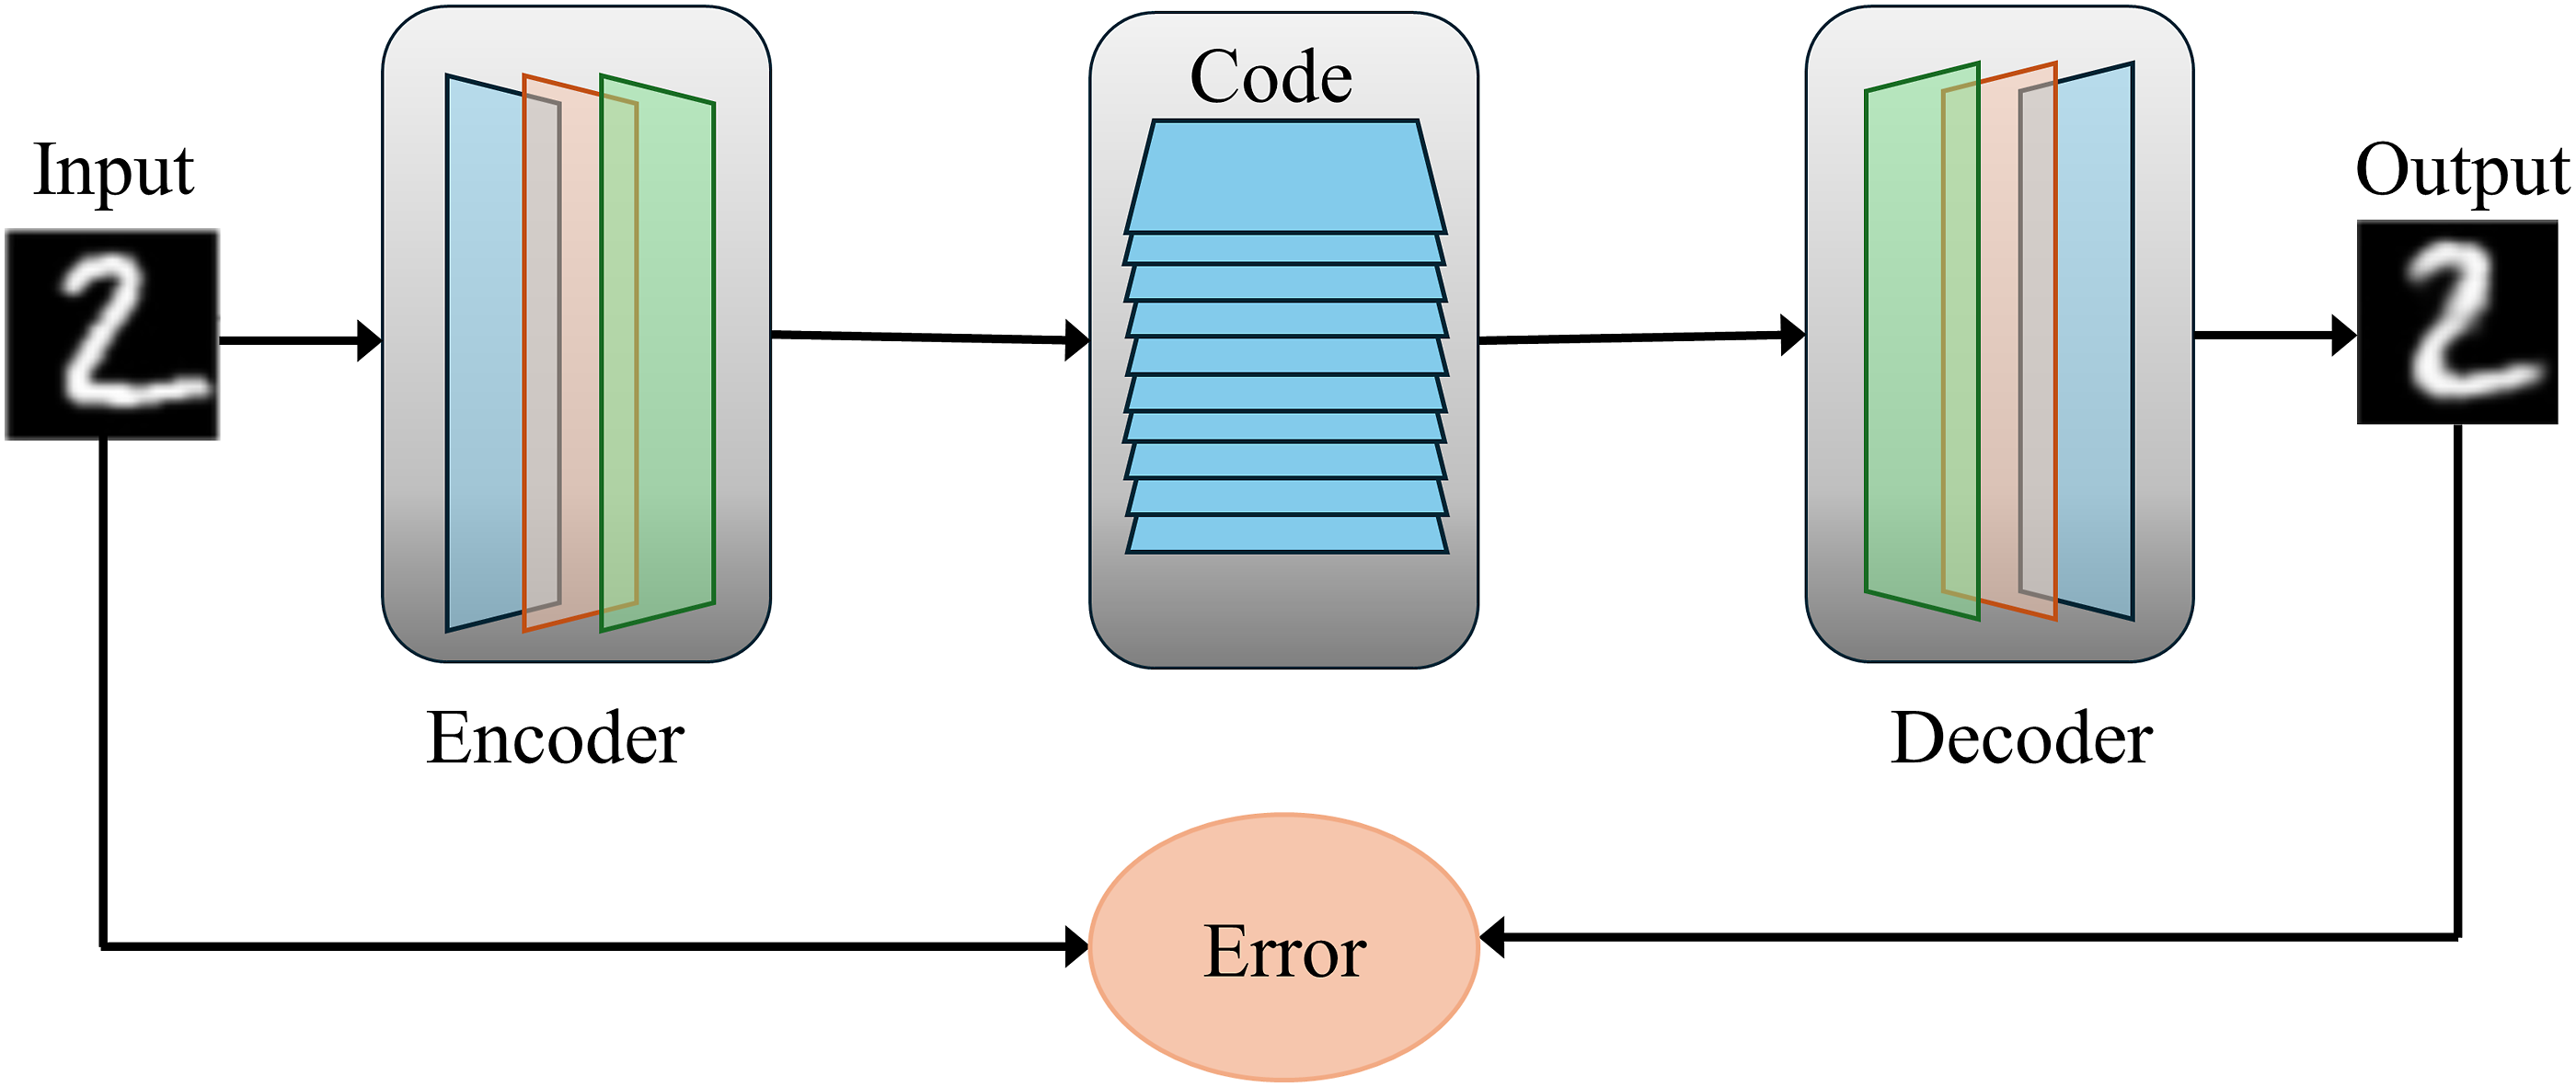
The DBN is a multi-hidden layer neural network consisting of multiple RBM units. Its structure and classification diagram are shown in Figure 4. It can be directly inputted into the original signal for processing, and it has a stronger nonlinear mapping ability than shallow networks such as Markov, support vector machine, logistic regression, and so on. By carrying out feature extraction more fully, it avoids uncertainty in the extraction process and achieves intelligence in the construction of recession indicators. Pan et al.
62
used the support vector to describe the SVDD to merge the sample features of the DBN into the performance indicators. To improve the monotonicity of the extracted parameter-free health indicators, Xu et al.
89
used the DBN to extract sigmoid zero local minima of the health indicator curves. Then the sigmoid-based function was used to reduce the weights of the current health indicator values to achieve the elimination of oscillations. To solve the continuous deep belief network will fail to stabilize the convergence of the training process, Zhou et al.
90
used an improved adaptive continuous deep belief network to extract the hidden fault features, and the distance between the initial operating condition state and the real-time degradation state is used to construct the indicators. The standard CDBN is composed of multiple convolutionally constrained Boltzmann machines, while Yuan et al.
91
constructed a new Gaussian matrix-variable convolutional deep belief network model by using Gaussian visual units, and performance degradation indicators are automatically constructed for the transformed time-frequency information. Wang et al.
92
combined DBN with SOM to process the initial signal into an effective synthetic HI. The DBN structure and usage classification diagram.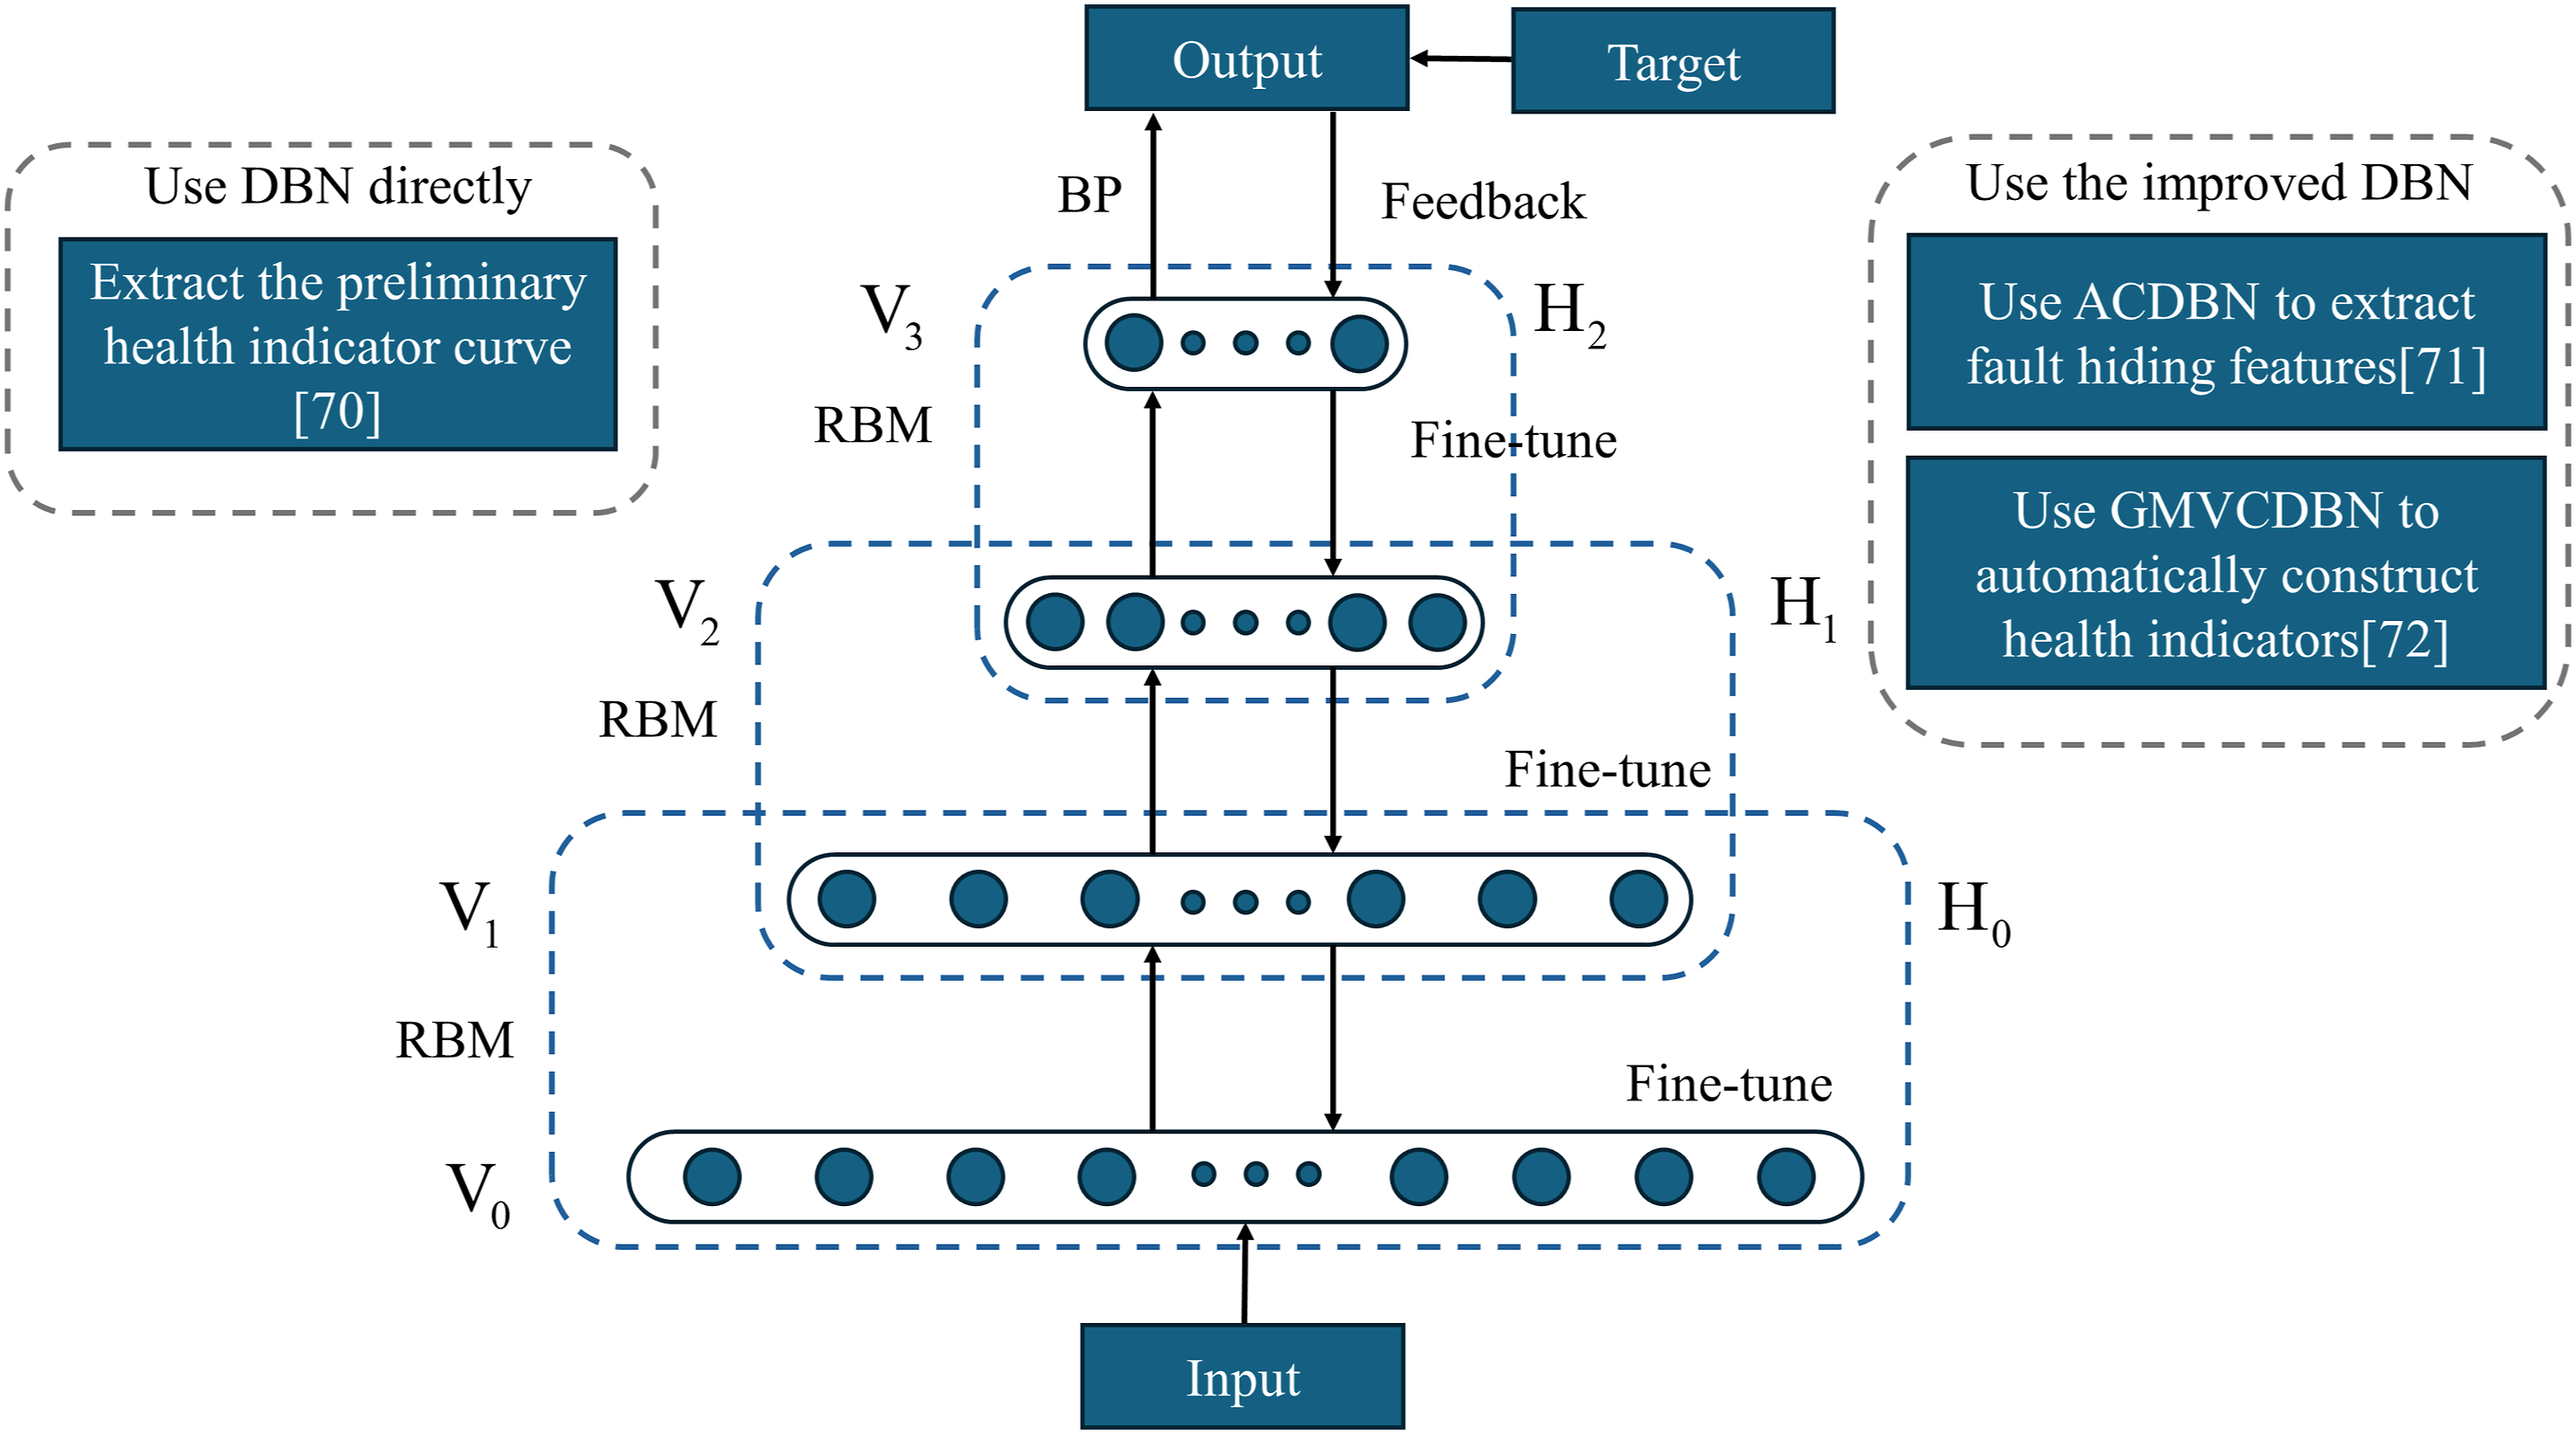
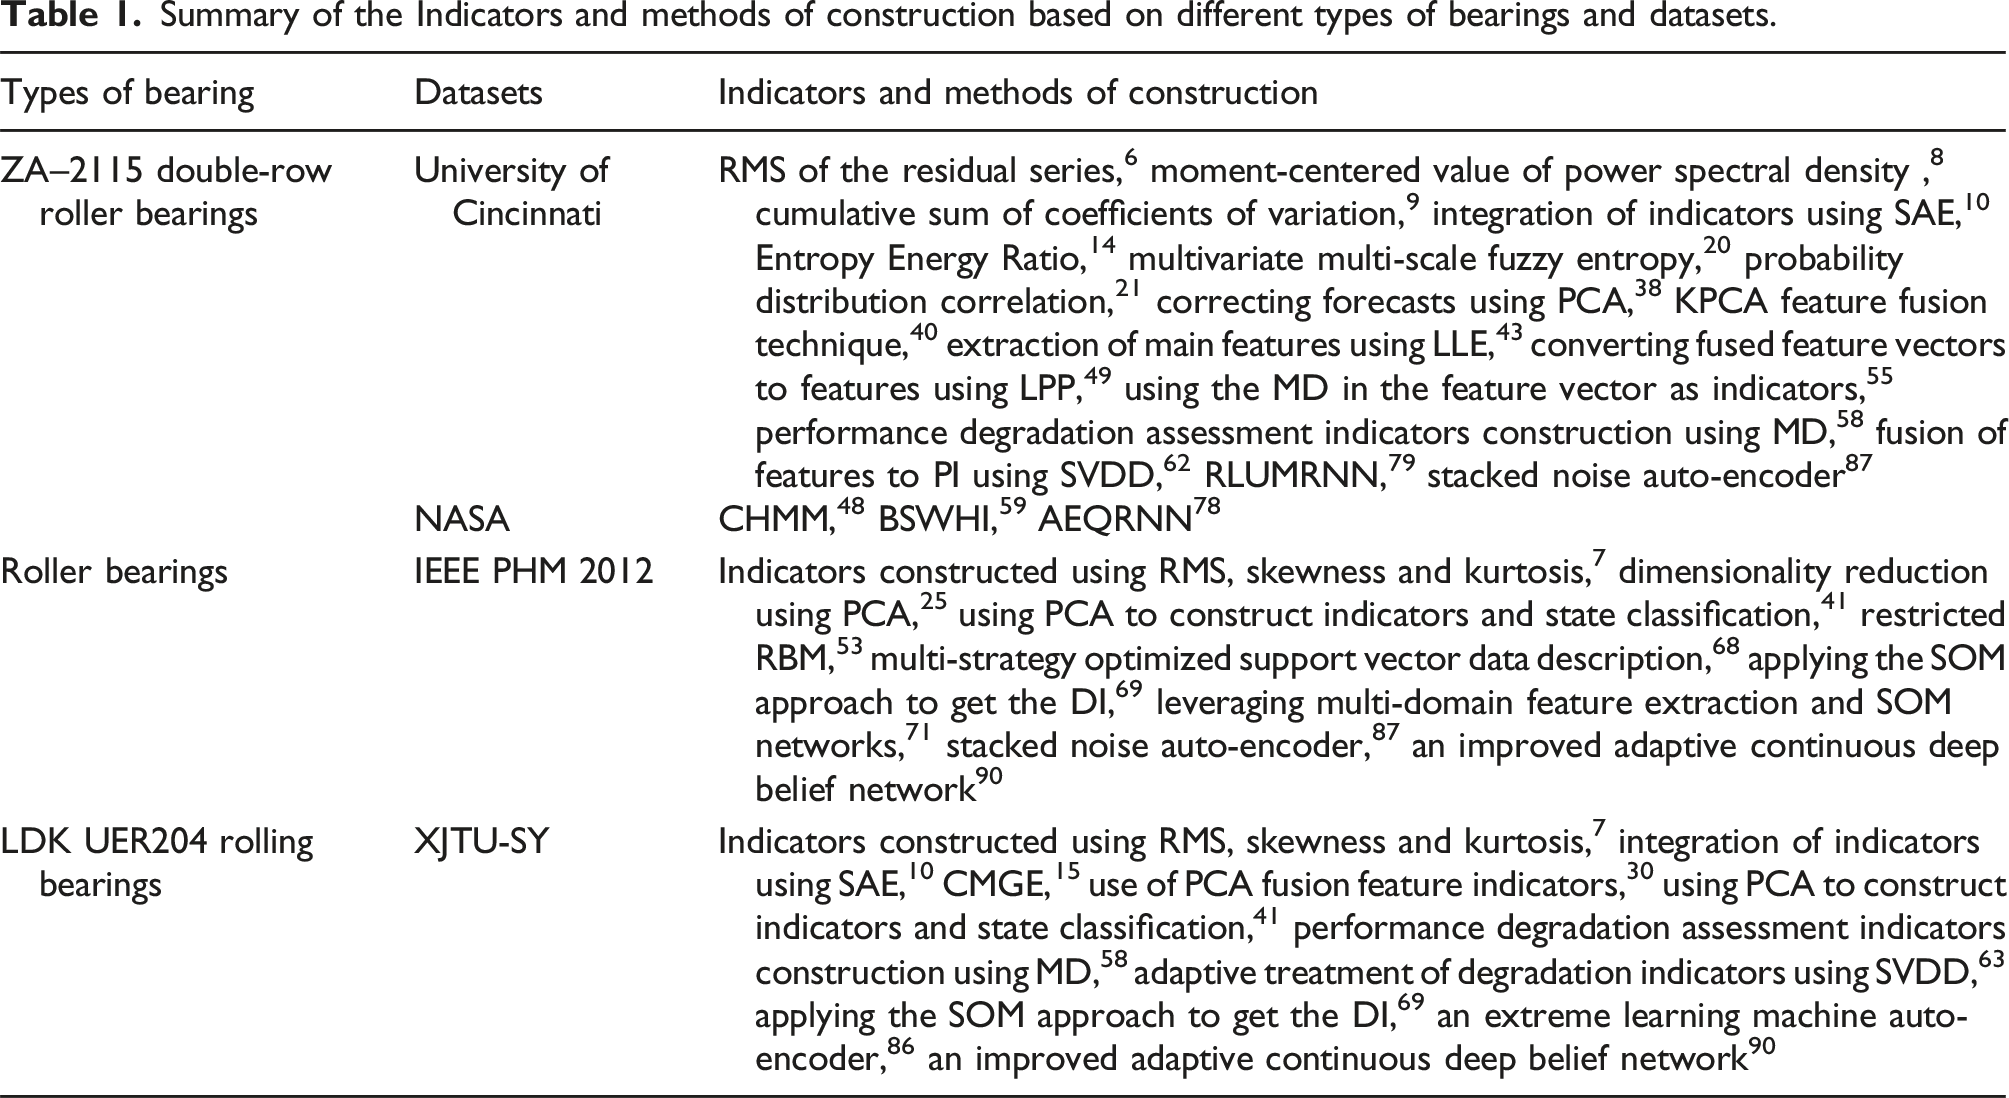
Summary of the Indicators and methods of construction based on different types of bearings and datasets.
Rolling bearing performance degradation prediction models
After the rolling bearing performance degradation indicators are constructed, another key step is to establish a reliable and accurate prediction model to predict the bearing performance degradation trend. The prediction of rolling bearings performance degradation trend is a process of utilizing the historical time series data of bearings to establish a suitable and accurate model to predict the future degradation state of rolling bearings . 93 In recent years, researchers have proposed many performance degradation trend prediction models, and the current rolling bearings performance degradation prediction models can be categorized into two main groups: traditional performance degradation prediction models, and deep learning prediction models.
Traditional performance degradation prediction models
Traditional performance degradation models can be categorized as time series analysis, artificial neural networks (ANN), support vector machines (SVM), probability distribution models, and so on.
Time series analysis is an analytical model based on the principle of statistical analysis. Its main idea is to summarize the trend through the historical collection of data and then predict the future trend of the data. It is characterized by the randomness in the values of each data, the correlation of the data before and after the sequence, and the ups and downs of the data itself. The process of time series analysis is clear, while the neural network process is a black box. This paper summarizes the following three smooth time series models, Autoregressive Model (AR), Moving Average Model (MA), and Auto Regression Moving Average Model (ARMA). Zhou et al. 94 used the AR to extract the coefficients and residuals of the wavelet packet nodes, which were used as combined features. The measured data are interpolated into the fuzzy C-mean model and the Hidden Markov Model, and then the combined features are input into the fuzzy C-mean model, and finally, the performance degradation curve is obtained. Zhuang et al. 95 designed a deep autoregressive recurrent model that can consider the degradation process more comprehensively in conjunction with a statistical model. Zhuang et al. 96 proposed an improved autoregressive integrated moving average model and used the Bayesian information criterion to determine the order of the model, which was ultimately used to predict the degradation trend of health indicators. Wu et al 97 combined the MD with the Exponentially Weighted Moving Average (EWMA) method to reduce manual dependency and improve adaptability and generalization. The combined results are used to characterize the degradation trend of the acquisition performance, and finally, the performance prediction is performed using a fusion model of Sparse auto-encoder and gated recurrent unit (SAE-GRU). Zhao et al. 98 used moving average coarse-grained, fast iterative filtering decomposition, PE, Wasserstein distance, and cumulative sum method to construct bearings degradation state indicators to realize the identification and evaluation of bearings degradation state. The time series analysis method is characterized by its simplicity and ease of use. However its accuracy is poor, and there are now many other prediction models to compensate for its shortcomings.
The ANN is a dynamic system built manually with a directed graph as its topology. Due to the nonlinearity and instability of vibration signals of mechanical equipment, the neural network prediction methods are very suitable for trend prediction of mechanical equipment. The ANN is a traditional neural network whose structure usually consists of an input layer, a hidden layer, and an output layer. By optimizing the implicit layer structure, it can fit any arbitrary function with any accuracy better, which is suitable for the construction of nonlinear models with high accuracy requirements. Therefore, artificial neural networks are superior to time series analysis. ANN can fully approximate any complex nonlinear relationship, and all quantitative or qualitative information isotopically distributed and stored in each neuron of the network. Therefore, ANNs are robust and fault-tolerant, which makes it possible to perform a large number of operations quickly and handle both quantitative and qualitative knowledge. ANN mainly simulates the working process of the human brain by connecting nodes in their structure and can automatically extract features from monitoring data. Wang et al. 99 used the framework of the ARMA-ANN hybrid prediction model to predict the IMF sequences and then selected the sensitive modes containing essential information to characterize the state of the machine. However, ANN has the disadvantage of huge training parameters, which leads to a relatively long training time.
The SVM was formally proposed by Cortes & Vapnik in 1995 as an implementation of statistical learning theory, which better implements the idea of structural risk minimization. 100 To cope with the difficulties of slow training speed and large storage capacity of SVM, researchers introduced the least squares support vector machine to transform solving the quadratic programming problem into solving the linear least squares problem in high-dimensional space, which simplifies the computational process and improves the training speed. SVM inherits several techniques such as relaxation variables to better solve the practical problems of high dimensionality, nonlinearity, small samples, over-learning, local minima, etc. It has come to a new research hotspot of machine learning after neural network research. Gao et al. 101 proposed the use of the gray model for feature value prediction and then trained a binary tree support vector machine for degradation trend prediction. Chen et al. 102 proposed degradation trend prediction based on IE, fuzzy granularity, and least squares support vector machines. Kumar et al. 103 applied Kernel Ridge Regression (KRR) and support vector regression methods on Dynamic Time Warping (DTW) algorithm features to predict bearings degradation trend. Niu et al. 104 conducted comparative experiments of four schemes, DSDAE with TDSVR, MDCUSUM with TDSVR, DSDAE with TDLSSVM, and MDCUSUM and TDLSSVM, by using open datasets. The analysis of the prediction indicators concludes that the deep stacked denoising auto-encoder (DSDAE) and the time-lagged least squares support vector machine (TDLSSVM) schemes can better predict the trend of the rolling bearing health state. Chen et al. 105 characterized the variable frequency signals by IE, and these constructed feature indicators were fed into a correlation vector machine for performance degradation prediction. Gao et al. 106 used the isometric mapping (ISOMAP) algorithm to reduce the dimensionality of the high-dimensional feature set, and then put the comprehensive feature indicators through the logistic regression model to establish a reliability model. Finally, the nonhomogeneous cuckoo search-least squares support vector machine (NoCuSa-LSVM) model is used to predict the degraded state characteristics of bearing performance, and the results are embedded into the constructed reliability model, so as to obtain the prediction results of the operational reliability of the bearings. Zhang et al. 107 proposed a time-shifted least-squares support vector machine with integral operators for predicting performance degradation. However, the least squares support vector machine model itself does not have the data memory function and cannot uncover the special information relationship between the time series data. Zan et al. 108 extracted the features of the feature values and then used the joint approximate diagonalization of eigen-matrices (JADE) method to represent the fusion features of performance degradation. Then a prediction model based on particle swarm optimization support vector machine (PSO-SVM) is constructed to predict the performance degradation trend. The SVM is one of the current research hotspots, and its gradual improvement can play a positive role in performance degradation prediction.
Some of the probability distribution models have good noise immunity. Considering the uncertainty ignored by deterministic neural networks, the probability distribution model is therefore more practically applicable. Commonly used probability distribution models are Poisson distribution, maximum entropy, Weibull distribution, Dirichlet distribution, combinatorial distribution model, and so on. Xia et al. 109 proposed a method to predict the performance degradation trend of rolling bearings based on the Poisson counting process. In addition to the separate Poisson distribution model, Xia et al. 110 proposed new concepts such as probability of change, speed of change, and acceleration of change. Then a reliability prediction model based on the maximum entropy principle and Poisson process was constructed to predict the change process of rolling bearing vibration performance reliability. Wang et al. 111 developed the Lévy process model to cope with the problem that machine performance degradation exhibits nonlinearity and non-uniformity by including a non-uniform composite Poisson process term for capturing transient performance variations. By calculating the moments of the Lévy model eigenfunctions, explicit expressions for predicting performance degradation and RUL probability distributions can be derived. From experiments, it is known that it outperforms multiscale crack extension models and multistage modeling based on PF estimation. Zhang et al. 112 proposed a type II-GLD position scale model based on the combination of type II generalized logistic distribution (II-GLD) and the position scale model. The model performs better than the Weibull model and normal distribution assessment, and the relative errors of mean and variance between the model and the actual data are less than 2% and 8%. Zhou et al. 113 regarded the prediction of the visual geometric group (VGG) neural network as a subjective opinion by placing the Dirichlet distribution over the category probabilities capable of estimating the prediction uncertainty and avoiding the overconfidence of out-of-distribution OOD data. In addition to these models, there is the Three-parameter Weibull (3-PW) distribution model, 114 the generalized polynomial chaos theory model, 115 and so on.
Deep learning performance degradation prediction models
Deep learning models include CNN models, recurrent neural network models, etc. At present, deep learning is one of the research hotspots. There are more kinds of deep learning algorithms, which can overcome most of their problems through algorithmic improvement and reduce the burden of researchers to process data manually in the prediction field. In recent years, deep learning algorithms have achieved fruitful results in fault feature extraction, RUL prediction, and performance degradation prediction of rolling bearings.
Predictive modeling based on convolutional neural network
The CNN is a kind of deep neural network containing convolutional layers and one of the current hotspots of neural network research. It can extract useful information from high-dimensional raw spectra without human intervention, thus reducing manual operations. The CNN model can convert low-dimensional data into data with high-dimensional features using multilevel nonlinear modules. Through feature extraction, models with complex feature representations can be obtained eventually. Nowadays, fewer models directly use CNN for prediction, and researchers prefer to use improved or combined CNN models. Singh et al. 116 proposed the CNN-CMF-EEMD method for composite fault prediction of bearings, which is good for classifying fine compound faults.
Temporal convolutional networks (TCN), as improved CNN, are extremely common in the field of fault prediction. Yu et al. 117 used the TCN algorithm to predict the bearings degradation trend. Yan et al. 118 proposed to use the sample entropy as the performance degradation indicator of bearings. After preprocessing, the SPT point of the bearing is determined according to the linear regression model and μ + 3δ, and then the effect of different window lengths on determining the SPT is analyzed. Finally, the preprocessed sample entropy value is input into the trained TCN for degradation trend prediction. To achieve the effect of having a wide range, Liu et al. 119 proposed a method based on the construction of health indexes (HIs) using a multi-domain high-dimensional vibration signal feature set and the use of TCNs for performance degradation prediction, which can also be used for other mechanical parts. Based on the combined model of TCN, Gao et al. 120 proposed a Swish activation function and filter response normalization-based temporal convolutional network (SFTCN) for failure prediction. Wang et al. 10 proposed to input the time-domain feature degradation indicators and frequency-domain feature degradation indicators into the SAE model, and then input the fused feature indicators into the TCN- Attention model to obtain the rolling bearings performance degradation trend.
Deep residual networks are a type of improved CNN with the advantage of reducing the training difficulty of the network parameters, while deep residual shrinkage networks are a further improvement. Liu et al. 121 proposed the use of a deep residual shrinkage network (DRSN) to extract local abstract features and a deep long short-term memory network to extract time series information. This model is more sensitive to early faults compared to other deep learning models. To address the poor adaptability of vibration data, Song et al. 122 proposed a multiscale stacking deep residual shrinkage network (MSDRSN) model.
In addition to this, there are improved CNNs such as graph convolutional neural networks, deep convolutional neural networks, and so on. The research of prediction models based on the CNN has the following characteristics: good adaptability to the engineering equipment that needs to deal with massive data; and a high degree of automation, which effectively reduces manual participation and intervention. At present, the prediction model based on CNN still needs to be deeply researched.
Predictive modeling based on recurrent neural network
Degradation of rolling bearings is a process of gradual accumulation and continuous development, and the changes in its state are closely related to the real-time monitoring data, as well as the monitoring data of historical moments. The RNN is a kind of memory network that can synthesize the memory information of the current and historical stages and make predictions, which effectively solves the problem that traditional neural networks cannot make full use of historical information data. The development of RNNs is relatively fast, and their application in prediction has been very extensive. However, to be more stable and to cope with the problem of “memory loss”, researchers nowadays prefer to use the improved recurrent neural network, i.e., the long short-term memory model. Long short-term memory networks can maintain and update long-term dependency information over multiple time steps, thus overcoming the limitations of standard RNNs in dealing with excessively long temporal information.
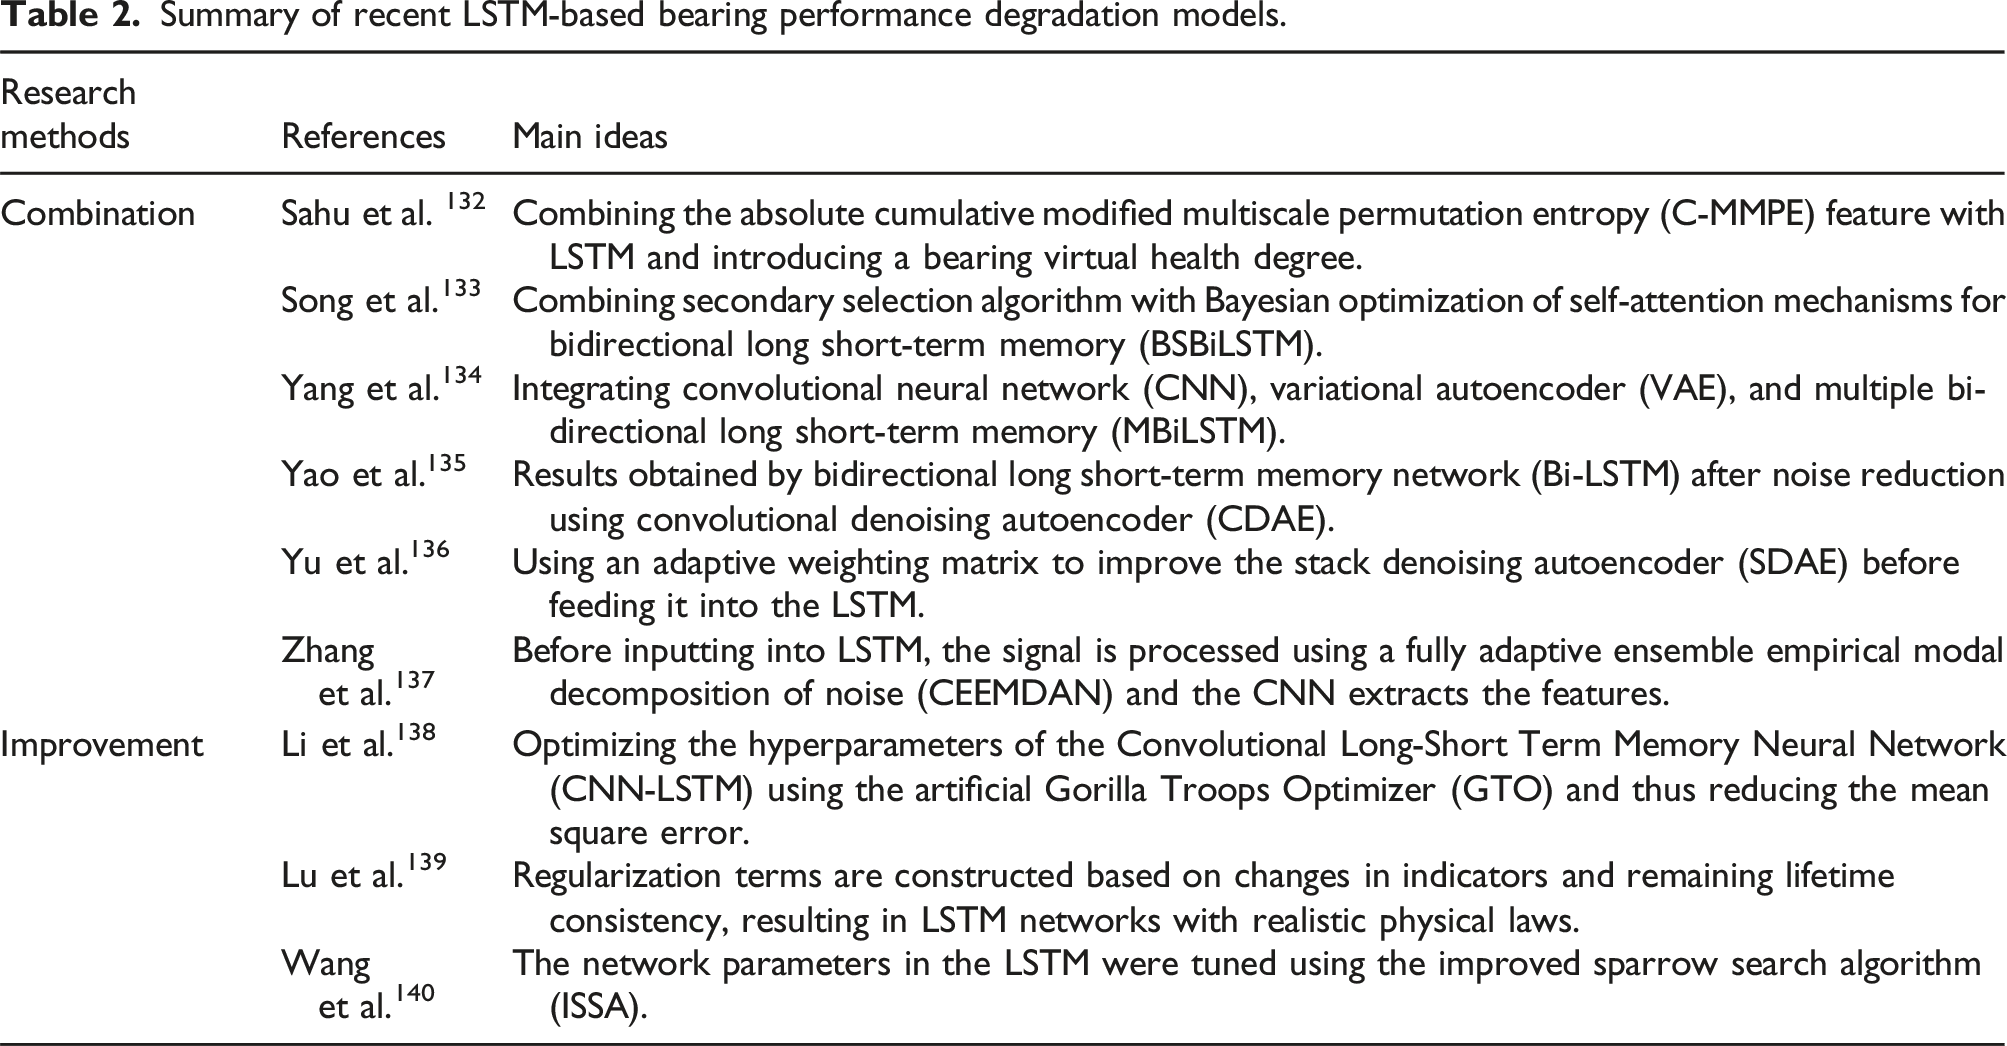
Summary of recent LSTM-based bearing performance degradation models.
Due to the relative complexity of the structure of the LSTM, it will cost too much time in training and prediction. The researchers analyzed the structure of the LSTM, adjusted the structure of the network to achieve dynamic control of the time scale and the forgetting behaviors of different units, and then proposed the model of the gated recurrent unit (GRU). The structure of the GRU is shown in Figure 5. The main difference between the GRU and the LSTM is the use of two control units, the post-merger update gate and reset gate, to control the network forgetting and updating states. The GRU not only retains the LSTM effect but also makes its internal structure simpler and more scalable. The GRU models are often used in combination with AE in bearings degradation trend prediction. Wei et al.
141
proposed a convolutional noise reduction auto-encoder that contains the GRU. The encoding unit consists of a noise addition layer, a first GRU network, a convolutional layer, and a pooling layer. The decoding unit consists of a connected inverse convolutional layer, an inverse pooling layer, and a second GRU network. The system can adaptively extract the timing features of a bearing’s time-sequential vibration signals to enhance the feature extraction capability and reduce the noise influence. The hidden layer features are input into a classifier for identification to achieve accurate and efficient bearing fault prediction. To enable the model to effectively screen the optimal features, Wu et al.
97
proposed the method of combining the MD with the exponential weighted moving average (EWMA) method. Then the method of performance degradation prediction using a sparse auto encoder-gated recurrent unit (SAE-GRU) fusion model significantly improves the prediction accuracy of the model. Li et al.
142
proposed the quantum attention recurrent encoder decoder neural network (QAREDNN), in which quantum neurons are used to construct a new quantum gated recurrent unit (QGRU). The QGRU traverses the solution space more finely than the recurrent units of conventional encoders and decoders. The above studies show that the GRU model is one of the research hotspots, fewer studies are using the gated recurrent model alone, and more researchers are carrying out the improvement or combination of GRU. GRU network model structure.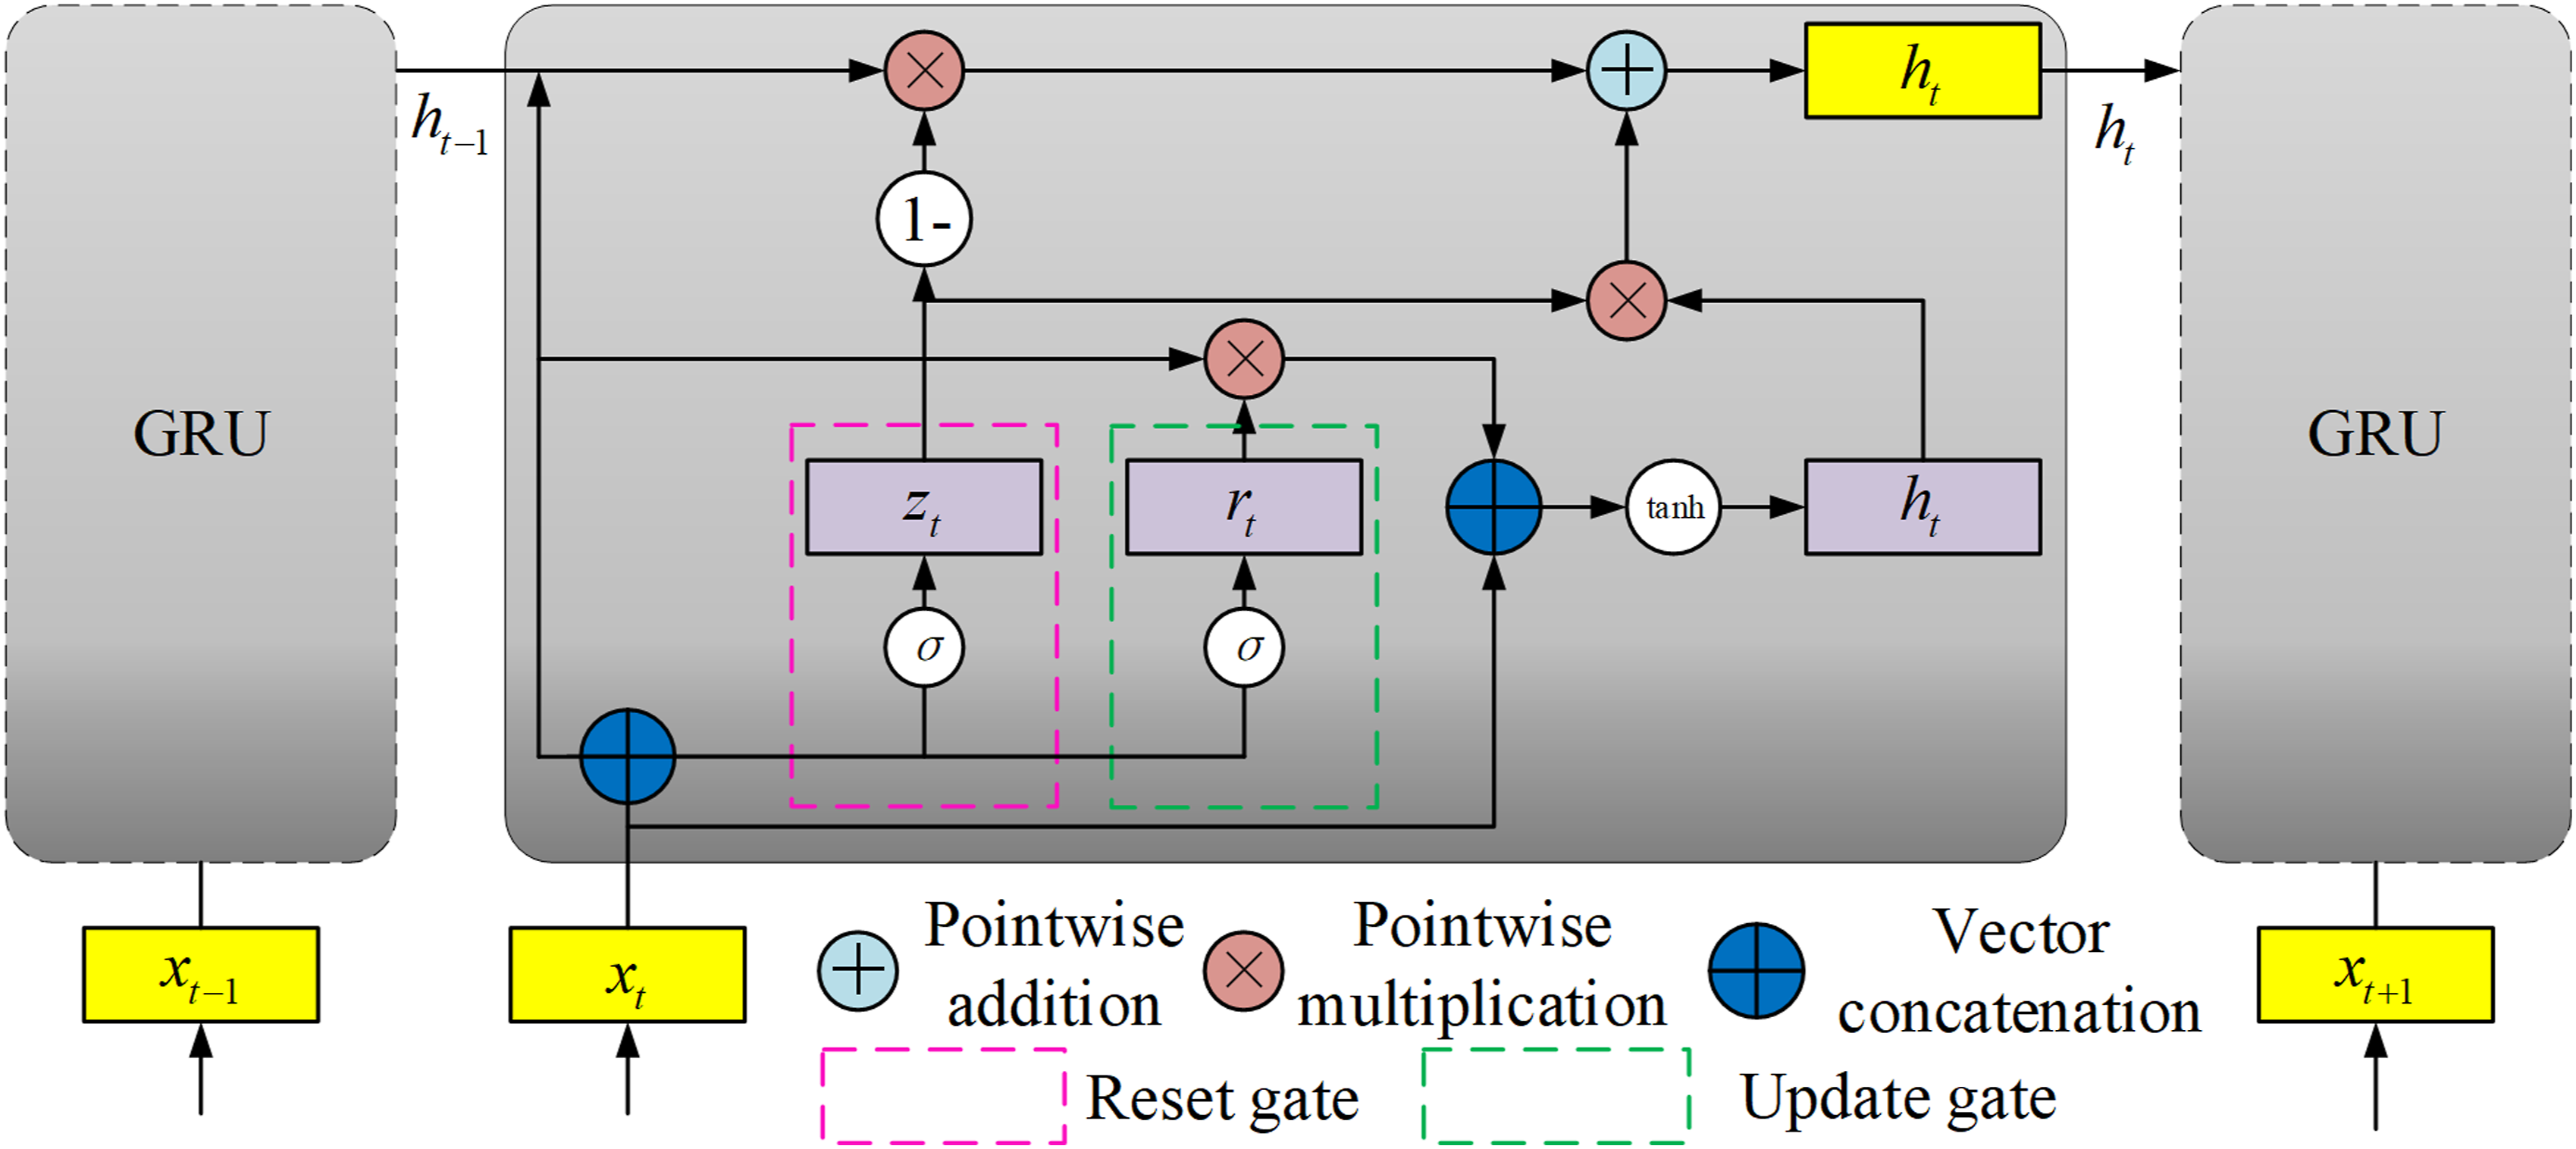
Traditional RNNs need to solve the problem of their prediction accuracy and have poor compatibility with multidimensional data, so they need to be combined with other methods to study new prediction models. Existing improved RNNs are multilayer RNN, bidirectional RNN, dynamic RNN, and so on.
Deep learning, as an end-to-end learning approach, is largely free from human intervention during feature extraction and empirical dependence on engineering diagnosis, but there are still a large number of parameters that require human intervention in the modeling process. At the same time, it cannot get rid of the constraints of large sample training and is incapable of uncertainty representation.
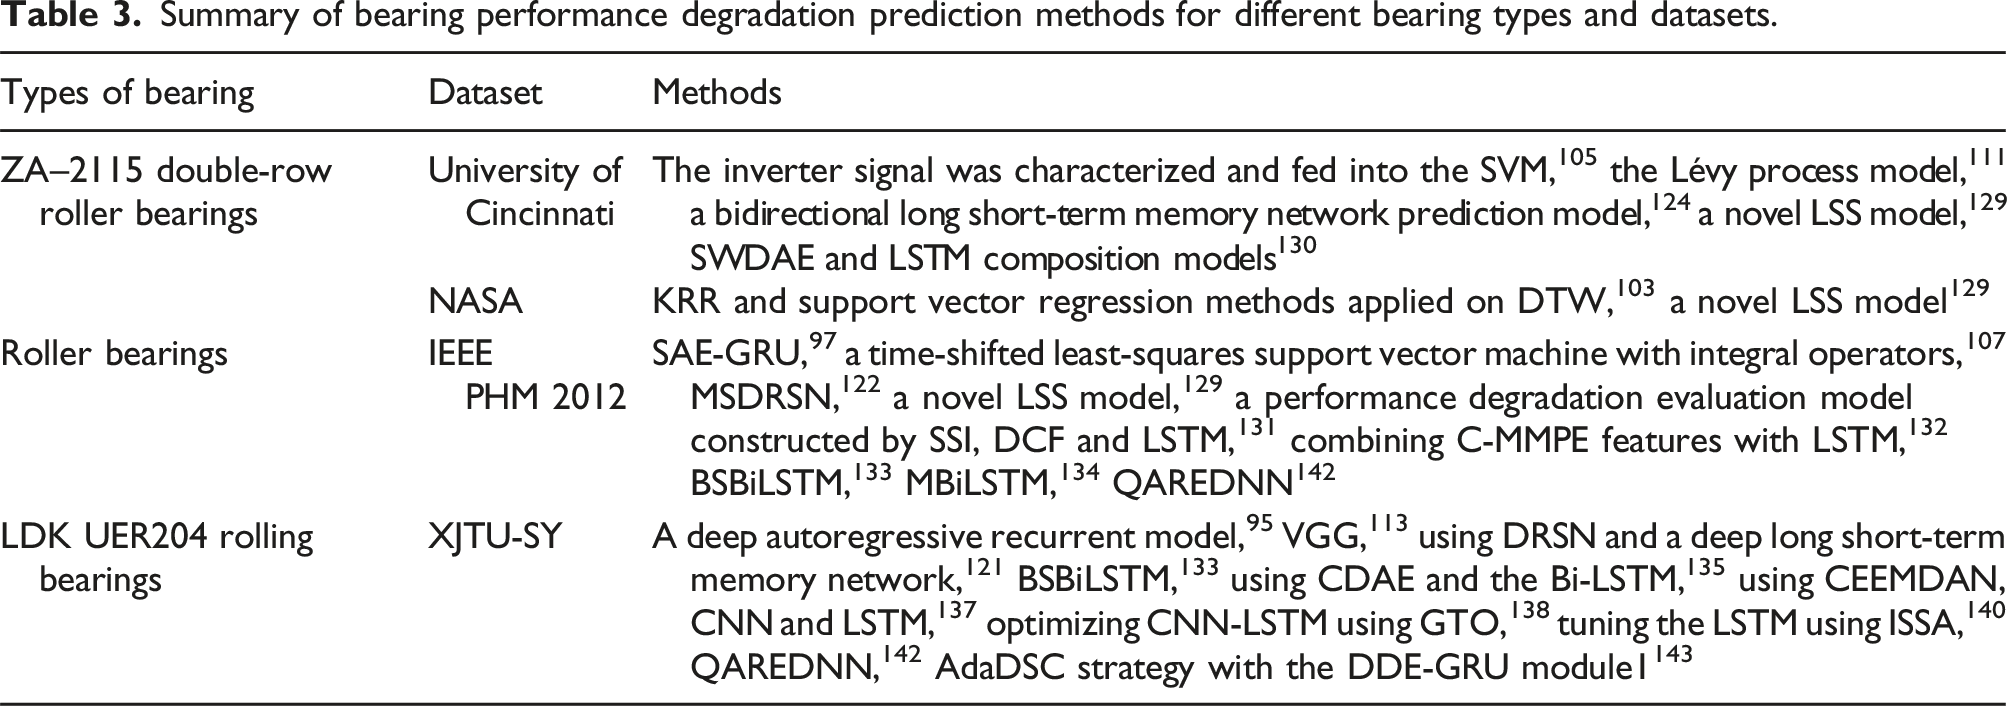
Summary of bearing performance degradation prediction methods for different bearing types and datasets.
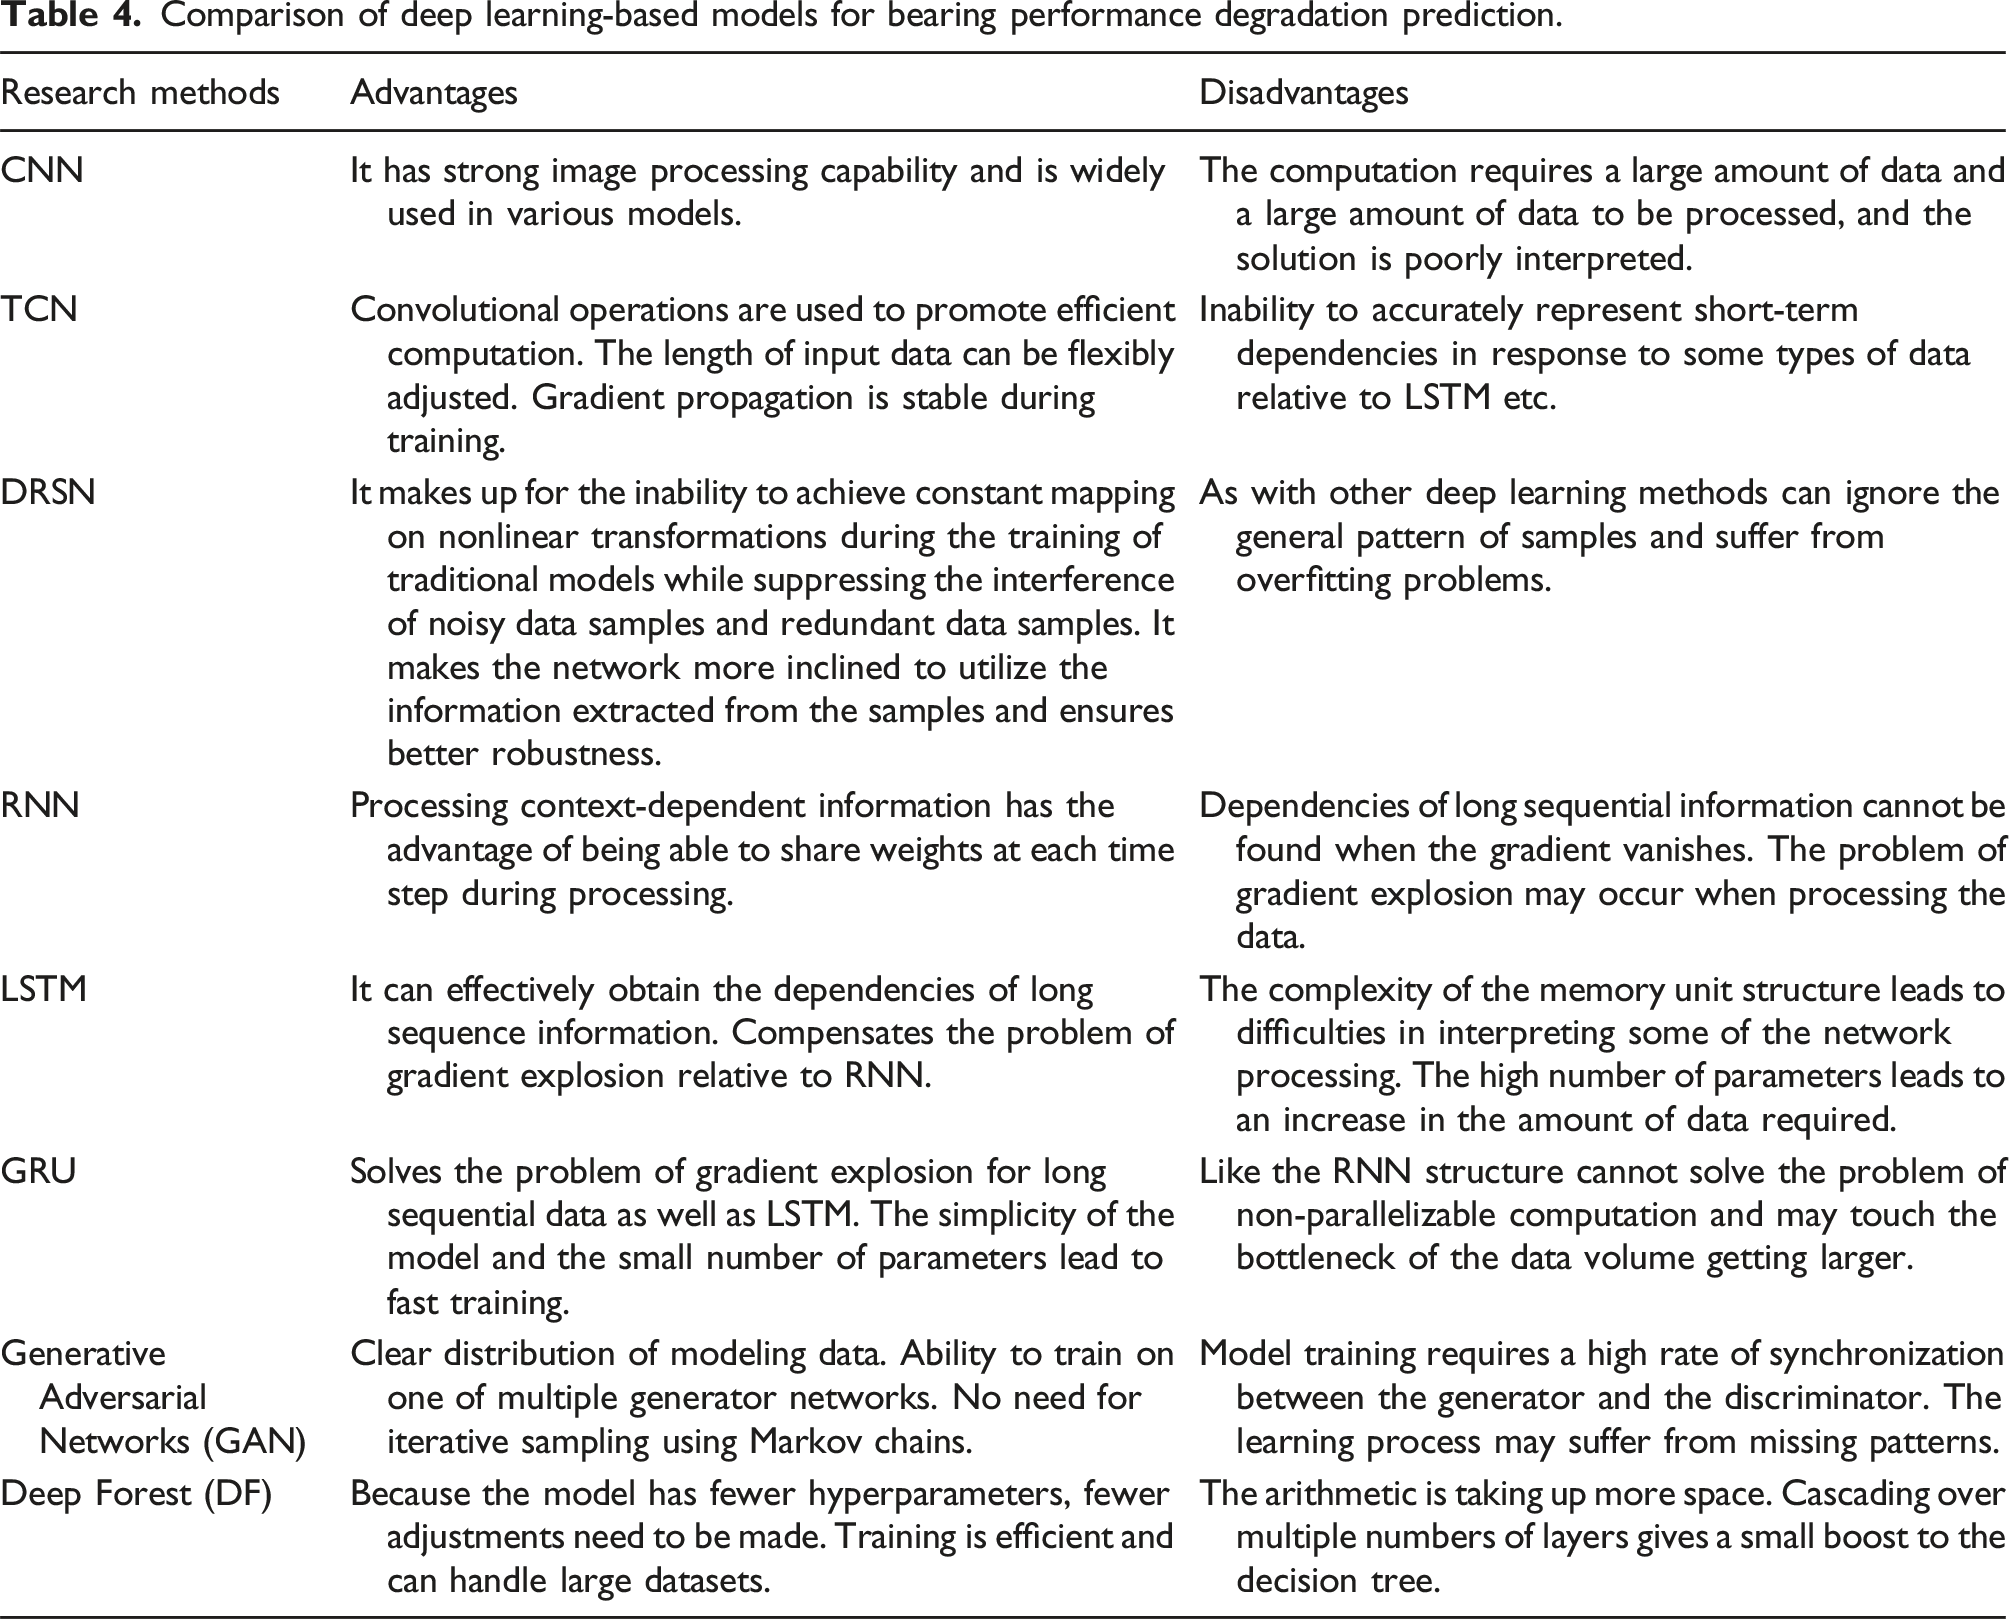
Comparison of deep learning-based models for bearing performance degradation prediction.
Conclusion
This paper constructs a classification of rolling bearing performance degradation indicators construction methods and prediction models, as well as the derived subcategories under the classification of various methods, through a review of academic literature and patents. For analyzing the content of the literature, this paper collects relevant patents and academic literature to define current research and development in rolling bearings performance degradation prediction. This paper describes representative rolling bearings performance degradation indicator construction methods, models, and their categorization. Depending on the different types of use, the construction methods are divided into physical recession indicator construction methods, virtual recession indicator construction methods, and deep learning-based indicator construction methods. In addition to this, this paper reviews the structural characteristics and applications of different types of performance degradation prediction models. Among them, this paper argues that the LSTM model is simple in structure, efficient in operation, and convenient in operation. However, in the face of the improvement of other deep learning algorithms, the LSTM model still has a lot of possibilities for improvement. This paper will provide a meaningful reference for rolling bearings performance degradation trend prediction.
For the emerging predictive technology text retrieval, there are three deep learning methods used to derive analytical results, i.e., CNN model, GRU model, and LSTM model. After discovering the key domain technologies, the results can be mapped to the respective research areas to identify research and development opportunities. With the updated iterations of sensor and experimental device structures, the development of deep learning algorithms, and the continuous improvement of related technologies and theories, more mature rolling bearings performance degradation trend prediction models will appear in the future. This paper will review and discuss the future research directions of rolling bearings performance degradation trend prediction: deep learning, digital twin, high dimensionality, and adaptive research.
Current and future developments
Through the summary of the above review, it can be seen that researchers have carried out in-depth and extensive research on the construction of performance degradation indicators and trend prediction of rolling bearings, which has resulted in fruitful research results. In-depth analysis of the current research situation in this direction, combined with the significant features presented by the construction of performance degradation indicators and trend prediction in the context of big data, three development trends are sorted out: deep learning-based rolling bearings degradation indicator construction method; digital twin-based rolling bearings performance degradation trend prediction method; high-dimensional, adaptive rolling bearings performance degradation prediction method. (1) The traditional rolling bearings degradation indicators suffer from monotonicity leading to a lack of rigor, low trend leading to difficulty in prediction, and inaccurate failure thresholds leading to greater errors. With the updated iteration of sensors and the rapid development of the types of deep learning algorithms, the methods of constructing performance degradation indicators based on deep learning are gradually coming to be a research hotspot in this field. On the one hand, deep learning models have often used in bearing performance degradation prediction models in recent years to construct indicators as part of the whole. The evaluation of indicators is conducive to filtering out high-performing individuals among a wide variety of degradation indicators. The merit of the type of performance degradation indicators will directly affect the later prediction of performance degradation trends and the delineation of degradation stages. Therefore, constructing more effective indicators to characterize the performance degradation trend of rolling bearings is one of the next development trends in this field. On the other hand, the types of rolling bearings monitoring data collected by sensors are rich and varied. In response to the increasingly abundant data types, research on how to modify deep learning algorithms to adapt to these formats and try to mine the performance degradation data embedded in different types of data is another development trend in roller bearing health assessment methods. (2) In addition to the deep learning algorithm-based rolling bearings performance degradation trend prediction, digital twin technology has also been developing rapidly in recent years. The use of digital twin technology for performance degradation trends can compare the results with traditional prediction methods and verify that the proposed methods can effectively solve the small sample problem. Some of the existing research suggests that digital twins can combine aspects such as neural networks for deep learning methods. The accuracy of the prediction results is improved compared to the model without combination under the same experimental conditions. Researchers have experimentally verified the effectiveness of the improved rolling bearing digital twin and the availability of simulation data. There are fewer studies applying data twins to degradation trend prediction, making data twin technology an important development trend in this field. (3) The high-dimensional features and tensor features take into account the influence of multi-dimensionality on the data and its correlation, and at the same time reduce the interference of noise, while reducing the interference of noise, facilitating the construction of performance monitoring indicators and the prediction of performance degradation trends. For example, the calculation of entropy value, the determination of failure thresholds, and the parameters of the degradation prediction model need to be individually parameterized. If adaptive models can be developed, experimental parameters can be recognized in real time, reducing the interference of human experience. The option would not only improve efficiency but also accuracy. Therefore, the high-dimensional, adaptive rolling bearings performance degradation prediction methods are the trend of future prediction method development.
Footnotes
Declaration of conflicting interests
The author(s) declared no potential conflicts of interest with respect to the research, authorship, and/or publication of this article.
Funding
The author(s) disclosed receipt of the following financial support for the research, authorship, and/or publication of this article: This work was supported by The National Natural Science Foundation of China (Grant No. 52175502), and The Heilongjiang Provincial Natural Science Foundation of China (Grant No. LH2023E082).