
Abstract
Noise pollution is caused due to heavy traffic density, industrialization and commercialization. It causes physical, physiological and psychological damage to human being. The present study aims to analyse the noise levels in Jamshedpur city through the application of noise pollution indices (L10, L50, L90, Noise climate (NC), Equivalent continuous noise level (Leq), Noise pollution level (Lnp) and Traffic noise index (TNI). The spatial characteristics of noise levels were assessed at different time intervals. Noise level was measured at 11 different locations from four zones viz. Residential, Commercial, Industrial and Silence zone. Noise level for commercial zone were highest at all the time intervals and ranged between 73 and 99.7 dB (A). The spatial analysis through ARC-GIS (a geographical information system software) showed the maximum noise during 12-1 pM. However, the minimum noise at most of the sites was observed during 12-1 a.m. because of lesser crowd and fewer traffic densities. While comparing with national and international standards, it was observed that not only residential, commercial and industrial zone but silence zone violated the recommended limits of noise level. Hence, policy makers, management and individual should come forward and actively participate to combat noise pollution status in the industrial city, Jamshedpur.
Keywords
Introduction
Sound creates vibration in particles which propagate through an acoustic wave; waves could be longitudinal or transverse. Sound has capability to travel through air, water and solid. 1 Vibration in particles creates sensation in the ear and brain decodes those auditory senses according to its memory of that sound. 2 High amplitude causes louder sound. 3 Normal hearing frequency range is about 20 to 2000 Hz, but audible range is 0 to 180 dB(A). Noise is a distorted form of sound energy which has no information and arbitrary intensity of signals. 4 Noise is the unknown parameter that aggravates our auditory nervous system which correlates with non-auditory disease like hypertension, headache and stress. 5 Noise pollution arises over unremitting disquieting sound that not only disturbs the human being but also the other living organism like feathered friend and even in under water organisms too.6,7 Developing countries are facing this pollution due to fast emergent urbanisation and industrialization. 8 Noise pollution has reached to the disturbing level over years due to unceasing construction work, traffic noise, indoor noise of different house machinery and industrial noise. 9
The primary sources of noise pollution include industrial, traffic, and community noise, with traffic noise having the most significant impact on the living being. 10 In urban areas, noise from traffic contributes to about two-thirds of overall noise pollution, with nearly 80% of it coming from road vehicles. Various factors influence vehicle noise, including engine and exhaust systems, aerodynamic friction, and the interaction between tires and the road. 11 Managing road traffic noise has become a major challenge for urban planners and environmental engineers in modern cities. 12
Noise pollution is known to cause adverse health effects on living beings. In human, noise pollution causes physical disorders, deprived sleep, increased blood pressure, heart-related disease, disrupted metabolic ability, disturbed psychological activities, impaired cognitive activities and reduced the ability to perform any work.13,14 Physical disorders include hearing impairment and masking of acoustic signals or cues. Increase threshold value of hearing measured by audiometry, defined as hearing impairment. More than 8 hour exposure to sound level of 70 dB(A) could cause impairment in hearing. Heavy traffic noise more than 85 dB(A) has potential to create hazardous effect on ear. 15 Sleeplessness causes emotional and mental stress, reduced work efficiency, anxiety and depression in human. 16 In addition to this, noise pollution affects the endocrine and neural system thereby disrupting the functioning of cardiac activities such as hypertension, irregular heart-beat, and vasoconstriction.17,18 Noise pollution is also known to cause psychological effects depression, anxiety, reduced communication, irritation, stress and abnormal social behaviour. 19 These aforementioned effects are more severe in foetus, infants and children. 20 Apart from these effects on human, heavy noise also produces adverse effects on other animals. Farzadinia et al. 21 stated that noise also affected the reproductive system of animals by altering the reproductive hormonal (ACTH, cortisol and testosterone) level. An investigation on Bats by Domer et al. 22 concluded that noise can reduce their attention and can disrupt them from doing their primary work, such as movement, foraging, mating, hunting and catching prey. Therefore, assessing the noise related issues and implementing suitable methods for controlling noise and its deleterious effects have become an important concern for world. Indian government has introduced many acts and legislations to control noise pollution. The Environment (Protection) Acts of 1986 23 identifies noise as one of the pollutions and gives the power to make rules to set the upper and lower limit of noise levels. In 2000, Noise Pollution (Regulation and Control) Rules, 2000 came into existence. Noise Pollution Rule (2000) defines different zones including Residential (RZ), Industrial (IZ), Commercial (CZ) and Silence (SZ) with permissible noise limits.
A number of articles are present focussing on the air pollution,24,25 water pollution 26 and sediment pollution26–28 and their possible effects on plants, animals and human29,30 in industrial cities. These articles have reflected that water, soil and air pollutants have produced detrimental effects on health of ecology and living beings including human. However, a few articles are present focusing on the noise pollution in any industrial city and its effects on living beings.4,31
A scientometric analysis covering 2012 to 2021 reported a total of 44,172 global publications on water pollution, with an average of approximately 4417 papers per year. The highest number of publications within this period was 8079 in 2021. 32 Between 2012 and 2021, there were 53,791 publications on air pollution, averaging about 5379 papers per year, with a peak of 9874 publications in 2021. 33 While specific annual figures for the last 5 years on noise pollution are not provided, the observed growth suggests a continued rise in research output during 2019 to 2023. Estimating conservatively, there may have been around 1000 to 2000 papers published annually in this period, totalling approximately 5000 to 10,000 papers. 34 Hence, noise pollution and associated adverse effects need to explore. Considering these research gaps, present study aims (a) to highlight the zone-wise evaluation and analysis of noise pollution indices and (b) to use assess the noise level at different time intervals using GIS based methods.
Material and methodology
Study area
The present study was conducted in one of the largest cities in Jamshedpur, Jharkhand during winter season (December to February, 2022-23). During winter, measuring urban noise levels can be more accurate because there are fewer leaves on trees. With less vegetation, sound is absorbed and scattered less, allowing for clearer readings. Gaudon et al.
35
have reported that plants mainly reduce high-frequency noise by absorbing it through their leaves. So, in winter, when trees are bare, there is less interference, making it easier to measure noise levels more directly. Hence, in the present study, sound levels were recorded in winter season. On the list of fastest growing city, Jamshedpur secured 84th rank on the time period of 2006–2020.
36
Beside the dense forest and hill range of Ukma, Dalma, Jadugoda-Musabani, Jamshedpur is a planned industrial city that houses near about 1200 small and medium-scale industries.
29
The whole city is covered by deciduous forests, river and streams and hence houses unique flora and fauna. The climate of the city is tropical wet and dry. A total of 11 sites were selected in the whole city from commercial zone, industrial zone, residential zone and silence zone (Figure 1). • Commercial zone: Commercial area in city are areas primarily composed of commercial buildings, central business hub, study hub, shopping centre, bus stands for loading and unloading materials. The sites selected to monitor the noise level in the commercial zones are Sakchi, Jugsalai and Mango. • Industrial zone: Industrial area in the city composed of small and large scale industries. For the noise level monitoring, Adityapur and Tata Steel was chosen. • Residential zone: Residential zone in the city composed of space for living only. For residential zone, assessment was done on Kadma, Sidgora and Golmuri. • Silence zone: Silence zone in the city comprises of hospital and school. For accessing the noise pollution level, sites were selected near M.G.M. hospital and Beldih (Church School). Map showing the sampling sites in Jamshedpur city, Jharkhand, India.

Noise levels in different zones were measure using Noise level meter (data logger, equipment name- LEUPRON). The noise level was measured adopting the method of Debnath and Singh 4 and Hunashal and Patil. 17 The meter was held at the height of approximately 1.5 m and at a distance of 4 m from any reflecting surface. Noise measurement was done consistently for 21 days with 7 hours of monitoring for four sessions. The schedule for morning session was 06:00 to 07:00 a.m. and 09:00 to 10:00 a.m.; for mid-day session was 12:00 p.m. to 01:00 p.m., 03:00 p.m. to 04:00 p.m.; for evening session was 06:00 p.m. to 07:00 p.m. and for night session was 09:00 p.m. to 10:00 p.m.; 12:00 a.m. to 01:00 a.m. For each hour, the noise levels were measured after every 2 minutes. Hence for every hour, 30 readings were effectively recorded. The data set was recorded for each site and repeated twice for each site after 45 day gap.
The selected time intervals were designed to span the majority of the day, capturing the distinct acoustic characteristics of each period from the quiet of early mornings and the busyness of rush hours to the calmness of evening and the stillness of nighttime. 37 Additionally, the one-hour interval sampling schedule (e.g., 06:00–07:00 a.m., 09:00–10:00 a.m., etc.) was designed to capture the diurnal variations that naturally occur in environmental and biological parameters throughout the day. Many factors such as temperature, light intensity, metabolic activity, and anthropogenic influences cause hourly fluctuations in noise levels. By collecting data at evenly spaced one-hour intervals, the study ensures a more accurate and comprehensive representation of these temporal patterns. This approach enhances data resolution, supports stronger statistical analysis, and allows for better detection of peak events or critical periods. Moreover, high-frequency sampling improves the reliability of trend assessments and contributes to more informed environmental or resource management decisions. 38
Data analysis
Primary data collected from each site were analysed in Microsoft Excel and SPSS software. Spatial analysis was performed using ARC-GIS Desktop 3.28.3 for better delineation of noise pollution status in Jamshedpur city and its diurnal variations. A standard GPS meter (Model: eTrex H, Garmin) was used to record the latitude and longitude of the sampling sites. The recorded information including latitude, longitude and mean (n = 5) of noise level at different time intervals were typed in Microsoft excel sheet and it was added in the ARC-GIS layer as delimited text layer. Base map, Open Street map was extracted from quick map services through web tab. Sampling sites were located using the provided latitude and longitude. Point shapefiles were created having coordinate reference system (CRS) EPSG:32643 - WGS 84 / UTM zone 43N with unit in meters. Layers of different bands were drawn using IDW (Inverse distance weighted) interpolation having the same CRS and units. Band rendering was performed using linear interpolation, and equal interval with five classes. Dimensions were X: 1027 Y: 608 and Pixel Sizes were 10, -10. The different colours in each band of the image showed different noise levels. Minimum sound was 40 dB while the maximum sound was 100 dB in the sound scale shown in the image. Seven maps of different time intervals i.e. 6–7 a.m., 9-10 a.m., 12-1 p.m., 3–4 p.m., 6–7 p.m., 9-10 p.m. and 12–1 a.m. for workdays are produced.
Noise pollution indices
In order to assess noise pollution status in the city, different noise pollution indices were calculated using Gaussian percentile methods. Noise percentile values (L10, L50 and L90) were derived from noise level data and used to evaluate noise pollution indices. Additionally, hourly noise data were examined to determine the equivalent sound level (Leq) for each hour across all days in a month. The obtained data was used to calculate L10, L50 and L90 percentile. By using those percentiles, noise pollution indices were calculated by using following formula (equations (1)–(4))17,39,40:


Results and discussions
Topography of Jamshedpur city is very unique because it is enriched with minerals and hence is connected with major cities. This city is approximately 136 km away from the capital city of Jharkhand, Ranchi. Also, it is nearly 146 km away from Dhanbad, a coal enriched city. In addition, Jamshedpur is also connected with West Bengal and Odisha through national highways. Most of the people from the nearby rural area migrate towards the Jamshedpur city to find better place for their survival and looking for all amenities. 41 In addition to migration of people, movement of goods and information are also important for the establishment of a stable human society. To fulfil those needs, transportation plays a key role in the city. With a population of approximately 1.3 million, Jamshedpur is most populated and urbanized city of India. With those reasons, the city planning is focussed on improving transportation facilities. In recent decades, the number of registered vehicles in the city had increased significantly; among them approximately 3/4th parts are two wheelers. 42 According to District Transport Office Report- 2018–19, there is a 211 % of increment in the number of registered two wheelers in Jamshedpur for the year of 2018-19 in comparison to 2003-04. Also, According to the report of City Mayors, 43 Jamshedpur is in the 84th list of world’s fastest growing city. The report of vehicle registration of last 12 years at Jamshedpur showed that nearly more than 9% of private vehicle is registered than public vehicle. Such a mushrooming number of vehicles in Jamshedpur city had caused various issues such as traffic congestions, road accidents, 41 air, water, soil and sediment pollution.24,28
Noise pollution status of 11 sampling sites was represented in Figures 2–8. It was observed that noise level for commercial zone like Sakchi, Jugsalai and Mango were highest at all the studied time and ranged between 73 and 99.7 dB(A). Sakchi, Jugsalai and Mango are the busiest zone in the entire city because these sites are major centre for various economic activities, malls, markets, coaching centre, industrial set up, hospitals, hotels, banks and offices.
42
This results in higher traffic density in those sites. Also, all the sites are located near the roundabout (Golchakkar) and traffic signals due to which heavy and light vehicles create high noise pollution in these regions because of road congestion.
44
In Jamshedpur, more than 62 % of the transport facility comprised of inter-city buses, large buses and Mini buses
42
which tend to create frequent jams and cause in intense blowing of horns near Sakchi, Jugsalai and Mango. Using of transporting vehicles for loading and unloading, manufactured and raw material also produce noise.
39
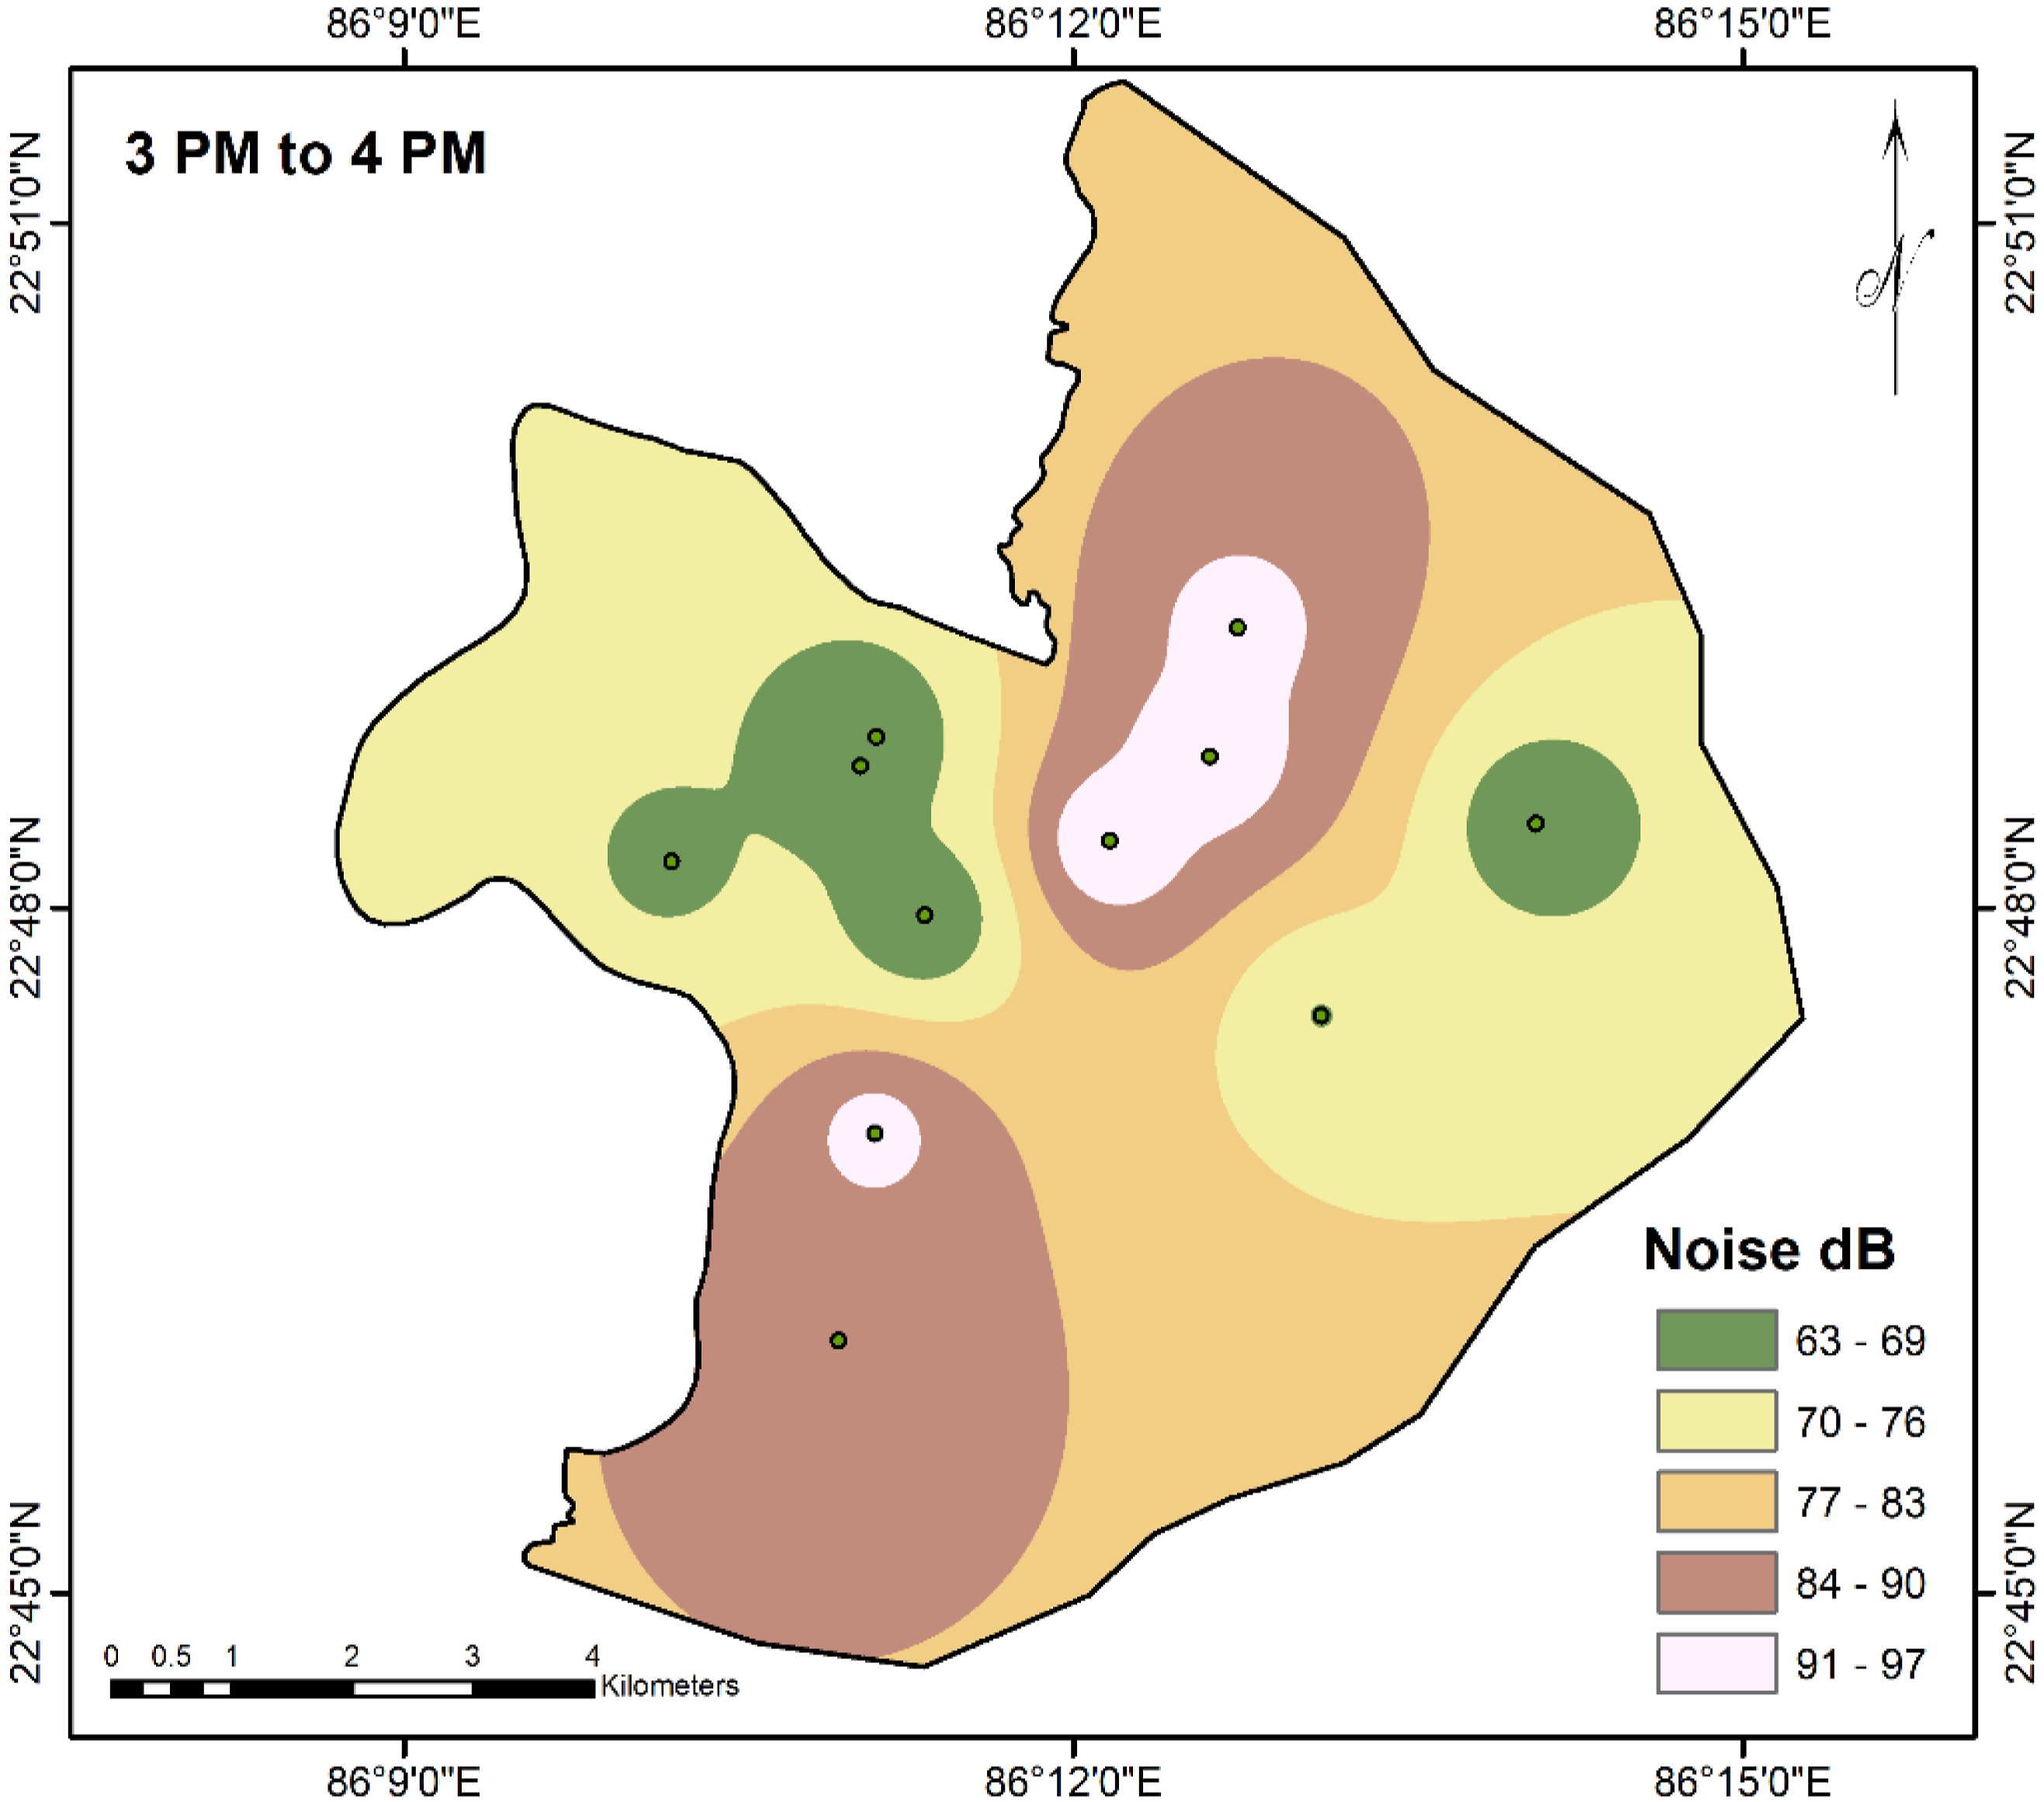
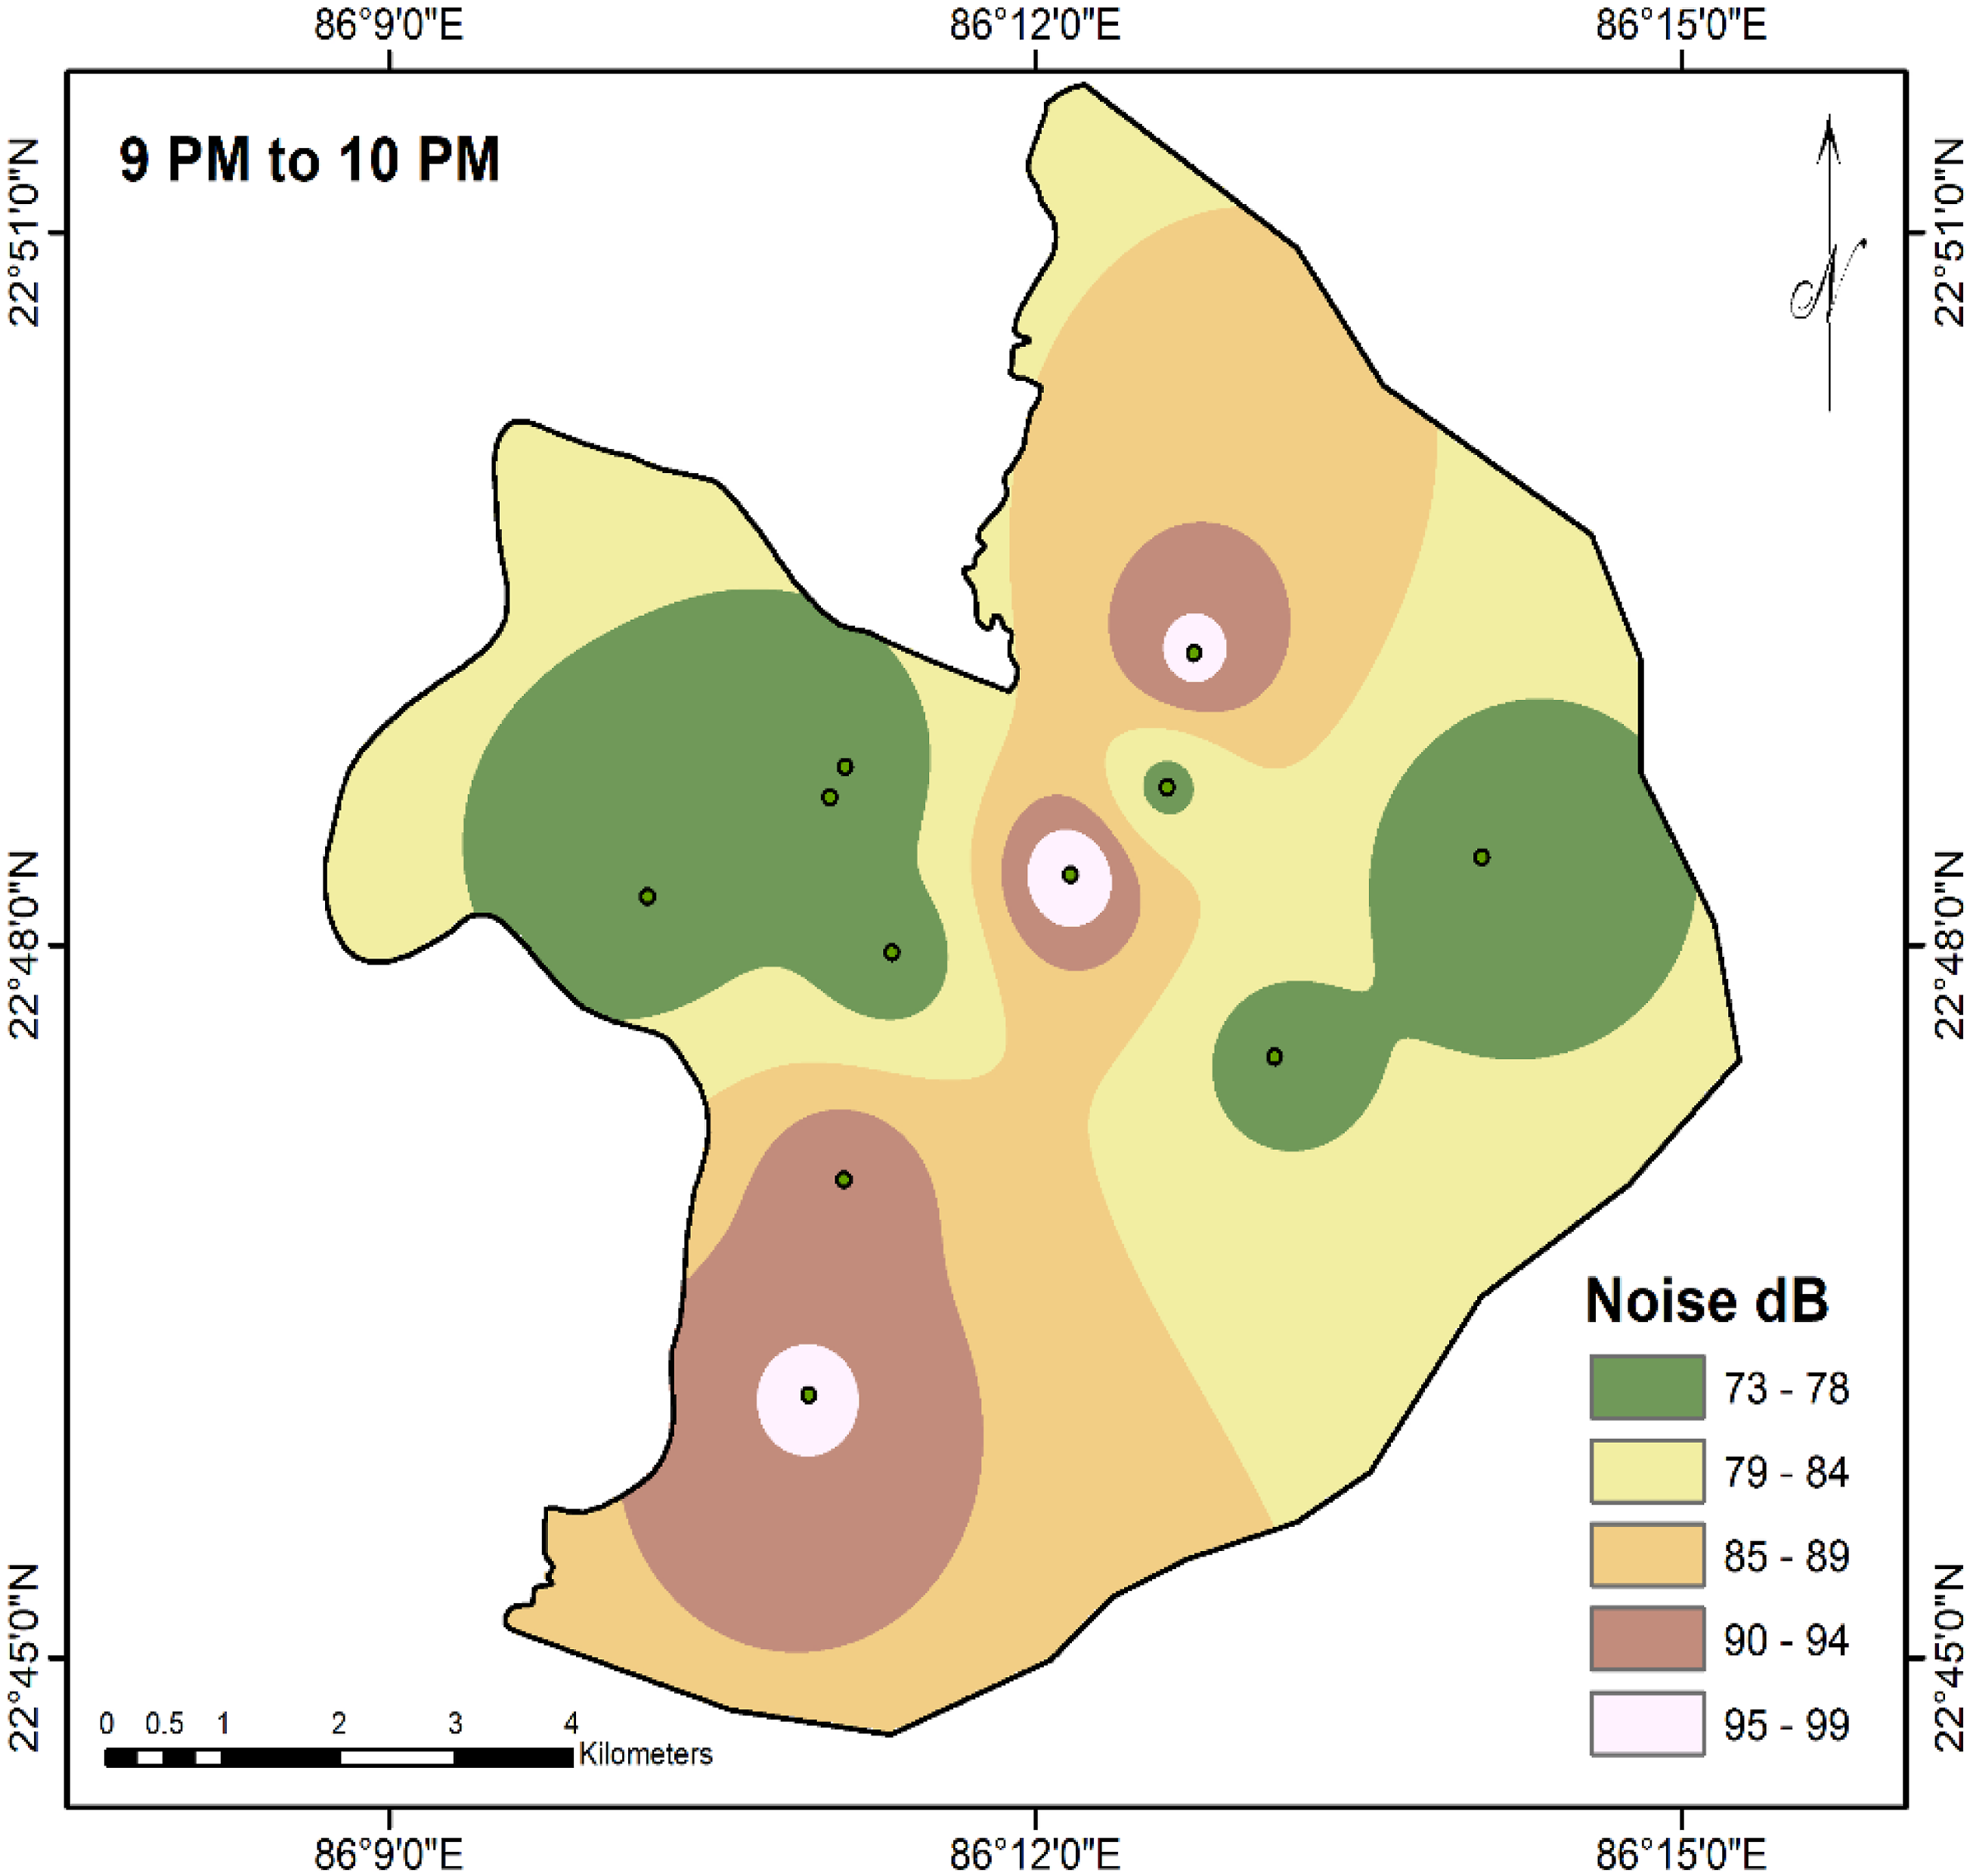
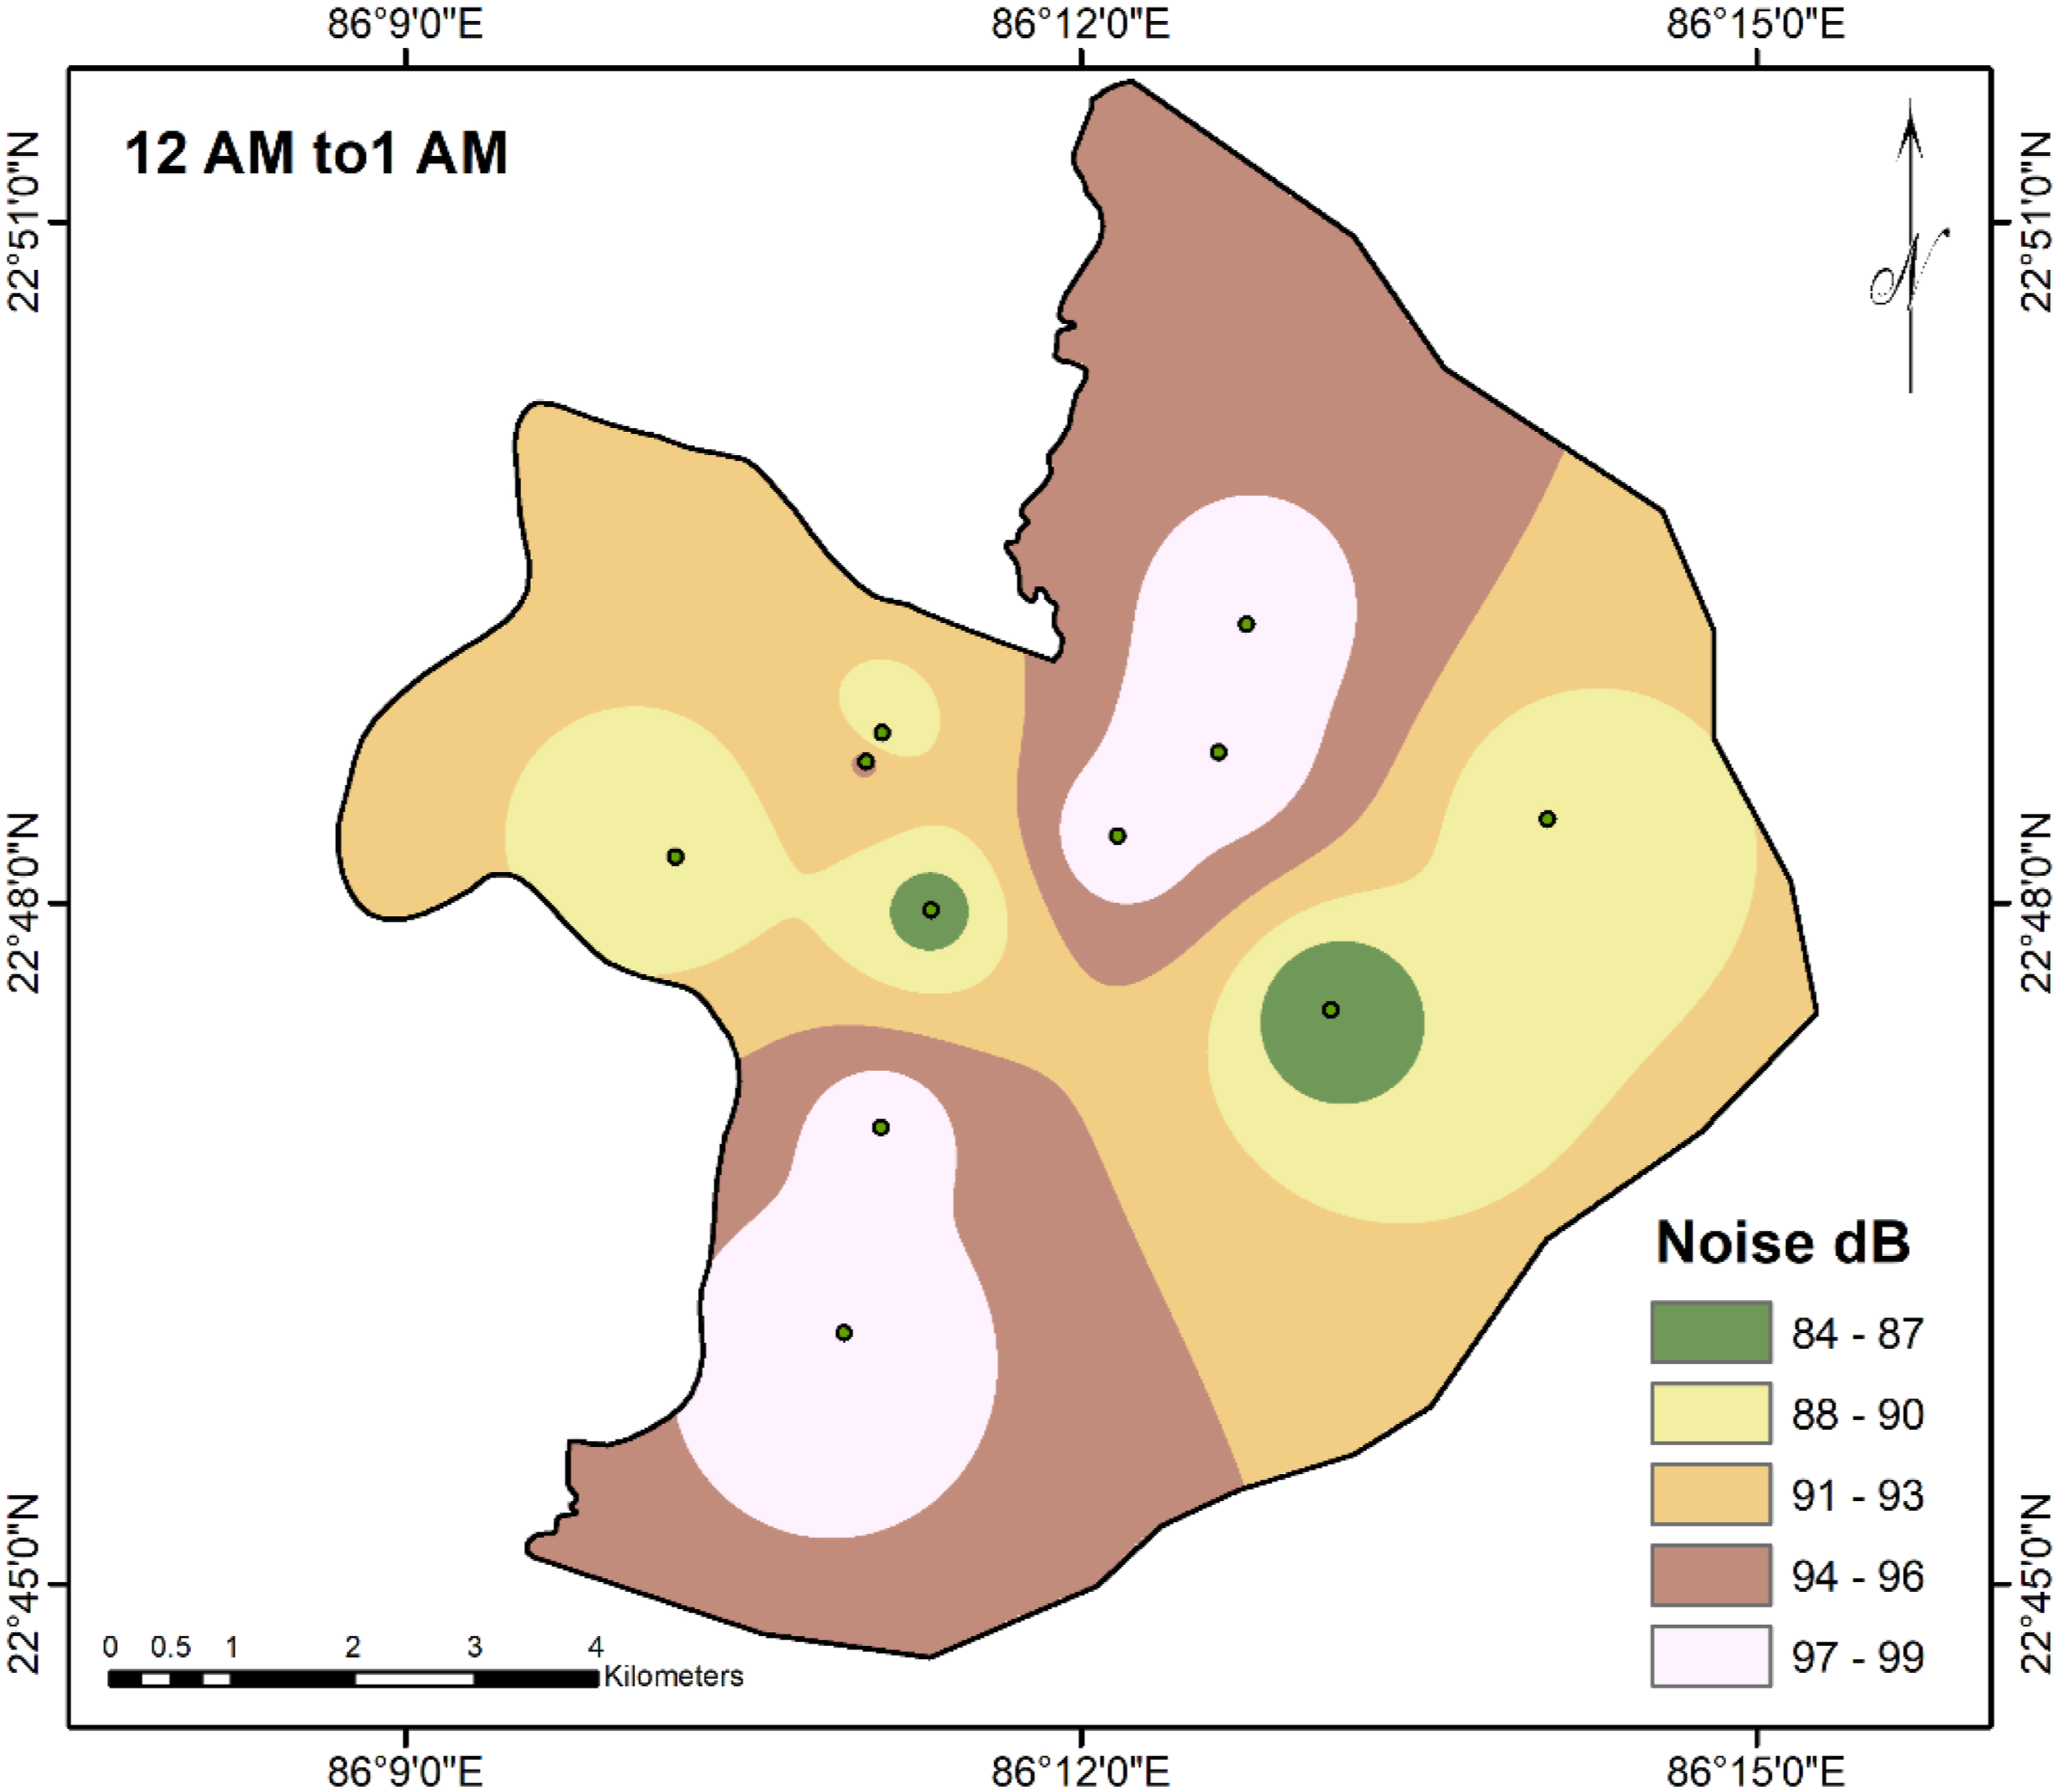
Noise Map of study area during morning hours (6–7 a.m.). Noise Map of study area during morning hours (9–10 a.m.). Noise Map of study area during afternoon hours (12–1 p.m.). Noise Map of study area during afternoon hours (3–4 p.m.). Noise Map of study area during evening hours (6–7 p.m.). Noise Map of study area during night (9–10 p.m.). Noise Map of study area during night (12–1 a.m.).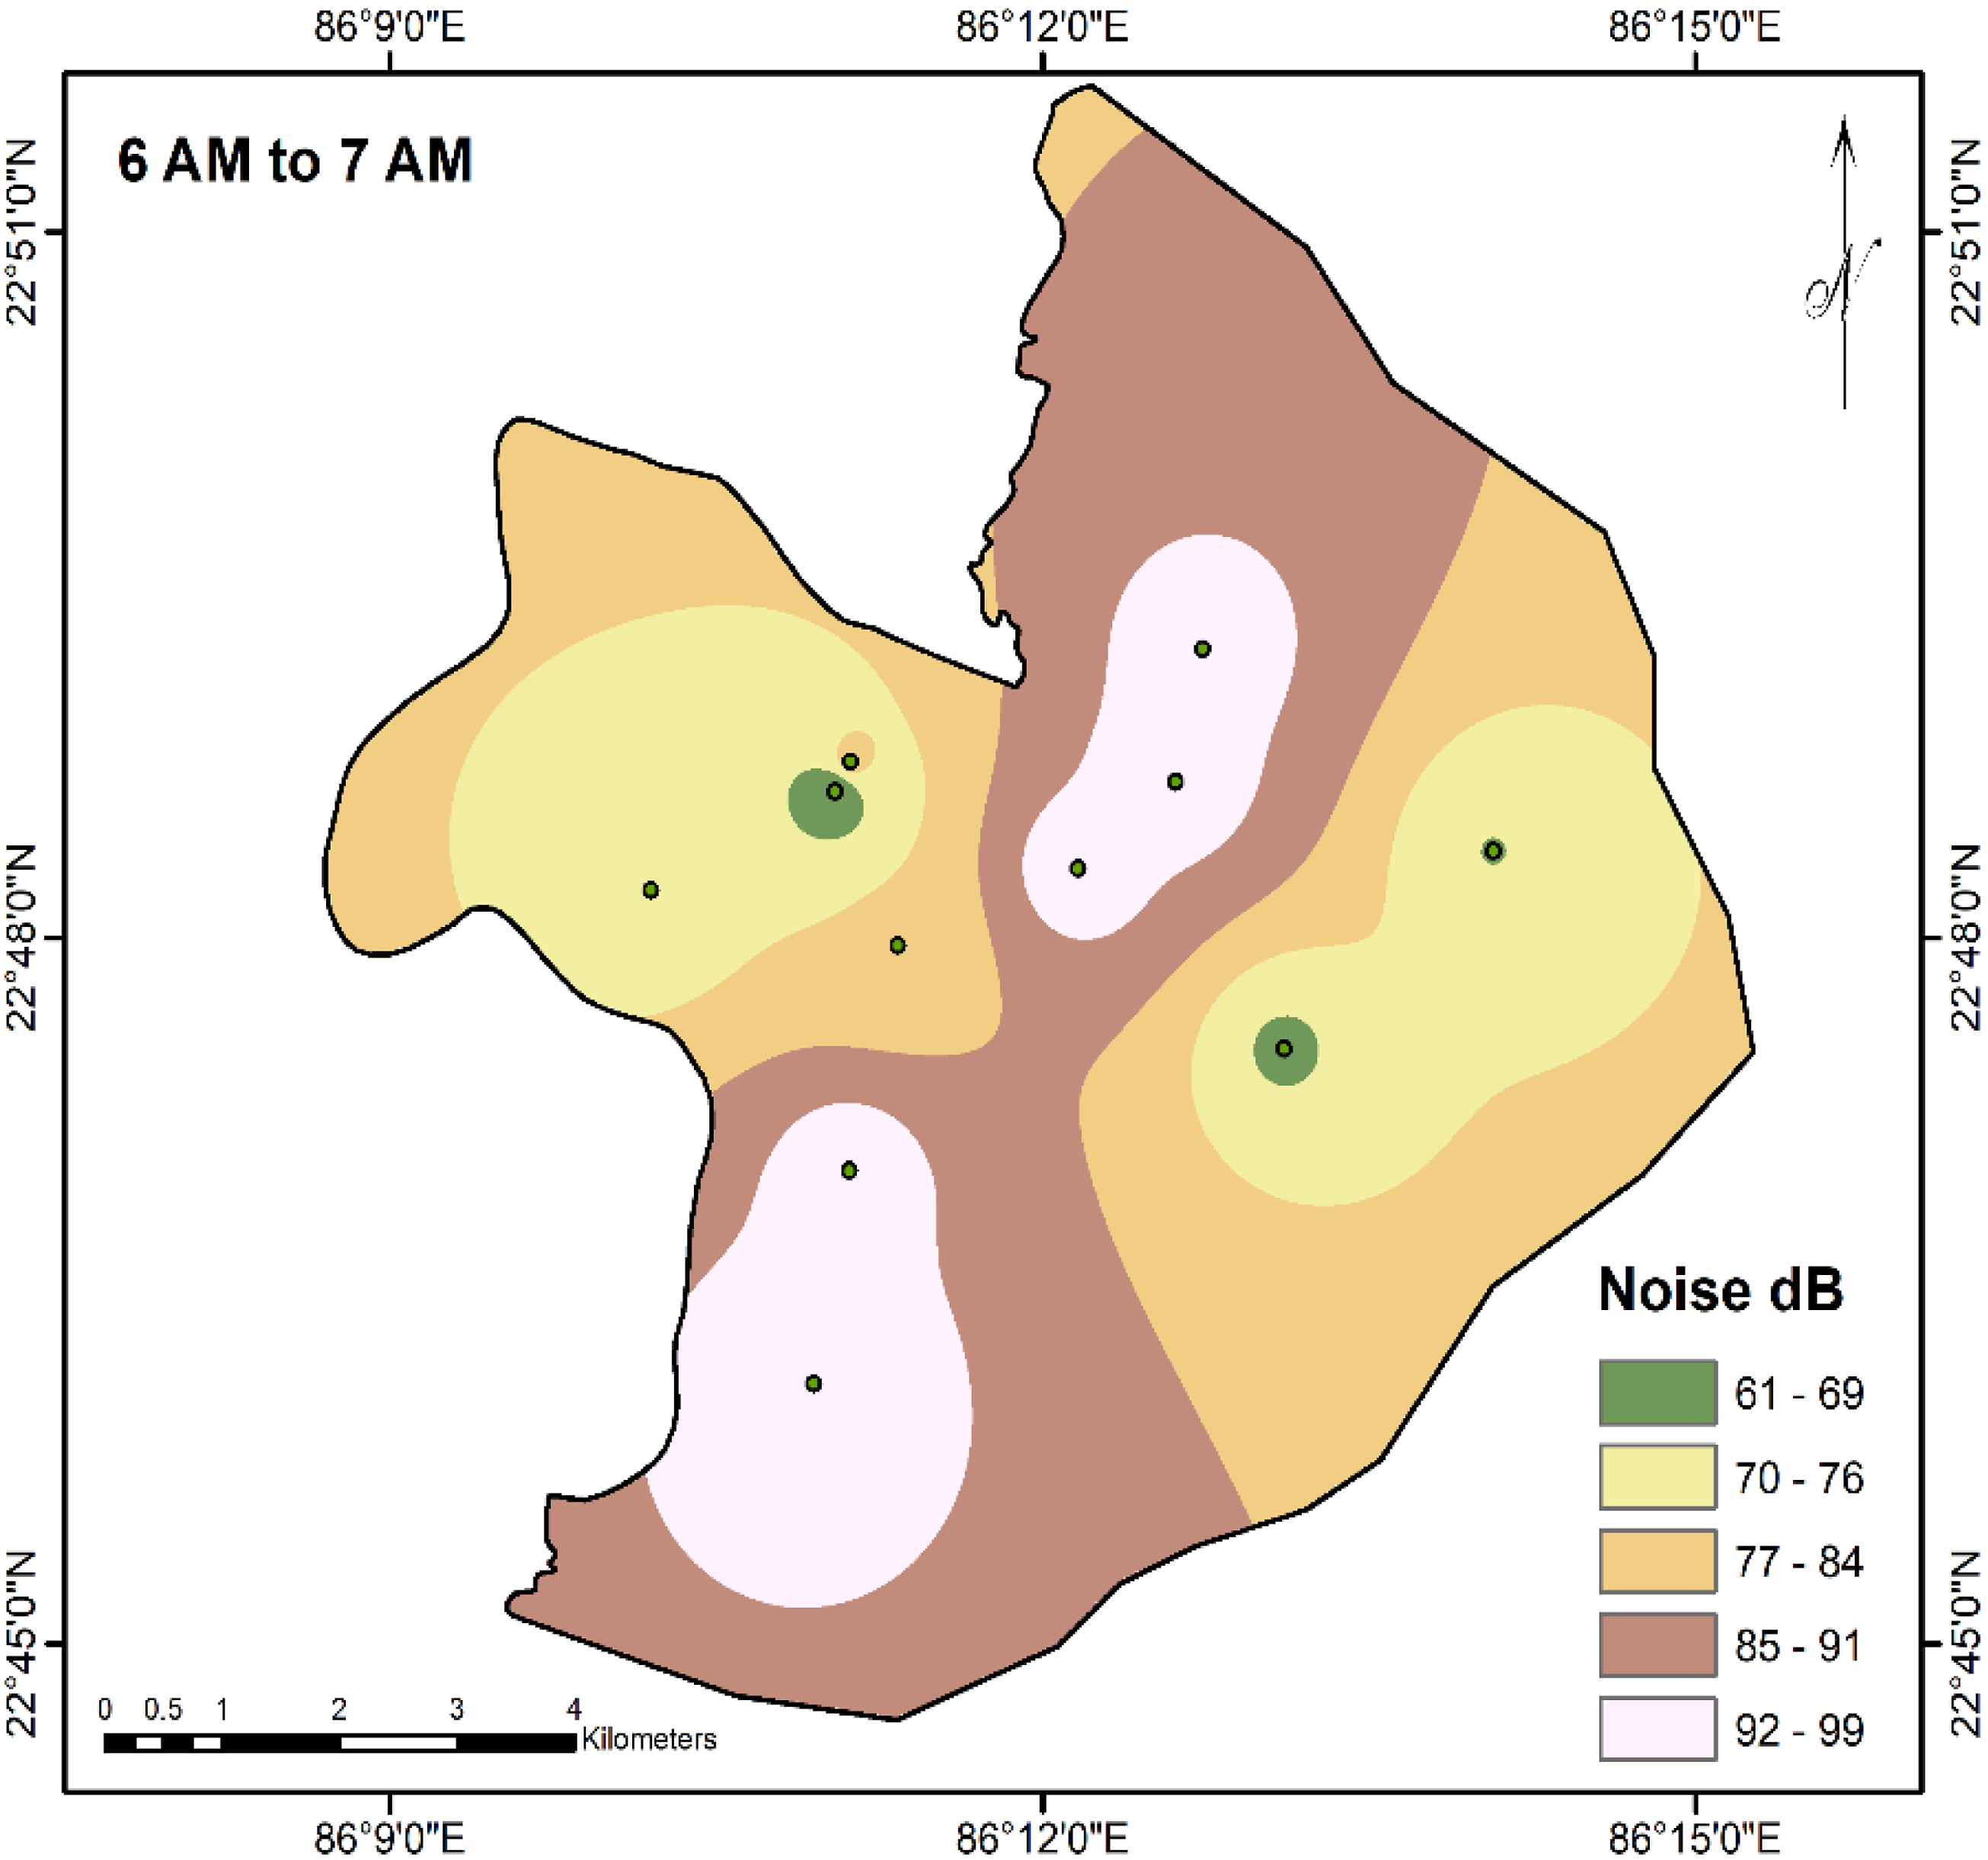


While comparing our data with USEPA 45 standards, it was observed that the noise level was extremely dangerous for living beings. Although Chauhan and Pande 46 have also reported noise level of 59-118.2 dB(A) at commercial zones of Dehradun, Uttarakhand during day and night. Lowest noise level was observed at late night (12-1 a.m.) for all the sampling sites (Figures 2–8). Munir et al. 39 have also reported a low noise level at night due to fewer crowds and less movement of vehicles.
Noise level for the time period of 6–7 AM
The highest sound level observed in the study area for the time interval 6-7 a.m. was 69.03 dB(A) (Kadma and Beldih), whereas the lowest sound level observed were 62.35 dB(A) (Bistupur) (Figure 2). While comparing the noise level with those of USEPA, 47 it was observed that noise level of Bistupur is moderately risky for living beings, the noise level of Kadma, Beldih, Adityapur, Sidgora and Golmuri were highly risky, noise level of M.G.M. hospital was dangerous, and noise level of Sakchi, Jugsalai, Mango and Tata Steel was highly dangerous. High noise level at Sakchi, Jugsalai, Mango, Kadma, Beldih, Adityapur, Sidgora and Golmuri may be because these regions have mushrooming numbers of schools and coaching centres which works basically in morning hours result in heavy rush of two wheelers, three wheelers and four wheeler vehicles. Also, Tata Steel has three working shifts-6:00 a.m.-2:00 p.m., 2:00 p.m. to 10:00 p.m. and 10:00 p.m. to 6:00 a.m.; hence 6-7 a.m. is the peak hour because of the movement of employees going to work and returning from work. In addition, there are several processes involving handling of raw materials, running of conveyor belts, movement of fans in water cooling system, formation of coke, iron production, handling of molten iron, working with heavy automobile, steel production, slab, billet, sheets, wires production, etc. activities from various departments like coke plant, Blast furnaces, HSM, CRM, WRM, LD#1 & #2, pallet plant, sinter plant etc. may contribute to noise pollution in Tata steel.
Noise level for the time period of 9–10 AM
The minimum sound level observed at 9-10 a.m. was 61.00 dB(A) in Beldih, whereas maximum noise level observed was 98.63 dB(A) in Jugsalai (Figure 3). When comparing with international standard, 47 it was observed that the noise level of Beldih was moderately risky, Kadma, Sidgora and Golmuri were highly risky, Bistupur and Adityapur were highly dangerous and Sakchi, Jugsalai, mango, M.G.M. hospital, and Tata steel were extremely dangerous.
Noise level for the time period of 12–1 PM
At 12-1 p.m., noise level was maximum in M.G.M. hospital and Jugsalai (99.27 dB(A)) and minimum in Golmuri (84.26 dB(A)) (Figure 4). Standard noise level 47 suggested that the noise level was extremely dangerous in all the sites of Jamshedpur city. Noise pollution in the aforementioned sites is higher due to the reason that the duration of 12-1 p.m. is the busiest one. During this time, school hour ends, markets become functional, commercial centre opens, Day-college starts and industrial activities resume and all contribute to noise pollution. Also, according to Munir et al., 39 the noise level is generally higher in afternoon because at this time, air near the ground becomes warmer and velocity of sound increases with increase in temperature.
Noise level for the time period of 3–4 PM
At 3-4 p.m., minimum noise level observed was 62.56 dB(A) in Bistupur and maximum noise level was observed was 96.67 dB(A) in Sakchi (Figure 5). While comparing the noise level with USEPA 47 standard, it was observed that noise level of Bistupur, Sidgora and Adityapur was moderate risky, Golmuri, Beldih and Kadma was highly risky, and Sakchi, Jugsalai, Mango, M.G.M. hospital, and Tata Steel was extremely dangerous.
Noise level for the time period of 6–7 PM
At 6-7 p.m., highest noise level was observed in M.G.M. hospital (97.40 dB(A)) and lowest noise level was observed in Sidgora (72.26 dB(A)) (Figure 6). While comparing with international standard, 47 it was observed that noise level of Sidgora and Golmuri was dangerous, Kadma and Beldih was highly dangerous, and Sakchi, Jugsalai, Mango, Adityapur, Bistupur and Tata Steel was extremely dangerous.
Noise level for the time period of 9–10 PM
Minimum noise level observed was 73.26 dB(A) (Golmuri and Sidgora) and maximum noise level was 97.27 dB(A) (Sakchi) at 9-10 p.m. (Figure 7). While comparing with USEPA standard, 47 it was observed that noise level of Kadma, Beldih, Adityapur, Sidgora and Bistupur were dangerous, M.G.M. hospital and Golmuri was highly dangerous, and Sakchi, Jugsalai and Mango was extremely dangerous.
Noise level for the time period of 12–1 AM
Time duration 12-1 a.m. was the most peaceful in Jamshedpur. Here the minimum noise level observed was 42.36 dB(A) in Bistupur and maximum noise level was 76.43 dB(A) in Sakchi and Mango (Figure 8). While comparing with USEPA, 47 it was observed that the noise level was dangerous in Jugsalai and Tata Steel and highly dangerous in Sakchi and Mango. However, noise level of rest of the sites exhibited no risk at 12-1 AM.
Noise pollution indices at different zones
According to CPCB, 48 the standard noise levels for CZ, IZ, RZ and SZ were as follows: Commercial zone (day: 65 dB, night: 55 dB) - Always busy road, Industrial zone (day: 75 dB(A), night: 65 dB(A)) - Small and large factories are there, Residential zone (day : 55 dB(A), night: 45 dB(A)) – Surrounding area of a housing colony, and Sensitive zone (day :50 dB(A), night: 40 dB(A)) - are also called silence zone near hospital, school, colleges and other institutional area, court and zoo.
Data in Figure 9 shows the average noise pollution indices viz. L10, L50, L90, Leq, and Lnp, in commercial, industrial, residential and silence zones of Jamshedpur city at various time intervals. Noise pollution indices of commercial zone (CZ), industrial zone (IZ), residential zone (RZ) and silence zone (SZ). (A) L10 (B) L50 (C) L90 (D) Leq and (E) Lnp.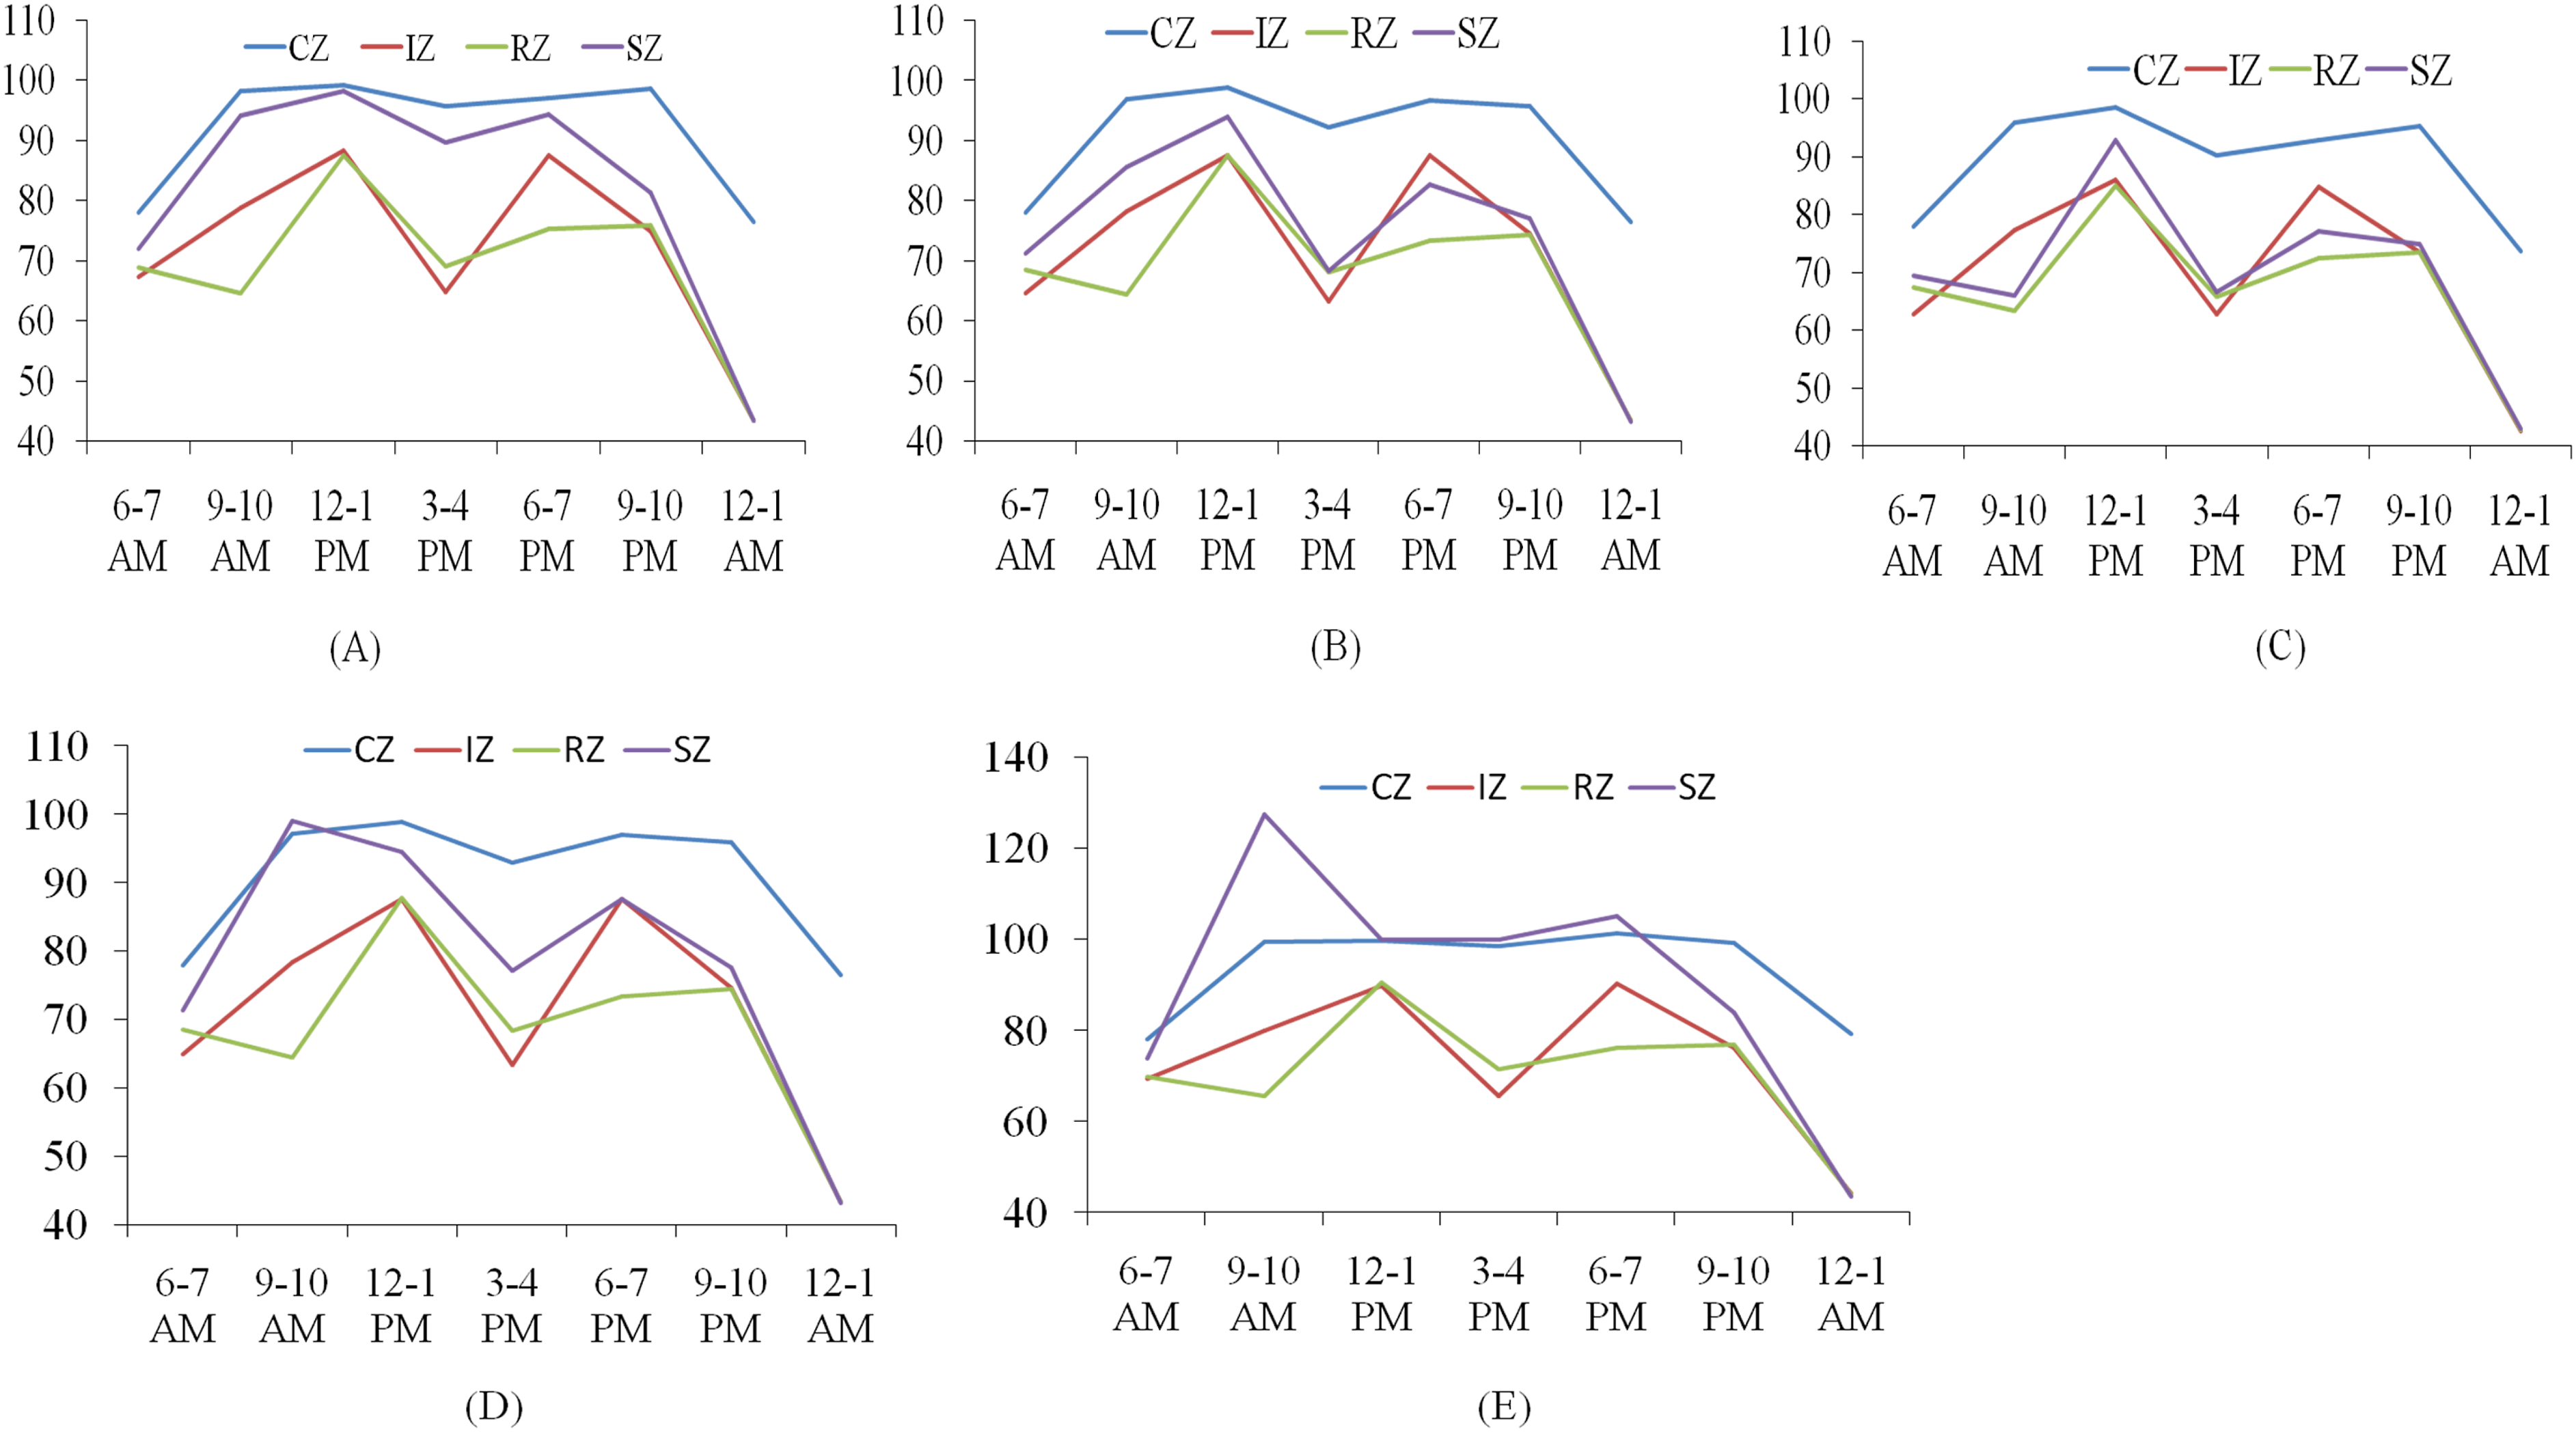
In commercial, industrial, residential, and silent zones, the highest values of L10 (99.19, 88.35, 87.67, and 98.21 dB(A), respectively) were observed between the time period 12–1 p.m., whereas the lowest values (76.43, 43.40, 43.40, and 43.38 dB(A)) were recorded between 12 and 1 a.m. The L10 metric, which represents the noise level exceeded 10% of the time, often reflects peak disturbances, especially from traffic or human activities (Pathak et al., 2008). The peak during the midday hour is likely attributed to high vehicular and commercial activities, while the drop during late-night hours reflects minimal human activity and reduced traffic, aligning with diurnal human behaviour patterns. 44
Similarly, L50 values, which represent median noise levels, followed the same trend. Maximum values for commercial (98.90 dB(A)), industrial (87.50 dB(A)), residential (87.66 dB(A)), and silent (94.00 dB(A)) zones were observed during 12–1 p.m., with minimum levels recorded at night (12–1 a.m.). These values indicate that even average noise levels in all zones during the day far exceed recommended standards, pointing toward consistent exposure to elevated noise, which has been associated with long-term auditory and non-auditory health effects. 36
L90, indicative of background noise levels, also peaked during 12–1 p.m. (commercial zone = 98.53 dB(A), industrial zone = 86.05 dB(A), residential zone = 84.94 dB(A), and silent zone = 92.90 dB(A)) and fell during the quietest period (12–1 a.m.). This suggests that noise levels remain significantly high during the day. Elevated L90 values during peak hours are particularly concerning as they reflect persistent ambient noise, not just short-term fluctuations. 49
Moreover, Leq values—which represent the equivalent continuous sound level over a specific period—were found to be lowest at night (12–1 a.m.) in all zones. The highest Leq levels were recorded during the day (on 12-1 p.m.) in CZ (98.91 dB(A)) and RZ (87.78 dB(A)), while peak Leq in IZ (87.62 dB(A)) and SZ (98.97 dB(A)) occurred at 6–7 p.m. and 9–10 a.m., respectively. These variations correspond with localized activity schedules—commercial and residential zones experience surges during midday, while industrial and silent zones peak slightly earlier or later due to shift timings or morning human movements, as observed in other urban noise studies.14,50
According to CPCB, 51 permissible noise levels for industrial zones are 75 dB(A) during the day and 70 dB(A) at night. The current study recorded a higher Leq level in IZ during both day and night (e.g., 9–10 a.m., 12–1 p.m., 6–7 p.m., and 9–10 p.m.), which may negatively impact occupational health and productivity. 52 For CZ, with a permissible limit of 65 dB(A) (day) and 55 dB(A) (night), none of the observed values were within limits, indicating chronic noise pollution. Similar higher Leq values in CZ have been reported by Pathak et al. 52 in other Indian cities.
In RZ, where CPCB limits are 55 dB(A) (day) and 45 dB(A) (night), Leq values exceeded permissible levels throughout the day except during 12–1 a.m., suggesting a lack of acoustic zoning enforcement. Prolonged exposure to such elevated noise levels in residential areas is linked with increased risks of hypertension, sleep disturbances, and reduced cognitive performance in children.36,53 In SZ, where the CPCB recommends 50 dB(A) (day) and 40 dB(A) (night), no measured values were within the standard limits. These findings align with Mishra et al., 54 who also observed significant violations of noise standards in silent zones of Kanpur, Uttar Pradesh.
Lnp values, which quantify fluctuating noise levels and are critical for assessing psycho-physiological stress, were found to be lowest at 12–1 a.m. in IZ (43.27 dB(A)), RZ (43.27 dB(A)), and SZ (43.17 dB(A)), while CZ exhibited its minimum (77.96 dB(A)) during 6–7 a.m. The highest Lnp values were observed in CZ (101.24 dB(A)) and IZ (90.31 dB(A)) at 6–7 p.m., and in RZ (90.51 dB(A)) and SZ (127.23 dB(A)) at 12–1 p.m. and 9–10 a.m., respectively. Elevated Lnp readings indicate significant fluctuations and are linked to higher stress responses in both humans and animals. 17
The Noise Climate (NC) values, representing the variability of noise, were highest in CZ (5.60) at 3–4 p.m., indicating sharp fluctuations in noise due to erratic urban activities. The minimum NC (0.03) was noted in CZ at 6–7 a.m., consistent with early morning calm. In other zones, minimum NC values were seen at 12–1 a.m., while the highest values appeared at different times: IZ (2.69 at 6–7 p.m.), RZ (3.20 at 3–4 p.m.), and SZ (28.27 at 9–10 a.m.). Compared with the American National Standard limit of 1, the NC values exceeded in most zones, suggesting an unstable acoustic environment, which can contribute to annoyance and hinder concentration.17,55
Data on noise pollution indices with reference to Noise Climate (NC) and Traffic Noise Index (TNI) for commercial zone (CZ), industrial zone (IZ), residential zone (RZ) and silence zone (SZ) of Jamshedpur city at different time interval (n = 5).

Overall, the data highlight widespread non-compliance with noise standards across all zones, reflecting both inadequate urban noise management and increased anthropogenic activities. The findings align with broader research on Indian cities that consistently report excessive noise levels in both industrial and residential settings,14,52,54 underlining the urgent need for stricter policy enforcement and sustainable urban planning strategies.
It is observed in Figure 9 that values of noise pollution indices are higher in SZ. This is an alarming situation. Even though silent zones—like schools, hospitals, and libraries—are supposed to be peaceful and quiet, it is not unusual to find higher noise levels there, reflected in values like L10, L50, L90, Leq, and Lnp. This often happens because of the lack of implementation of laws and standards for noise pollution by the local authorities (Singh and Dawar 2004). Additionally, vehicles honking, street vendors nearby, or even construction work close to these zones may contribute to higher noise level in SZ. SZs in the present city are located near busy roads or crowded commercial areas, which means there is a steady stream of background noise that pushes up the lower-level readings like L50 and L90. 52 Sometimes it is just a matter of timing—if the noise is measured during peak hours like school start times or hospital visiting hours, the data will naturally reflect more activity. So even though these zones are meant to be quiet, real-life conditions often make them noisier than expected. 14
Here it should be mentioned that the present work was performed in winter season. Hence, the noise pollution status is underestimated in the study. It is well known fact that noise pollution level is generally higher in summer season. In addition, temperature, wind and humidity affect the noise level. All these factors influencing the noise pollution level needs to be addressed in future work for getting the better visualization of noise pollution in industrial city, Jamshedpur.
Correlations between noise indices at different time intervals. Leq – Equivalent continuous noise level, Lnp – noise pollution level, TNI – Traffic noise index, NC – Noise climate.
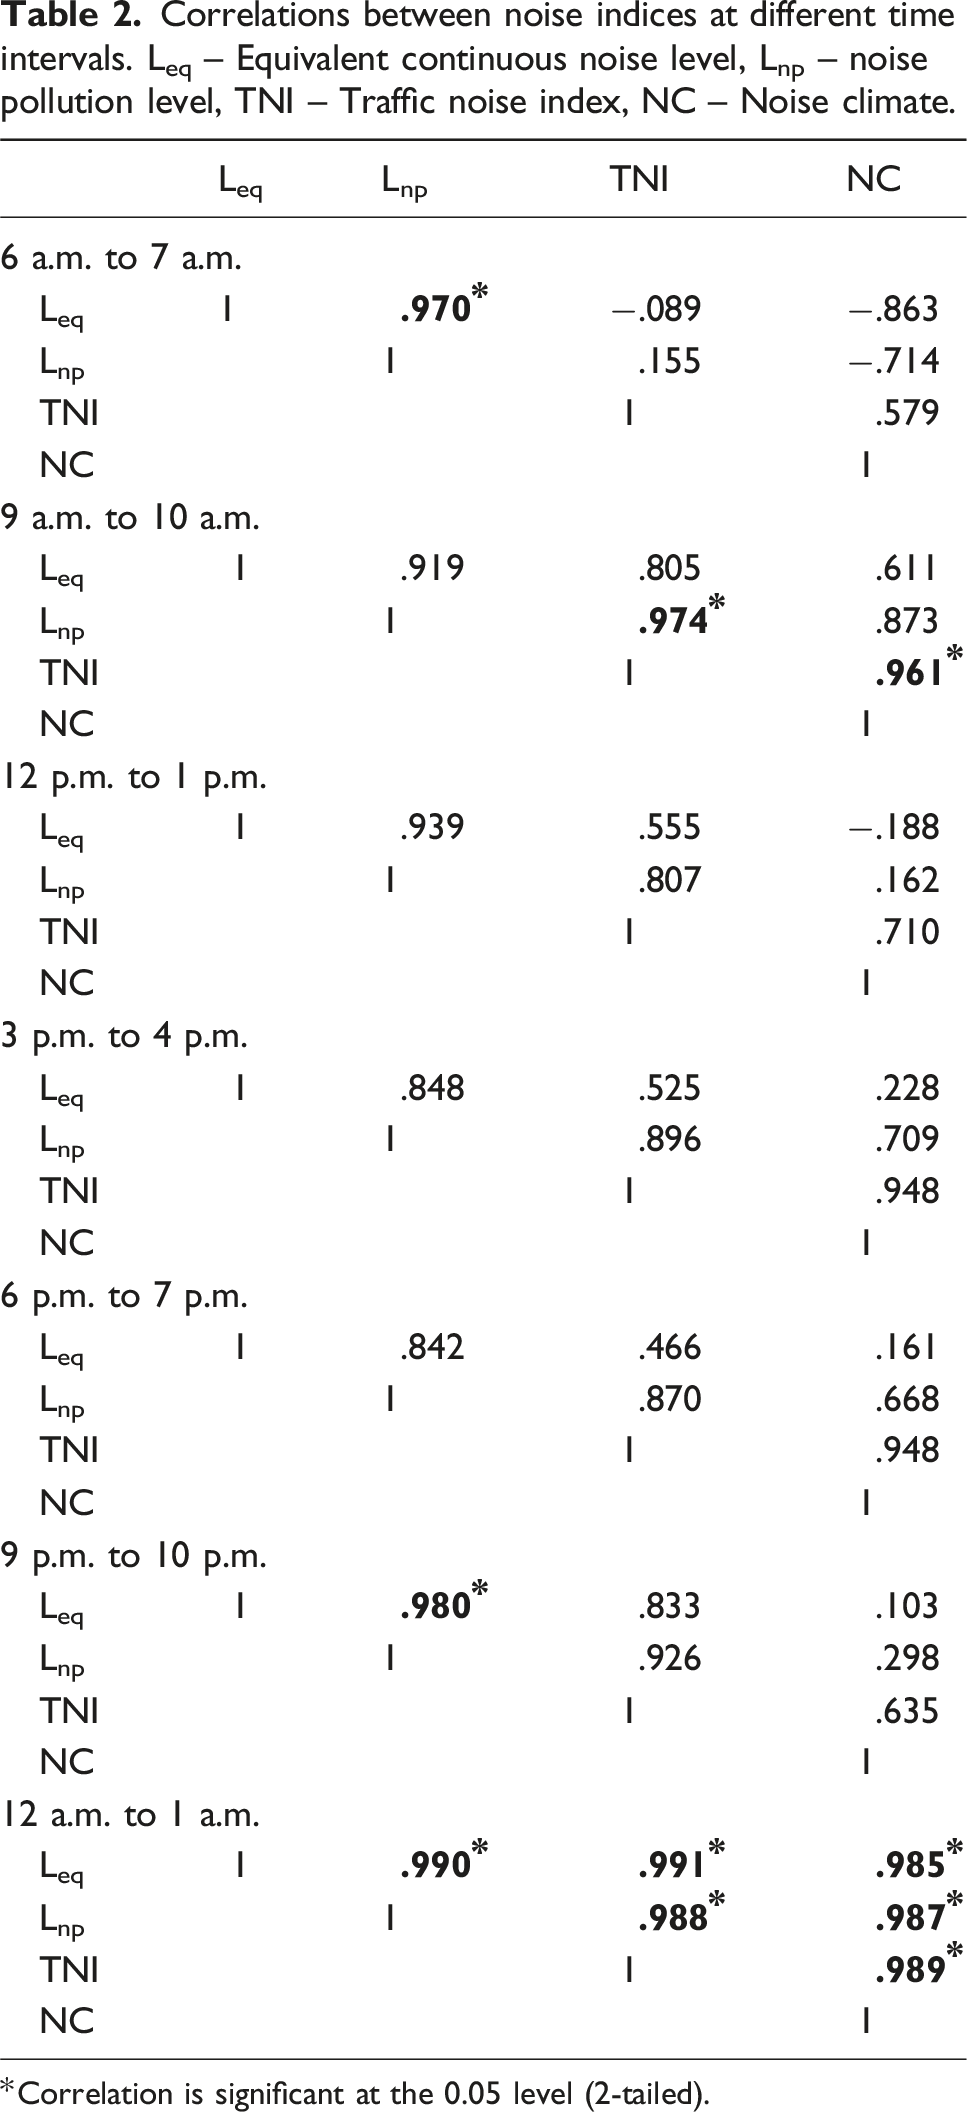
*Correlation is significant at the 0.05 level (2-tailed).
Between 9 a.m. and 10 a.m., the correlations among all indices become stronger, with significant relationships particularly between LNP and the traffic noise index (TNI) (r = 0.974*), as well as between TNI and NC (r = 0.961*). This reflects a peak traffic period where both the annoyance caused by traffic noise and the variability in noise are heightened. 58
At night (9 p.m. to 10 p.m.), the Leq - Lnp correlation remains strong and significant (r = 0.980*), but correlations with NC is weaker, indicating that while the average noise remains consistent, fluctuations become less pronounced. 59 Finally, during the late night period (12 a.m. to 1 a.m.), all noise indices are nearly perfectly correlated and statistically significant. This high level of synchronization suggests a highly uniform and stable noise environment, likely due to minimal human activity and traffic. 60 Overall, the analysis shows that noise indices are more tightly correlated during peak traffic and late-night periods, while mid-day and early evening exhibit more variable and less predictable noise dynamics. 61
Conclusion
Spatial analysis of noise level using ARC-GIS showed that noise level for CZ like Sakchi, Jugsalai and Mango were highest at all the studied time and ranged between 73 and 99.7 dB(A). The reasons for high noise level in these regions are the huge traffic density because schools, colleges, markets, offices, commercial centres, coaching institutes and malls are located in these regions. Also, not only two wheels but public transport systems including mini buses, inter-city buses and large buses create massive jams in these regions resulting in intense blowing of horns. Visualization through ARC-GIS showed maximum noise during 12-1 p.m. because this time markets, commercial centres, colleges, offices industries, etc. Becomes functional. However, minimum noise level was observed during 12-1 a.m. at night may be attributed to fewer crowd and lesser traffic density. Generally, noise pollution indices for different zones were higher than the prescribed national and international standards. Even the SZ also violated the standard limits which need to be attentively addressed. All over the world people affected by high sound level due to road traffic noise. Due to noise pollution our mental health gets disturbed initially, which become much more serious factor for physical health. Near school and hospital like sensitive zone our local government could implement noise barrier (sound wall, acoustic barrier). Trees act as a noise muffler in city so we should promote plantation in the city. Heavy traffic should be diverted from sensitive area and roads width should be increased. Government should implement strong rule for noise pollution. People have to follow the rule of traffic, should abide the rule near silent zone strictly. Awareness about noise pollution is the main factor for implementing any rule in city. Government should start awareness program in educational institute like school, college etc. Automobile sector should create awareness about noise pollution on the road by horn blowing. Policy makers and Management should also actively enforce the law and rules to combat noise pollution in order to minimize its effect on living beings.
Footnotes
Author Contributions
Authors have equally contributed in preparing the study design and contributed in Material preparation, data collection and analysis. The first draft of the manuscript was written by Dr. Preeti Kumari and data collection, field works were performed by Ms. Shraboni Shree and resources were provided by Dr. Khalid Mahboob Khan. Both authors reviewed the manuscript.
Declaration of conflicting interests
The author(s) declared no potential conflicts of interest with respect to the research, authorship, and/or publication of this article.
Funding
The author(s) received no financial support for the research, authorship, and/or publication of this article.