



Abstract
In response to the challenges of identifying and reducing noise from multiple sources in construction machinery, this study focuses on a hydraulic source cart as the research subject and employs a sound-vibration fusion diagnostic method for noise identification. Firstly, by analyzing the noise distribution of hydraulic source car under different speed, the main source of noise is deduced. Then, by analyzing the vibration spectrum of each part and comparing with the noise test results, the frequency and location of the main noise are determined. The results show that this method can accurately identify the main noise source frequencies and locations under different gear positions. At 800 r/min, 1500 r/min, and 2600 r/min, the maximum sound pressure levels of the hydraulic source cart are 73.08 dB at the valve side, 75.89 dB at the reducer side, and 78.67 dB at the pump side, with the main source frequencies being 602 Hz, 450 Hz, and 390 Hz, respectively. The main source frequencies are 602 Hz, 450 Hz and 390 Hz, all of which are integer multiple frequencies of the gear pump meshing frequency at this gear position, so the gear pump is the main noise source, and the main noise reduction object of the cart is the gear pump and its valve body.
Introduction
Noise has a serious impact on people’s work and life. In the field of construction machinery, mechanical noise often causes great trouble to its drivers or operators. Therefore, in order to improve the working performance and driving comfort of construction machinery, the harm of noise should be avoided as far as possible to reduce the impact of noise on drivers or operators and the surrounding environment.1–3
With the continuous development of construction machinery, the working environment and work efficiency of drivers have been paid more and more attention. For the noise limit of construction vehicles, the noise limit outside the construction machinery in the United States under the ISO362 standard is about 86dBA, and the noise of the driver’s position is lower than 85dBA.4,5 The European Union has put forward more stringent requirements on the noise at the driver’s position, the EU Machinery Directive 2006/42/EC and the European standard EN474-1:2006 require the driver’s position noise to be less than 80 dB 6 ; The industry standard JB/T 13,712-2019 “Measurement Methods and Limits for Noise of Construction Machinery and Equipment” proposed by China Machinery Industry Federation also provides a more stringent noise standard, limiting the sound pressure level of most construction machinery at the operator’s position to below 85 dB.7–9 In order to promote the development of new technologies in strategic emerging industries, enhance the competitiveness of the international market, protect the environment and human physical and mental health,it is necessary to control the emission noise of construction machinery and equipment.
Noise is distributed in various parts of construction machinery. In order to control noise in a targeted manner, the noise distribution of the equipment and the main parts that generate noise should be determined first, and the noise reduction objects should be reasonably selected.10,11 Traditional noise source identification technologies include wrapping method, partial operation method, surface vibration method, sound intensity method, etc.12–14 Although these methods are simple in operation and intuitive, they all have strong limitations. For example, wrapping method is difficult to deal with machinery with complex structure,15,16 and distributed operation method affects the work of the whole machine. 17 The surface vibration method and sound intensity method are only applicable to steady-state conditions and relatively static sound sources.18–20 With the rapid development of signal processing technology, many new test methods and signal processing methods are constantly applied in the field of noise recognition. In terms of test methods, near-field sound pressure method has poor locating ability for low-frequency noise due to the low sound pressure gradient.21–23 The beamforming method requires the distance from the sound source to the array to meet the far field condition, otherwise the error is large, and it is difficult to distinguish multiple sound sources close to each other in space. 24 The acoustic holography method can reconstruct the sound field parameters, but it needs to arrange a high-density microphone array in the near field of the sound source, and the parameter accuracy of the reconstructed sound field is greatly affected by background noise and reflection.25–27 In the signal processing method, the spectrum analysis method can convert the sound source signal into the frequency domain form, accurately measure the noise amplitude under different frequencies, and provide detailed frequency domain distribution information of noise, but the performance is limited by the bandwidth range, the number of filters and other factors.28–30 The coherence function method includes self-coherence and cross-drying. The coherence function of two signals is analyzed to determine their correlation. However, it is also difficult to accurately distinguish the independent contribution of each noise source in a complex noise environment or in the case of multiple noise sources acting at the same time.31–33
Based on the above problems, this paper takes the hydraulic cart as the research object and proposes an acoustic-vibration fusion method to identify the dominant noise sources in terms of frequency and location. Compared with the traditional approach relying solely on noise analysis, this method achieves higher accuracy in source identification.
Hydraulic cart structure and frequency analysis
The structure of the hydraulic source cart is shown in Figure 1, which mainly includes track and battery; The cart mainly includes fuel tank, box bucket, valve group and transmission system; Among them, the transmission system mainly includes the motor, reducer, gear pump, plunger pump, etc., which is the main part of the noise generation. Structure of hydraulic cart.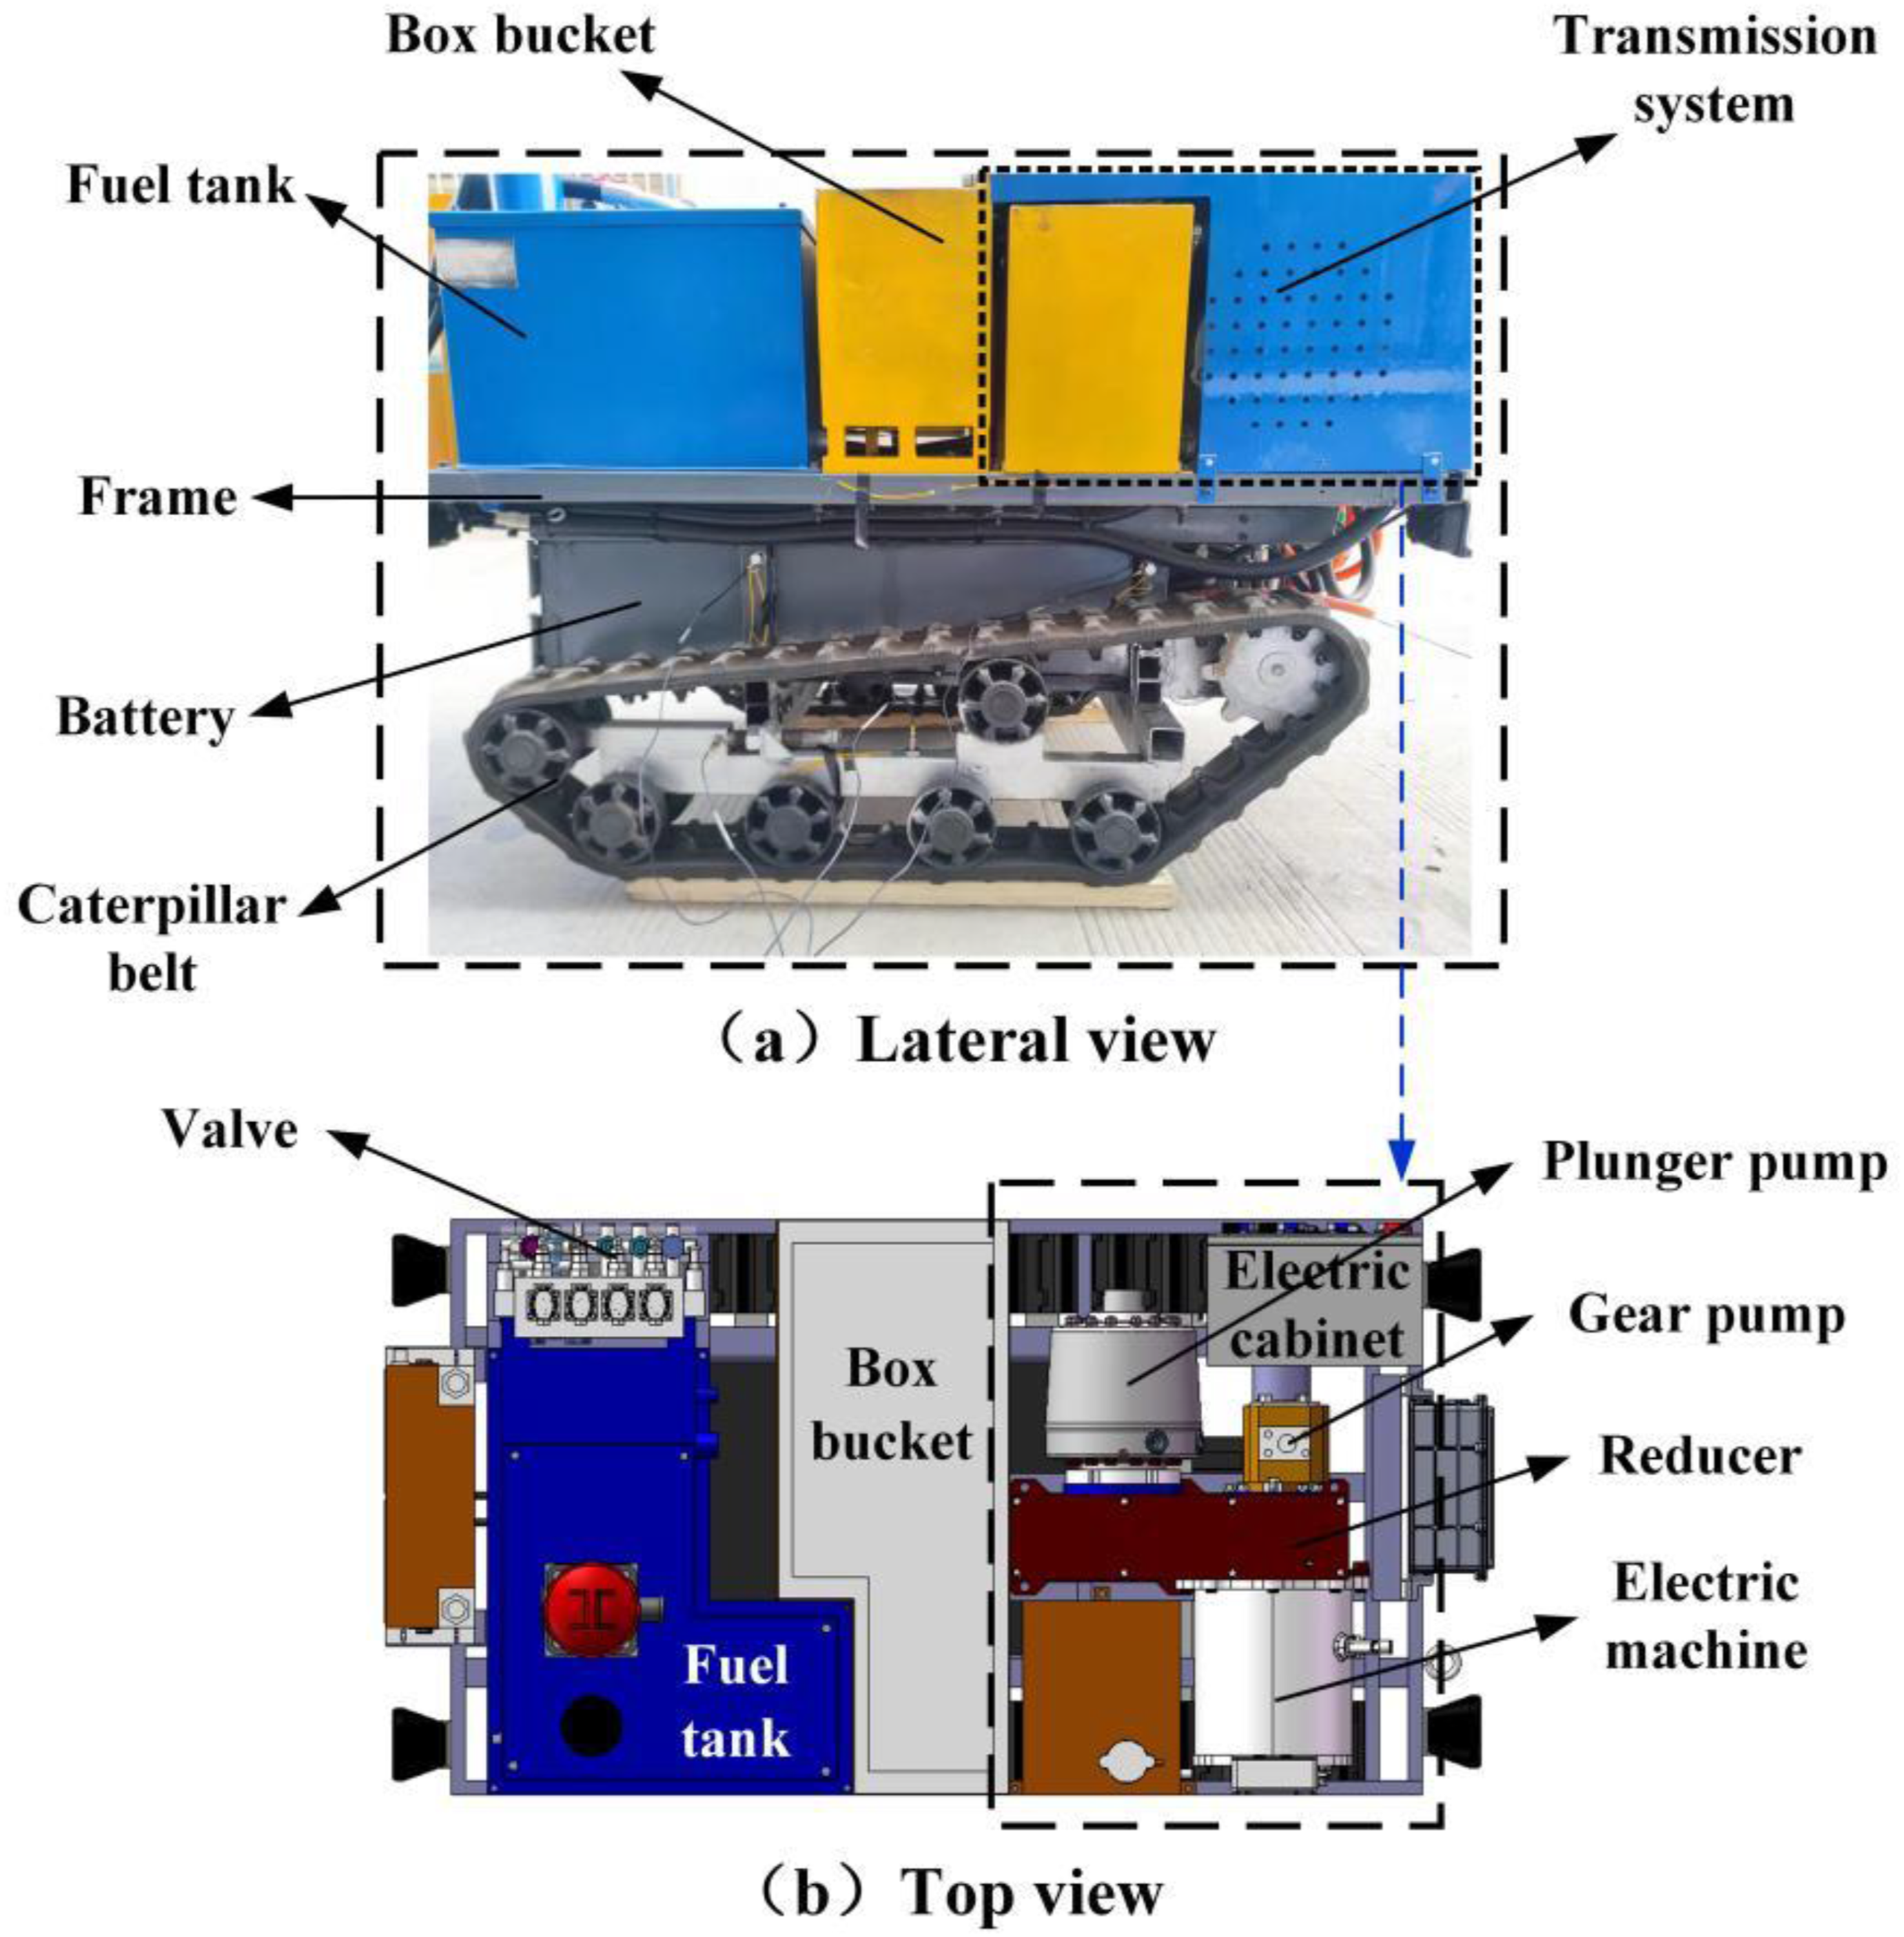
Since the transmission system is the main source of noise, it is necessary to analyze its rotational and meshing frequencies.
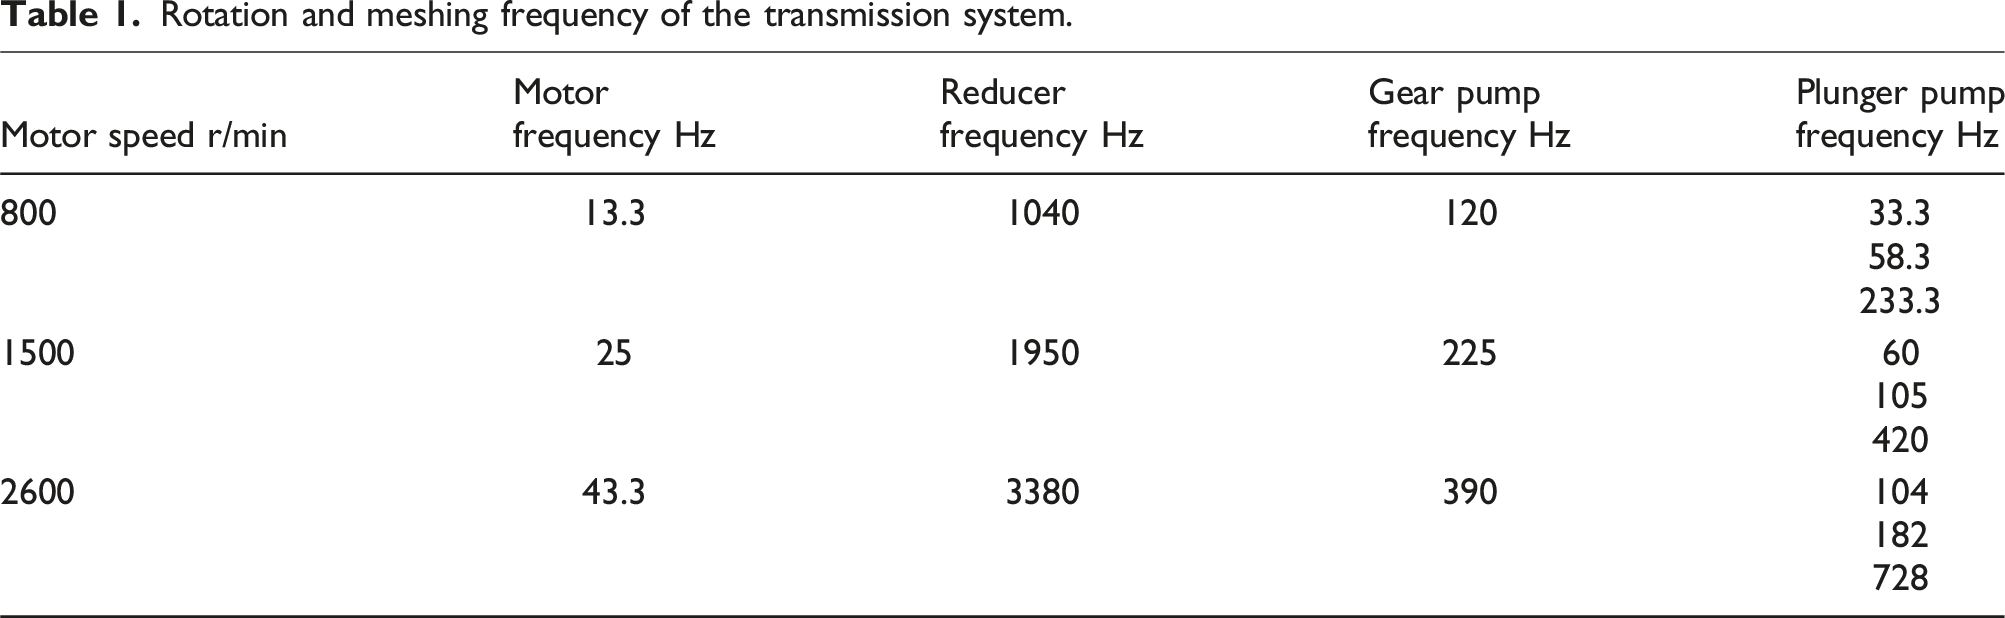
Among them, the motor speed is divided into three gears, the low speed is 800 r/min, the medium speed is 1500 r/min, and the high speed is 2600 r/min. The reducer is a first-stage deceleration, and the ratio of decelerating teeth is 78:130; Among them, one side of the high-speed shaft is connected to the motor shaft, the other side is connected to the gear pump, and the low-speed shaft is output to the plunger pump. The input speed of the gear pump is the same as that of the motor, and the number of engaging teeth is 9. The plunger pump is four rows of seven plungers each.
Rotation and meshing frequency of the transmission system.
Vibration and noise test methods
The vibration and noise test device of the hydraulic cart is shown in Figure 2, in which the main hardware platform, software platform, vibration and sound measurement position are given. Test scheme diagram.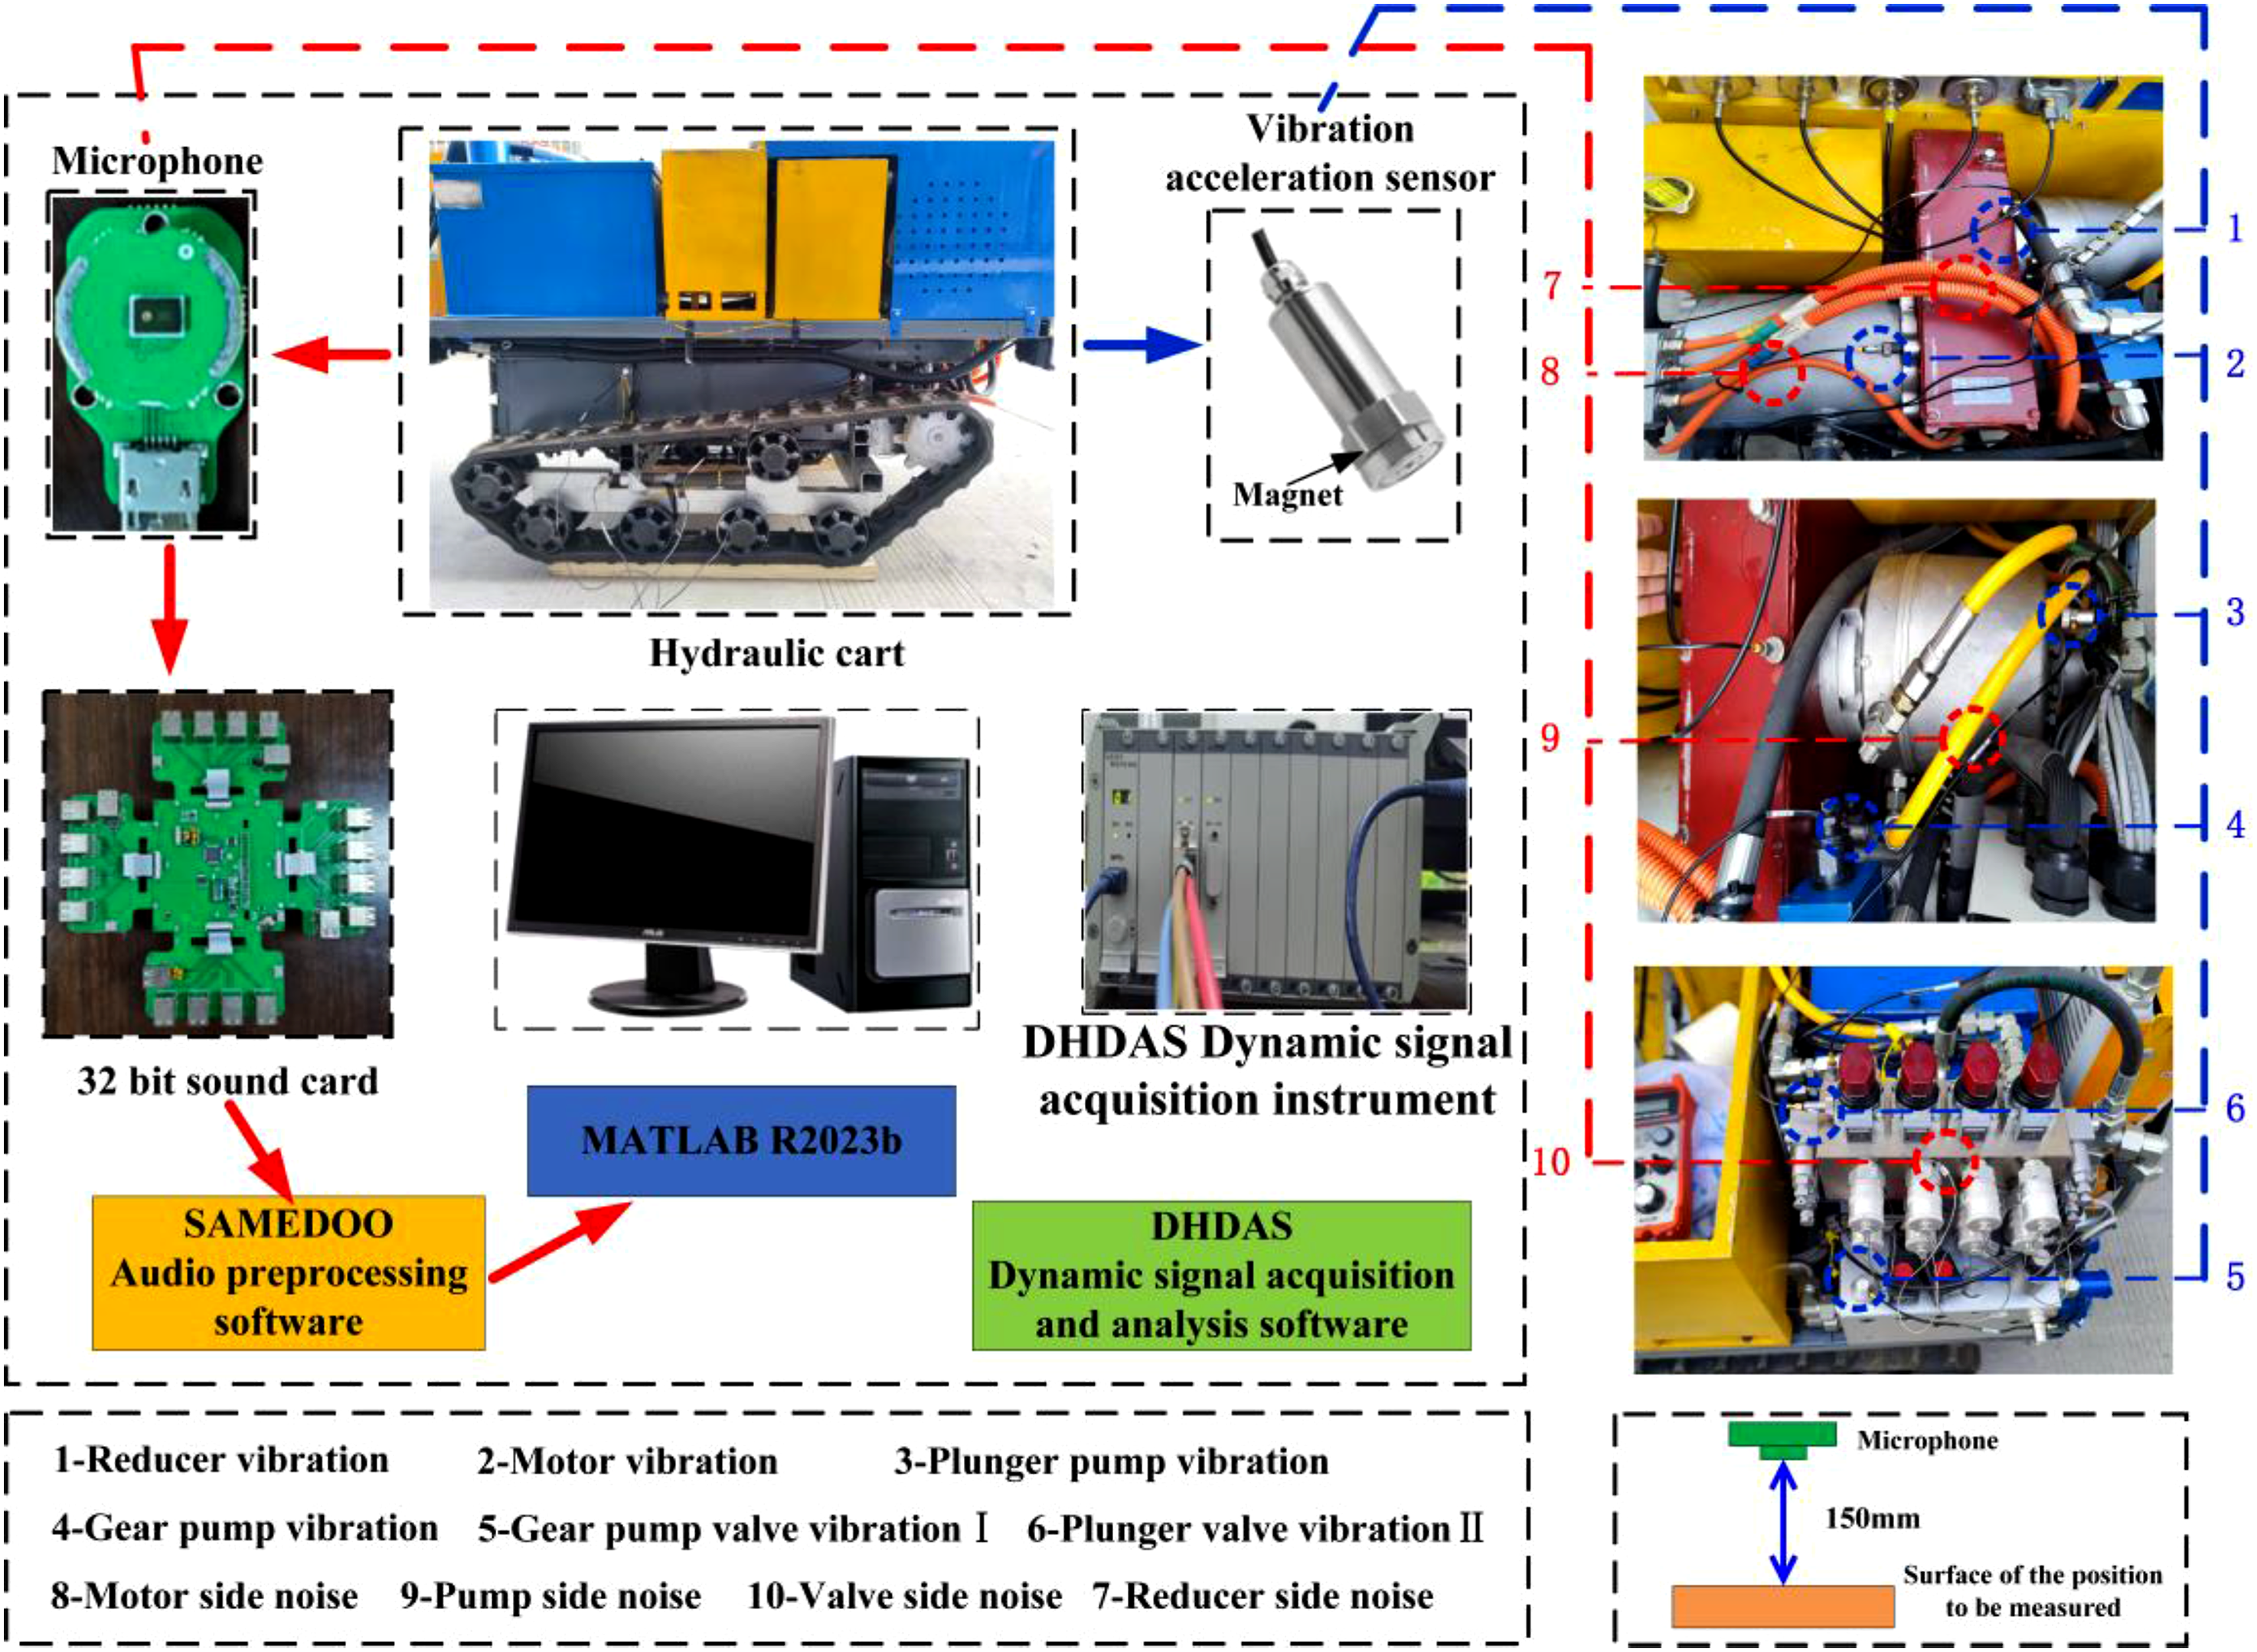
During the test, the vibration acceleration sensor is attached to the part to be measured (position 1-6) of the hydraulic source car with a magnet, and the microphone is directly facing the part to be measured and arranged at a distance of 150 mm from the measurement position (position 7-10) to achieve the purpose of vibration data and sound data collection,and the collected vibration data is transmitted to the DHDAS dynamic signal acquisition instrument, and the sound data is transmitted to the 32-bit sound card. The vibration data and sound data were transferred to MATLAB after being processed by DHDAS dynamic signal acquisition and analysis software and SAMEDOO audio preprocessing software respectively, and the data were processed.
Among them, the vibration acceleration sensor model is Donghua Test 1A102E, and the sampling rate is set to 1 kHz. The sound source acquisition system is mainly composed of an array driver board and a multi-channel MEMS microphone array model WMM7035DTFN0. The array driver board uses 12V2A power supply and is connected to the client computer through a wired network interface. The microphone array is composed of 32 microphone modules and the sampling rate of the microphone is set to 48 kHz.
Results and discussion
Analysis of results at 800 r/min
Noise signal analysis
Through processing the collected noise data, the one-third octave diagram and noise spectrum diagram of 800 r/min are obtained, as shown in Figure 3. 800 r/min noise signal analysis diagram.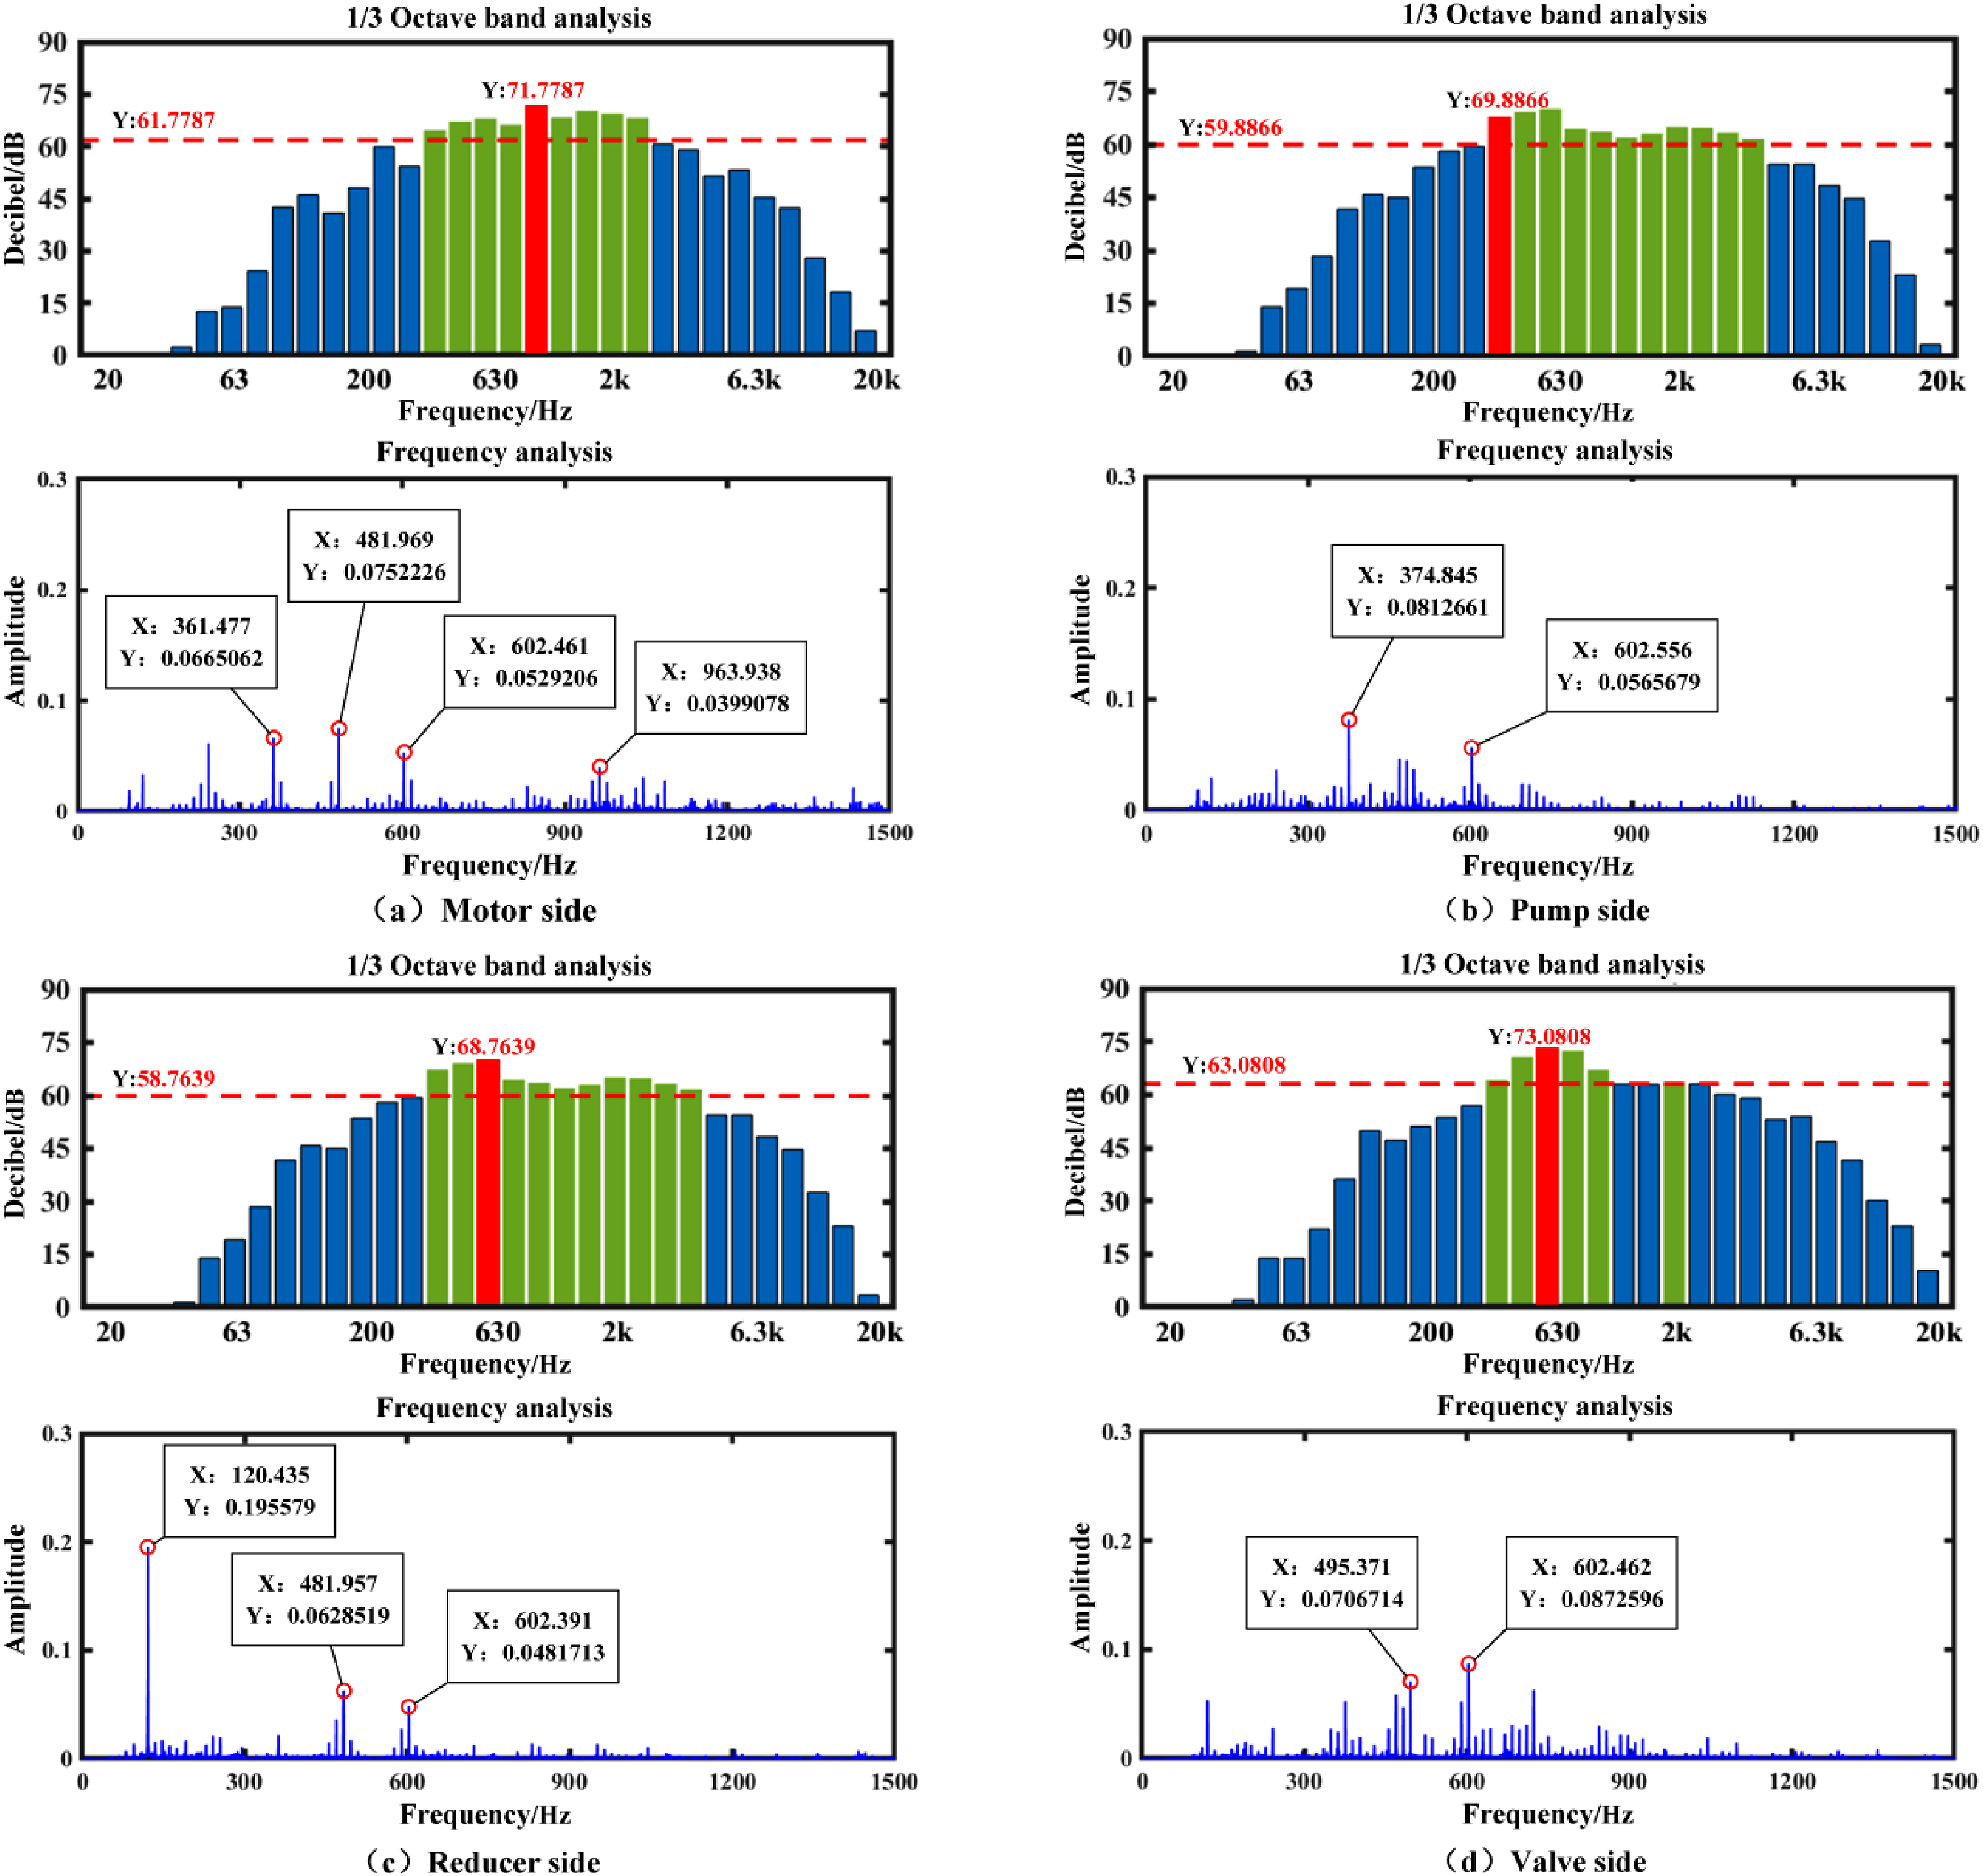
At 800 r/min, the frequency segment corresponding to the louder pressure level of the motor side noise is 355 Hz ∼ 2820 Hz, while the frequencies corresponding to the larger peaks in this frequency segment of the spectrum diagram are successively 361 Hz, 482 Hz, 602 Hz and 964 Hz, in which the source frequency of the highest noise level of 71.78 dB is 964 Hz.
The frequency segment corresponding to the louder pressure level of the pump side noise is 355 Hz ∼ 4470 Hz, and the frequency corresponding to the larger peak value of the frequency diagram in this frequency segment is 375 Hz and 602 Hz, in which the source frequency of the louest pressure level 69.89 dB is 602 Hz.
The frequency segment corresponding to the loud pressure level of the reducer side noise is 112 Hz ∼ 141 Hz and 355 Hz ∼ 2820 Hz, and the frequency corresponding to the large peak value of the frequency diagram in this frequency segment is 120 Hz, 482 Hz, 602 Hz, in which the source frequency of the louest pressure level of 68.76 dB is 602 Hz.
The frequency ranges from 355 Hz to 1120 Hz and from 1780 Hz to 2240 Hz for the loud-level noise on the valve side. The frequencies corresponding to the largest peaks in this frequency range are 495 Hz and 602 Hz respectively. The source frequency of the loud-level 73.08 dB is 602 Hz.
To sum up, it can be seen that the frequencies with large frequency peaks in the four parts all include 602 Hz, and the maximum noise value appears on the valve side, which is 73.08 dB at 602 Hz, so 602 Hz is the main frequency of noise reduction at 800r/min. In addition, it can be seen from Table 1 that the frequency of the gear pump itself at 800r/min is 120 Hz, and 602 Hz is approximately its quintuble frequency, and the larger amplitude of each part almost appears near the integer frequency of 120 Hz of the gear pump, such as 120 Hz, 240 Hz, 360 Hz, 480 Hz, 600 Hz, 720 Hz and 960 Hz. Therefore, it is inferred that the source of noise is the gear pump.
Vibration signal analysis
After processing the measured vibration signal, the vibration spectrum diagram of each position can be obtained, as shown in Figure 4: Vibration spectrum of each part at 800r/min.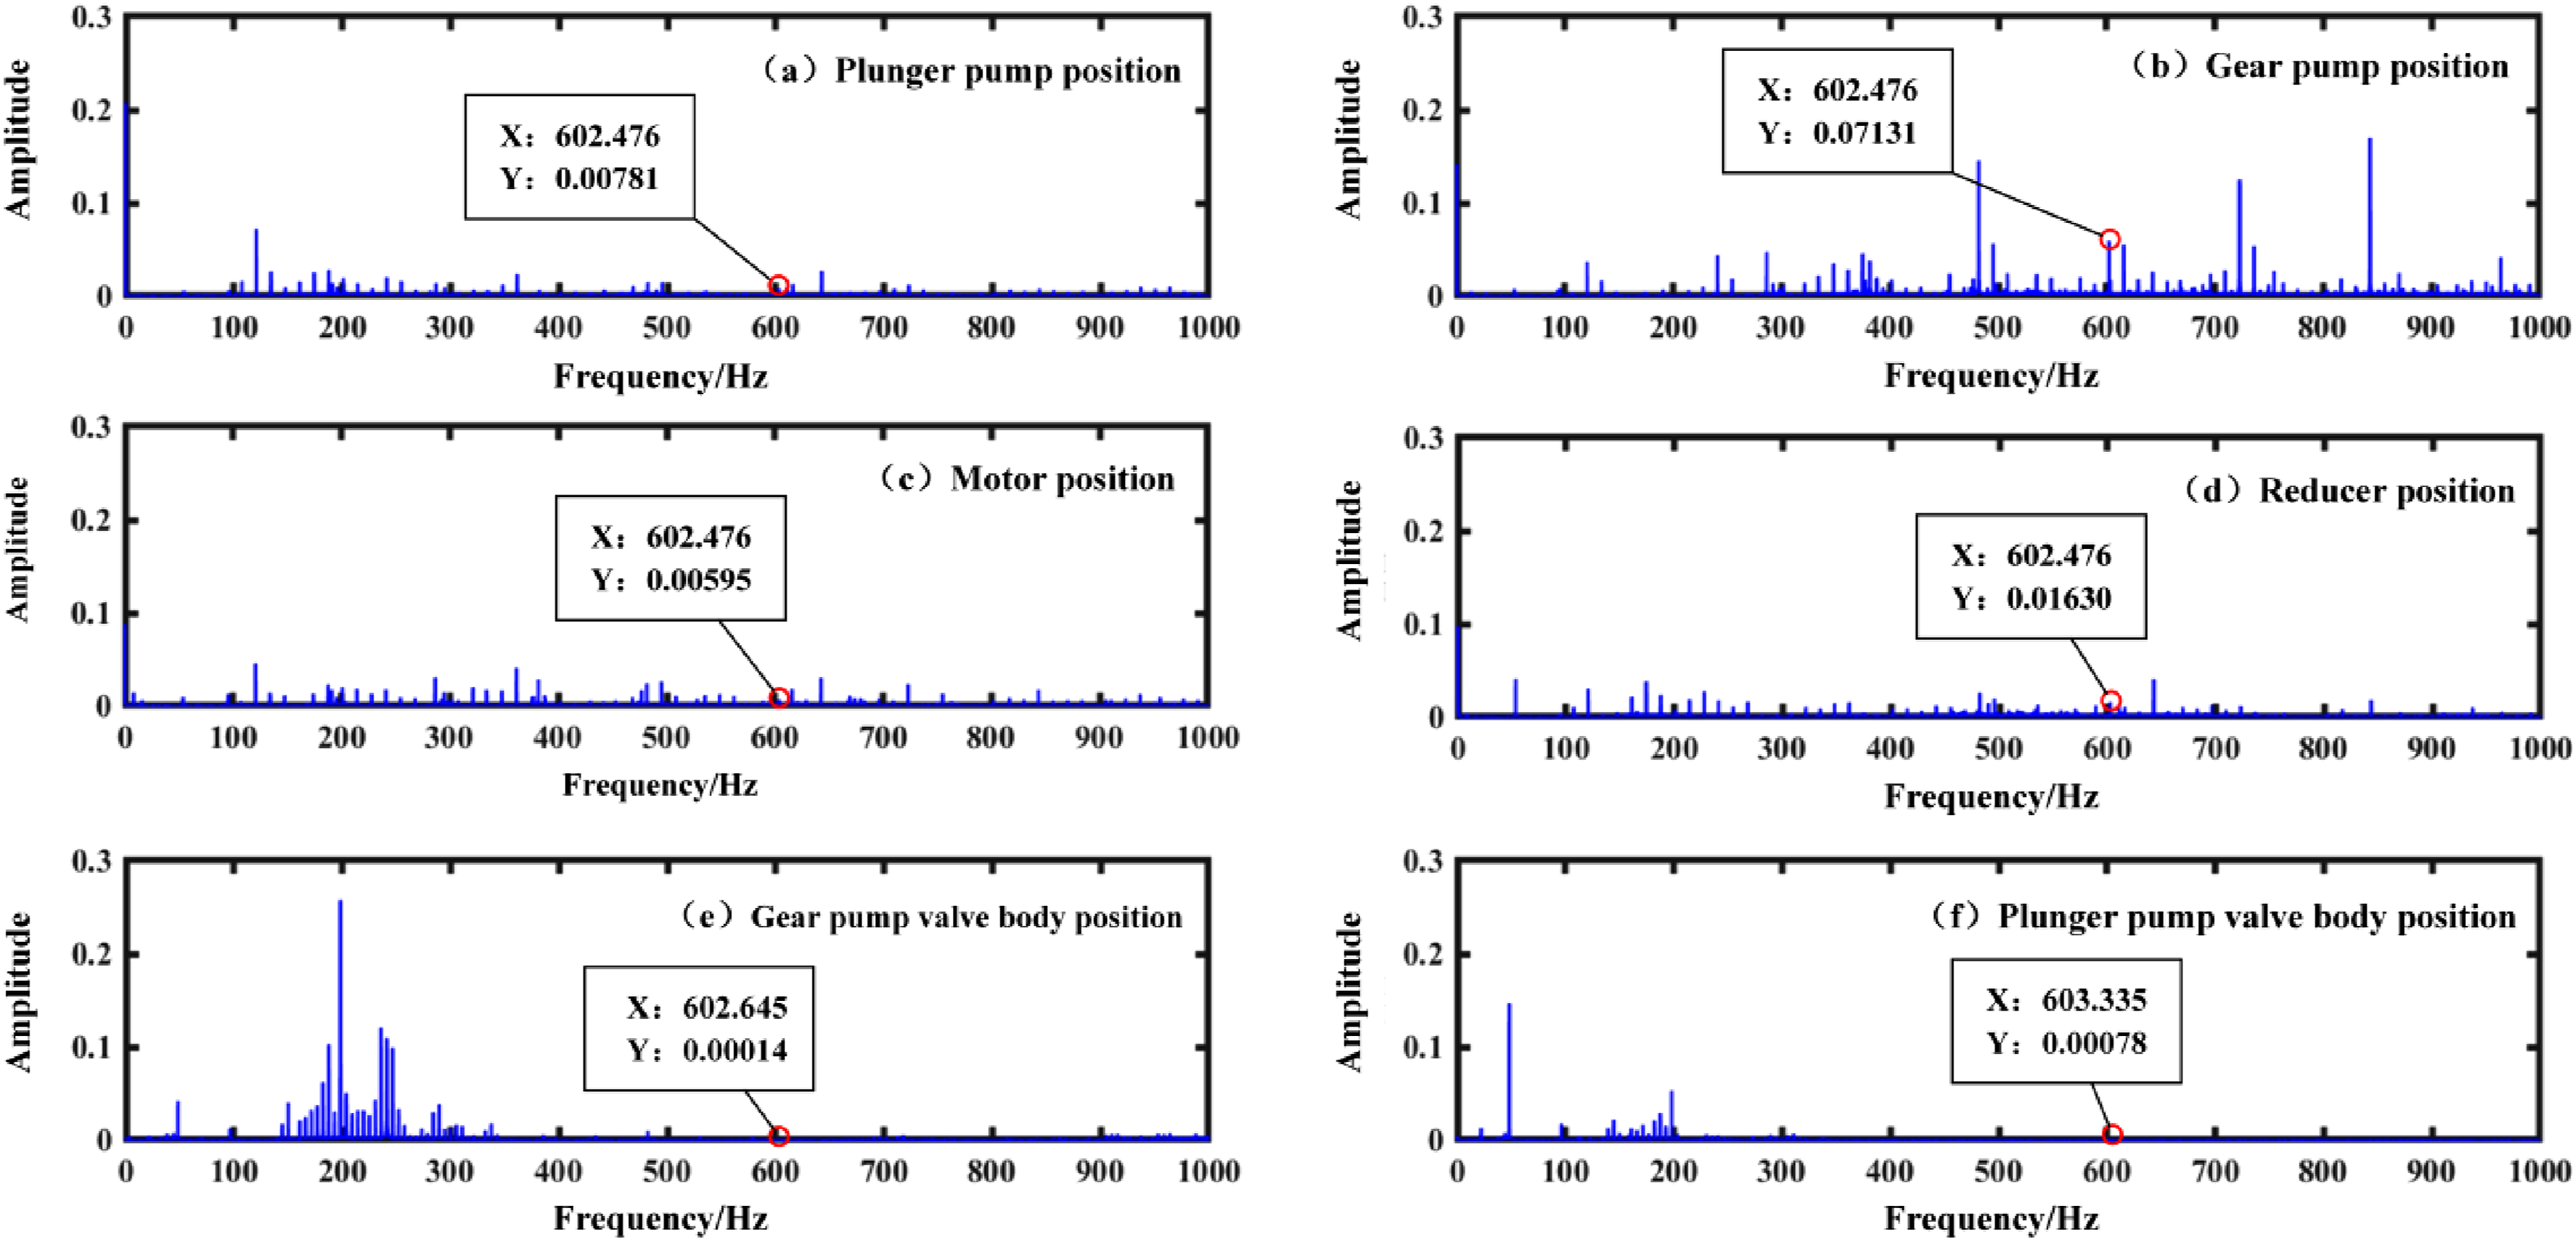
As can be seen from Figure 4, the amplitude of the valve body position of the gear pump and the valve body position of the plunger pump at 602 Hz is much smaller than that of other parts, so it is not the main source of the noise. The vibration amplitude of the gear pump at 602 Hz is much larger than the position of the plunger pump, motor and reducer, and the amplitude is more obvious at each frequency doubling of 120 Hz, so the gear pump is the noise source of 602 Hz noise. It is mainly caused by the meshing of the gear inside the pump. In addition, the 240 Hz amplitude at the valve body position of the gear pump is higher, which can indirectly prove that the gear pump is a 120 Hz noise source.
Analysis of results at 1500 r/min
Noise signal analysis
By processing the collected noise data, the one-third octave diagram and noise spectrum diagram of 1500 r/min are obtained, as shown in Figure 5. 1500 r/min noise signal analysis diagram.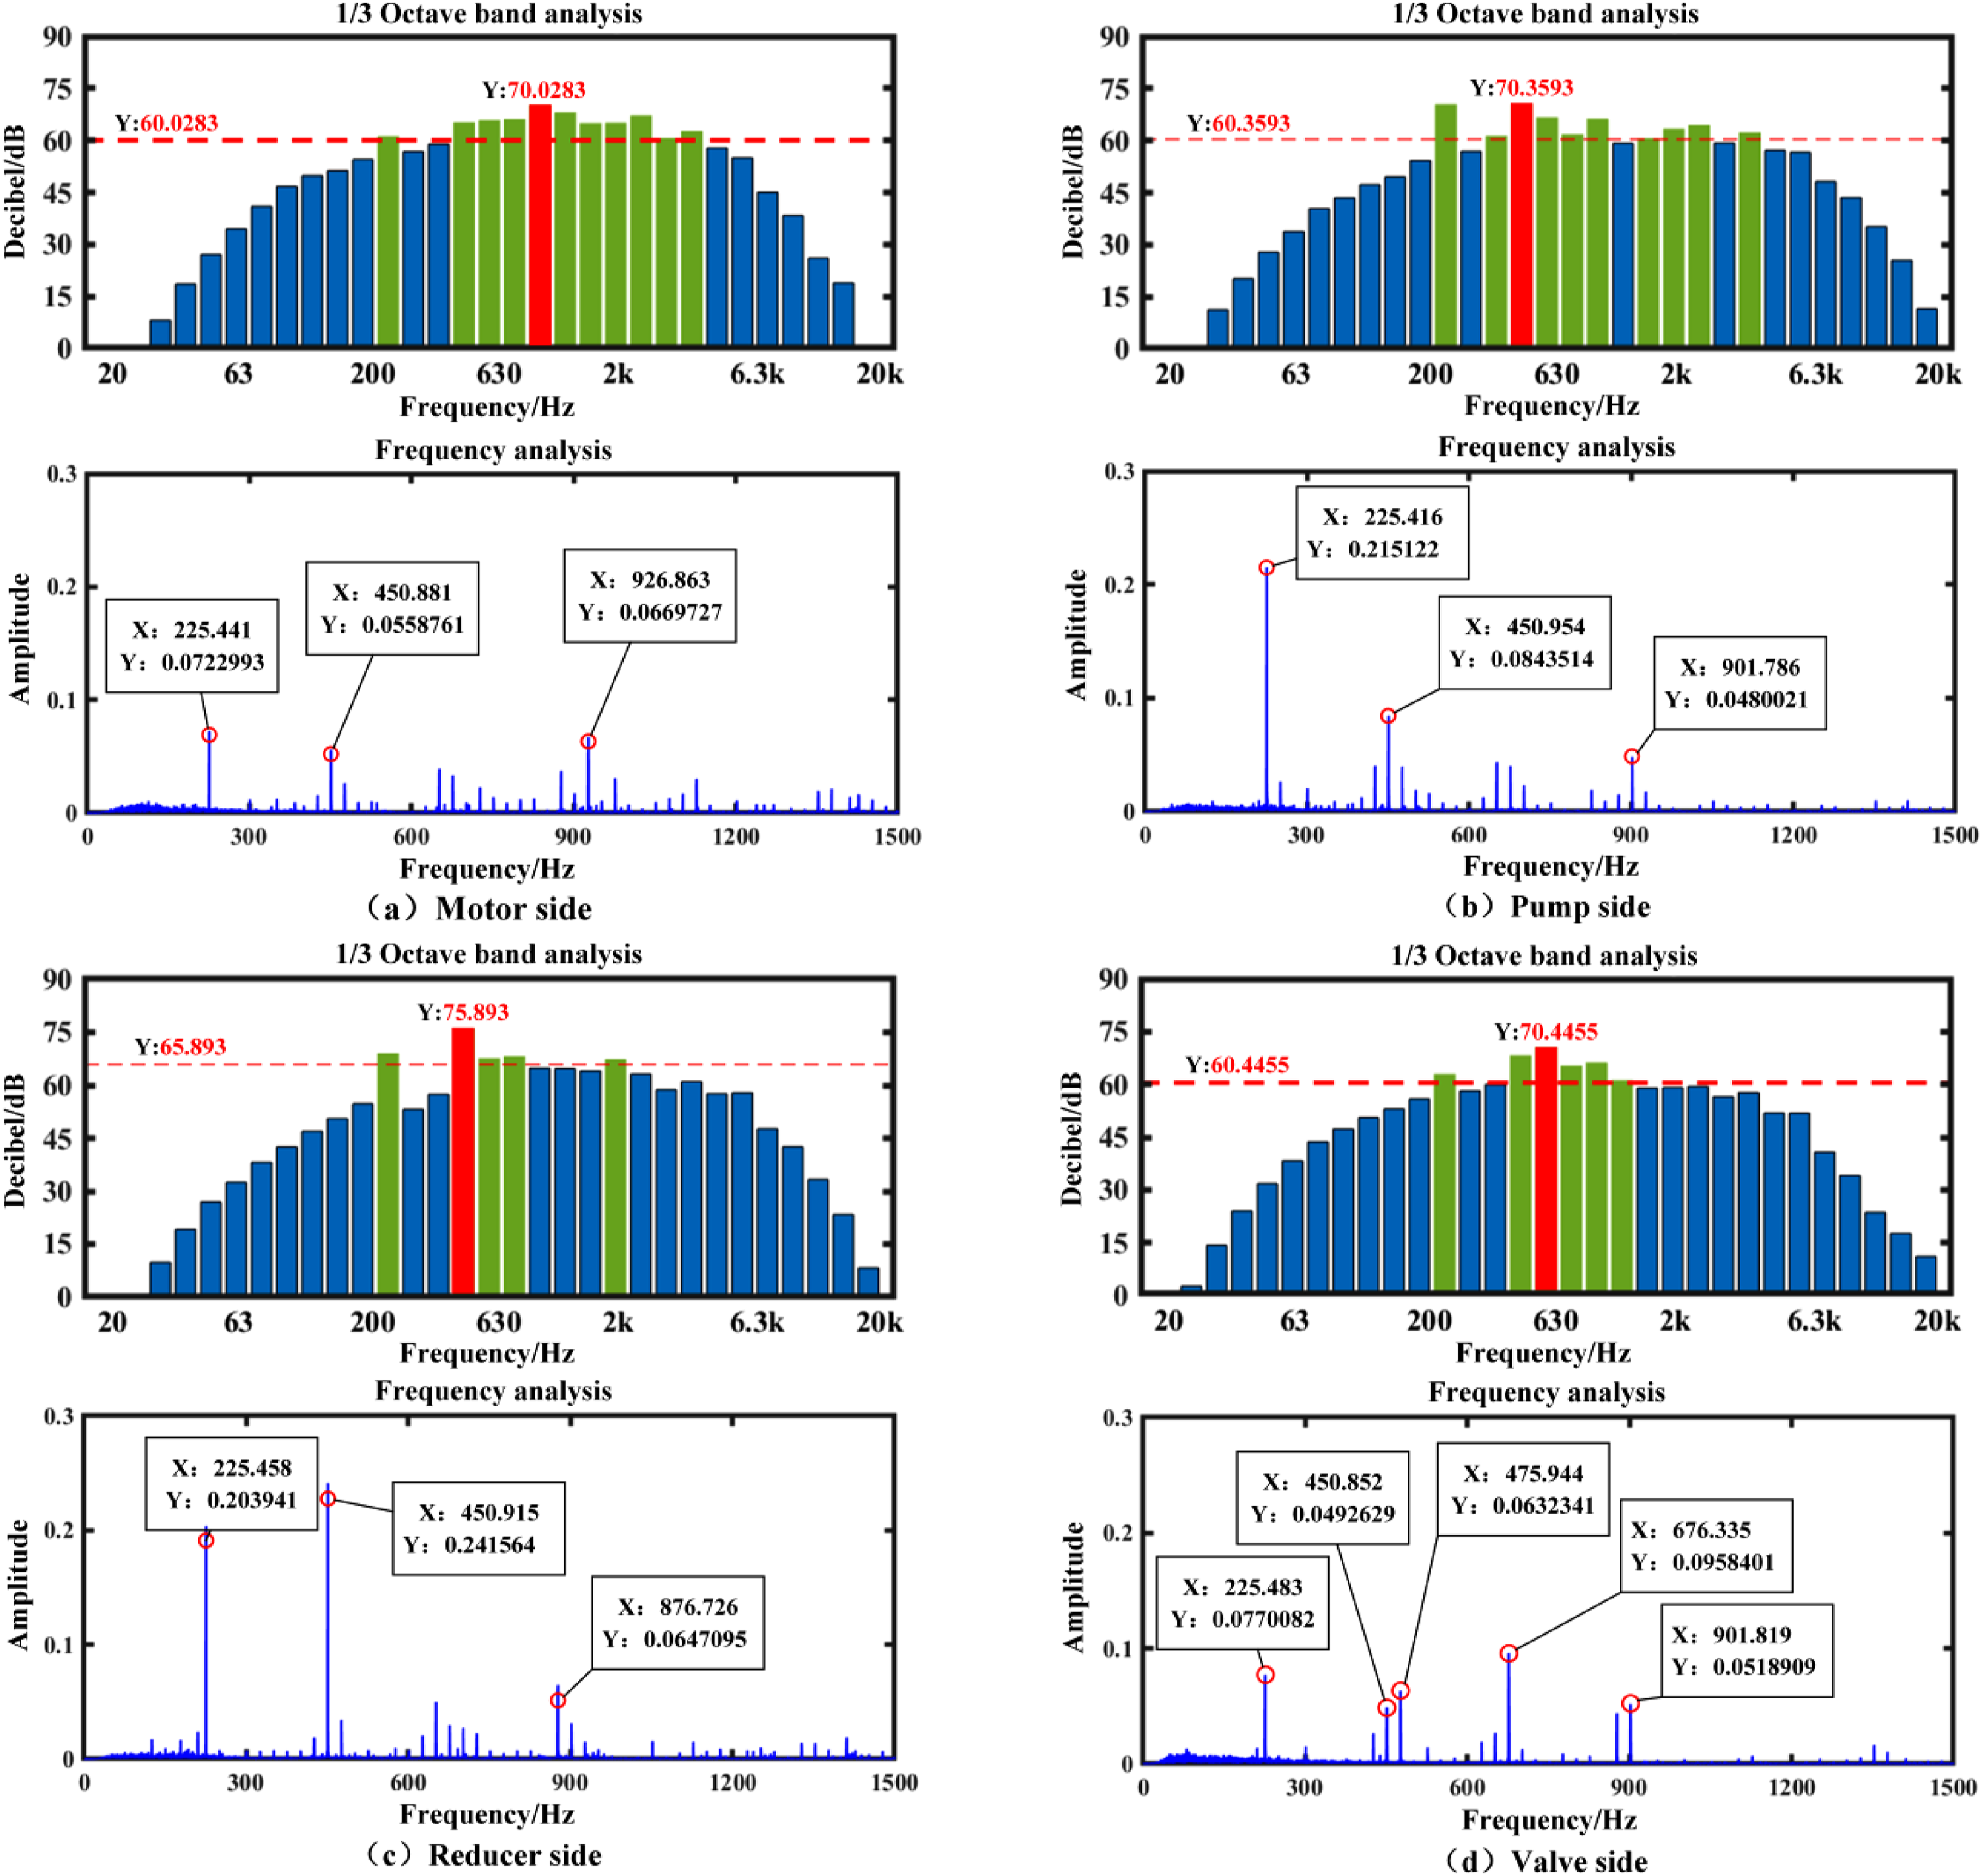
It can be seen from Figure 5 that under 1500 r/min, the corresponding frequency segments of the louder noise pressure level on the motor side are 224 Hz ∼ 282 Hz and 447 Hz ∼ 4470 Hz, while the frequencies corresponding to the larger peaks in this frequency segment of the frequency chart are 225 Hz, 450 Hz, and 926 Hz successively. The maximum sound pressure level 70.03 dB source frequency is 926 Hz.
The frequency segment corresponding to the loud-noise pressure level at the pump side is 224 Hz ∼ 282 Hz, 355 Hz ∼ 1120 Hz, 1410 Hz ∼ 2820 Hz and 3550 Hz ∼ 4470 Hz. The frequencies corresponding to the largest peaks in this frequency segment of the frequency chart are 225 Hz, 450 Hz and 901 Hz successively. The maximum noise pressure level of 70.36 dB is 450 Hz.
The frequency segment corresponding to the loud noise pressure level on the side of the reducer is 224 Hz ∼ 282 Hz, 447 Hz ∼ 891 Hz and 1780 Hz ∼ 2240 Hz, and the frequency corresponding to the larger peak value in this frequency segment of the frequency diagram is 225 Hz, 450 Hz and 876 Hz successively. The maximum noise pressure level 75.89 dB source frequency is 450 Hz.
The frequency segment corresponding to the loud-pressure level of the valve side noise is 224 Hz to 282 Hz and 447 Hz to 1410 Hz. The frequencies corresponding to the largest peaks in this frequency segment of the frequency chart are 225 Hz, 450 Hz, 475 Hz, 676 Hz, and 901 Hz, respectively, and the source frequency of the loud-pressure level 70.45 dB is 450 Hz.
In summary, there are 225 Hz and 450 Hz in the frequency peaks of the four parts, but since the maximum peak value of 450 Hz is greater than the maximum peak value of 225 Hz, and the maximum noise value of each part is 75.89 dB under 450 Hz on the side of the reducer, 450 Hz is the main frequency of noise reduction under 1500r/min.According to Table 1, 450 Hz is twice the meshing frequency of the gear pump under 1500r/min,so the source of noise is still the gear pump. In order to prove the above conclusion, the test vibration signal is still used for analysis.
Vibration signal analysis
After processing the measured vibration signal, the vibration spectrum diagram of each position can be obtained, as shown in Figure 6. Vibration spectrum of each part of 1500 r/min.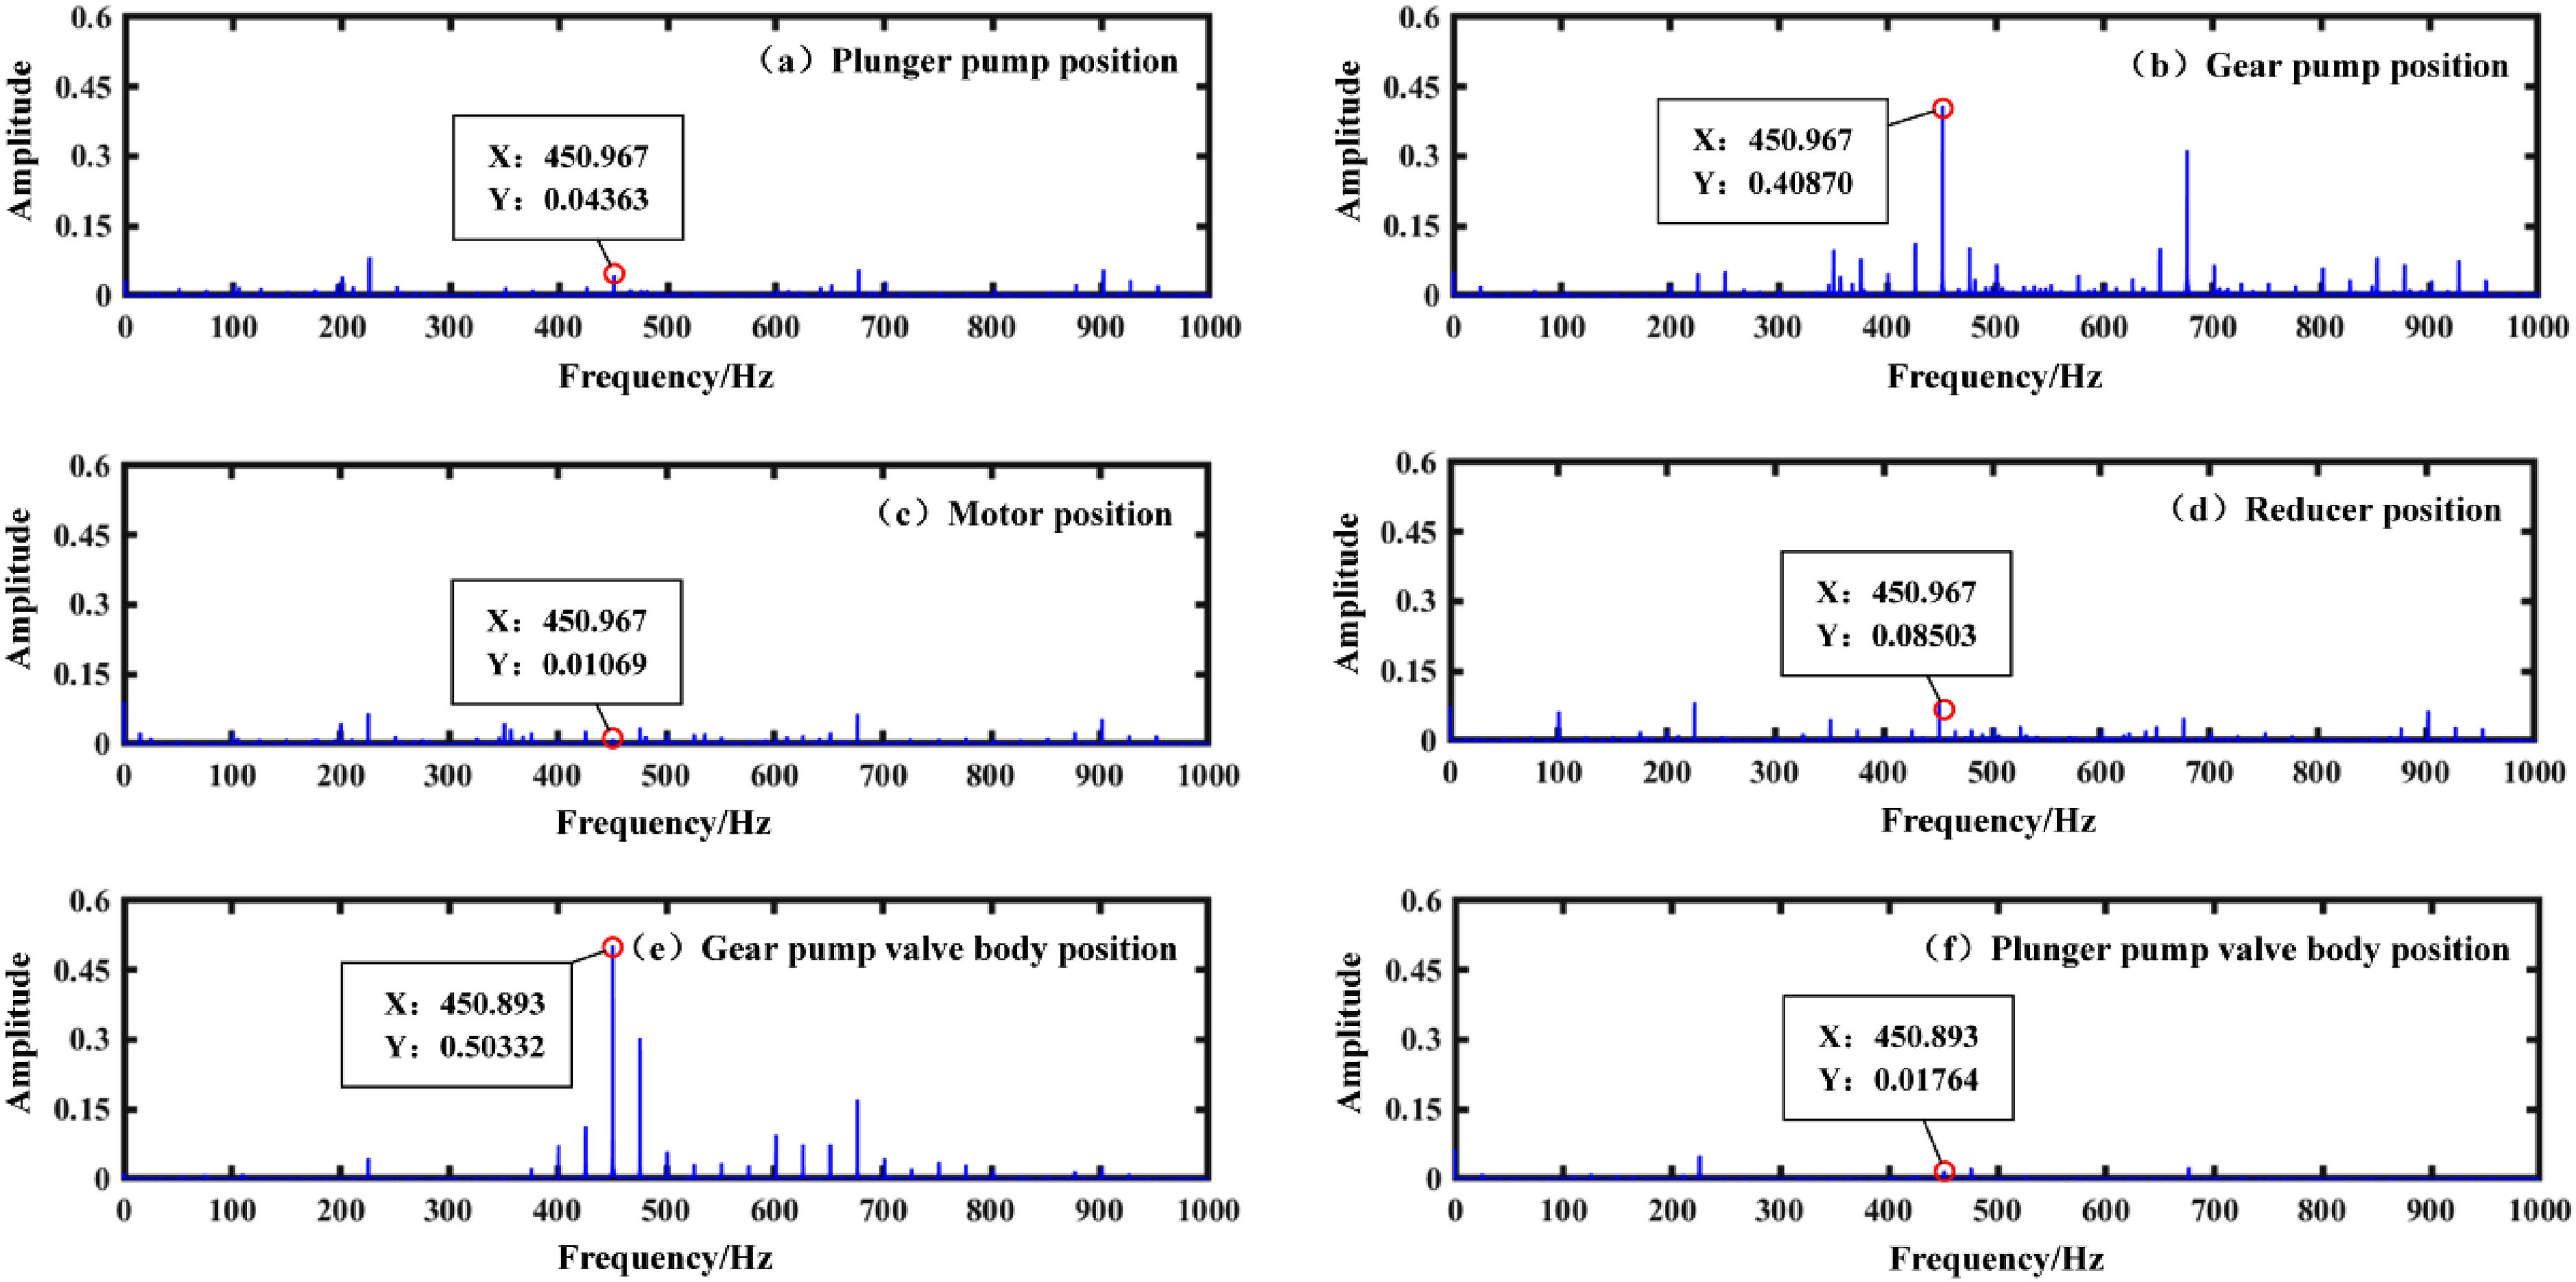
It can be seen from Figure 6 that the gear pump and gear pump body have a larger amplitude of 450 Hz frequency, which proves that the main source of the main frequency of noise reduction under 1500 r/min is indeed the gear pump.
Analysis of results at 2600 r/min
Noise signal analysis
By processing the collected noise data, the one-third octave diagram and noise spectrum diagram of 2600 r/min are obtained, as shown in Figure 7. 2600 r/min noise signal analysis diagram.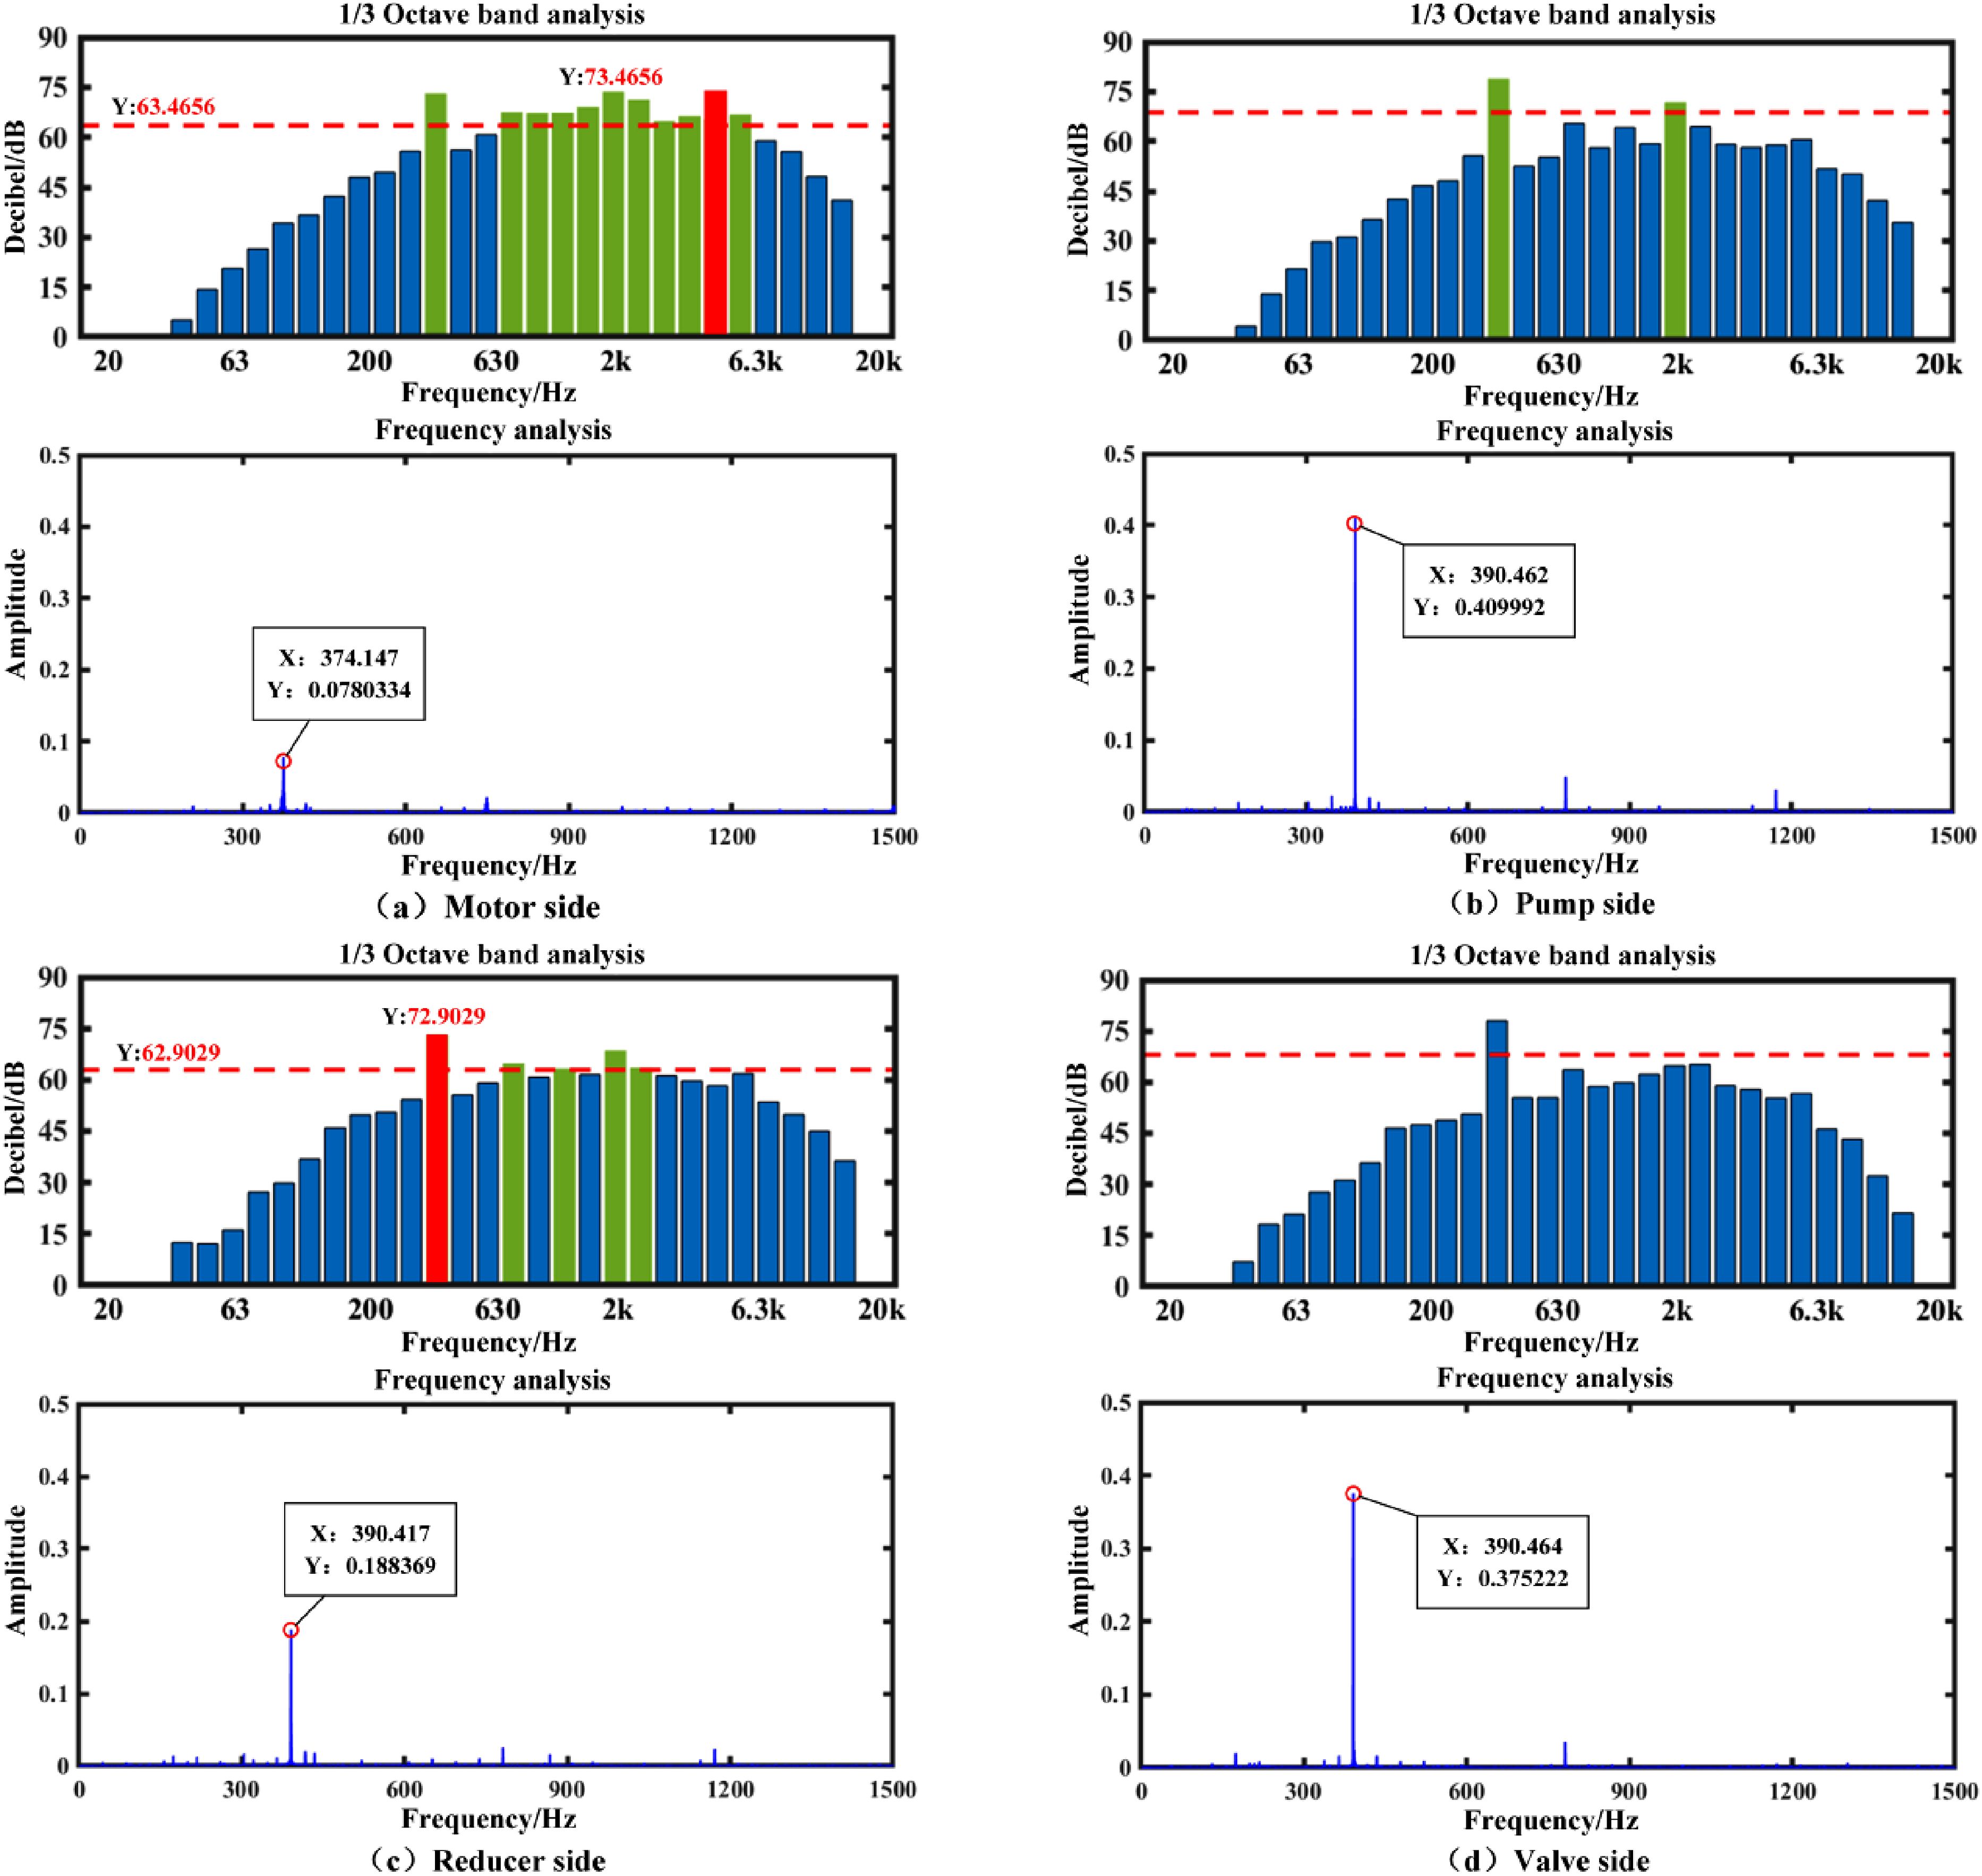
As can be seen from Figure 7, the corresponding frequency segments of the louder pressure levels of each part are 355 Hz ∼ 447 Hz at 2600 r/min. It can be seen from the frequency diagram that the maximum noise and vibration value of the pump side, the reducer side and the valve side are almost all near 390 Hz, and the maximum noise value of the four positions is 78.67 dB and on the pump side, and the main source frequency is 390 Hz. Therefore, the maximum noise frequency under 2600r/min is 390 Hz, which is the main frequency of noise reduction. According to Table 1, 390 Hz is the gearing frequency of the gear pump under 2600 r/min, and its source is still the gear pump. In order to prove the above conclusion, the test vibration signal is still used for analysis.
Vibration signal analysis
After processing the measured vibration signal, the vibration spectrum diagram of each position can be obtained, as shown in Figure 8. As can be seen from Figure 8, the 390 Hz frequency of the gear pump position and the gear pump valve body position is the most prominent, which proves that under 2600 r/min, the main source of the main frequency of noise reduction is still the gear pump. Vibration spectrum of each part of 2600 r/min.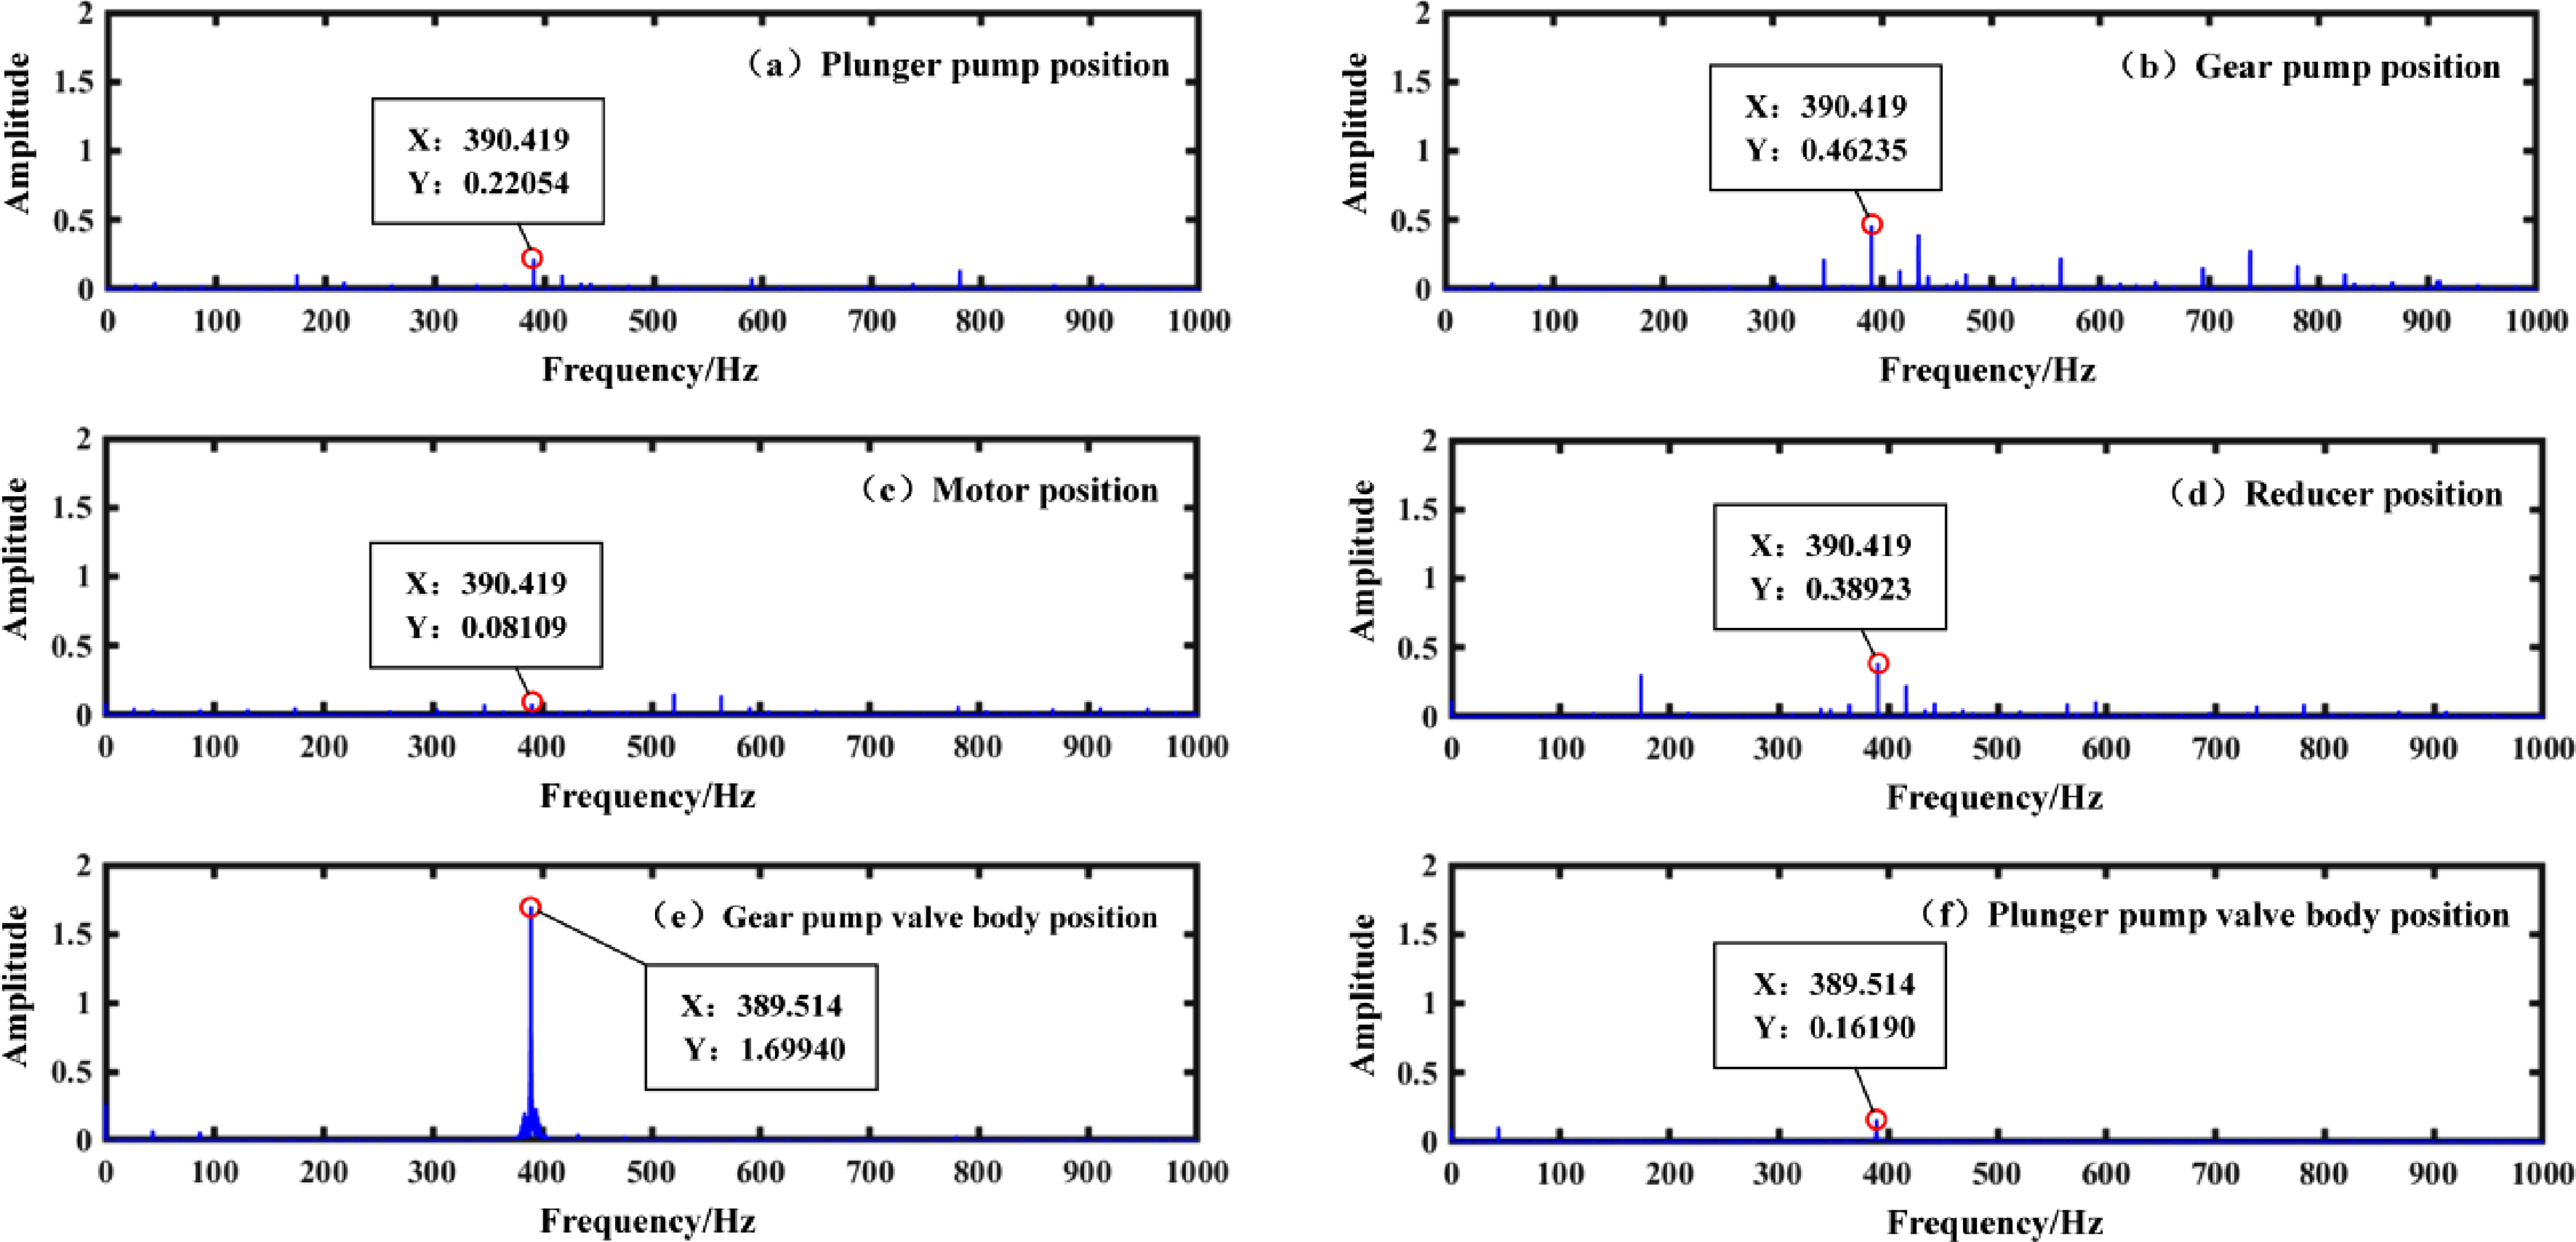
Conclusions
In this paper, the main source of noise is deduced by comparing and analyzing the peak noise frequency and the rotation and meshing frequency of each part of the hydraulic source cart. Then, by analyzing the vibration spectrum diagram and comparing with the noise signal analysis results, the specific noise source frequency and location are finally determined. The conclusions are as follows: (1) At 800 r/min, the maximum sound pressure level of the hydraulic cart is 73.08 dB on the valve side, with the dominant noise source at 602 Hz, which is the 5th harmonic of the gear pump meshing frequency (120 Hz). At 1500 r/min, the maximum sound pressure level reaches 75.89 dB on the reducer side, where the primary noise occurs at 450 Hz—the 2nd harmonic of the gear pump meshing frequency (225 Hz). At 2600 r/min, the peak sound pressure level (78.67 dB) appears on the pump side, with the dominant noise frequency at 390 Hz, exactly matching the gear pump meshing frequency under this rotational speed. (2) For the hydraulic source cart, the frequency range of noise reduction under different gears is 350 Hz ∼ 650 Hz. If passive noise reduction is used, it is recommended to mainly package the gear pump and gear pump valve, and use the corresponding frequency sound absorption cotton to absorb sound.
Footnotes
Declaration of Conflicting Interests
The author(s) declared no potential conflicts of interest with respect to the research, authorship, and/or publication of this article.
Funding
The author(s) disclosed receipt of the following financial support for the research, authorship, and/or publication of this article: This research is supported by the Key Research and Development Project in Shaanxi Province (2024GX-YBXM-247) and the National Natural Science Foundation of China (52375080), the Natural Science Foundation of Shaanxi Province (2023-JC-QN-0263).

Data Availability Statement
The data that support the findings of this study are not openly available due to reasons of sensitivity and are available from the corresponding author upon reasonable request.