
Abstract
In order to assess the influence of the operating parameters on the heavy vehicle (HV) vibrations in the frequency region, a HV’s vibration model using 9-DOF is built to calculate the vibration equations in the time region. HV’s vibration equations are then converted from the time region to the frequency region via the Laplace-transfer-function. The change of the operating parameters such as the wavelength of the road, traveling velocity of HV, mass of HV, and stiffness of HV suspensions has been simulated for analyzing the results. The research result reveals that the resonant frequencies of HV are not affected under different operating conditions of HV. To ameliorate HV’s ride comfort, the road’s wavelength S needs to be designed by S >25 m while the stiffness coefficients of HV’s suspension system should be reduced by 0.6 K. Additionally, under the operation conditions of HV, the moving velocity below 60 km/h and two load cases of the half load and full load should be maintained to optimize the ride comfort of HV. This study contributes to clarifying the influence of parameters on the vibration characteristics of vehicles in more detail, thereby providing optimal design methods for both the vehicle and road surface to improve the working efficiency of vehicles.
Keywords
Introduction
The suspension system equipped on the vehicles not only isolates the vibration to improve the ride comfort but also reduces the negative impact of the dynamic load from the wheel to the road surface. Therefore, in the vibration study of the heavy truck (HV), the two criteria of improving ride comfort and road friendliness are gradually being perfected based on the development of their suspension systems.1–5 In order to improve the ride comfort of semi trailer trucks, many studies have been proposed and studied on their suspension system. Based on the dynamic model of HV, the influence of design parameters as well as the working conditions of the vehicles was analyzed and optimized to improve the ride comfort.6–9 The study showed that the ride comfort of HV was quite low when using passive suspension systems with constant leaf stiffness. Accordingly, the air suspension systems of HV were developed to replace the leaf spring suspensions.10–12 The results showed that the air suspension system isolated the vehicle’s vibrations better than the leaf suspension system under the same working conditions. Based on the vibration isolation ability of the air suspension system, cab’s suspension system in HV trucks, semi trailer trucks, and tractors was also studied and used by the air suspension system to improve the ride comfort of the cab in all vertical, pitching, and rolling directions.13–17 As a result, the driver’s comfort has improved significantly.
In addition, based on the development of control technology, suspension systems using leaf springs or air suspension systems equipped on vehicles were also studied and controlled based on the control of the magnetorheological fluid in the damper of the suspension system.18–20 With the suspension system controlled, the studies showed that the ride comfort was improved. Simultaneously, the negative impact of dynamic wheel loads on the road surface was also significantly reduced. However, the driver’s ride comfort is still low. Accordingly, with the HV that requires high comfort, designers have studied the direct control of the seat’s suspension instead of controlling the suspension system of the vehicle or the cab.21–24 The result of the driver’s ride comfort using the seat’s control suspension has been greatly improved in comparison with using the vehicle control suspension system. In all the above studies, the vehicle’s vibration is also researched based on the methods of numerical simulation and experimentation.16,17,20–24 However, most studies evaluated the vibration of vehicles in the time region.
In the study of driver ride comfort, ISO 2631-1 showed that low excitation frequencies from 0.5 to 10 Hz had a great influence on the health and comfort of the operator. 25 These excitation frequencies mainly appeared on the road surface when the vehicle was moving. 26 In the study of the vibration characteristics of the air suspension in the low frequency region, the research result showed that the air spring’s stiffness decreased when the excitation frequency was below 4.0 Hz and increased when the excitation frequency was in the range of 5.0 to 8.0 Hz.27,28 This change also greatly affected the isolation efficiency of the air suspension system. In addition, the comfort studies of HV in the time region showed that when the vehicle was moving at a speed range from 50 to 75 km/h, HV’s comfort was significantly improved compared to the vehicle moving at a speed below 50 km/h or above 80 km/h.4,5,29 However, the studies could not explain this issue in detail. The scholars only give predictions that may be due to the resonance effect between the suspension system and the road surface excitation in the frequency region. From the above problems, we can see that the vibration study of HV in the frequency region to understand in detail the vibration transmission characteristics from the road surface to HV is necessary. From there, we can design and optimize the suspension system of HV based on the working conditions to reduce vibration transmission as well as improve HV’s ride comfort. However, this problem is still open in existing studies.
From the structure of HV, its dynamic model with 9-DOF is established to calculate the vibration equations in the time region. The Laplace-transfer-function is then applied to convert HV’s vibration equations in the time region to the frequency region to study HV’s vibrations in the frequency region. The influence of road’s wavelength, HV’s velocity, HV’s loads, and HV’s suspension stiffness on HV’s vibrations is simulated and analyzed, respectively. The evaluation of the dynamic parameters and operation conditions of HV to improve the ride comfort is the goal of the study.
The contribution of the study can be summarized as follows: (1) Based on the dynamics model and vibration equation of HV in the time region, a vibration evaluation method of HV in the frequency domain is proposed to study HV’s vibration characteristics; (2) Based on this proposed method, the influence of design parameters and operating conditions of HV on the ride comfort can be evaluated in detail; (3) This evaluation method can also be applied to all other vehicles to optimize design parameters as well as operating conditions of vehicles.
Vibration model of HV
Calculation model in the time region
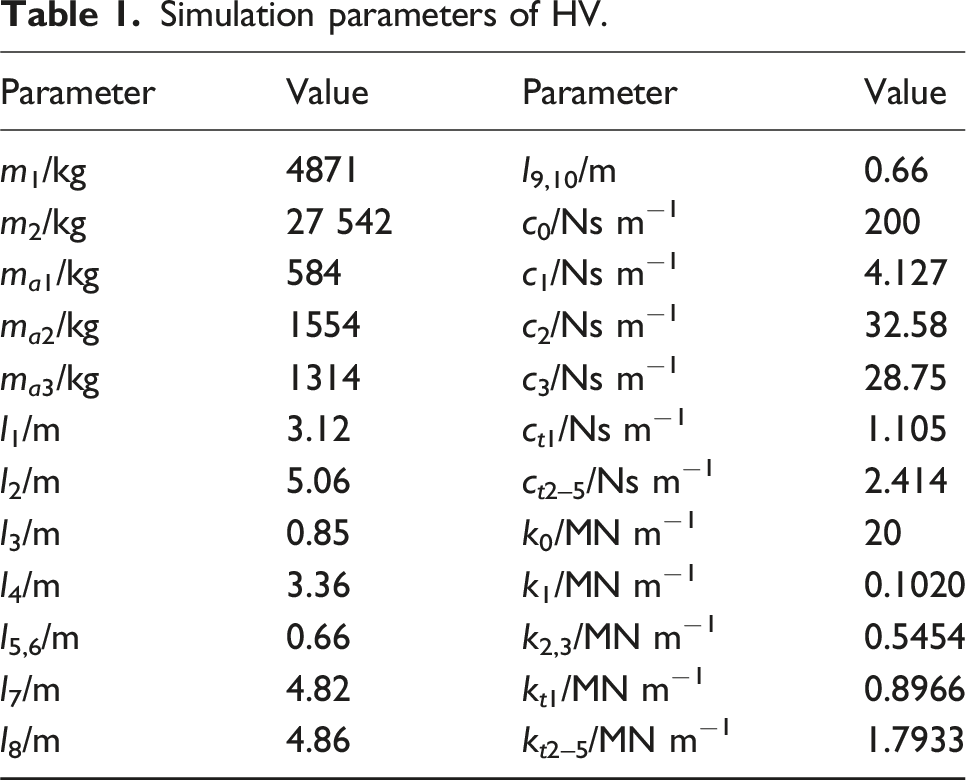
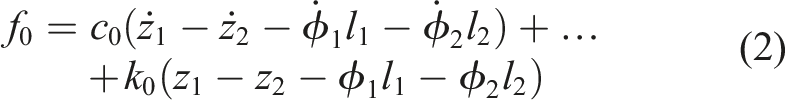
Based on the structure and design parameters of an HV in Refs. 1 and 29, a dynmaic model of HV with 9-DOF and its simulation parameters have been established and listed in Figure 1 and Table 1. Where the dynamic parameters of HV are defined as follows: m1 and m2 are the mass of the tractor driver and semi trailer. ma1−5 is the mass of three axles. z1−5 is the vertical displacements of the tractor driver, semi trailer, three axles. ϕ1−4 is the pitching angles of the tractor driver, semi trailer, second axle, and third axle. l1−10 and v0 are the distances and velocity of the HV. {c0, c1−3, and ct1−5} are the dynamic damping values while {k0, k1−3, and kt1−5} are the dynamic stiffness values of the articulation, HV’s suspensions, and wheels. q1−5 is the vibration of the road surface when the HV is moving on the road. Heavy vehicle model. Simulation parameters of HV.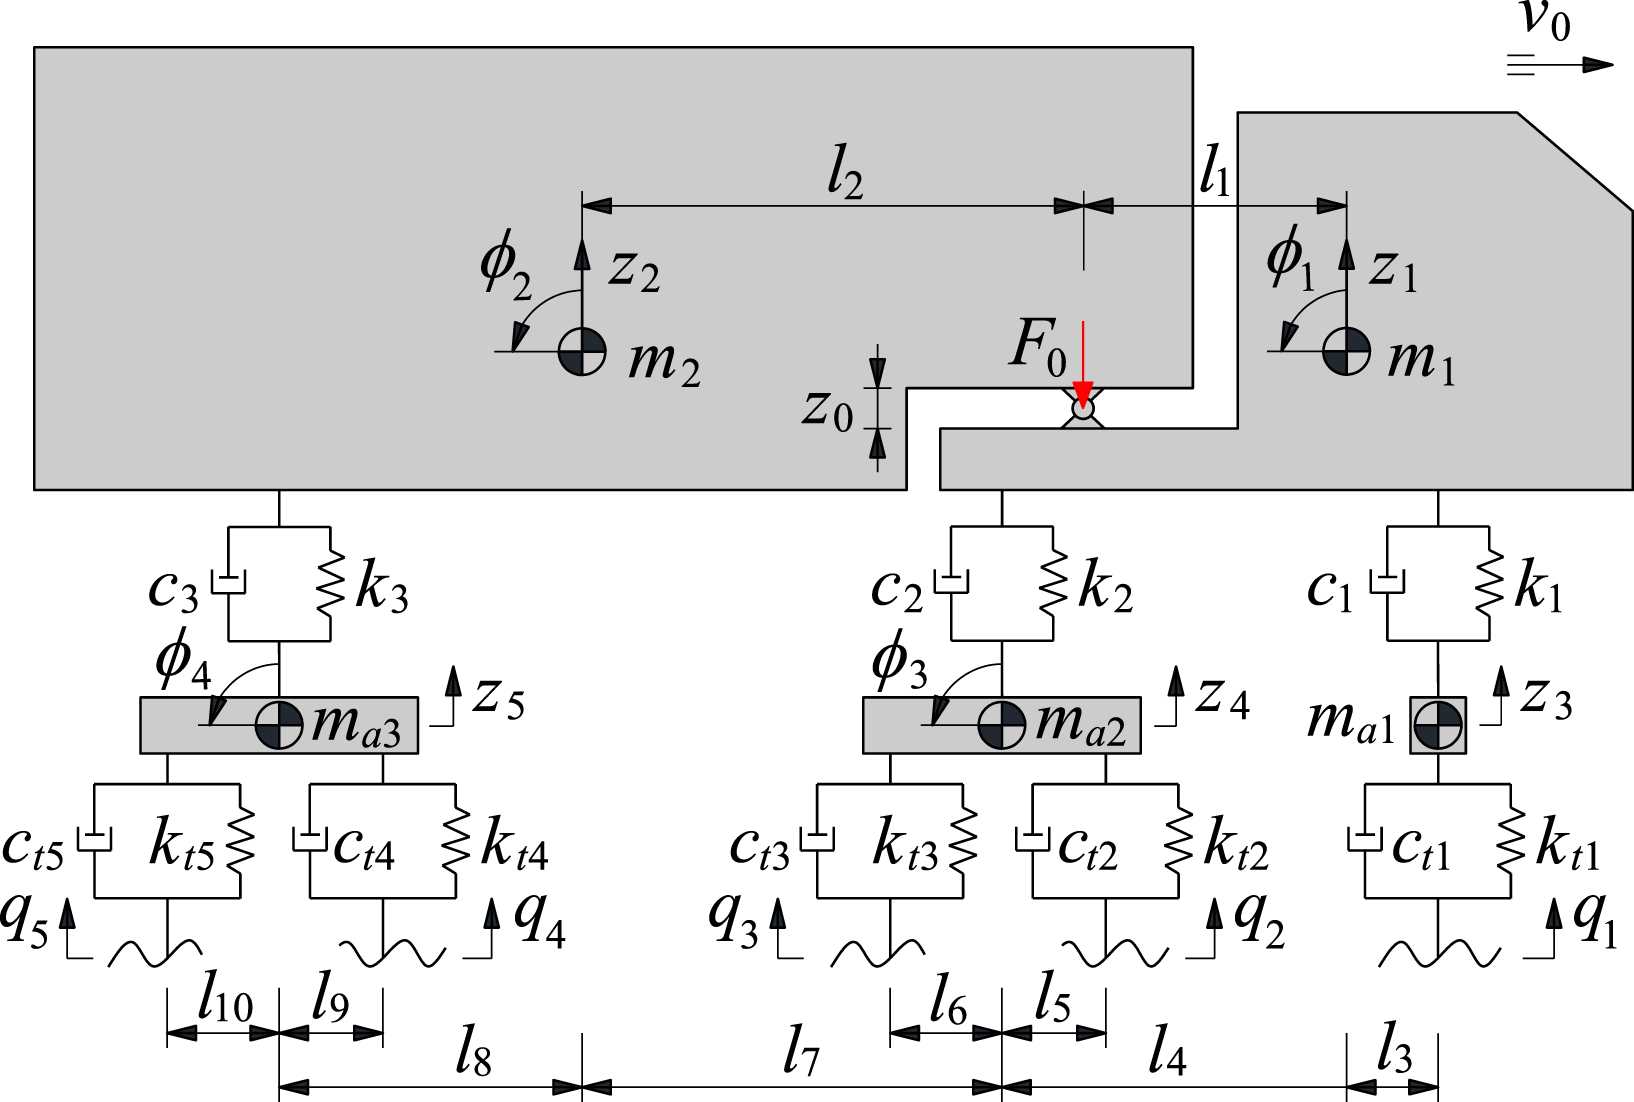
From the vibration model of HV shown in Figure 1, the dynamic equations of HV could be expressed by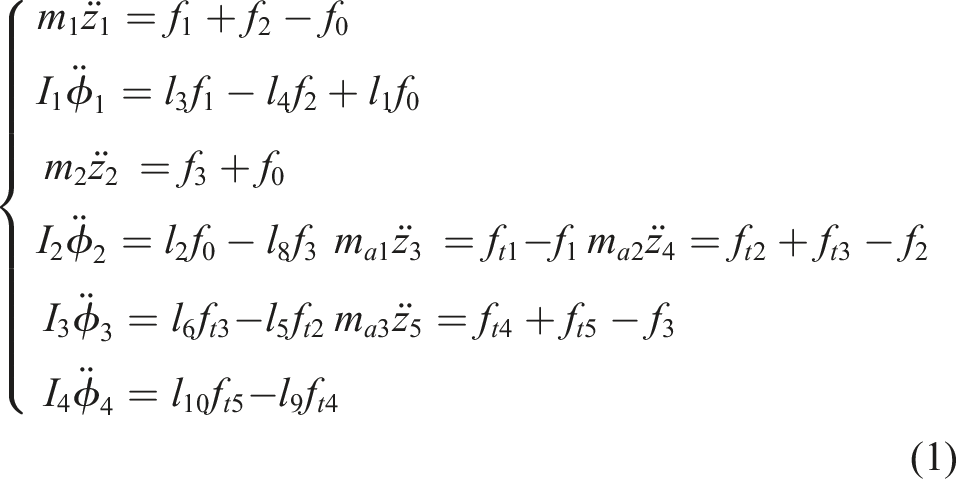
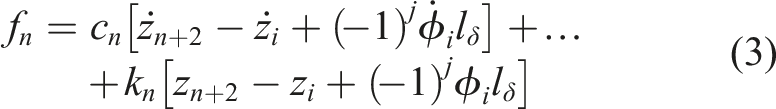
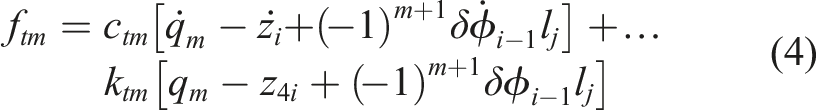
In the existing studies, equation (1) is mainly applied to study the comfort quality of HV in TG.4,5,12,15,19 However, equation (1) can not assess HV’s vibrations in F. Therefore, equation (1) is converted from TG to FG via a Laplace-transfer-function to assess HV’s vibrations in FG.
Calculation model in the frequency region
The vibrations of HV in TG depend on the excitation frequency f.8,22,25,26 But the influence of f on the vibrations of HV can not be reflected in TG. Thus, to assess the influence of f on vibrations of HV, a variable s of FG transformed from TG via an unknown-transfer-function (s = d/dt) is used to convert equation (1) from TG to FG. The variable of s = d/dt in TG is then defined by the variable of s = iω = 2πf in FG to compute the transfer function in FG.
Based on the definition of Laplace-transfer-function, with the function of y being continuous in TG, the image function Y of y could be described by: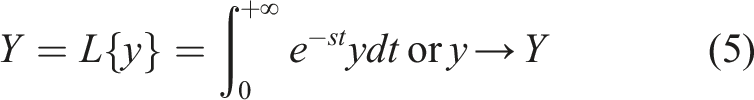
Based on the theory of original-functions,30,31 the derivatives of y are also original-functions. Thus, they could be described by: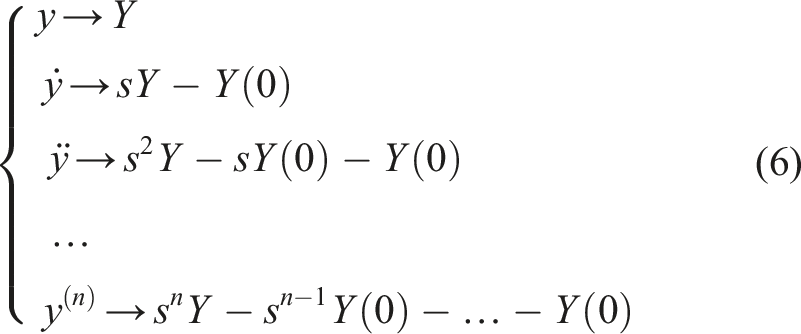
At the initial time of the HV moving, the value of Y(0) is zero. Thus, displacement, velocity, and acceleration variables of HV in equation (1) could be written via equation (6) as follows: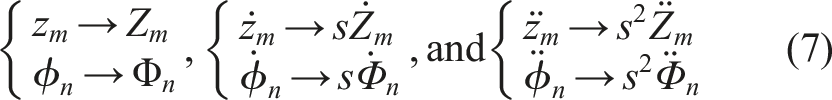
In addition, the road’s height and velocity variables in equation (4) are also written as follows:
By replacing the variables in equations (7) and (8) into equation (1), HV’s vibration equations described in FG have been written as:


By replacing F0, F
n
, and F
tm
of equations (10)−(12) into equation (9) and transforming equation (9), HV’s vibration equations in FG is written by a matrix form as:
By dividing equation (13) by Q1, its equation has been rewritten as follows:
The vector {T} is defined as the transfer function from Q1 of the road to the tractor driver, semi trailer, and axles. Due to the dynamic parameters of [A] in equation (14) being determined from HV’s parameters in Table 1, therefore, each transfer function in vector {T} could be calculated as follows: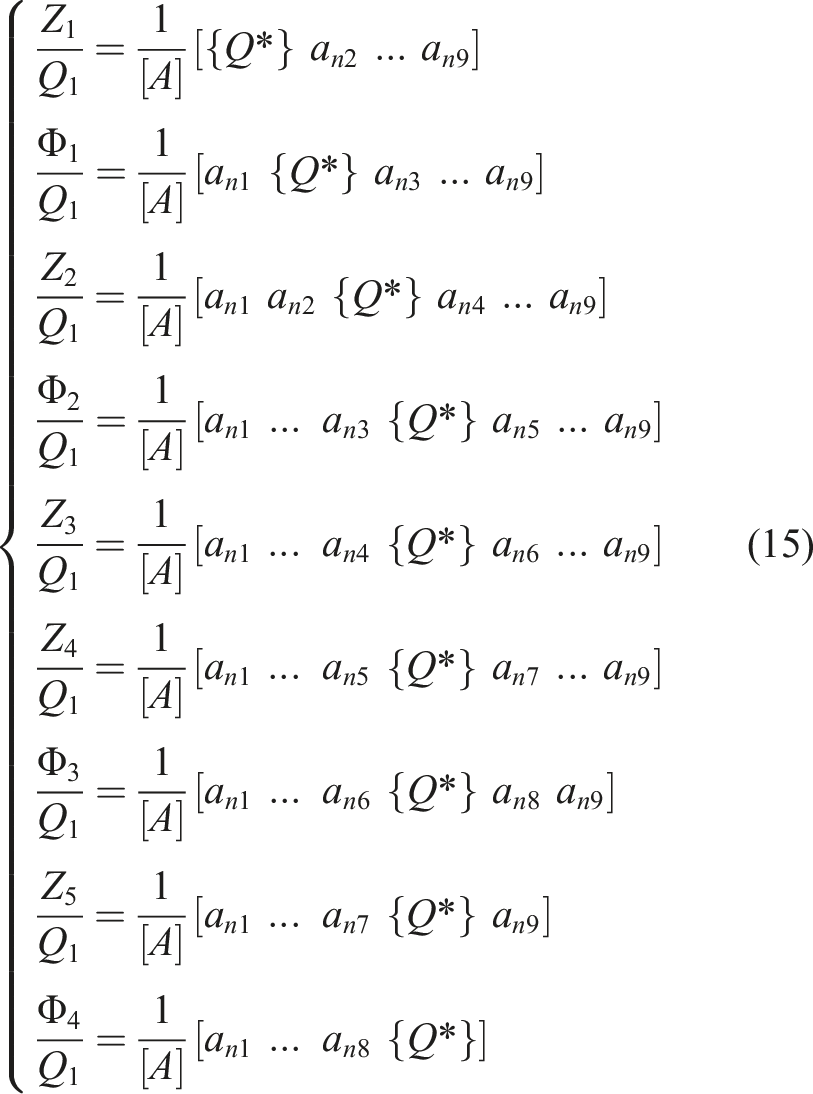
The calculation value in each transfer function of vector {T} is obtained by the complex equation as follows:
30

Based on the complex equation of each transfer function in equation (16), the response of acceleration-frequency between Q1 of the road surface and variables of Z1, Φ1, Z2, Φ2, Z3, Z4, Φ3, Z5, and Φ4 has been calculated as follows:31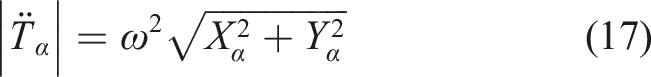
The vibration characteristic of HV in FG has been assessed based on the calculation results of HV in equation (17).
Excitation source and evaluation index
Excitation of the road surface
The harmonic waveform of the road with a shorter wavelength of S and amplitude of q0 from 10 to 12 mm mainly causes resonance vibrations of the vehicle suspension systems. It greatly affects the ride comfort of the vehicle as well as the structural strength of the suspension systems.12,26,31 Therefore, the harmonic function is often chosen as the excitation function when studying the optimization or control of vehicle suspension systems to improve ride comfort.4,5,32 In addition to harmonic excitation, other excitations such as bumpy excitation and random excitation can also appear on the road surface, especially the random excitation of the road surface.21,25,32 This random excitation is mainly used to study the ride comfort of the vehicle in TG. However, this study focuses on analyzing the vibration characteristics of the HV under all different working conditions, so the excitation of the harmonic function q1 in TG is easily transferred to FG to calculate each transfer function of vector {T}. Thus, the harmonic excitation of the road is chosen to study HV’s vibration in FG. The harmonic excitation of the road is defined by q = q0sinωt. When HV moves at a velocity of v0 on the road with wavelength S of q, the ω could be determined by ω = 2πv0/S. Thus, the road’s harmonic excitation could be described by: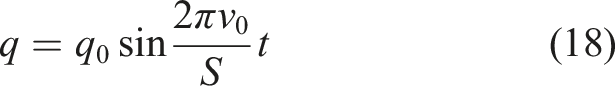
From equation (18), the road’s harmonic excitations at the HV’s wheels could be written as follows: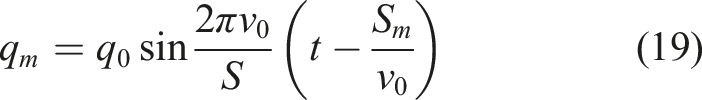
Based on the Laplace transformation of the harmonic functions, the ratios of Q
m
/Q1 in equation (14) can be calculated from the ratios of q
m
/q1 as follows: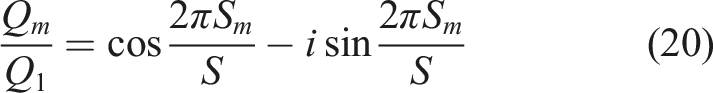
Equation (20) has been applied as input excitations for simulating HV’s vibrations in FG.
Evaluation index of HV’s vibration
In the study of vehicle vibration, the vehicle acceleration response in TG was mainly applied to evaluate the comfortable performance of all vehicles.4,5,15,19,20,29 Under the road excitation with the frequencies changed from 0.5 to 10 Hz, the HV’s vibration is greatly affected. However, it is difficult to evaluate the influence of them in TG. Therefore, to assess the ride comfort of HV in FG, the transfer functions of the vertical and pitching accelerations of the tractor driver in equation (17) are used as indices to evaluate the vibration efficiency of HV in FG. Under the same excitation q1 of the road, the transfer function of the acceleration-frequency amplitude is smaller, which means the vibration efficiency of HV is better.
Computation results and discussions
Based on the excitation of the road surface in equation (20) and HV’s lumped parameters in Table 1, a computational program in the complex number domain written in the MATLAB environment is then applied to calculate the acceleration transfer functions of the HV model under different working conditions.
HV’s vibration under influence of road surface wavelengths
In order to assess the influence of the road’s wavelength on HV’s vibration, different values of road’s wavelengths, including S = 10 m, 15 m, 20 m, 25 m, and 30 m with q0 = 10 mm are simulated at v0 = 70 km/h. The transfer function of the tractor driver’s acceleration frequency in the vertical and pitching directions is plotted in Figure 2(a) and 2(b). Transfer function of tractor driver’s acceleration frequency under the influence of road’s wavelengths: (a) in vertical direction, (b) in pitching direction, and (c) the average vaue of the acceleration frequency.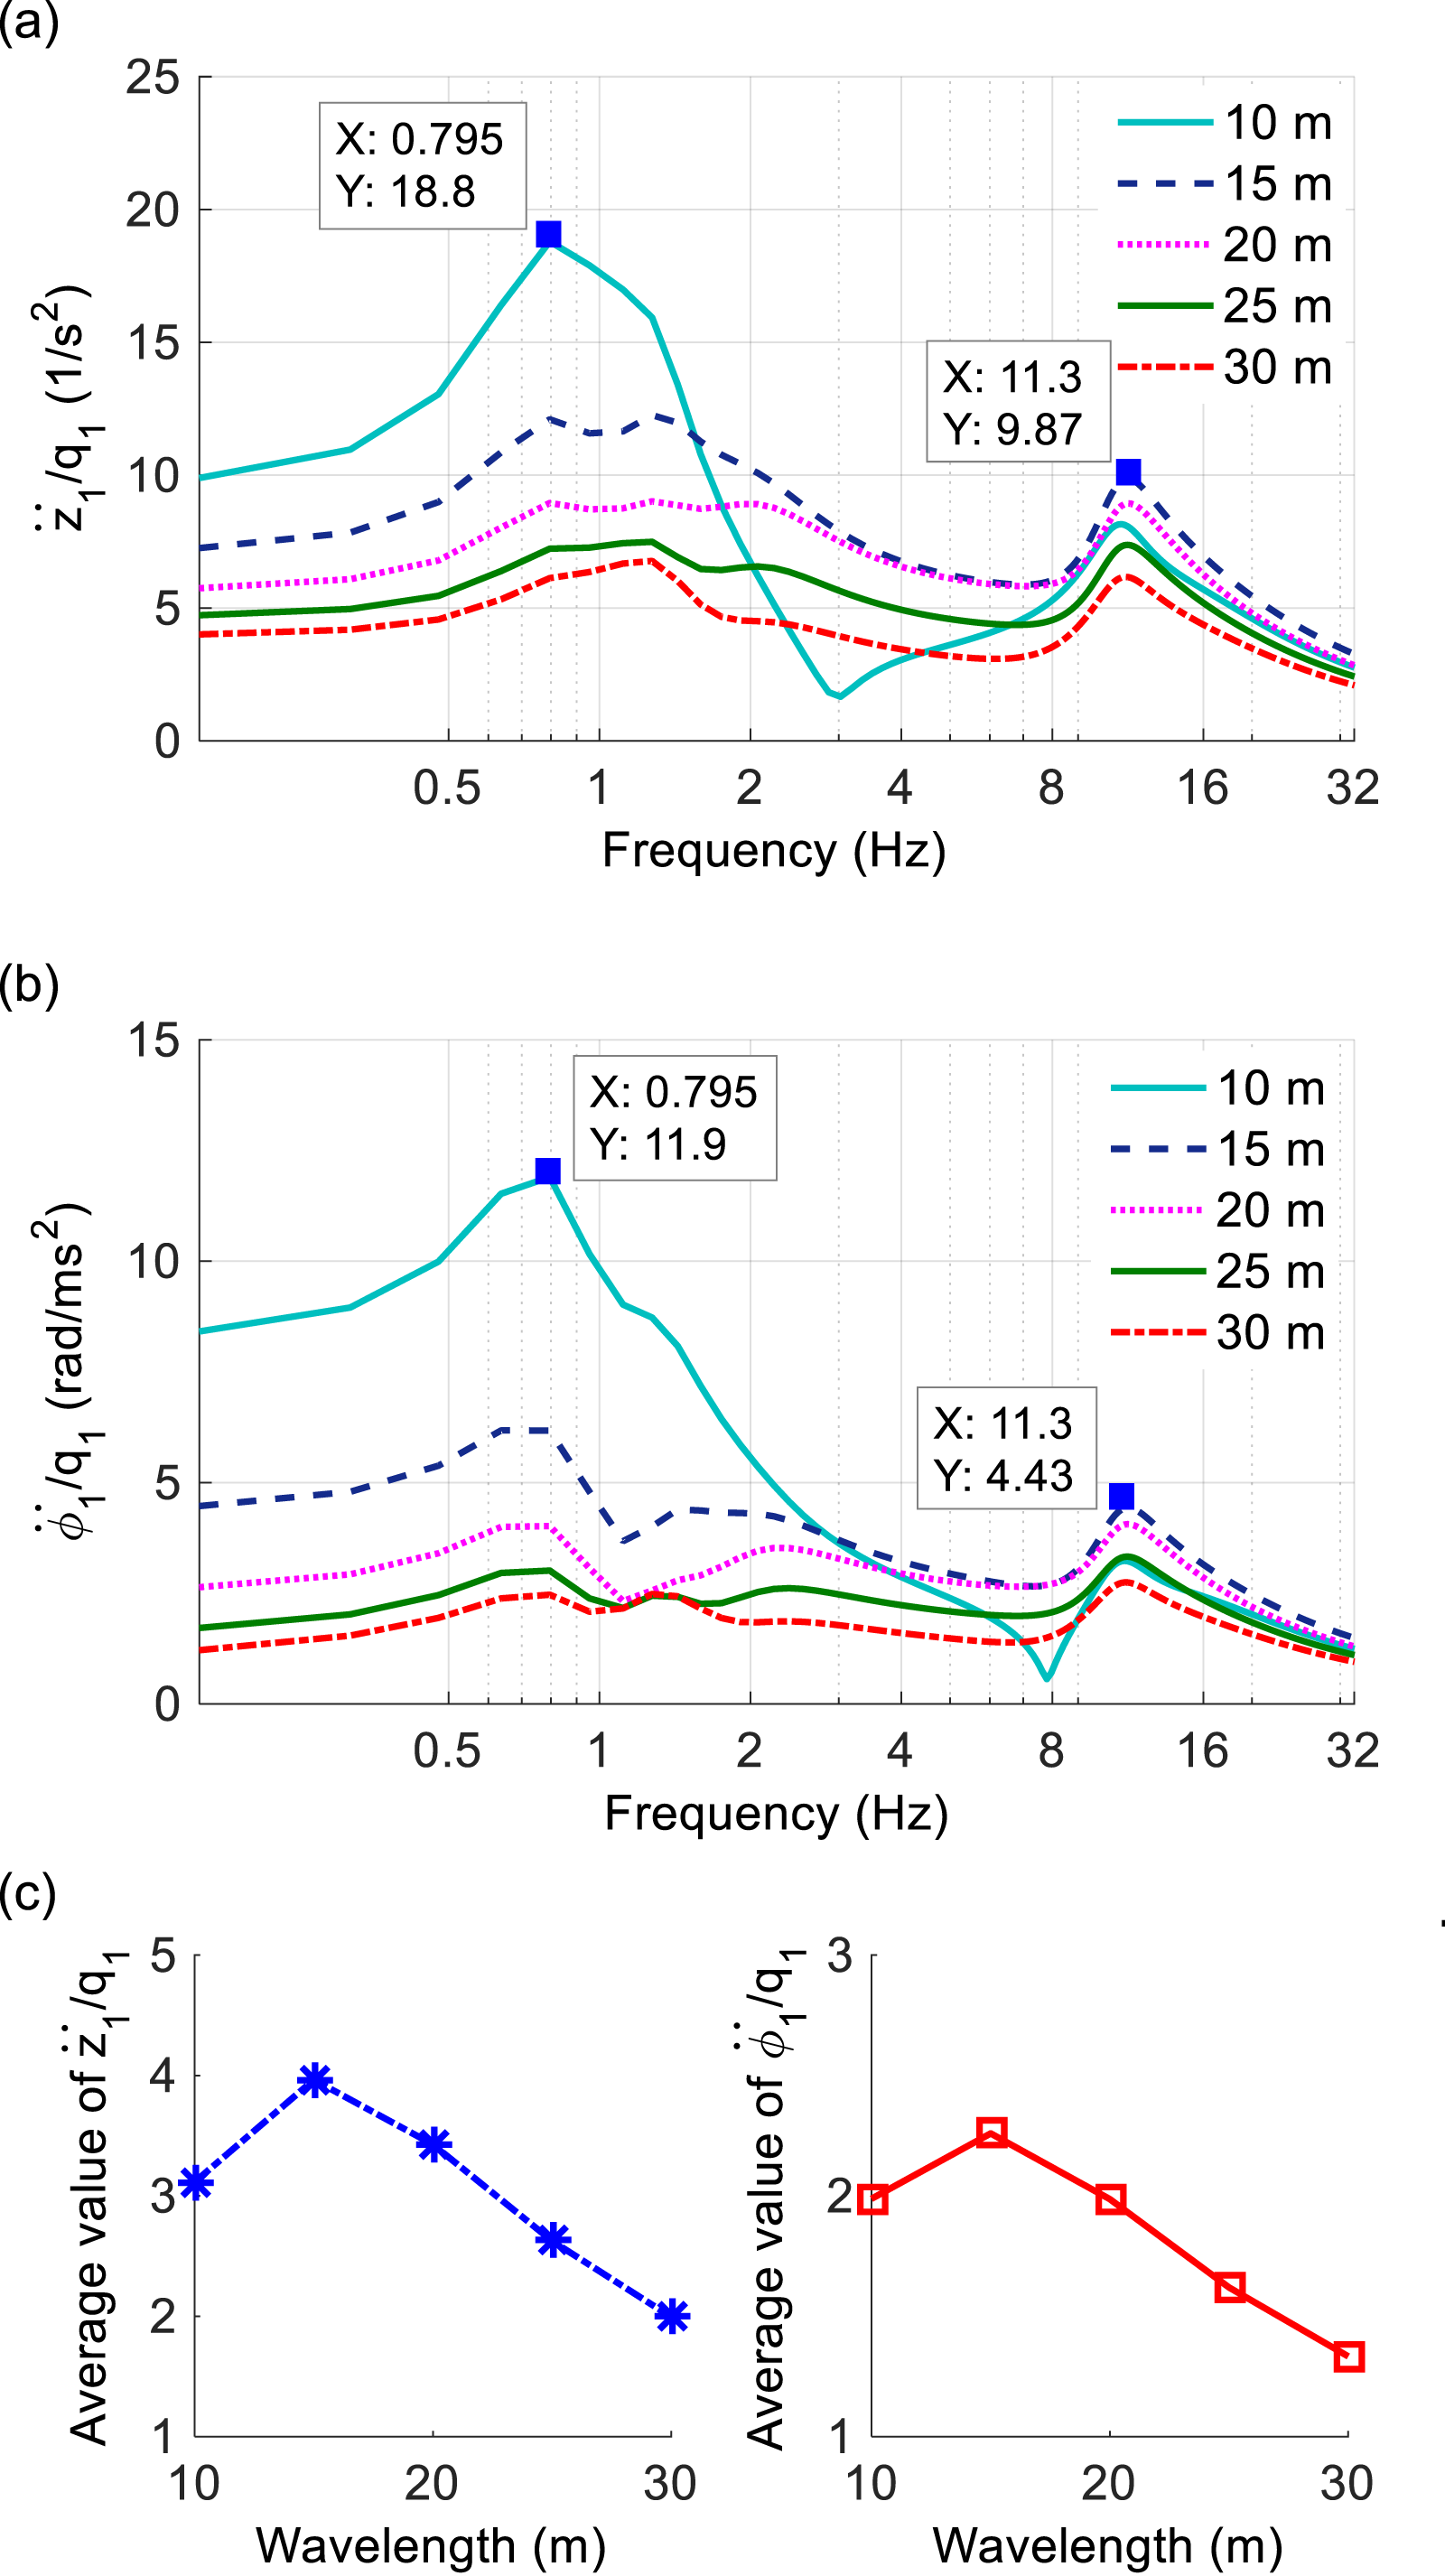
Under the change of road’s wavelength, Figure 2(a) and 2(b) indicate that the acceleration resonance peaks of the tractor driver at low and high frequencies appear at f1 = 0.795 Hz and f2 = 11.3 Hz. This is due to the effect of the two masses of the vehicle body and axles. These appearance resonance peaks are due to the natural frequency of the suspension systems coinciding with the vibration frequency of the road surface or HV. These resonance frequencies hardly change because the natural frequency of the vehicle suspension system does not change, and these resonant frequencies are also independent of the change of the road’s wavelength.
However, changing of road’s wavelength greatly affects the resonance amplitude of the transfer function. When the road’s wavelength is reduced, the resonance amplitudes of the acceleration frequency in the vertical and pitching directions of the tractor driver are strongly increased and vice versa. ISO standard 25 indicated that the health and comfort of the driver were greatly affected by the excitation frequencies from 0.5 to 10 Hz, especially in the low frequency region from 0.5 to 4.0 Hz. Thus, at this low frequency, the tractor truck’s ride comfort is strongly reduced when the road’s wavelength is reduced. The calculation result of the aaverage values of the acceleration frequency in both the veritcal and pitching directions in Figure 2(c) indicates that when road’s wavelength is increased from 15 m to 30 m, the average values of the acceleration frequency in both the veritcal and pitching directions are strongly reduced, expecially at S >25 m. Therefore, to ameliorate tractor the driver ride comfort, the road’s wavelength should be designed by S >25 m to increase the smoothness of the road surface.
HV’s vibration under influence of traveling velocities
The moving velocity of HV greatly affected the ride comfort in TG.4,5,20,21 However, this issue has not been evaluated in FG. Therefore, under the simulation condition of the road with S = 10 m and q0 = 10 mm, a velocity range of v0 from 50 km/h to 90 km/h has been used to compute the results. The transfer function of the tractor driver’s acceleration frequency in the vertical and pitching directions is presented in Figure 3(a) and 3(b). Transfer function of tractor driver’s acceleration frequency under the influence of velocities: (a) in vertical direction, (b) in pitching direction, and (c) the average vaue of the acceleration frequency.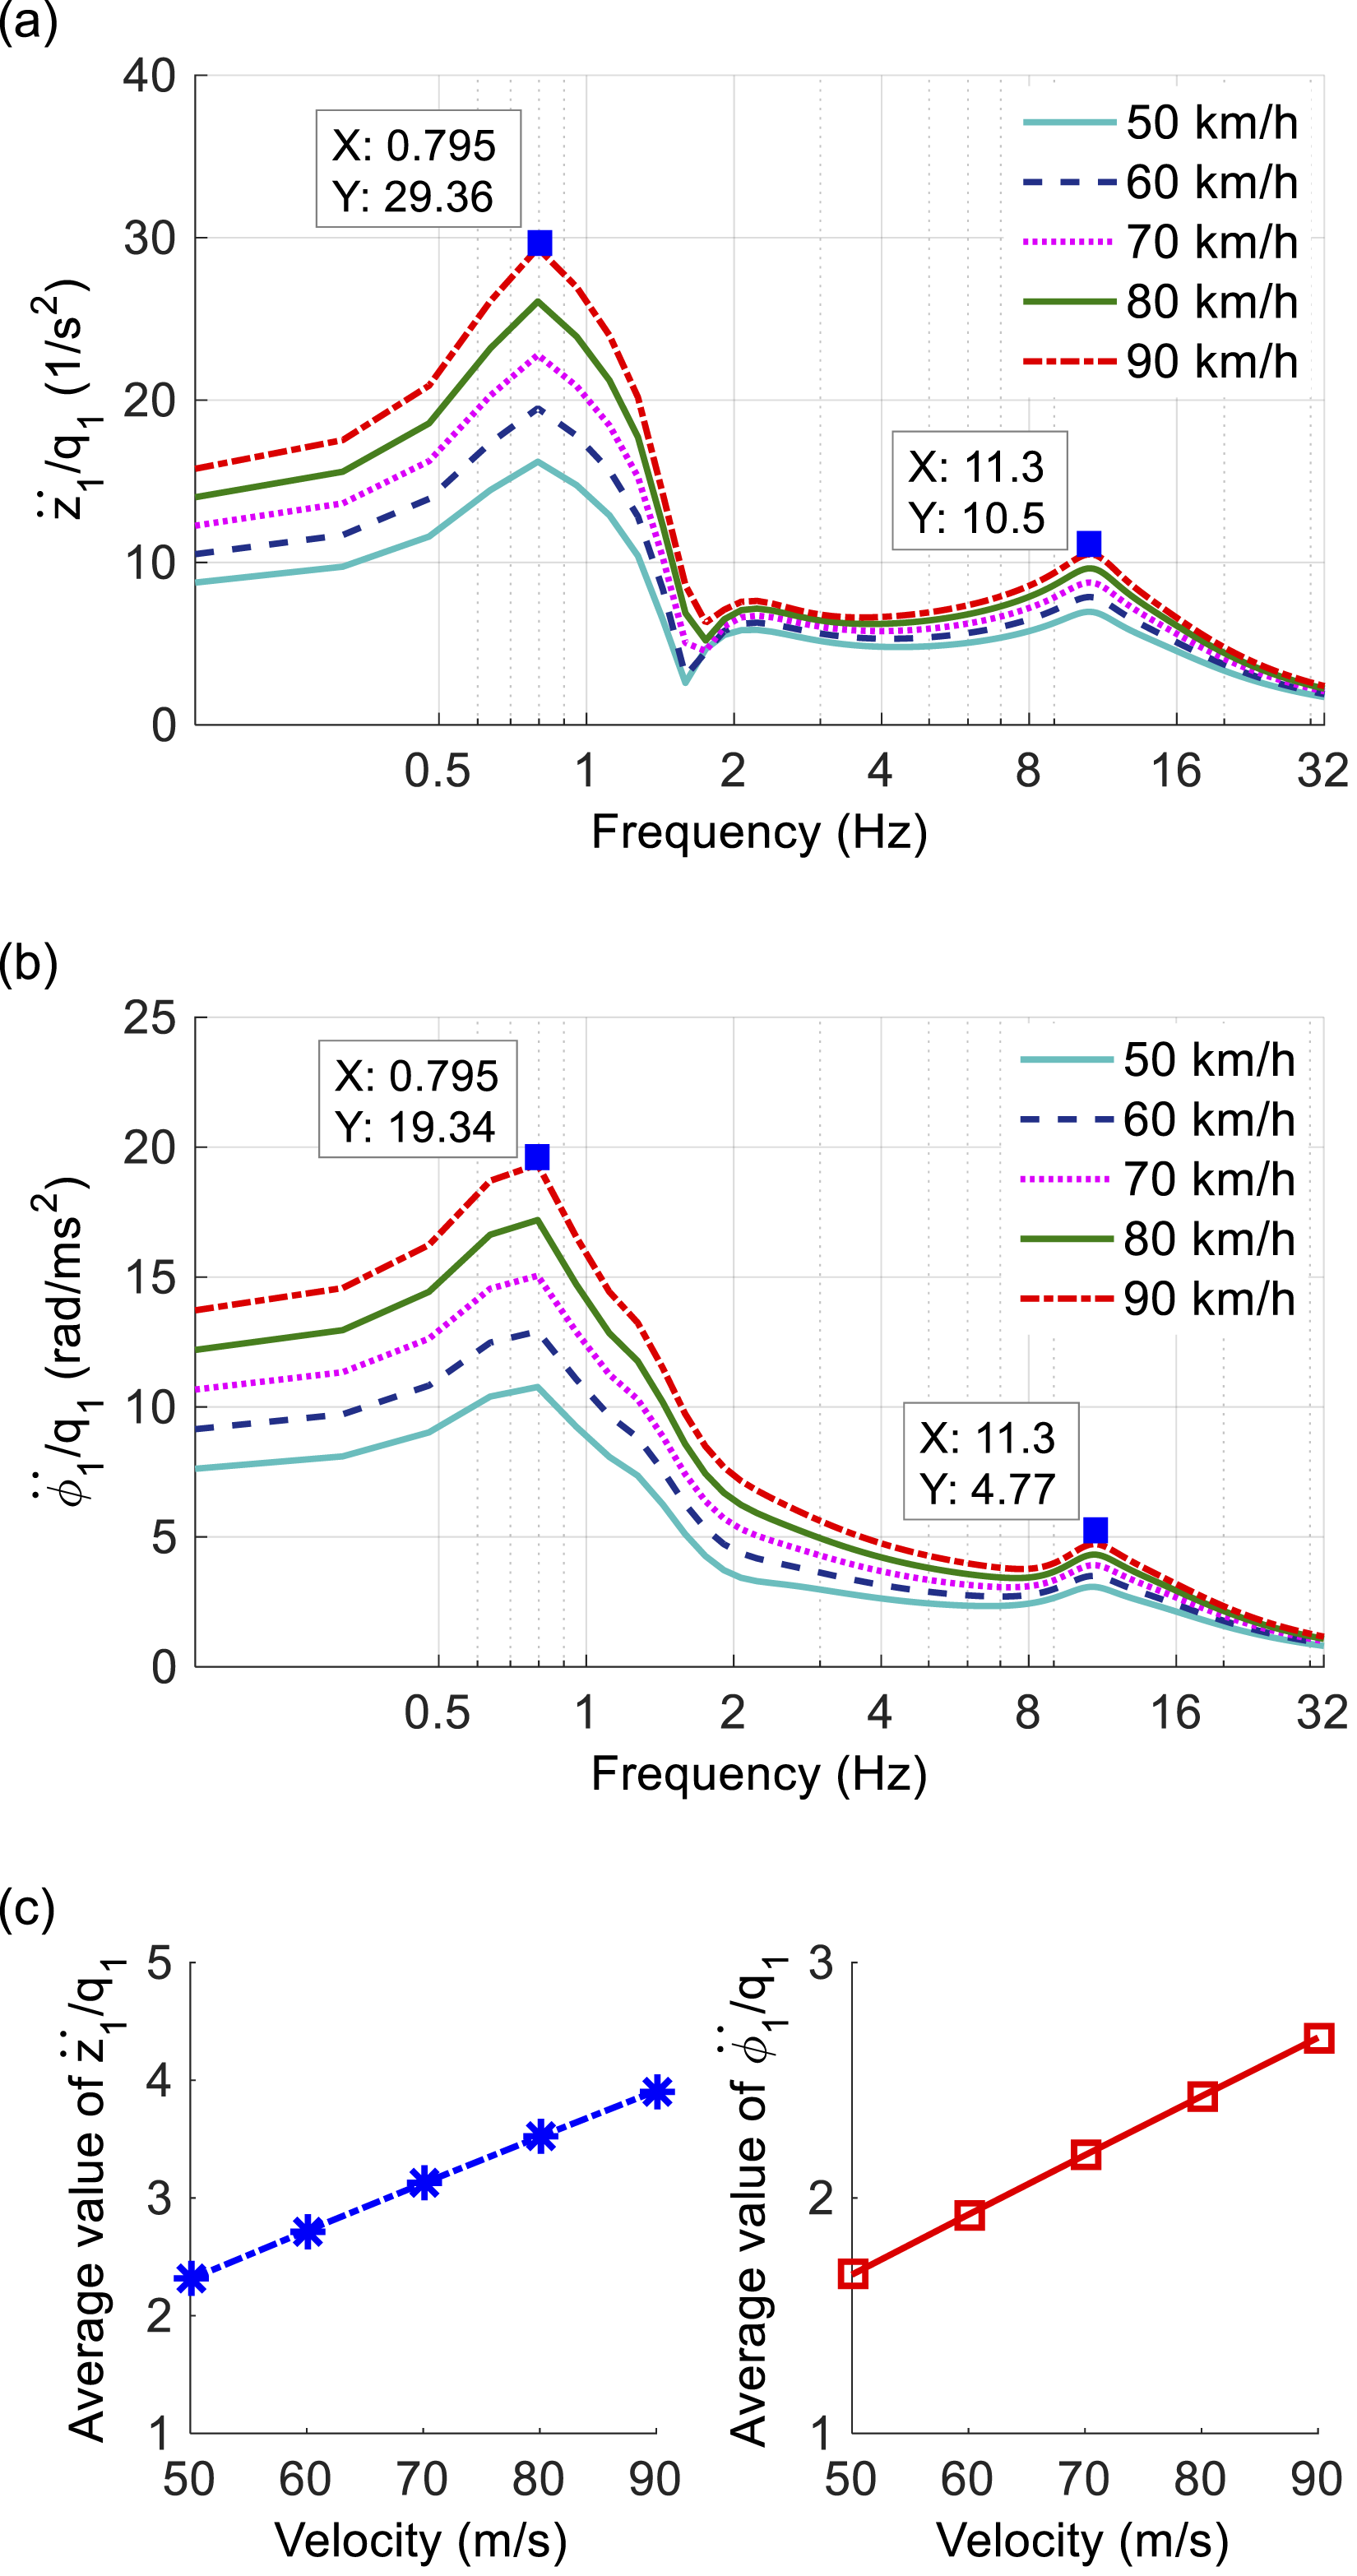
Figure 3(a) and 3(b) indicate that the resonance amplitude of the transfer functions is strongly affected by the change of HV’s moving velocities; meanwhile, the resonance peaks are not affected by the vehicle’s moving velocity. The amplitude values of the tractor driver’s acceleration frequency in the vertical and pitching directions are strongly increased with the increase of HV’s moving velocities and vice versa. This can be the reason why the vehicle’s ride comfort is reduced when the vehicle is moving at high velocity. Besides, the computation results in Figure 3(c) also show that the aaverage values of the acceleration frequency in both the vertical and pitching directions are strongly increased with the increase of HV’s moving velocity, especially at v0 > 70 m. To ensure ride comfort and safe movement of the HV, its moving velocity should be limited to 60 km/h.
HV’s vibration under influence of load conditions
The change in vehicle load not only affects the ride comfort but also negatively impacts the road friendliness and durability of the suspension system structure.1–4 Therefore, under the same simulation condition of the road with S = 10 m, q0 = 10 mm, and v0 = 70 km/h, the four change cases of semi trailer’s loads including the empty-load (EL), half-load (HL), full-load (FL), and over-load (OL) are computed, respectively. The transfer function of the tractor driver’s acceleration frequency in the vertical and pitching directions is presented in Figure 4(a) and 4(b). Transfer function of tractor driver’s acceleration frequency under the influence of load conditions: (a) in vertical direction, (b) in pitching direction, and (c) the average vaue of the acceleration frequency.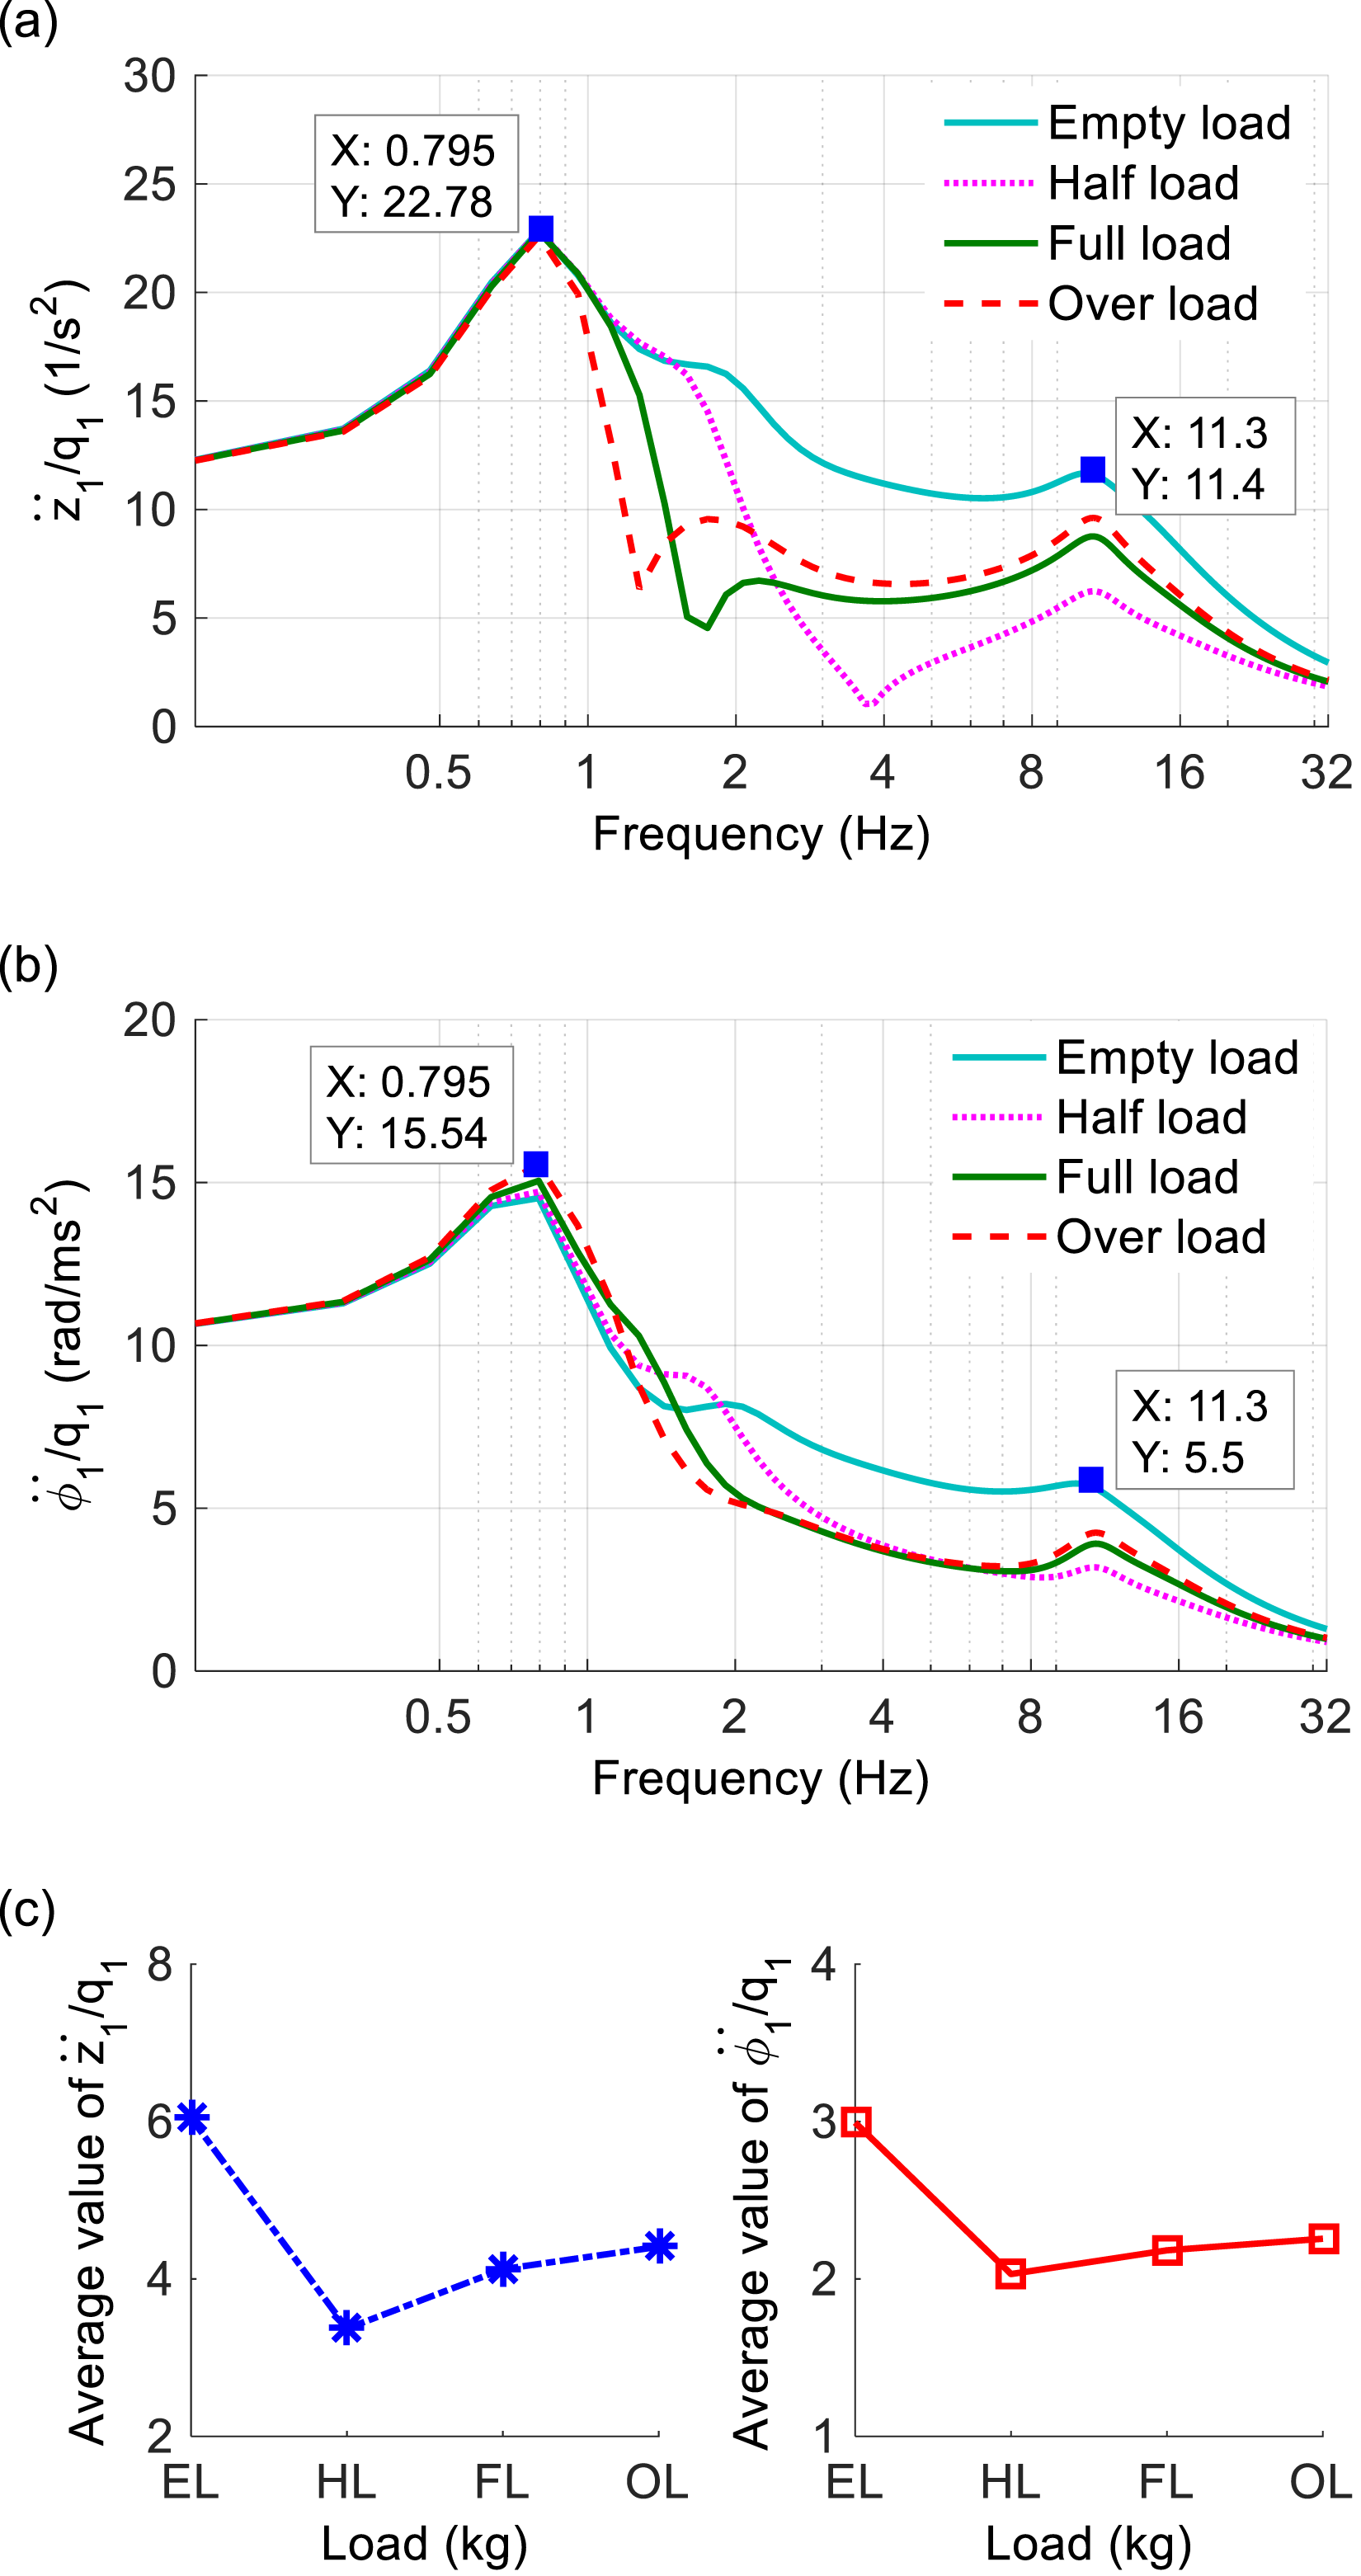
The change of the load in the semi trailer also affects HV’s acceleration frequency. Figure 4(a) and 4(b) show that in both cases of the EL and OL of the semi trailer, the amplitude of the acceleration frequency of the tractor driver in the vertical and pitching directions is higher than that of both cases of the HL and FL. The computation results in Figure 4(c) also show that the aaverage values of the acceleration frequency in both the vertical and pitching directions with the HL and FL are the smallest. Thus, the load modes of the HL and FL should be used to ameliorate the tractor driver’s ride comfort. Based on the analysis result in Figure 4(a)–4(c), we can see that the case of the EL of the semi trailer should be limited while the case of the HL and FL should be used to improve both the tractor driver’s ride comfort.
HV’s vibration under influence of stiffness in suspension system
The vehicle suspension systems have the function of absorbing the vibration energy excited from the road surface to reduce the vibration transmitted to the vehicle’s body. In some cases, the suspension system’s vibration resonance occurs because the natural frequency of the suspension system coincides with the excitation frequency of the road surface. As a result, the vibration of the vehicle’s body increases greatly, and the suspension system can be damaged due to its deformation exceeding the allowable limit. Due to the natural frequency of the suspension system depending on its stiffness value, thus, under the same simulation condition of the road with S = 10 m, q0 = 10 mm, and v0 = 70 km/h, and semi trailer’s FL, the stiffness values in HV’s suspension system changed by {0.6 K, 1.0 K, 1.2 K, 1.4 K} with K = [k1, k2, k3] are then simulated to evaluate the influence of the suspension stiffness on HV’s vibrations. The transfer function of the tractor driver’s acceleration frequency in the vertical and pitching directions is shown in Figure 5(a) and (b). Besides, the computation result of the aaverage values of the acceleration frequency in both the vertical and pitching directions is also plotted in Figure 5(c). Transfer function of tractor driver’s acceleration frequency under the influence of stiffness: (a) in vertical direction, (b) in pitching direction, and (c) the average vaue of the acceleration frequency.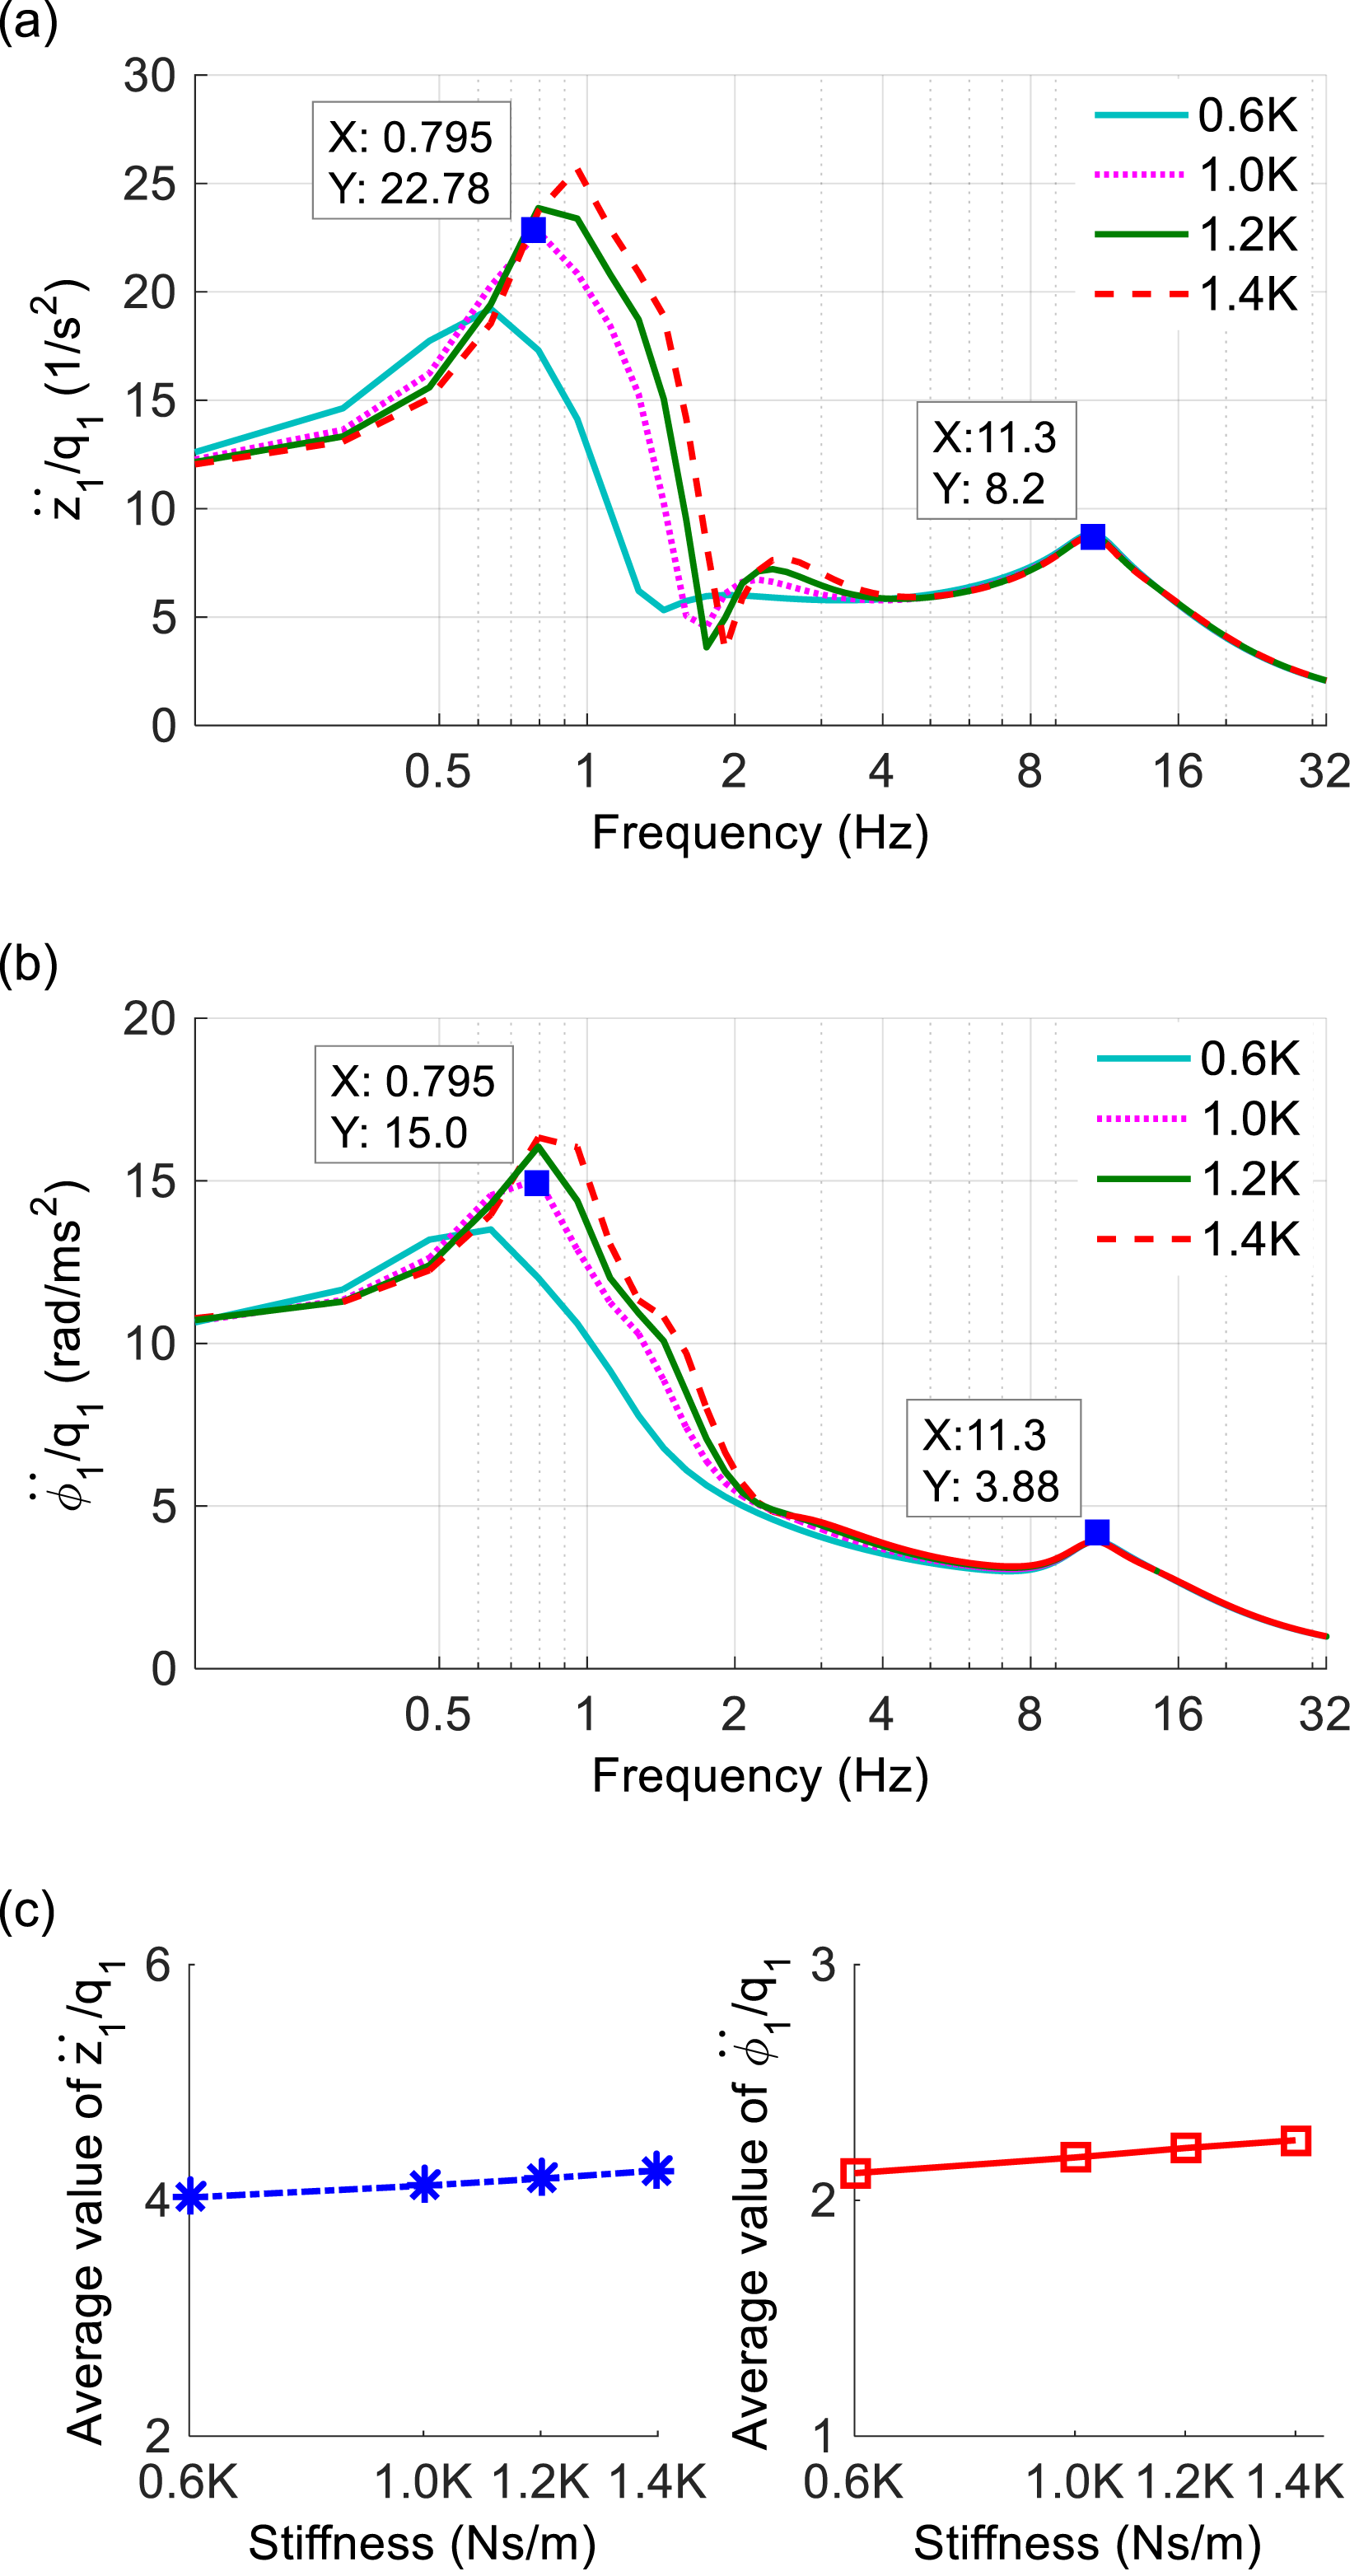
Figure 5 shows that the resonance peaks in the low frequency region are significantly affected by changes in suspension stiffness. When the suspension stiffness increases, both the resonance frequency and amplitude of the acceleration frequency of the tractor driver in the vertical and pitching directions also increase and vice versa. This is due to the natural frequency of the suspension system depending on the stiffness coefficient. Thus, the reduction of the suspension stiffness can improve the ride comfort of the HV, especially with 0.6 K. However, the reduction of the suspension stiffness can lead to reduced directional stability and increased lateral vehicle vibration. To solve this issue, the air suspension system has been studied and applied to the HV.4,5,9,12 As opposed to the low frequency range, both the resonance frequency and acceleration-frequency amplitude of the tractor driver at the high frequency are insignificantly affected by the change of the stiffness coefficients of HV’s suspension system.
Conclusion
With the design parameters of the HV simulated in FG, the two resonant frequencies of HV have appeared at f1 = 0.795 Hz and f2 = 11.3 Hz. These two frequencies are not affected under different operating conditions of HV.
In the design of HV and road surface, to improve the ride comfort of HV, the road’s wavelength should be designed by S >25 m. Besides, with HV’s suspension system, the stiffness coefficients should be reduced by 0.6 K to improve the ride comfort of the tractor driver.
Under the operation conditions of HV, the moving velocity below 60 km/h and two load cases of HL and FL should be maintained to optimize the ride comfort of HV.
This study has added a new method to evaluate the vibration of the vehicles in FG, in addition to the traditional evaluation methods in TG. The research results contribute to clarifying the influence of parameters on the vibration characteristics of the vehicles in more detail, thereby providing optimal design methods for both the vehicle and road surface to improve the working efficiency of vehicles.
Footnotes
Acknowledgments
The work described in this paper was supported by Thai Nguyen University of Technology (TNUT), Thai Nguyen, Vietnam.
Declaration of conflicting interests
The authors declared no potential conflicts of interest with respect to the research, authorship, and/or publication of this article.
Funding
The authors received financial support for the research, authorship, and/or publication of this article. The work described in this paper was supported by Thai Nguyen University of Technology (TNUT), Thai Nguyen, Vietnam.
Appendix
The coefficients in maxtrix [A]
The coefficients in vector {Q}