
Abstract
This paper proposed an optimized fast-charging approach to the application of electric vehicles (EVs) with the help of a Crested Porcupine Optimization (CPO) based Tilted Proportional-Integral-Derivative (T-PID) controller and a Z-source isolated full-bridge bidirectional DC-DC converter. The proposed system is aimed at attaining a fast charge of EVs and, at the same time, ensuring the enhanced quality of power and battery health. An intelligent energy management system is coordinated to direct power flow among storage batteries, solar photovoltaic sources, the utility grid and the EV battery. The CPO algorithm optimally tunes the T-PID controller parameters to reduce charging time and harmonic distortion. The simulation findings in MATLAB/Simulink show that the proposed technique can be able to attain faster charging with a total harmonic distortion of about 1.7%, which is a significant improvement compared to the existing controllers. The findings indicate that the developed CPO-T-PID-controlled converter could be useful and efficient in grid-integrated EV fast-charging.
Keywords
Introduction
Internal combustion engine (ICE) based vehicles are being replaced with EVs due to their superior fuel economy and performance, even though ICEs have been a well-established technology for the past century.1,2 Strict laws addressing global warming and energy resource shortages, as well as efforts to lower the cost of fossil fuels and petrol emissions, have raised interest in EVs as a potential replacement for ICEs. 3 EVs offer a promising solution by significantly reducing greenhouse gas emissions and fossil fuel dependence. The problem with the adoption of EVs is battery performance, which directly affects the vehicle’s range. 4 Battery performance may appear to be influenced solely by battery technology, but usage and charging procedures also have a big influence. From this perspective, battery performance is greatly impacted by the battery charger’s effectiveness. 5
Fast charging technologies might drastically cut down on charging periods, increasing EV comfort and performance on par with refueling traditional vehicles.6,7 Fast charging stations can offer high-power charging capabilities by utilizing developments in power electronics and renewable energy technologies, allowing EVs to efficiently and rapidly recharge their batteries. 8 Despite significant advancements in EV technology, battery charging using power electronics converter topologies still poses certain risks. These risks include thermal management challenges, overvoltage conditions, electromagnetic interference, and potential failures in power converters. 9 Future advancements heavily rely on high-performing battery charging converters. Different battery voltages and power sources are the primary cause of charger design difficulties. While charging electric vehicles, the chargers must follow certain regulations for their safety. 10 To satisfy the needs of EV charging, there are several converter topologies, including isolated and non-isolated, unidirectional, and bidirectional. 11
Some of the conventional battery charger topologies are illustrated as follows. The single-stage isolated AC-DC converter was used with the cascade connection of the snubber circuit, and the flyback converter 12 topology is designed as a matrix converter. Renewable energy-based excitation for an EV battery is made by multiport DC-DC converters. 13 A digital controller is used to control the power factor during battery charging to implement a three-channel interleaved power factor correction system. 14 Although the power factor was successfully adjusted using the modified bridgeless Landsman converter and bridgeless isolated single-ended primary inductance converter suggested in, 15 the circuit complexity and number of switches were increased. Iyer et al 16 suggested a soft-switched solid-state transformer approach for fast charging of EVs in charging stations. This design has a high range of loss and lower efficiency.
Related works
This section discusses some of the existing work on energy management in EV charging using various converter topologies and control mechanisms.
Rajasekaran et al 17 suggested a novel converter and control topology for EV battery applications. These approaches were combined for the system’s overall performance. The system was enhanced using a modified Single-Ended Primary-Inductor Converter (MSEPIC) and maximum power point tracking (MPPT)-based Non-dominated Sorting Genetic Algorithm II (NSGA-II). This reduces the effect of circuit parasites and improves load performance by increasing conversion rate accuracy and voltage gain due to the inductor in the system. The proposed system’s perfectly obtained constants reduced the DC rippling on the output side.
Turksoy et al 18 use a boost converter to rectify the power factor during AC to DC inversion in the battery-operated EV. A boost converter with an active snubber cell was used to achieve zero current/voltage transition, reducing switching losses. Additionally, a soft swing was enabled, resulting in a unity power factor even under both partial and full loads. Active snubber cells consist of one switch and a capacitor, two inductors, and three diodes, as opposed to eight diodes and two capacitors in the converter variation.
For electric vehicle charging stations, Gopalasami et al 19 suggested a new DC-DC converter. This setup utilizes two converters: a hybridization boost converter and a Super-lift Luo Converter (SLBC), both of which take solar PV and batteries as inputs. The suggested Dual-Input Dual-Output (DIDO) converter has various advantages due to the super-lifting of the input voltage, which enables the development of two voltage steps up: one from the boost converter and another from the Luo converter. Because of its simple design, the SLBC produces high voltage gain and efficient power without the need for extra transformers or an electrical circuit.
Szymanski et al 20 developed a unidirectional voltage converter to offer rapid recharge for battery-powered electric vehicles. The topology was developed using DC-AC-DC conversion, which means that the microgrid’s DC power was converted into AC using a Pulse Width Modulation (PWM) inverter and then back into DC by a rectifier. The 600 V DC microgrid powered the inverter. The inverter has six switches, and the rectifier has six diodes, which causes the system to fail.
According to Prem et al 21 a controller and a converter model can be utilized to reduce the delay in charging electric vehicles and the unstable flow of electricity over the grid. Initially, the grid is powered by solar energy and a battery bank. A T-source converter converts DC to DC. A T-source impedance network is used to measure the vehicle’s impedance. The technology enhances both voltage stability and power quality. To remove harmonic distortion from the model, the control model adopts a state space averaging technique.
Comparison of existing analyses of various authors.

To overcome these issues, this paper proposes a novel converter with an energy management strategy. The main objective of this paper is; • To correct the power factor during DC to DC inversion on the battery-operated EV, a Z-source isolated full-bridge bidirectional DC to DC converter is used. • To charge the EV in less time, a battery-operated EV is proposed for the tilted proportional integral derivative controller. • To reduce slow EV charging and stabilize the grid power flow, a converter and controller model based on the improved Crested Porcupine optimization algorithm was adopted.
Proposed methodology
The proposed methodology emphasizes optimizing power transfer, enhancing power quality, and ensuring robust control under various operating conditions. An intelligent energy management algorithm controls the system’s architecture, which combines an EV battery, a grid connection, a solar photovoltaic (PV) source, and specialized energy storage batteries. A converter with a Z-source isolated full-bridge bidirectional DC-DC converter is used for fast charging of the EV storage system from the microgrid. The T-PID has been optimized using the enhanced CPO algorithm to control the proposed converter. The controller will send a control pulse to the converter for the harmonic-free, quick charging operation. The solar PV source provides power to the converter, and the controller uses it to efficiently control harmonics. Figure 1 represents the structure of the proposed methodology. Structure of the proposed methodology.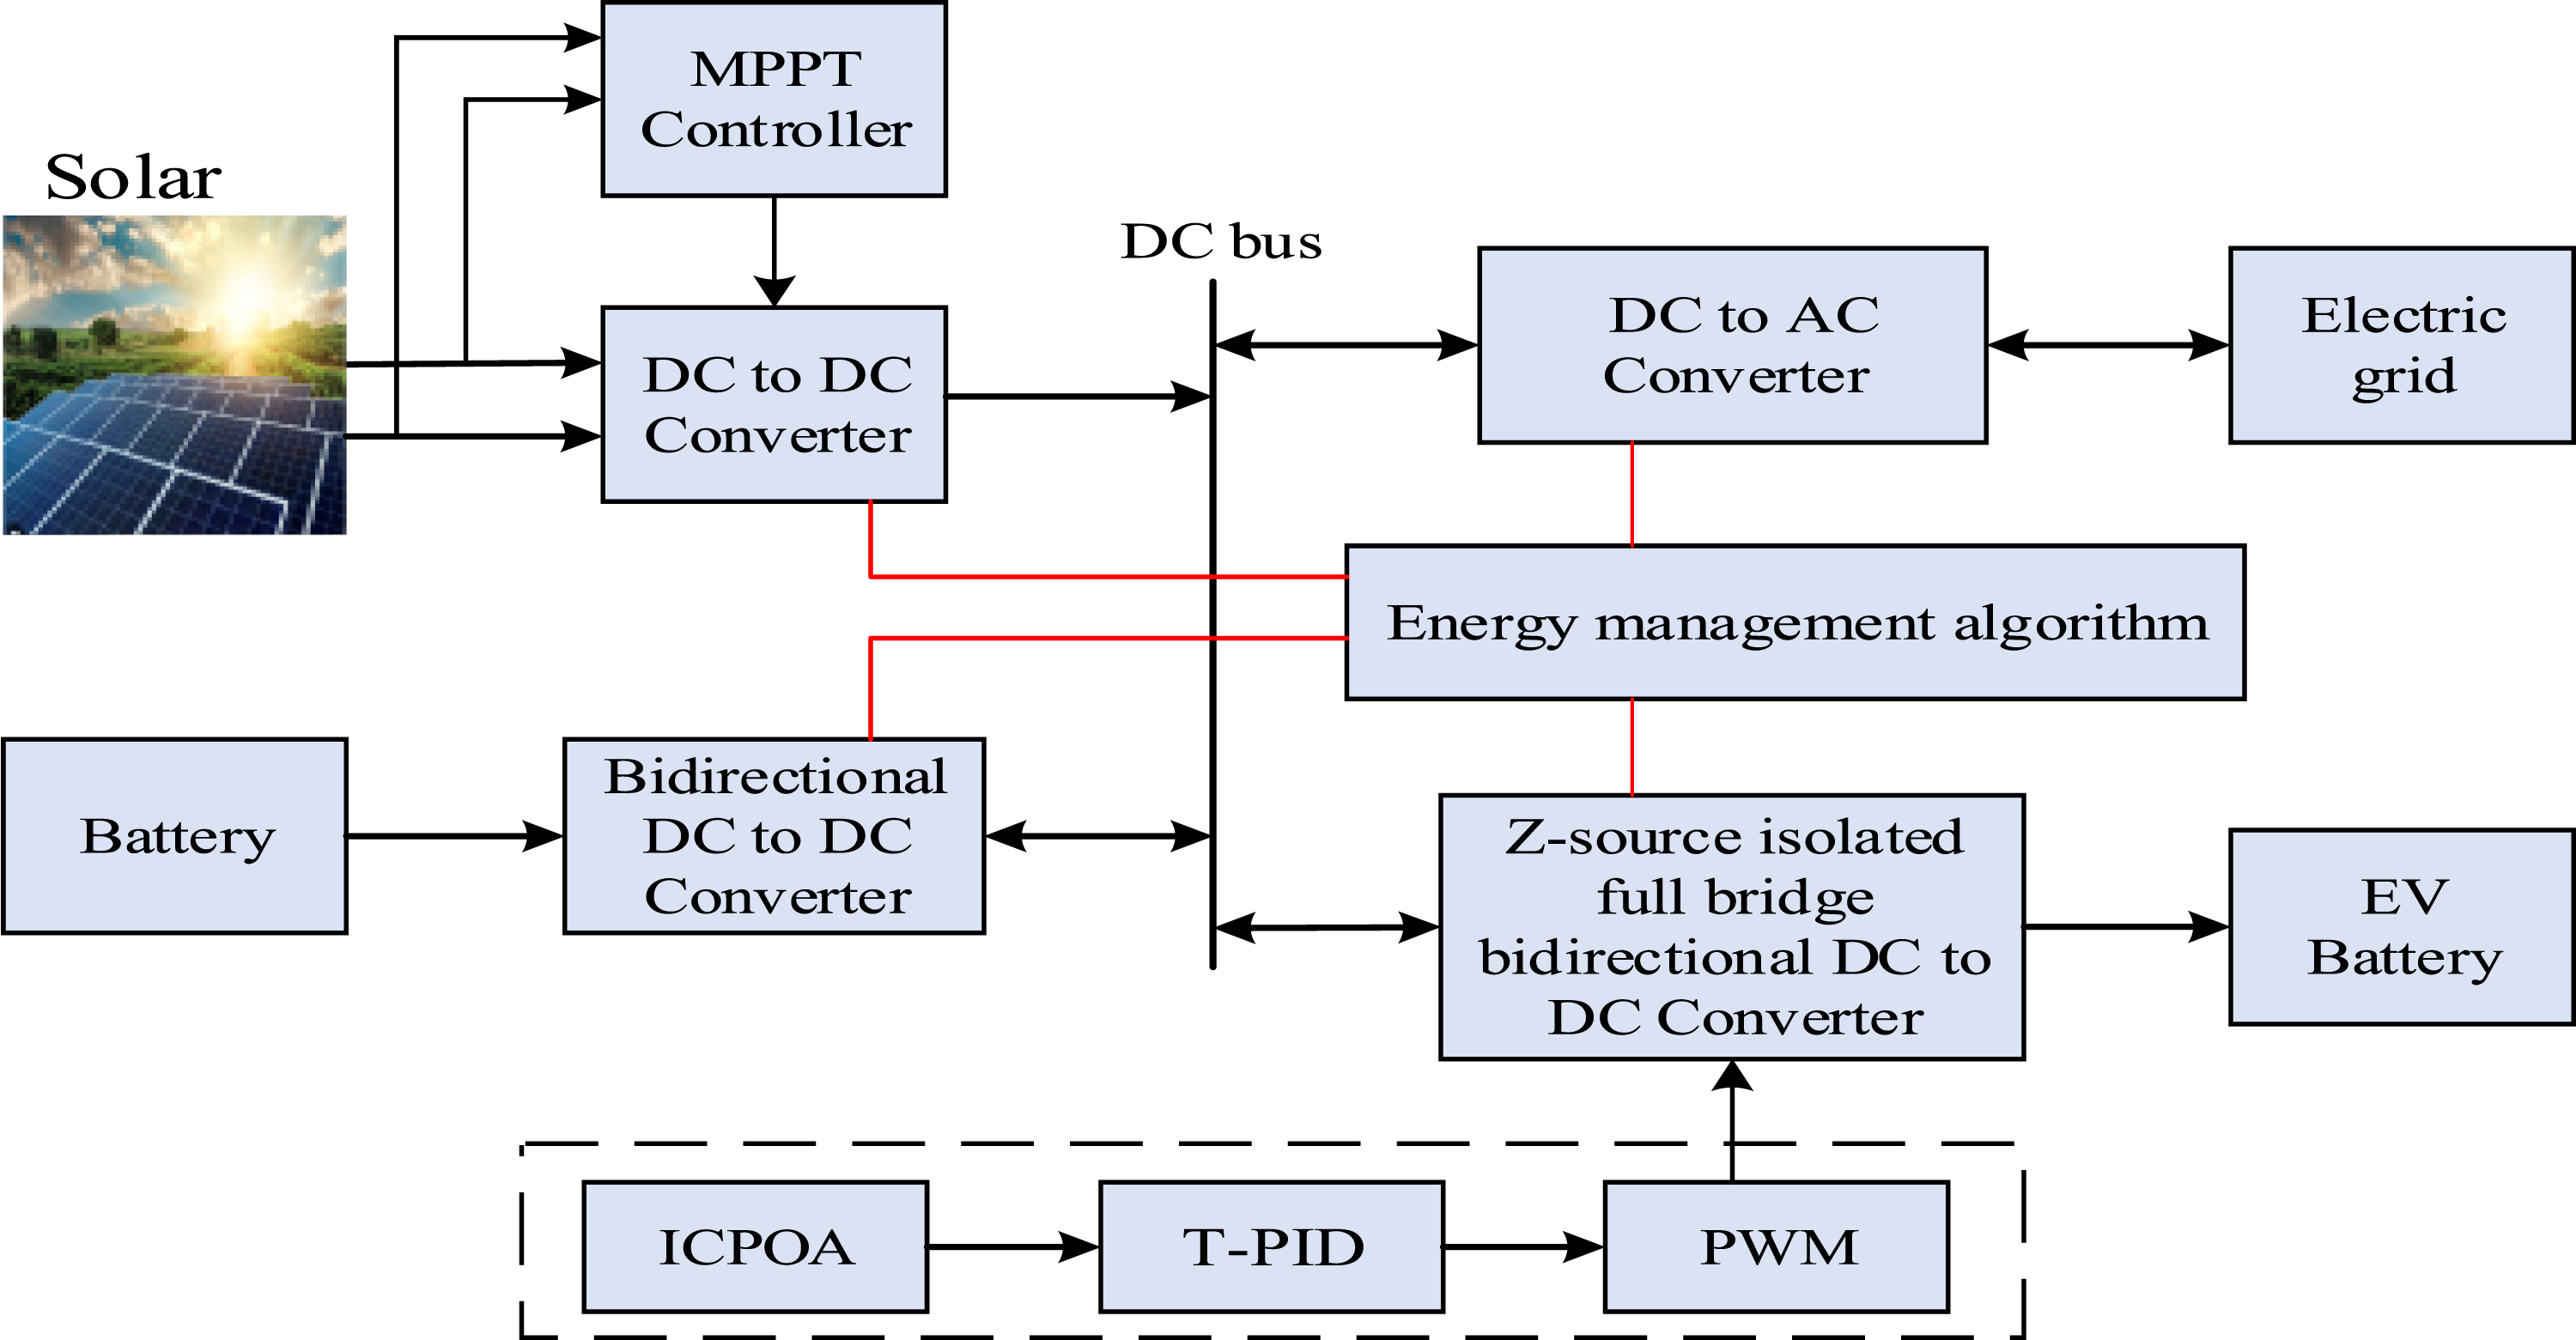
Solar modeling
A solar cell is a device that collects light energy from the sun. This light is absorbed by the photovoltaic panel, which then causes the electrons inside the module to get excited. In a perfect world, the diode and current source would be linked in parallel.
22
Due to the imperfect nature of the solar cells, the system employs a combination of shunt and series networks. The schematic of a photovoltaic panel is shown in Figure 2. The circuit model of a PV panel.
The equation provides the characteristic equation that controls a PV module’s output power. The cell current and the parallel resistance are maintained to balance the isolation current, which is given by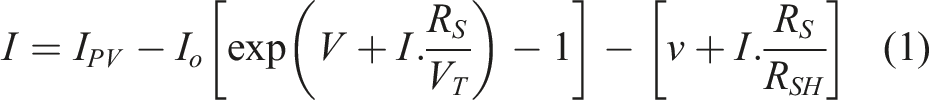
Batteries
In the proposed system, stationary energy storage batteries are utilized to manage power flow and ensure system stability. The energy generated by the PV panel is converted using a converter. The boost converter is utilized in the system to increase the converted energy source. 23 This increased energy is subsequently fed into the system’s available battery. The energy is then stored in the system. In modern times, the most commonly used batteries are lithium-ion batteries.
Electric grid
Energy in this grid system is provided via batteries or straight from the panel. Here, the system also makes use of an inverter. The DC-AC source is converted by the inverter before being supplied to the system. 24 The boost converter or the batteries provide the energy source for the inverters. The vehicle’s electrical system receives this AC power.
EV battery
The electric vehicle’s onboard battery constitutes the primary load for the fast-charging system. This section details the specific characteristics and modeling of this battery, which is typically a lithium-ion type, derived from the Trembley battery model. The output voltage 


Converter topology
The proposed converter is a Z-source isolated full-bridge bidirectional DC-DC converter (ZIBDC). The proposed topology makes use of a device with a high frequency. The system here makes use of two H-bridge Metal-Oxide-Semiconductor Field-Effect Transistors (MOSFETs) switching devices. To make it appear like a Z-source network, the capacitors are employed in a cross-directional manner. The symmetrical network has developed on both sides of the transformer; therefore, there is no low voltage side and no high voltage side. The Z-network allows the DC source to be either a voltage or current source. Figure 3 represents the circuit diagram for ZIBDC. Circuit diagram for ZIBDC.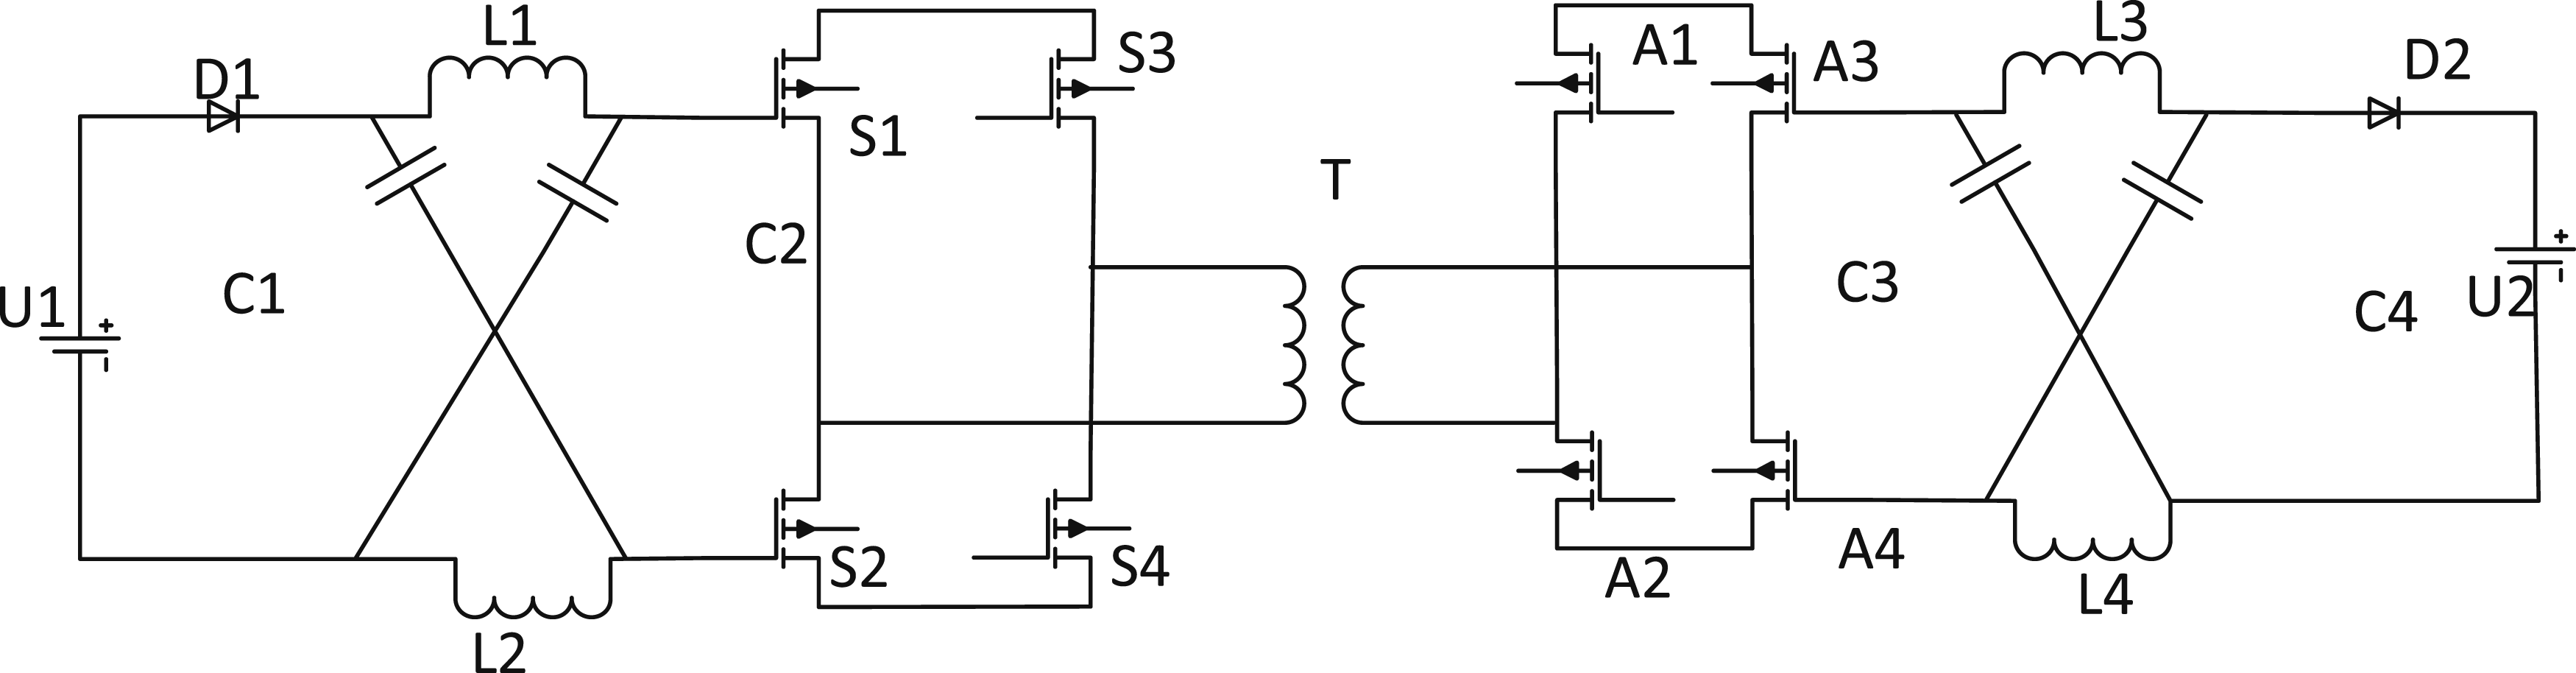
The device contains two parts, U1 and U2. The forward path is the flow of power from U1 to U2, while the reverse path is the flow of current from U2 to U1. Two inductors, L1 and L2, and two capacitors, C1 and C2, were pierced and then linked in an X form, which represents the Z-source network, according to the analysis of the U1 path. A diode is used to allow the current to flow in a forward path; when a reverse current flows, it blocks the current path.
The z-source network functions as an LC filter to suppress reverse current and serves as a voltage regulator in the forward current path. 26 H-bridge switches are utilized in systems S1 through S4. In the forward path of the system, the power flow is transferred from the DC-AC source. In the reverse path, the bridge acts as a rectifier, transferring the power from AC to DC.
Boost model
In order to analyze the mathematical model for voltage control and the boost converter, this system uses the forward path in the power flow as an example. In order to maximize the converter’s capabilities, the suggested approach sets up a shoot-through zero state.
The proposed method presumes that the inductor 


The switching frequency (T) ZIBDC has two divisions, as shown in Figure 3. The shoot through state is represented as
Proposed T-PID controller
The tilted proportional integrated and derivative is given by T-PID. The T-PID controller is superior to the normal PID controller in terms of adjusting tendency, perturbation control, and reduced sensitivity to switching.
27
A tilted PID controller is used to control the converter output. This controller is better in terms of dynamic response and robustness, unlike the conventional PID. The transfer function of the T-PID algorithm is given by

Equations (11) and (12) give the mathematical function and the transfer function. The T-PID resembles the PID controller, and it incorporates a tilting function that enhances the system’s ability to regulate gain with greater precision. Figure 4 illustrates the proposed model of a T-PID controller. Model of a T-PID controller.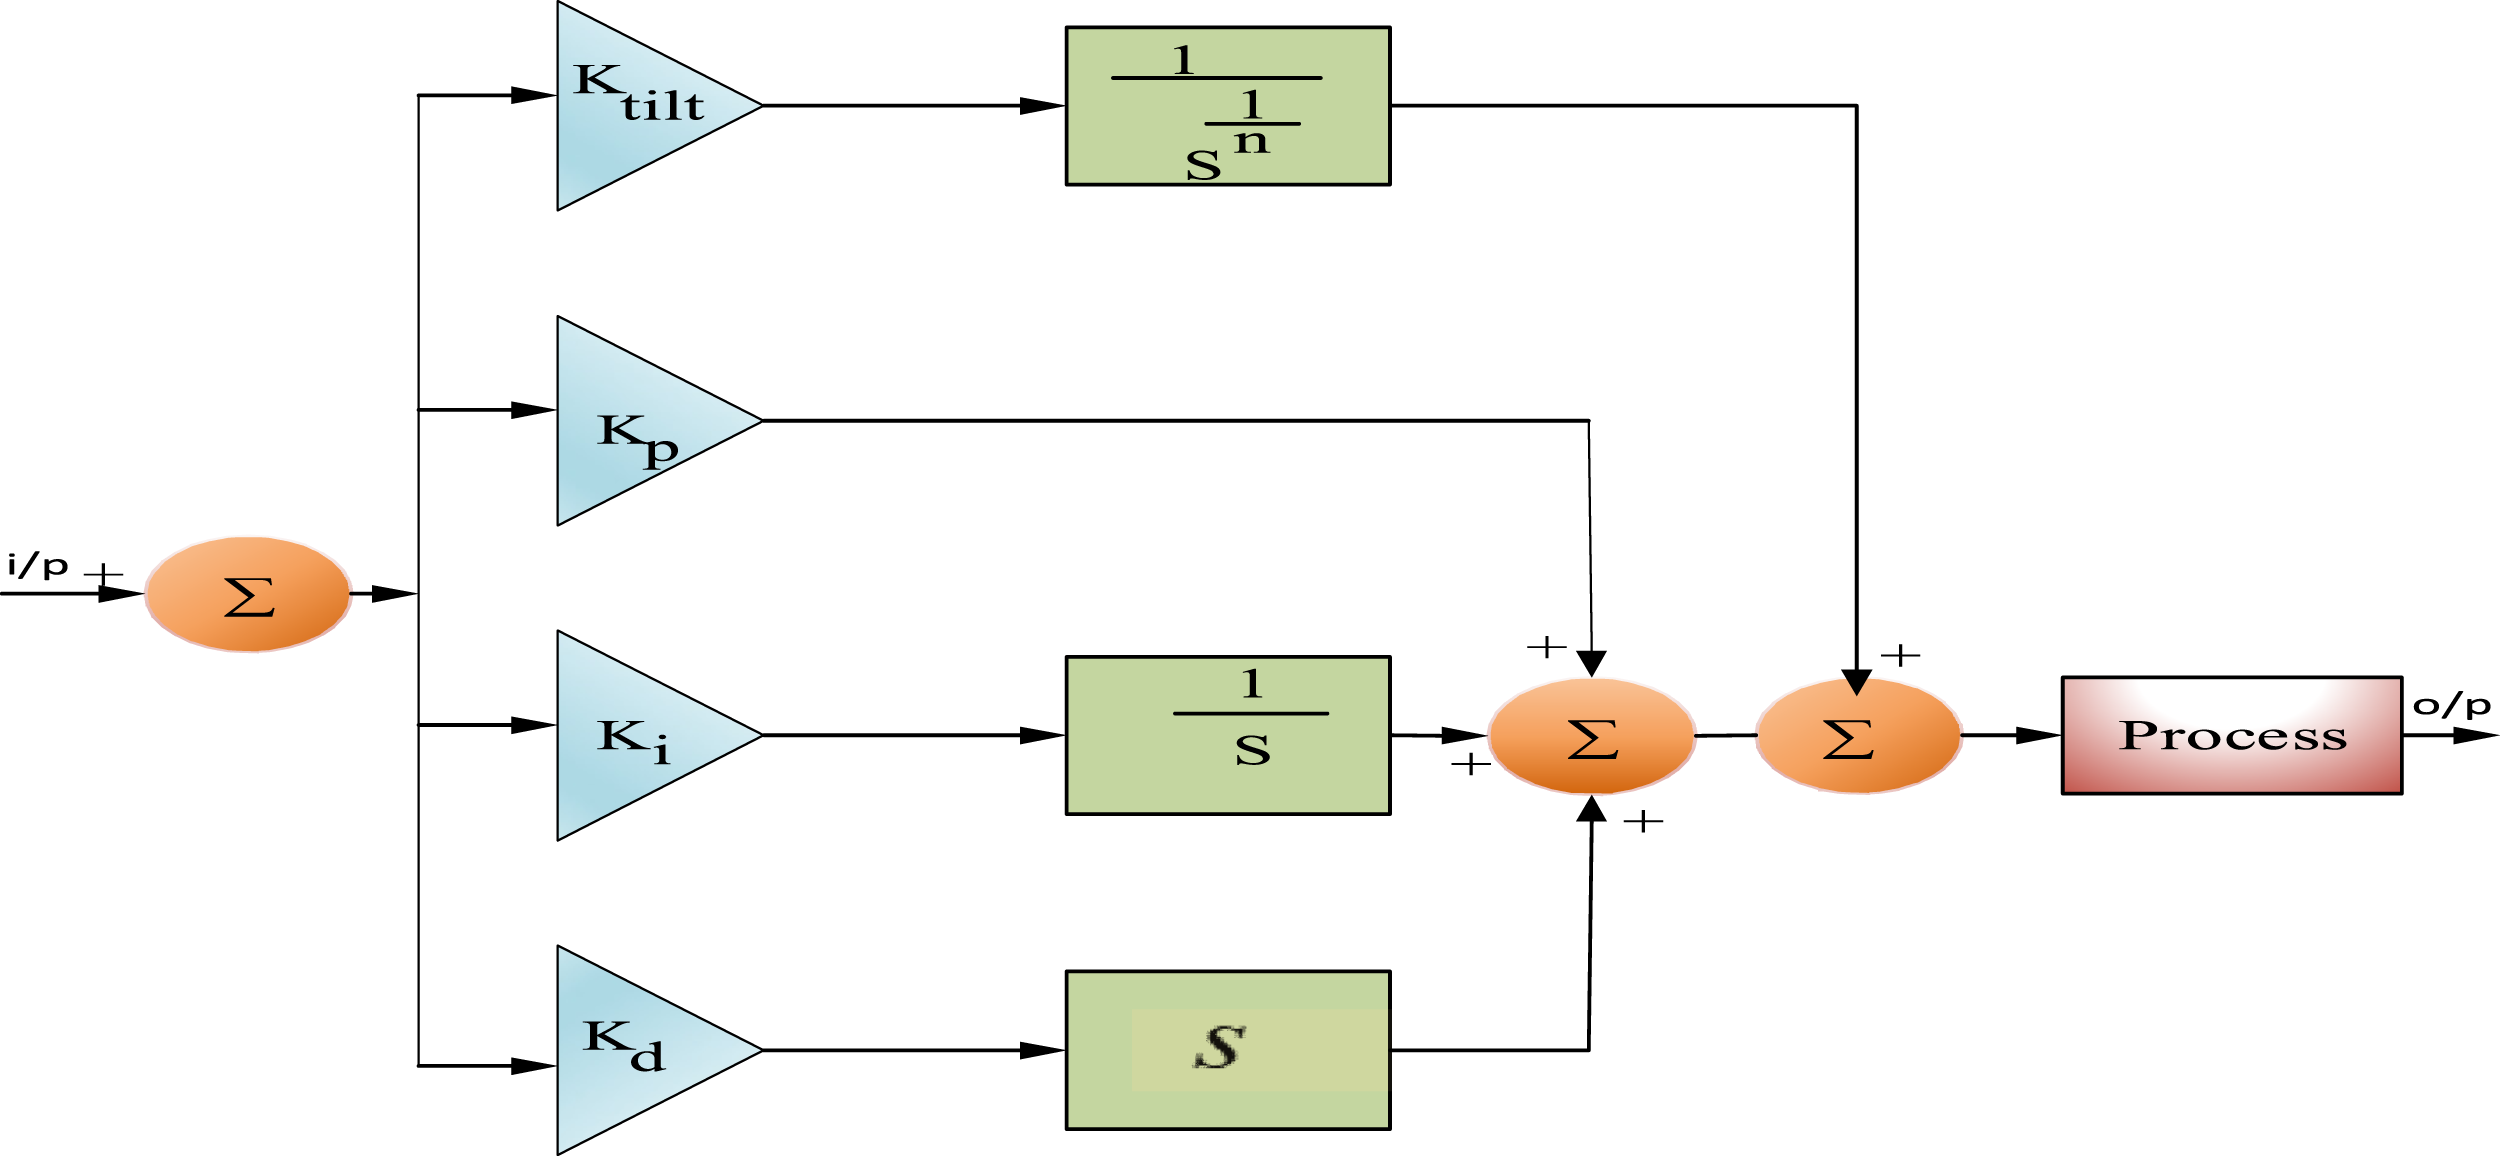
The diagrammatic representation given
Crested Porcupine Optimization algorithm
CPO is a recent metaheuristic algorithm. This algorithm produces four features: sound, sight, physical attack, and odor. Exploration and exploitation comprise the first and second steps of the algorithm, respectively. Exploration of sight, sound, and smell, as well as exploitation of physical attack, are all features. Local search uses exploitation, while global search uses exploration.
28
The matrix form position of the CPO search agent is given as follows,


Equation (15) represents the fitness of each CP function. Here, the fitness of all the matrices is stored in G and 
The equation (16) represents the iteration formulae and gives the population reduction in cyclic terms.
Exploration phase
When the prey is not in danger, the CPO uses two protective mechanisms during the exploration phase. The first strategy activates the sight defense mechanism, while the second strategy triggers the sound defense mechanism. Convergence occurs when the predator gets closer to the prey, and the space between them both decreases. If the predator moves apart, the area expands, allowing for exploration.
The equation shows the position update for the first defense strategy. Here 

The equation shows the position update formula. Here, r1 and r2 represent two random values between [0, N],
Exploitation phase
With slight modifications to the third and fourth defensive strategies, the same strategy was used throughout the study. In this phase, the random number is generated 

This factor is derived from its objective function value 
Equation (23) defines 

Equation (25) describes an update mechanism that guides the 
Perturbation term magnitude is influenced by random values (
Energy management algorithm
The data acquisition is used to process or convert real values into digital values and is fed to the system. The main components are solar power, load, grid, and battery. The algorithm checks the solar and load power to see if there are any changes. If the solar power exceeds the required load power, the energy is fed straight into the load. In a similar manner, when the load is completely charged, the electricity is sent straight to the battery. Strong battery management, which is crucial to the longevity and dependability of the system, is achieved by using specific SOC criteria. Power will be transmitted to the grid if the battery’s state of charge (SOC) reaches 80%, which is its maximum operational limit. A typical tactic used to greatly increase battery longevity and overall system reliability is this operational ceiling, paired with a lower restriction of 20%. Repeatedly charging lithium-ion batteries to 100% capacity and then allowing them to fall below a predefined threshold (for example, 20%) can reduce cycle life, accelerate degradation, and possibly compromise safety. The battery experiences less stress by continuing to run inside this reduced SOC window, increasing its longevity and ensuring more consistent performance over time. This method maximizes the equilibrium between long-term battery health and useful energy.
29
Consider for a moment a scenario in which the grid’s electrical output is insufficient to power the demand. If solar power is insufficient to meet the load, the system checks grid availability: • If the grid is available, it supplies the power required by the load. • If the grid is not available, the system checks the battery SOC. ◦ If the SOC is above 20%, the battery powers the load. ◦ If the SOC is at or below 20%, the system enters a power deficit state, and no further supply is drawn from the battery or grid, triggering protective actions or alerts.
This decision-making process is visualized in Figure 5, which illustrates the logic of the EMS flowchart used to coordinate power flows between sources while prioritizing battery health and energy availability. The grid supplies the power to the load. If the scenario turns around and the grid is absent, then the power is taken from the battery.
29
The battery has a SOC of Algorithm for energy management system.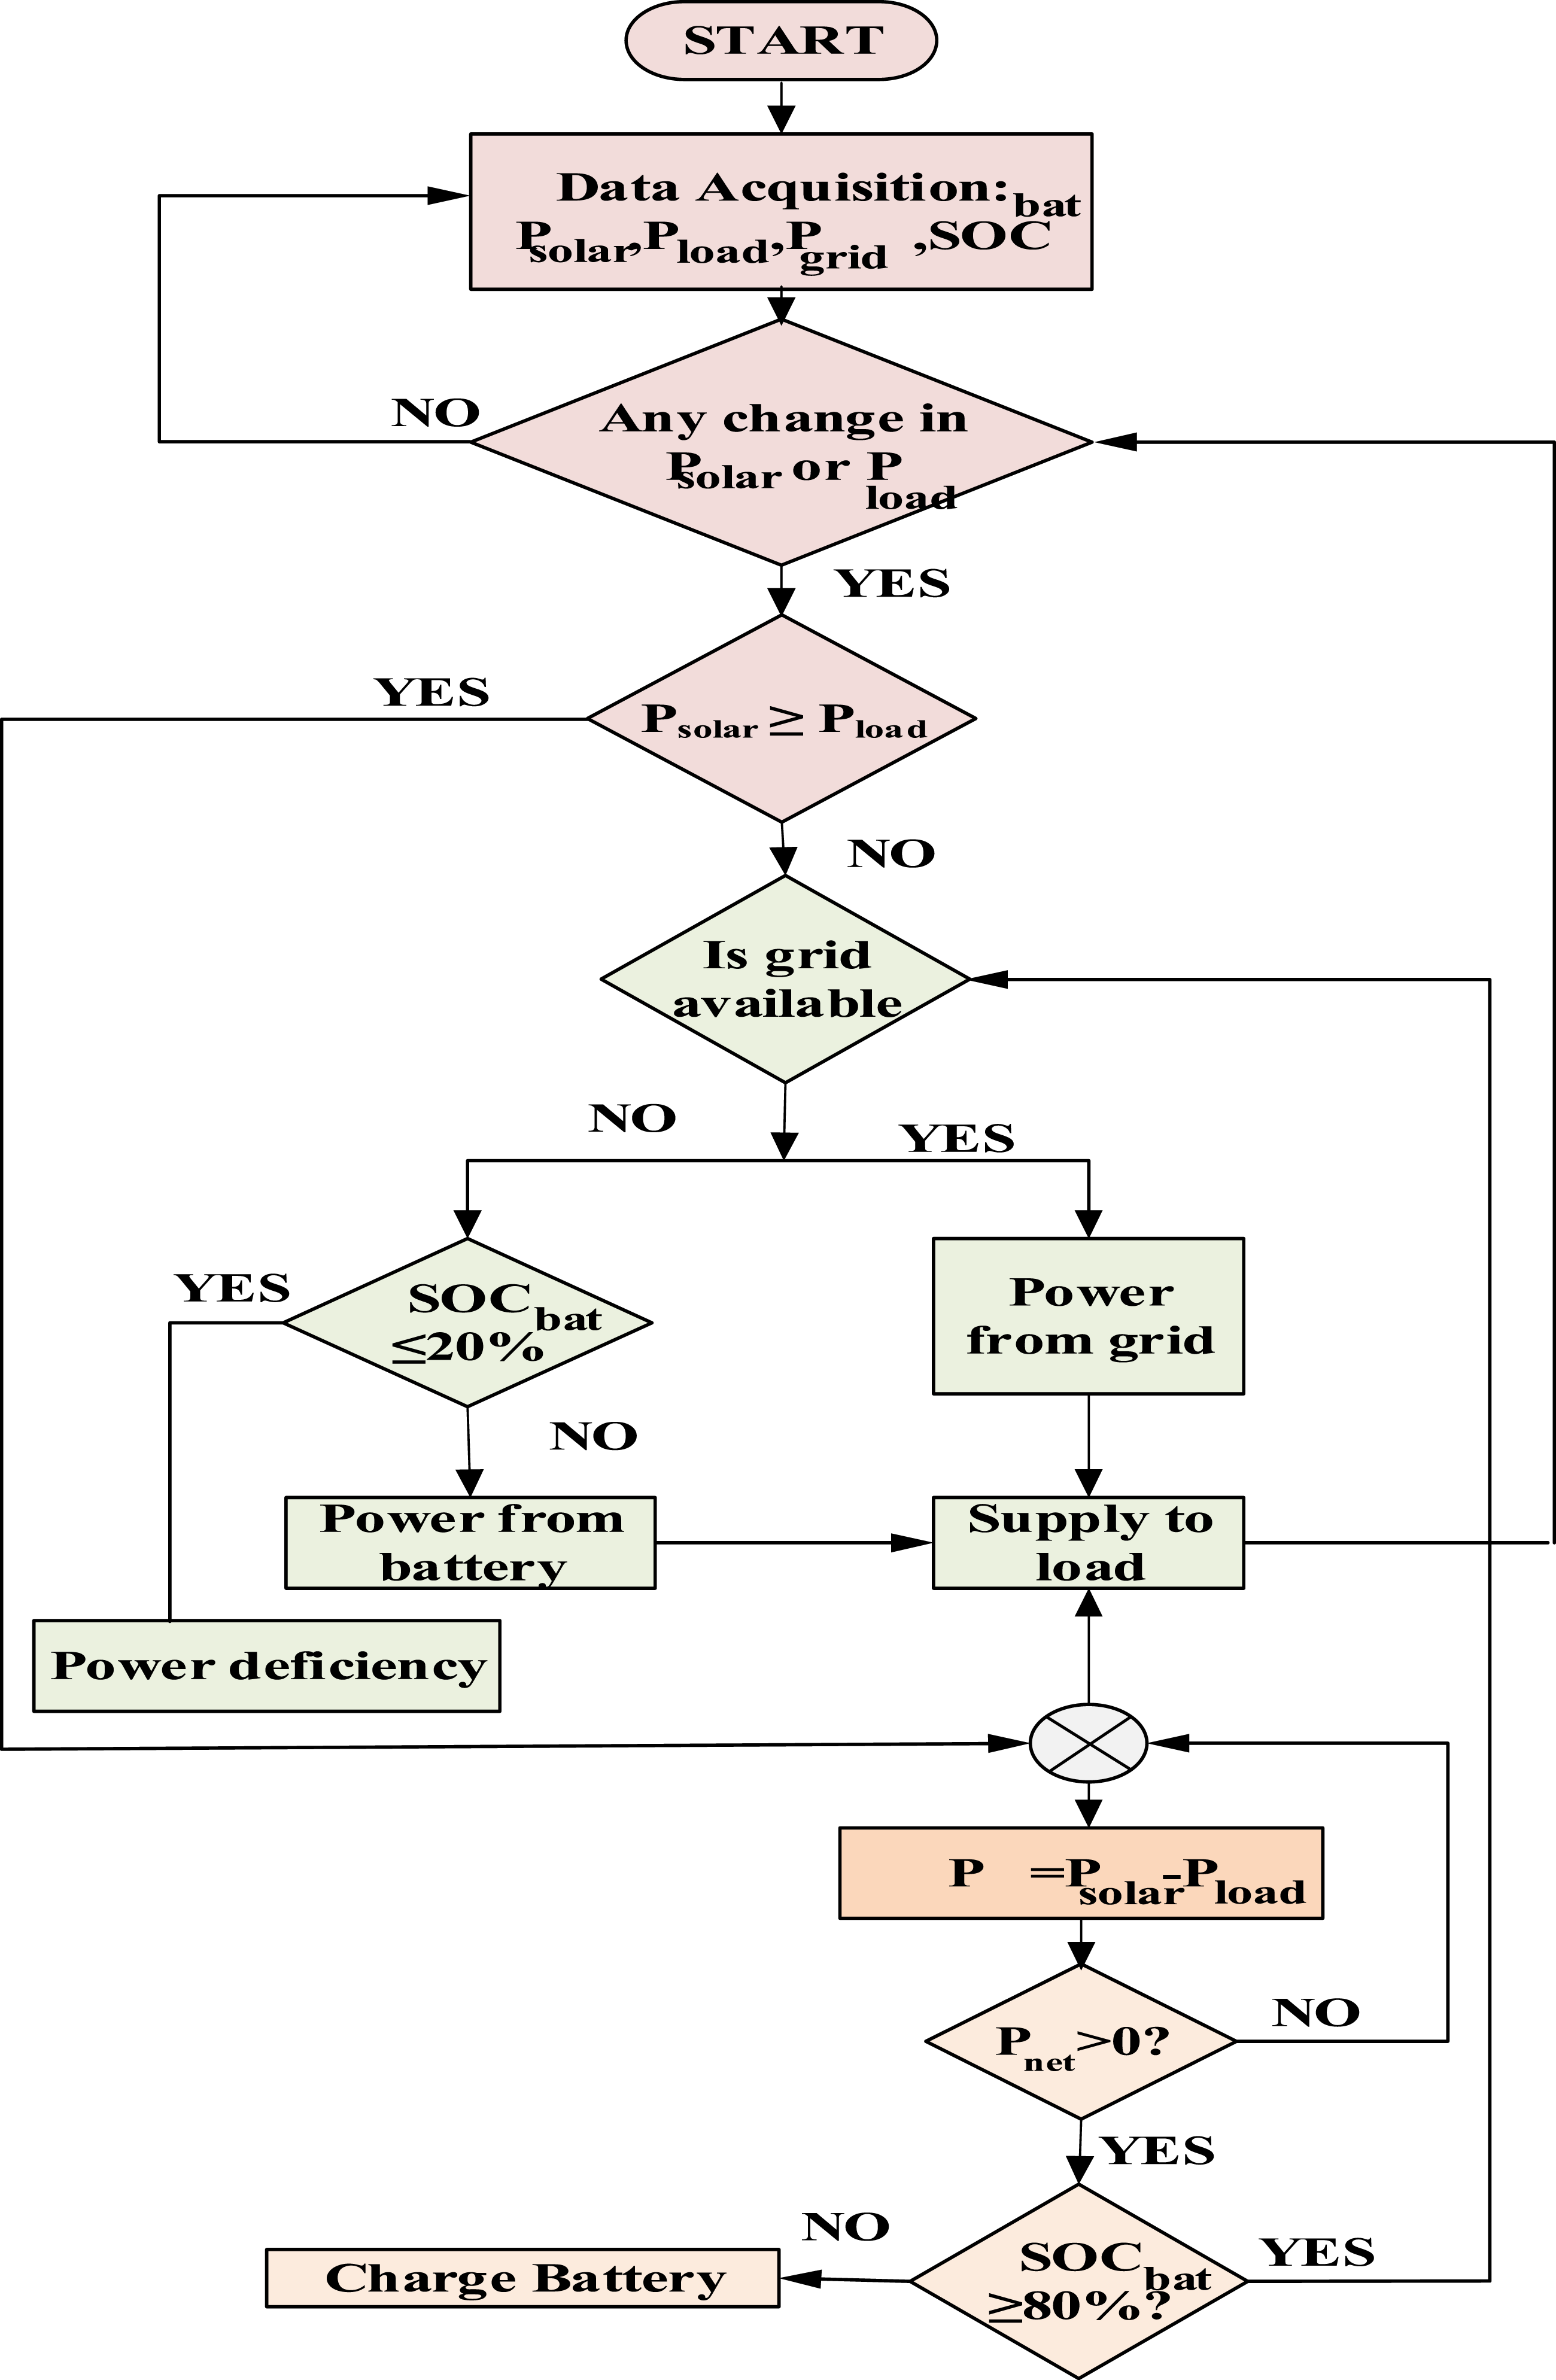
Results and discussion
The proposed fast-charging system of the EV is tested in MATLAB/Simulink with a fixed and variable irradiance environment. The performance of the system is considered based on the charging time, THD and the voltage stability, as well as the controller response. Moreover, the proposed CPO-T-PID controller is also compared with such traditional controllers as PI, PID, Fuzzy Logic, MPC, and ANN to confirm its efficiency. The comparative study proved that the offered approach offers better dynamics response, quicker charging operation, and less harmonic distortion. This helps to identify the efficiency of the system. For the implementation of the CPO algorithm, population size and maximum number of iterations were determined through preliminary simulation trials. In accordance with standard procedures in applications of metaheuristic algorithms, these values were chosen to provide a balance between computing effort and the attainment of stable convergence and optimal performance for the T-PID controller tuning. Specifically, a population size of 50 and a maximum of 100 iterations were employed. Figure 6 represents the Simulink block for the proposed methodology. Table 2 provides the values of the system parameter. Simulink block for the proposed methodology. System parameters and values.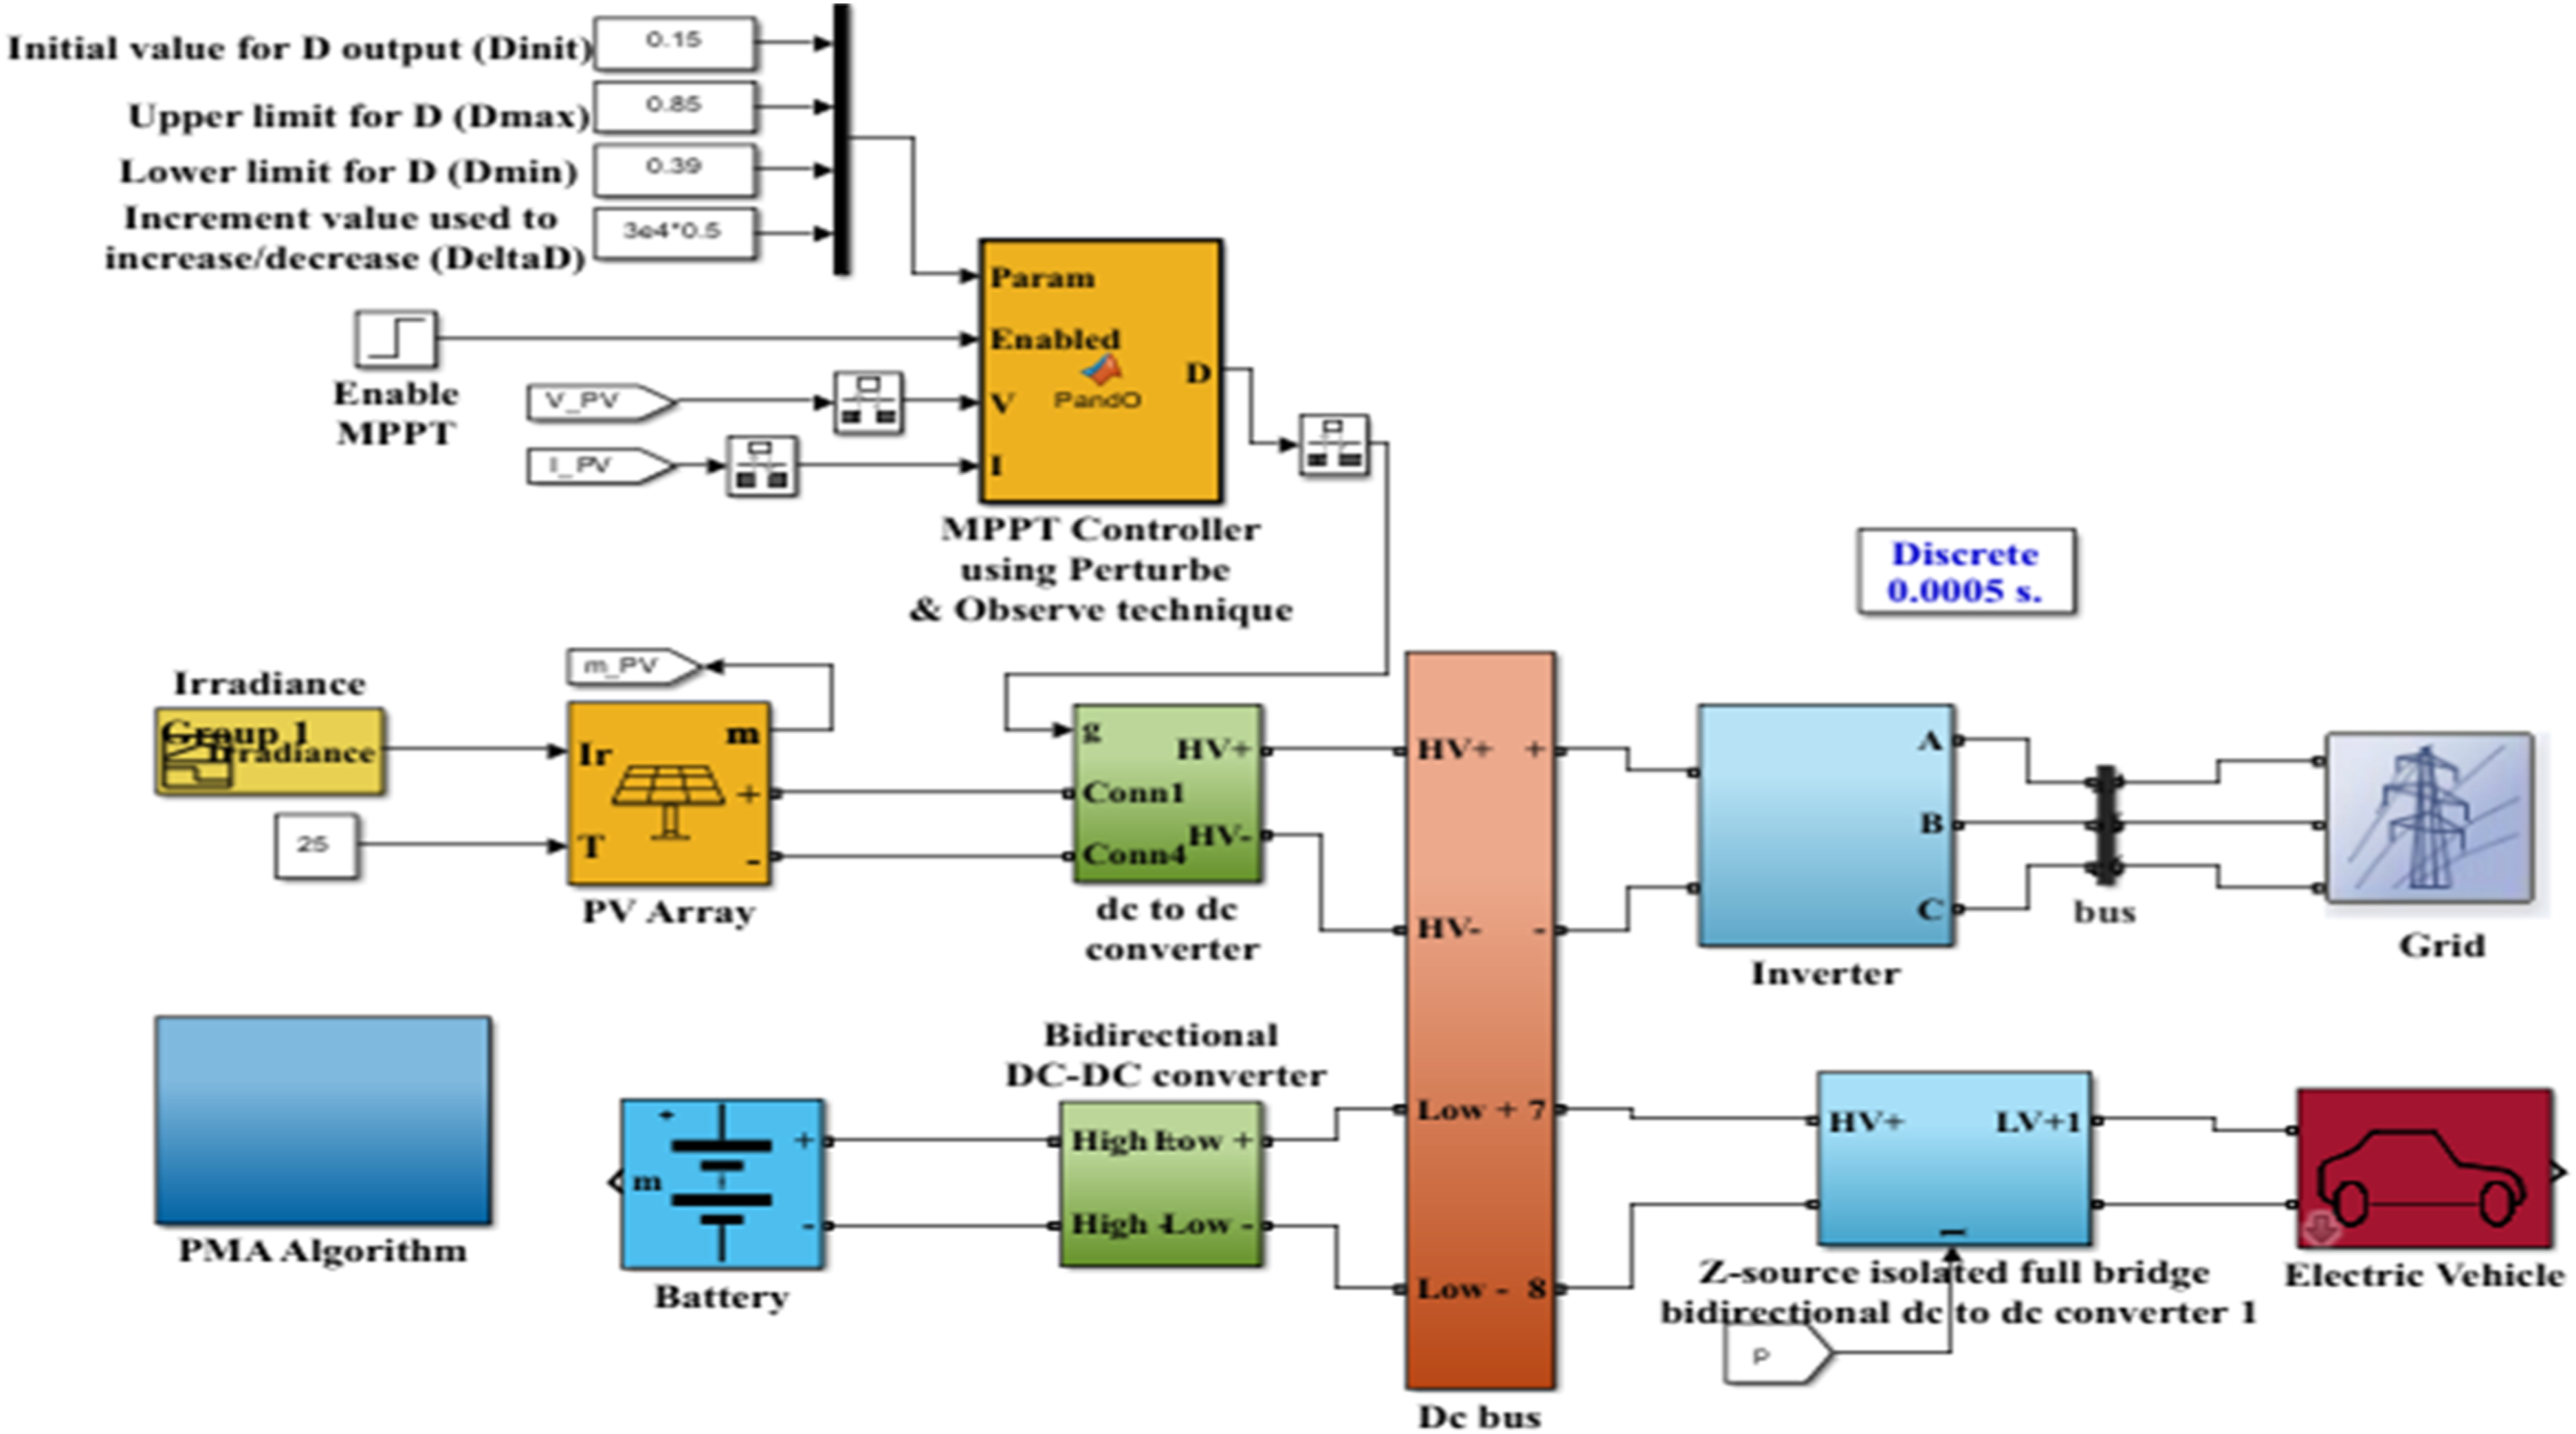

Case 1: constant input
Figure 7 explains the waveform for voltage and current, for the constant temperature and the irradiance for PV cell waveform for voltage, current, and diode current.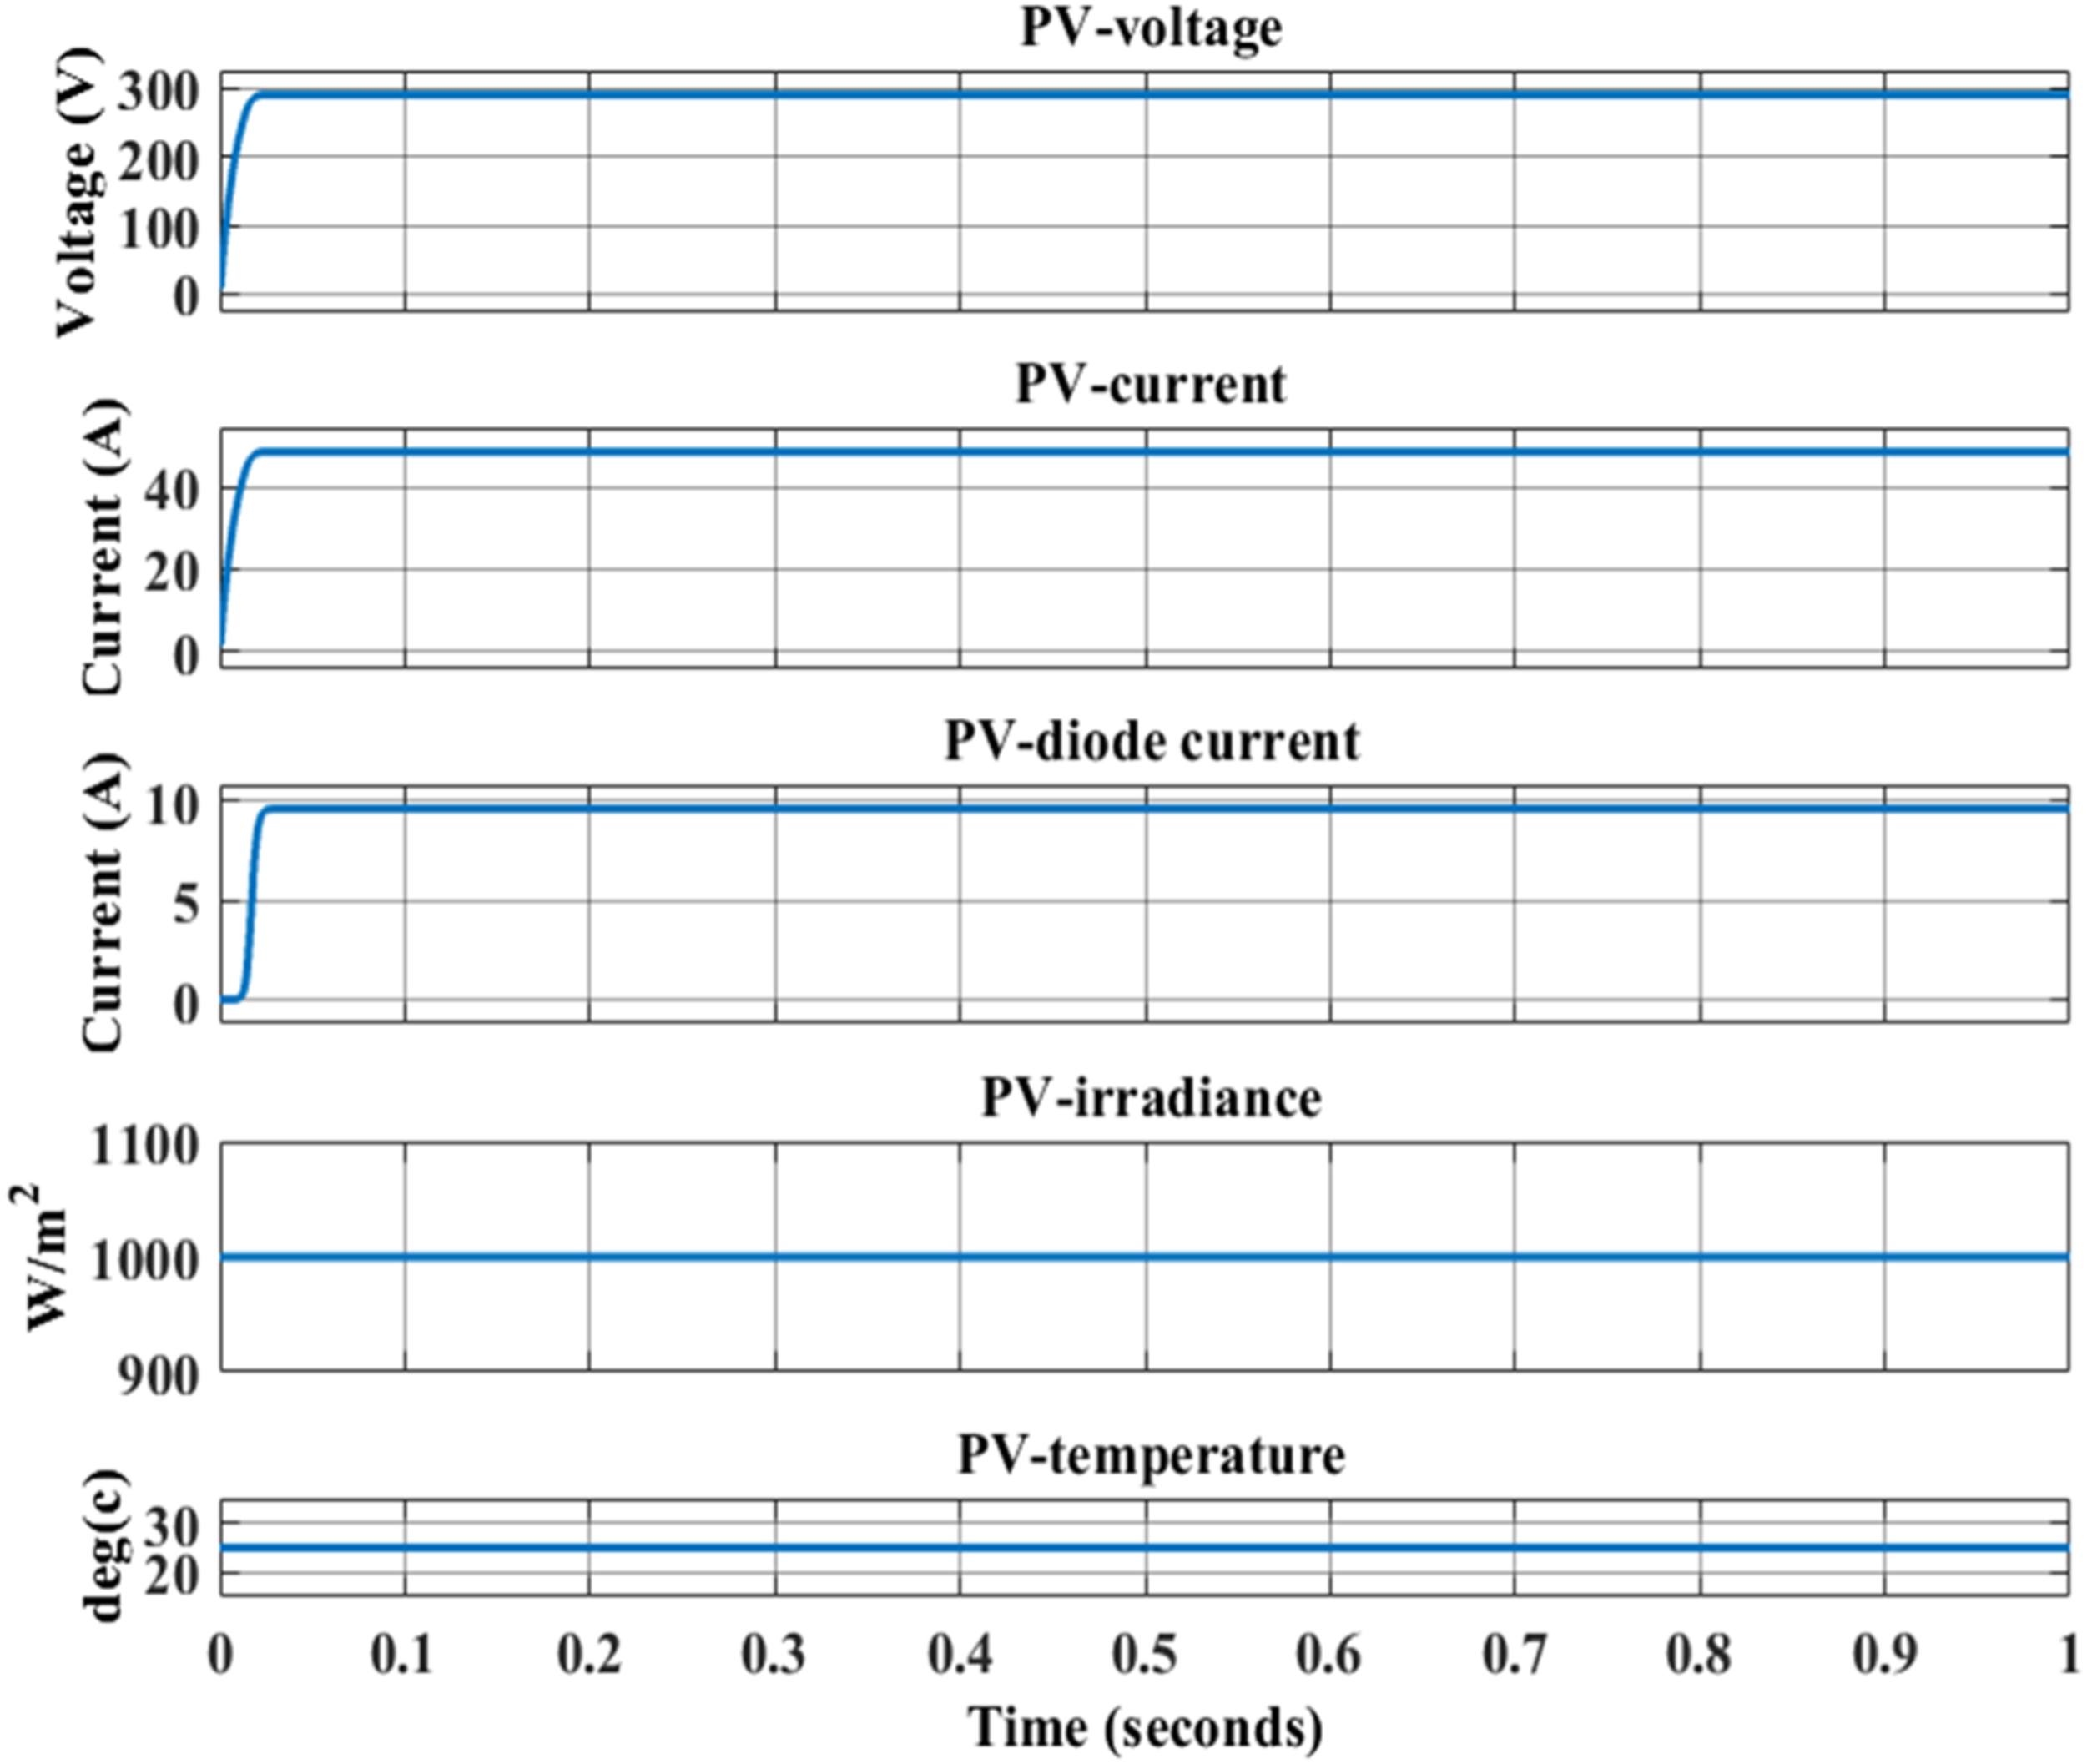
This waveform shows the system’s initial supply, which is provided by the battery; as a result, the SOC falls to 99.9%. After increasing to 60A, the current returns to 20A. The voltage drops to about 279.7 V before rising to 280.4 V again.
The battery’s waveform pattern is shown in Figure 8; in the case 2 section, the SOC decreases with respect to time because the PV is not supplying any power to the EV load. The voltage provides a consistent output form, and the current is decreased from 60 to 20A. It gets to 50 to 49.9995%. The battery waveform for voltage, current, and state of charge is in Figure 8. Battery waveform for voltage, current and SOC.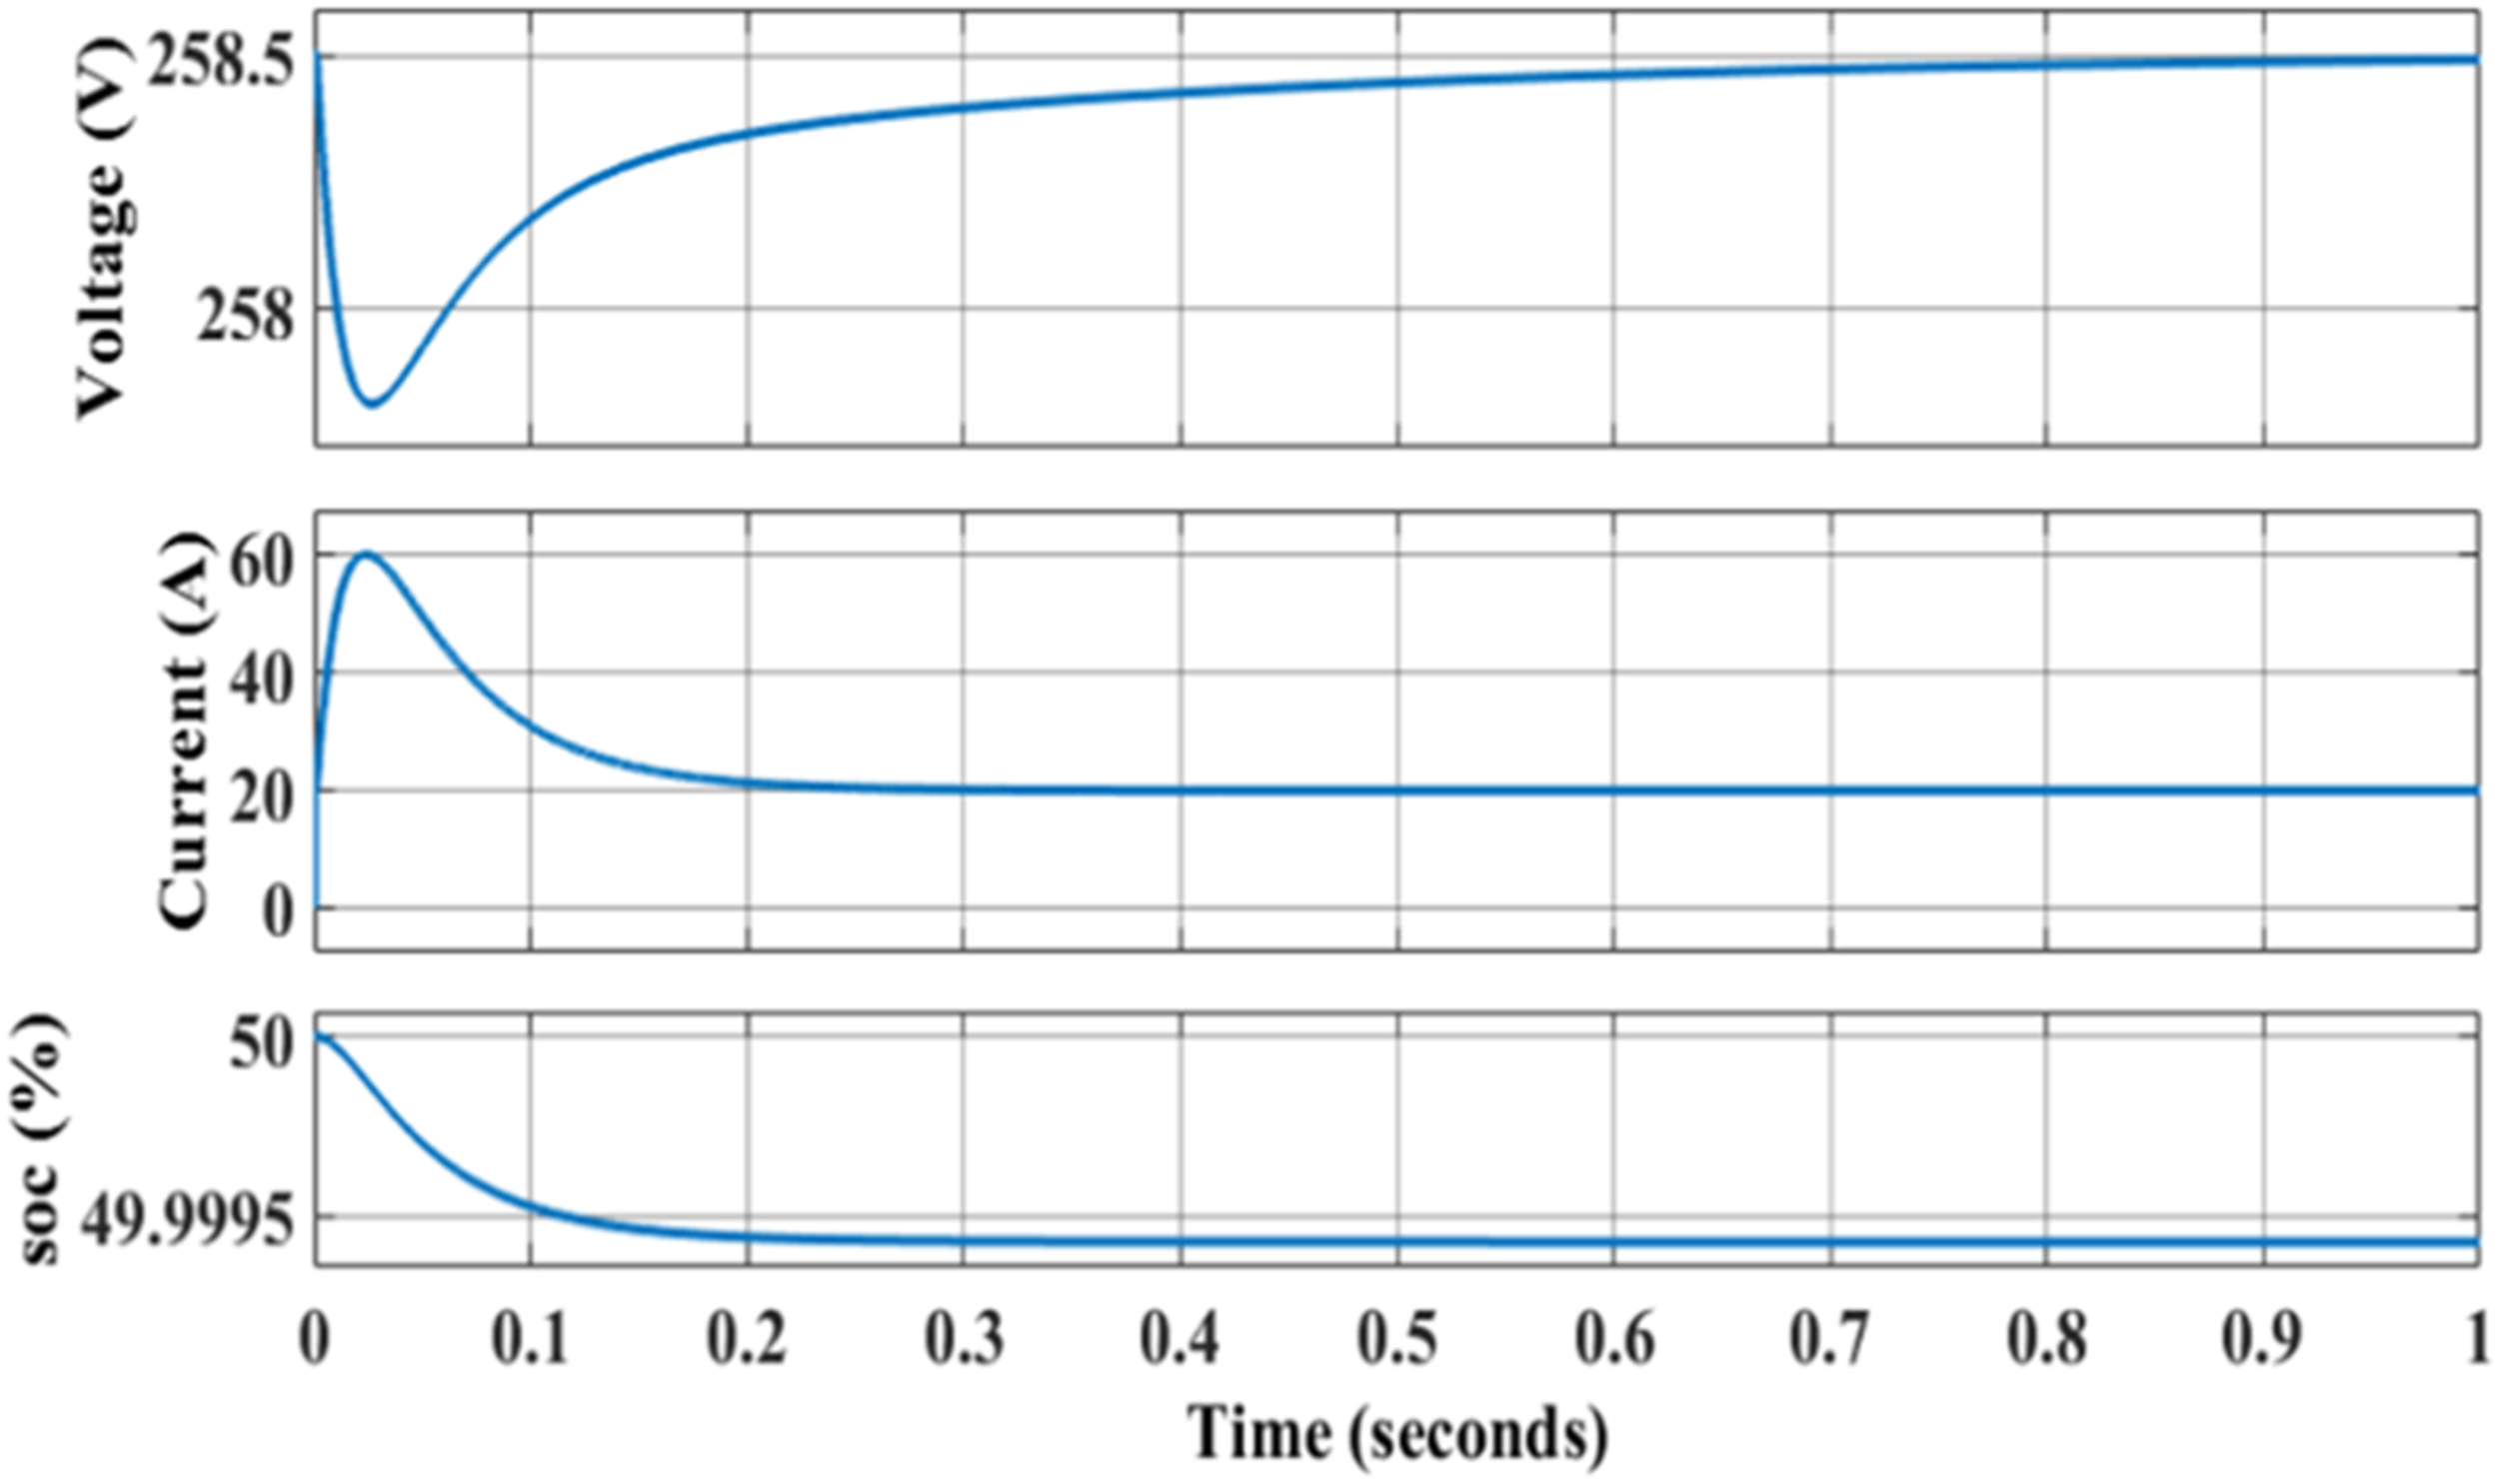
With the temperature and irradiance constants, the converter’s voltage and current waveform are shown in Figure 9. The voltage and current increase to 500V and 35A, respectively, throughout the variable period. One source of voltage can be changed into another using a converter. Since the supply is fed into the system directly, the irradiance is constant. As a result, the converter’s behavior in the system does not alter substantially. Waveform for converter output.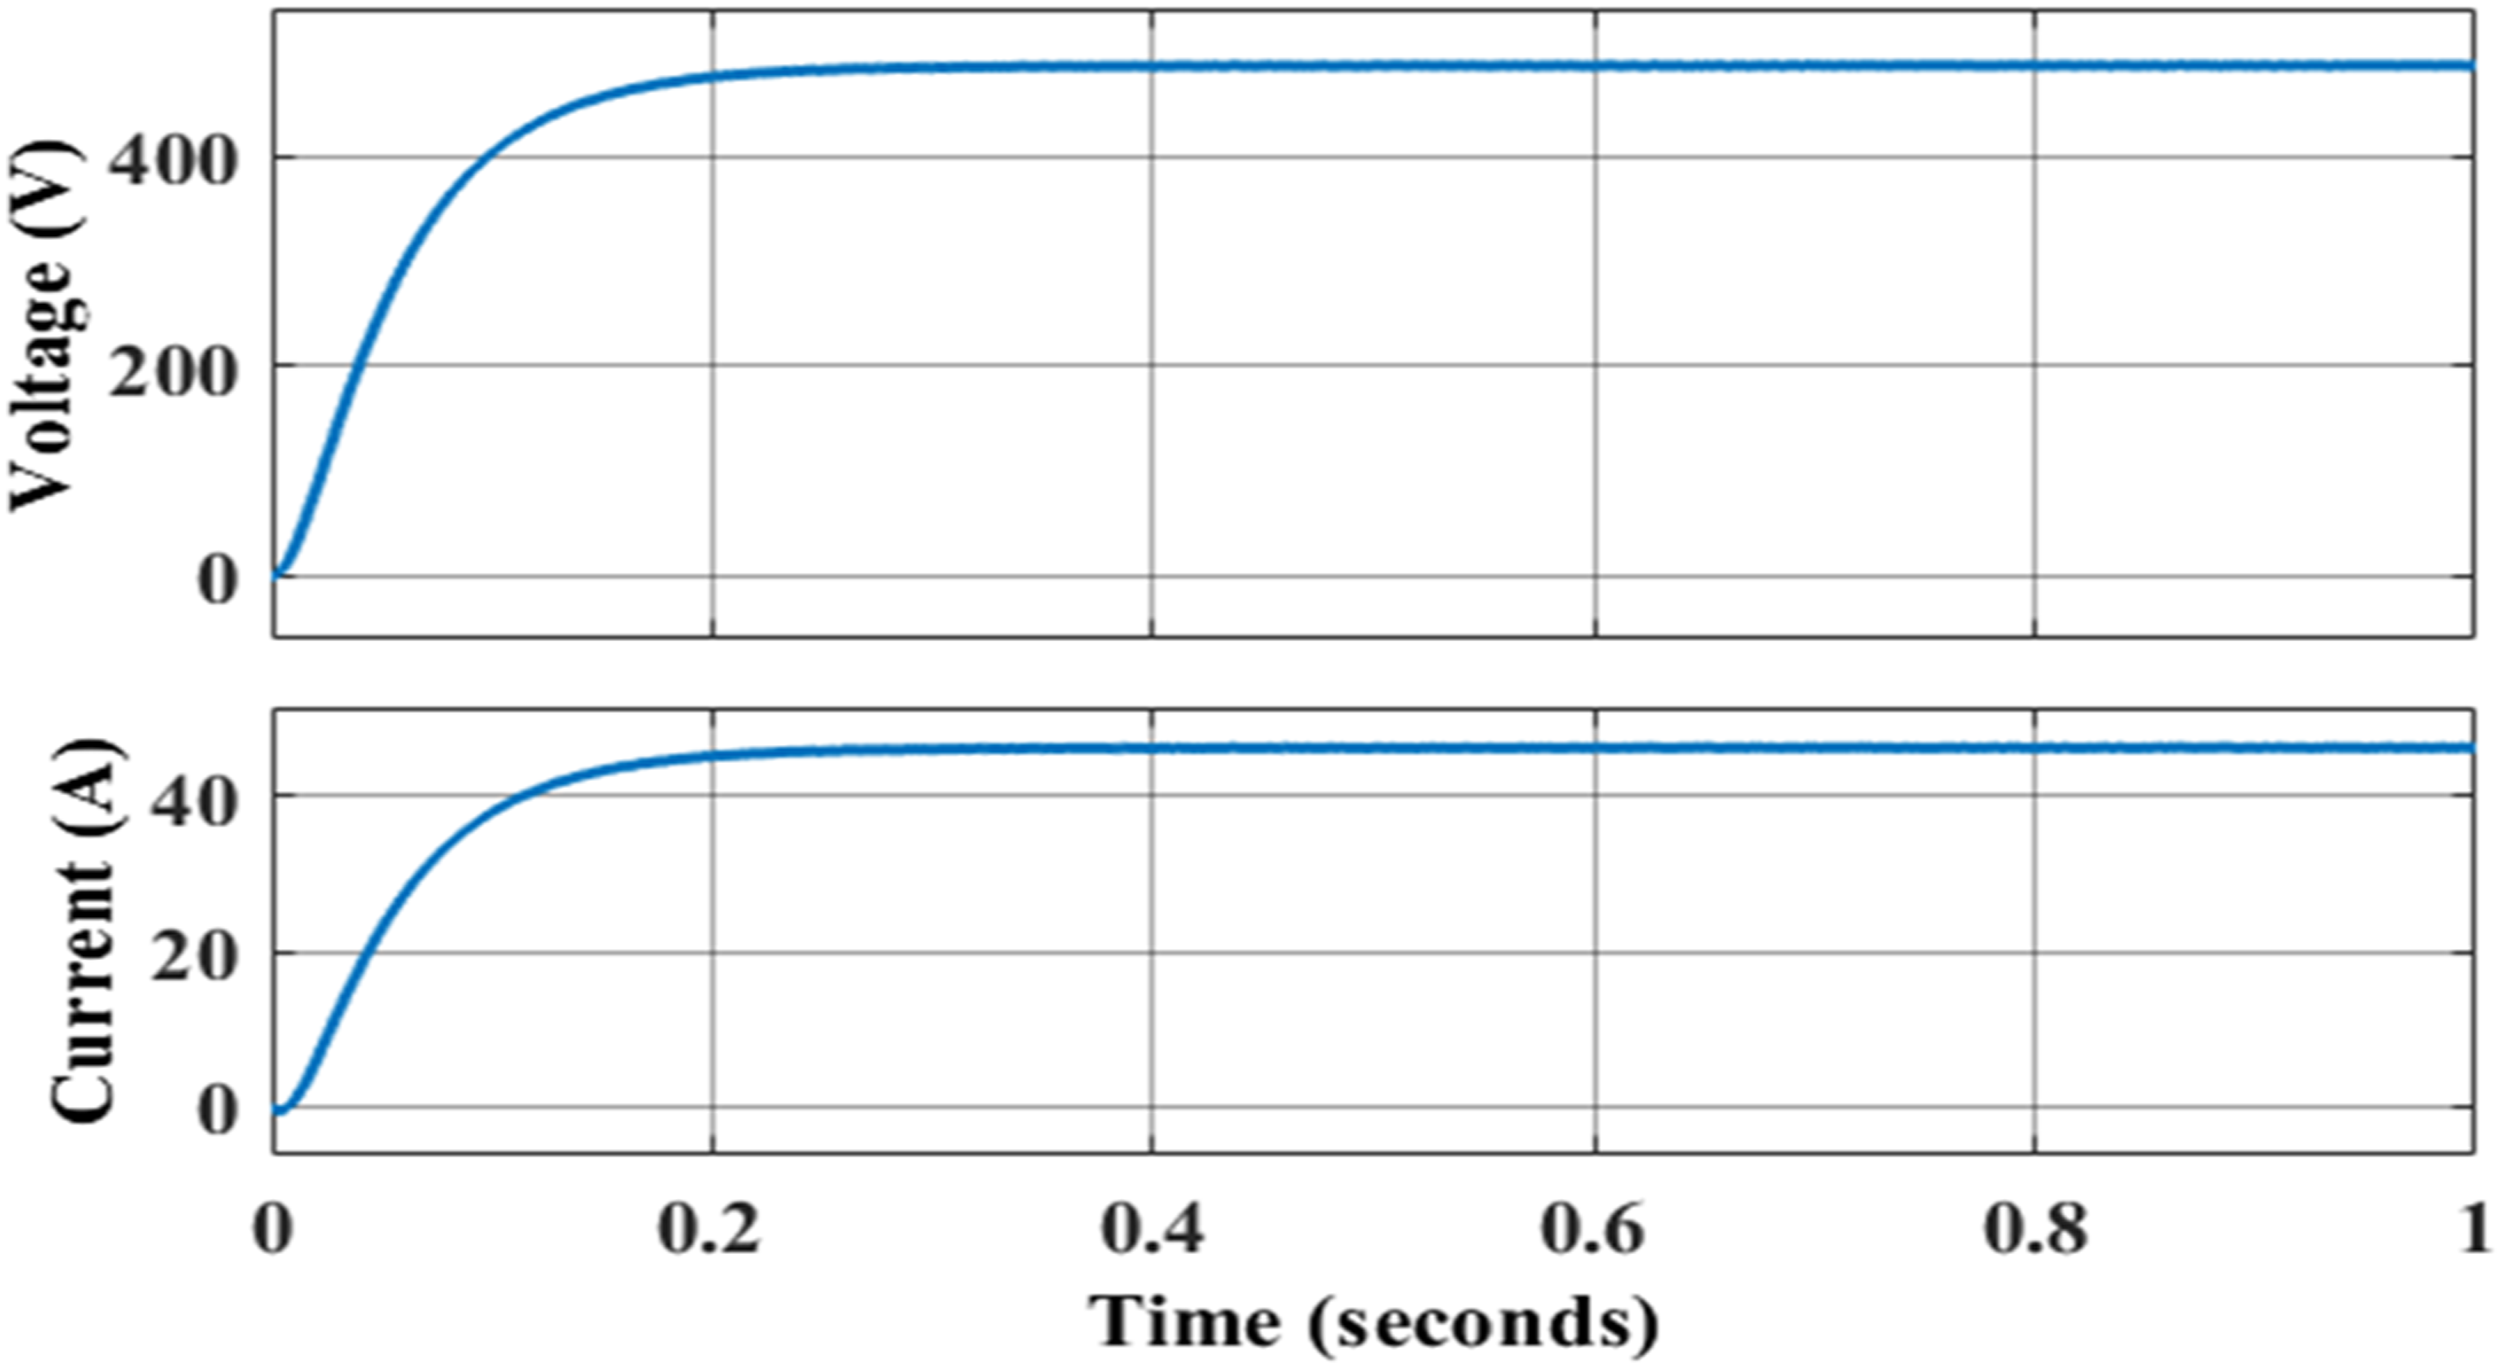
The MPPT is used to improve the voltage output by operating at maximum power output. The waveform patterns of the current and voltage are given in the figure. The voltage and current both rise to their maximum values. In the current waveform, 50A is reached quickly while the voltage gradually increases to 430V. Figure 10 represents the MPPT waveform for voltage and current. MPPT waveform for voltage and current.
There is an initial supply in the system as it functions normally, and there isn’t a lot of variation in the grid’s output. Only the early phase of the system in scenario 1 receives current, while the system later receives very little current. Figure 11 represents the grid waveform for voltage and current. Grid waveform for voltage and current.
The EV acts as a load in the system. As the system operates, the EV’s SOC will rise from 80.00% to a peak of approximately 80.045% within 0.8 to 1 second. The output waveform is given in Figure 12. SOC graphical representation with respect to time.
Case 2: Varying input condition
In the second case, the impact of varied irradiance on the PV cell voltage and current waveforms is investigated, while the temperature is kept constant at 25°C. The irradiance is dynamically varied through four distinct steps: initially at 1000 W/m2, then decreasing to 700 W/m2, further reducing to 500 W/m2, and finally dropping to 0 W/m2.
The PV cell initially operates at a high voltage of 270 V at an irradiance of 1000 W/m2. As the irradiance changes to 700 W/m2, the voltage drops to approximately 240 V. Upon further reduction of irradiance to 500 W/m2, the voltage decreases to about 180 V. Finally, when the irradiance reaches 0 W/m2, the voltage also falls to 0 V. Similarly, the PV cell current responds to these changes: starting at approximately 45 A at 1000 W/m2, it then decreases to 40 A at 700 W/m2, drops further to 30 A at 500 W/m2, and ultimately falls to 0 A at 0 W/m2. Figure 13 clearly depicts these PV cell waveforms for voltage, current, and diode current under varying irradiance conditions. PV cell waveform for voltage, current, and diode current.
Figure 14 shows the dynamic responses of the battery’s voltage, current, and SOC during the discharge operation. The process begins with the battery at approximately 52.5% SOC and a terminal voltage of around 550V. As the discharge cycle begins, the current experiences an initial transient. From the charging state, the current quickly enters the discharging state, briefly dropping to −40A before returning to 0A. Over time, when the SOC declines to 52%, the voltage drops to 500V, and the discharge current settles at around 10A. The voltage reduces to 450V later in the discharge, as the SOC steadily decreases to 51.5%. Similarly, the discharge current increases from 10A to 20A. In the final observed phase of this discharge profile, both the SOC and voltage drastically decrease to 0% and 0V, respectively, indicating deep discharge, while the discharge current increases sharply to 50A, indicating a high load condition. Battery waveform for voltage, current, and SOC.
Notably, after each intense discharge interval, the system initiates a rest period. During this time, the algorithm dynamically derates the C-rate based on SOC and thermal conditions, allowing internal diffusion within the battery cells to occur. This diffusion effect enables the redistribution of lithium ions, thereby reducing concentration gradients and preventing issues such as lithium plating or thermal stress. This behavior is an embedded feature of the proposed EMS logic and is evident in the controlled current reduction seen in Figure 14. The system’s capacity to regulate power flow based on the battery’s electrochemical recovery helps preserve battery health and extend its operational lifespan.
Figure 15 represents the voltage and current waveform for the converter circuit. The voltage and current gradually increased with respect to time. The voltage is progressively raised from 0 to 500V over the course of 0.2 seconds, and the current is progressively raised from 0 to 45A. Converter waveform.
Since the MPPT is not exposed to irradiance, the voltage and current waveforms progressively drop for 0-0.2 seconds, increasing to 50A and 400V, respectively. The voltage and current drop to 350V and 42A in 0.2–0.4 seconds and to 250V and 35A in 0.4–0.6 seconds, respectively. From 0.6 to 0.8 seconds, the voltage and current drop to 0. Figure 16 represents the MPPT waveform for voltage and current. MPPT waveform voltage and current.
In the second stage, the grid begins to support the battery and the EV demand due to the inefficiency of the irradiance and the battery’s supply, which lowers the voltage. The voltage and current waveforms in relation to time are shown in Figure 17. The grid waveform’s voltage and current fluctuate between −100V and +100V and −50 and +50A, respectively. Grid waveform for voltage and current.
Figure 18 represents the graphical waveform for the EV SOC waveform. The waveform for the SOC is calculated from the voltage and the current waveform generated by the grid. The SOC waveform is calculated with respect to time. The SOC is produced between 80.00 and 80.048% in 0.8 to 1 seconds. CPO facilitates the capability of the proposed system in charging the EV battery up to 80.048% within less than 10 minutes. The CPO also enables dynamic adjustment of the T-PID gains in order to follow the safe maximum current profile rather than relying on set steps as with the traditional fixed-step controllers. This enables the Z-source isolated bidirectional converter (ZIBDC) to perform peak power transfer efficiency at the ‘Constant Current’ phase, which radically minimizes idle time experienced by conventional converters, which experience high switching losses and low voltage boost ratios. SOC graphical representation with time.
The grid is connected to the system for emergency power. The battery supplies electricity to the load when the system’s irradiance decreases. If the battery fails, the grid takes over. The grid should maintain a lower THD level in the system. As the harmonic distortion is reduced, the grid functionality becomes better. The frequency range of 0 to 200 Hz results in a high magnitude of THD of around 1.60% for the given fundamental frequency of 50 Hz. Figure 19 represents the THD value for the grid connection. This decrease in the overall harmonic distortion can be largely explained by the optimal control strategy and converter architecture. The CPO-based T-PID controller is able to control with smoother control signals and less switching oscillations, which result in the minimization of current ripple. Also, the Z-source network has a built-in filtering capability and constant regulation of voltages, which further minimizes harmonic content in the grid current. Consequently, the system proposed has much lower THD than the conventional controllers. THD value for grid connection.
Performance comparison of the proposed EV charging converter with existing topologies.

Figure 20 represents the comparative analysis of the proposed controller in terms of charging time. The controllers in the system are compared in terms of time in the following comparison study. PI, PID, Fuzzy Logic, Model Predictive Control (MPC), Artificial Neural Network (ANN), and the proposed CPO-T-PID controller are compared in the analysis. Among the controllers, the traditional PI exhibits the longest charging time of 14 minutes. PID, Fuzzy, and MPC controllers achieve moderate improvements, lowering charging durations to around 10–11 minutes. ANN performs even better, with median times around 9 minutes. Notably, the proposed CPO-T-PID controller provides the fastest and most consistent charging performance, with a time of less than 8 minutes and a tightly restricted spread. This reduction in charging time demonstrates the controller’s capacity to maximize power transmission while preserving battery health and system stability, making it an ideal choice for high-performance EV fast-charging applications. Comparative analysis of the controller.
Figure 21 effectively compares the THD performance of PI, PID, Fuzzy Logic, MPC, ANN, and the proposed CPO-T-PID controller. The PI controller shows the highest median THD (around 5.2%), suggesting poor power quality. PID and Fuzzy controllers exhibit moderate improvement, with median THD values of around 3.5% and 3.2%, respectively. MPC and ANN provide better harmonic suppression, with median values near 2.5% and 2. Notably, the proposed controller achieves the lowest THD, approximately 1.7%, with a lower minimum value compared to other methods. This demonstrates not only superior average performance but also greater consistency and robustness in maintaining low harmonic distortion. The results validate the efficacy of the proposed CPO-T-PID controller in enhancing power quality for EV fast charging. Representation of controllers with respect to time.
Figure 22 represents the graphical demonstration of the convergence curve. Furthermore, the proposed topology is far better than the conventional topologies. The conventional topologies compared to the proposed topologies are the walrus optimization algorithm (WOA), particle swarm optimization (PSO), genetic algorithm (GA), and meerkat optimization algorithm (MOA). Here, the proposed topologies give the lowest iteration compared to the other methods. Convergence curve analysis.
Conclusion
In this paper, a fast-charging scheme of electric vehicles based on a CPO-optimized T-PID controller with a combination of a Z-source isolated full-bridge bidirectional DC-DC converter and an intelligent energy management system was proposed. The main aim of this work was to decrease the charging time of EVs and retain the quality of power and battery health over constant and varying operating conditions. The simulation findings confirmed that the proposed system can achieve high rates of charging at approximately 80% state of charge within a short period of time of less than 8 minutes, which is much faster than traditional PI, PID, fuzzy logic, MPC, and ANN controllers. Also, the grid-connected operation had a low overall harmonic distortion of 1.7%, which showed better power quality performance. The T-PID controller was optimized, and it was shown that it had a strong dynamic response and ability to suppress harmonics even when irradiance and load varied. In general, the suggested charging scheme of the CPO-T-PID type can be considered as a viable and effective solution to high-performance EV fast-charging infrastructure. To address the issue of experimental validation and to include long-term battery degradation models, further work will be conducted on the possible state-of-health and the lifecycle performance of the battery under repeated fast-charging conditions.
Footnotes
Declaration of conflicting interests
The authors declared no potential conflicts of interest with respect to the research, authorship, and/or publication of this article.
Funding
The authors received no financial support for the research, authorship, and/or publication of this article.