
Abstract
The expansion of industrial and logistics facilities increases the impact of environmental noise on residential areas, making it essential to apply accurate and reliable methods for noise assessment and prediction. The aim of this study is to model the dispersion of noise generated during warehouse operations and to evaluate the suitability of machine learning methods for predicting noise levels. Noise calculations were performed using Inter-Model Integration (IMMI) software according to the ISO 9613-2 methodology and the requirements of the Lithuanian hygiene standard HN 33:2011. The spatial distribution of noise was visualized in a GIS (Geographic Information Systems) environment by calculating zonal raster statistical indicators. Predictive modeling was performed using five machine learning algorithms - Random Forest, M5P, Multilayer Perceptron, SMOreg, and Linear Regression - implemented within the WEKA environment. Results indicate that noise generated by warehouse operations near the closest residential areas did not exceed the regulatory limits, with the highest noise levels observed in areas of high traffic flow. The machine learning (ML) algorithms demonstrated very high prediction accuracy - all tested models achieved a correlation coefficient (r) above 0.97. ML analysis revealed particularly high predictive accuracy when using Random Forest (r = 0.9984) and M5P (r = 0.9898) algorithms. These findings confirm that integrating zonal raster statistical indicators with machine learning methods is an effective tool for analyzing industrial noise dispersion and can be successfully applied for practical environmental noise assessment and planning purposes.
Introduction
Environmental noise is one of the most significant environmental factors adversely affecting public health and quality of life, especially in urbanized and industrial areas. At the European Union level, noise pollution is recognized as a significant environmental issue linked to sleep disturbances, cardiovascular diseases, and a decline in population well-being. 1 Due to the rapid development of the logistics and warehousing sector, situations are increasingly encountered in which industrial facilities are located within residential areas, creating a need for accurate assessment and prediction of their noise impact.
Traditionally, environmental noise assessment is based on physical sound propagation models, such as the ISO 9613-2 methodology, which is widely applied in industrial noise calculations (ISO 9613-2, 1996). Although these models are standardized and reliable, the literature notes that they do not always accurately reflect complex spatial and nonlinear patterns of noise propagation, particularly in areas with diverse infrastructure and variable noise sources. 2 For this reason, increasing attention has been paid in recent years to the integration of advanced data analysis methods into noise research. Givargis and Karimi (2022) emphasize that in industrial settings, traditional linear regression often falls short compared to Artificial Neural Networks, which better capture these interdependencies.
Machine learning (ML) methods are becoming increasingly popular in environmental noise modeling, as they enable efficient processing of large datasets, identification of complex nonlinear relationships, and achievement of high predictive accuracy. 3 Studies show that models such as Random Forest, Gradient Boosting, or neural networks often outperform traditional regression techniques in predicting noise levels in both urban and industrial areas. 4
The integration of geographic information systems (GIS) and machine learning methods occupies an important place in contemporary noise research. GIS enables detailed analysis of the spatial distribution of noise, while the use of zonal raster statistical indicators provides the opportunity to summarize noise characteristics across different areas. 3 Studies by Liu et al. (2021) have shown that combining traditional propagation models with the Random Forest algorithm can significantly improve the accuracy of high-resolution noise maps. Similar conclusions are reported by other authors, emphasizing that nonlinear ML models better capture the influence of extreme noise values and spatial variability on overall noise levels.
Despite the growing interest in the application of machine learning to noise modeling, most studies focus on transport or urban noise, while the prediction of noise from industrial and warehousing facilities - especially using zonal raster statistical indicators remains insufficiently explored. While this study focuses on macro-level noise propagation from warehouse operations, it is important to note that the broader field of noise and vibration control encompasses various specialized mitigation strategies. For instance, research has addressed the modification of vibratory behavior in mechanical systems to reduce injury, 5 the use of advanced metamaterial absorbers for wave control in infrastructure, 6 and the development of efficient numerical methods for solving complex non-linear equations in damping systems. 7 Furthermore, the literature emphasizes the importance of employing not only accurate but also interpretable models that facilitate a deeper understanding of noise generation mechanisms and inform evidence-based noise management decisions. 8 The scientific novelty of this study lies in the application of zonal raster statistics as multi-dimensional predictors for machine learning, creating a highly efficient computational ‘digital twin' of the ISO 9613-2:1996 standard. This approach allows for rapid noise assessment in large-scale industrial zones without the need for repetitive and time-consuming 3D simulations, offering a scalable framework for industrial noise management.
This study aims to model the propagation of environmental noise caused by warehouse operational activities and to evaluate the suitability of machine learning (ML) methods for predicting noise levels using spatial geographic information systems (GIS) raster-based statistical indicators.
Materials and methods
Environmental and warehouse-site noise sources
First, preliminary information on the warehouse operations and its immediate surroundings was collected, and the necessary data for noise propagation modeling were gathered by identifying potential noise sources and assigning the noise emission parameters they generate.
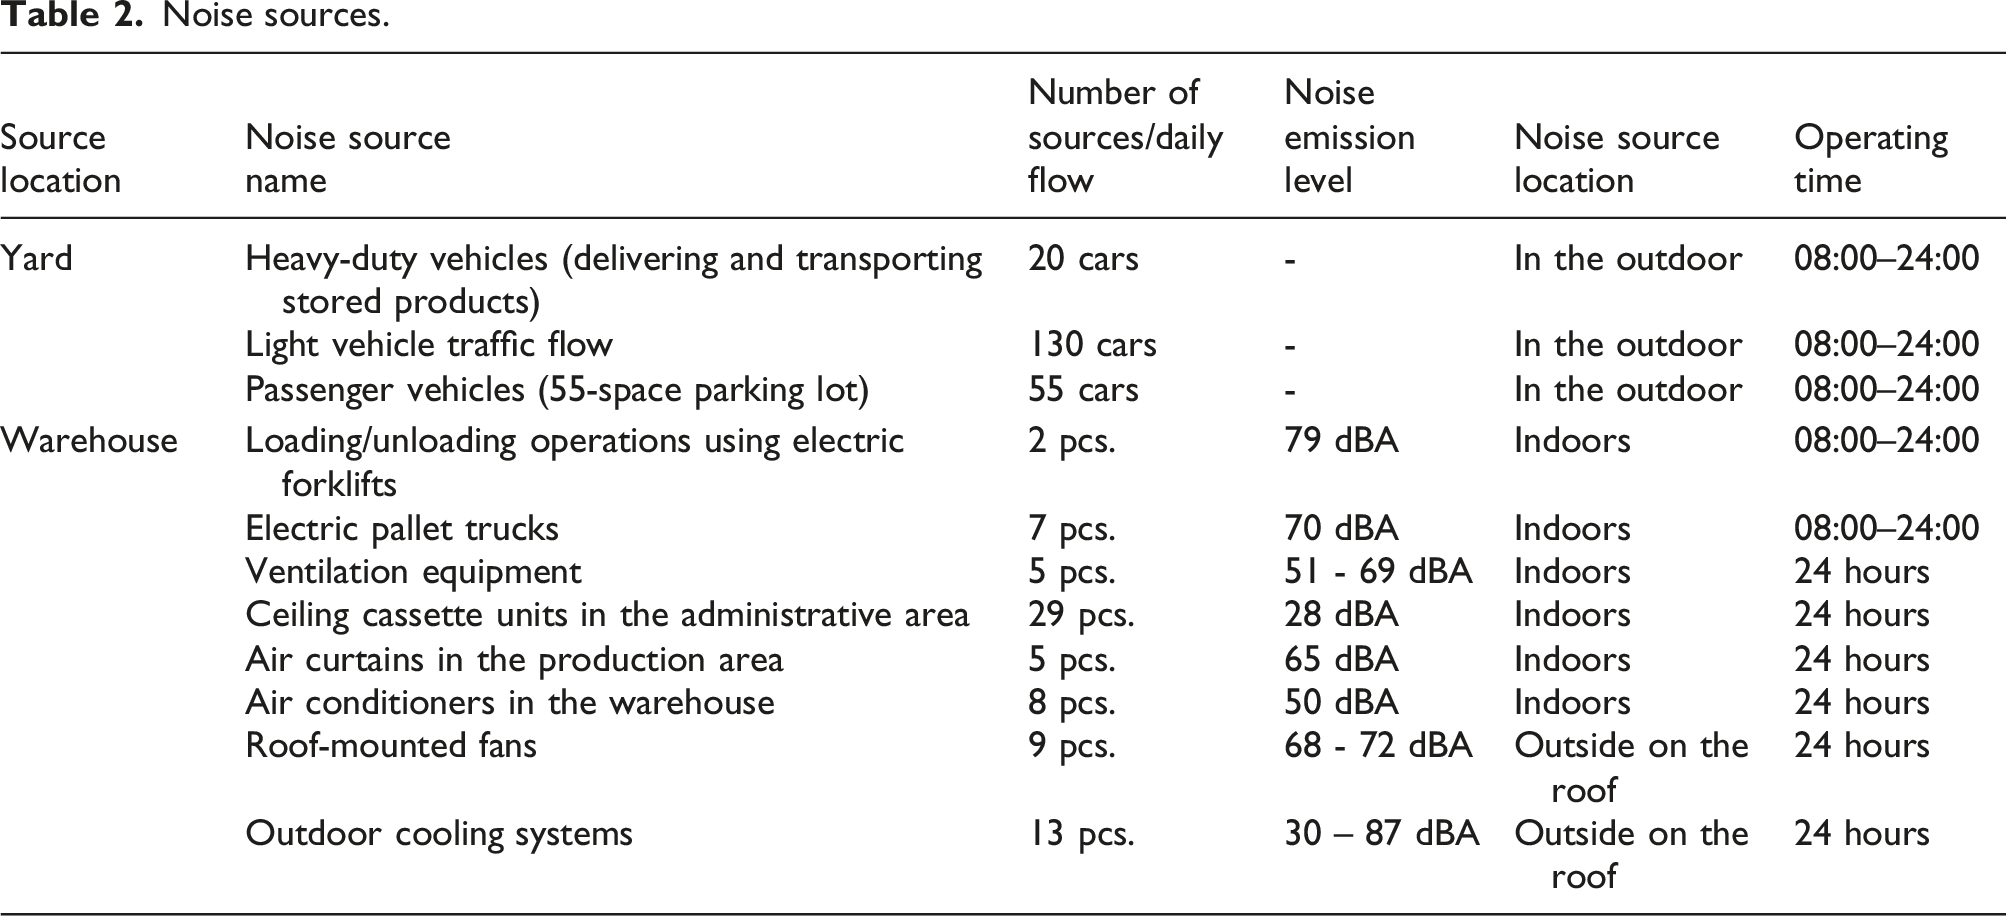
During warehouse operation at maximum production capacity, approximately 20 heavy-duty vehicles and about 130 passenger cars enter and leave the site per day (between 08:00 and 24:00), of which around 20 passenger cars per day arrive specifically at the warehouse. Employee transport and other arriving passenger vehicles are parked within the company’s premises in parking lots with a total of 55 spaces. The parking lot areas, taking into account the number of parking spaces, are treated as area noise sources.
Inside the warehouse, products are transported using electric forklifts (2 units) and electric pallet trucks (7 units). Based on data provided by various manufacturers, the sound power levels emitted to the environment by electric pallet trucks range from 66 to 70 dBA; therefore, a worst-case scenario was assumed in the calculations.
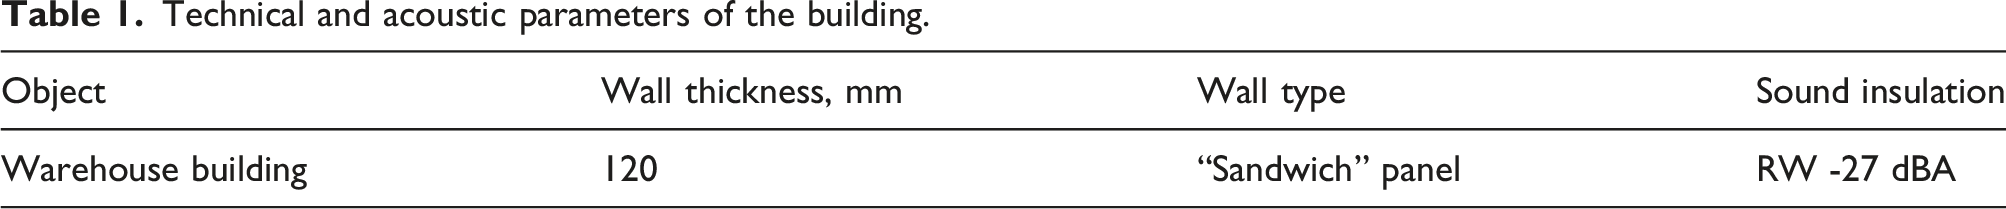
The dominant noise sources within the building are those generated by equipment used in technological processes. These noise sources are located inside the premises; therefore, environmental noise will be effectively attenuated by internal partitions and the enclosed external building envelope, which consists of multilayer wall panels (sandwich-type) with 120 mm PIR insulation infill, glazed units, doors, and gates.
Technical and acoustic parameters of the building.
All equipment within the building is not characterized by high noise levels, as none of the equipment exceeds 85 dBA; however, as a worst-case scenario, a noise level of 85 dBA is assumed in the production area during modeling. This assumption is made because employees work near noisy equipment, and in accordance with the amendment of the Order of the Minister of Social Security and Labour of the Republic of Lithuania and the Minister of Health of the Republic of Lithuania of 15 April 2005 No. A1-103/V-265 “On the Approval of Regulations on the Protection of Employees from Risks Related to Noise,” as amended on 25 June 2013 No. A1-310/V-640 (Vilnius), the upper exposure action value for noise in employees’ work areas, Lex, 8h, must not exceed 85 dBA (Figure 1). Analyzed area and noise sources.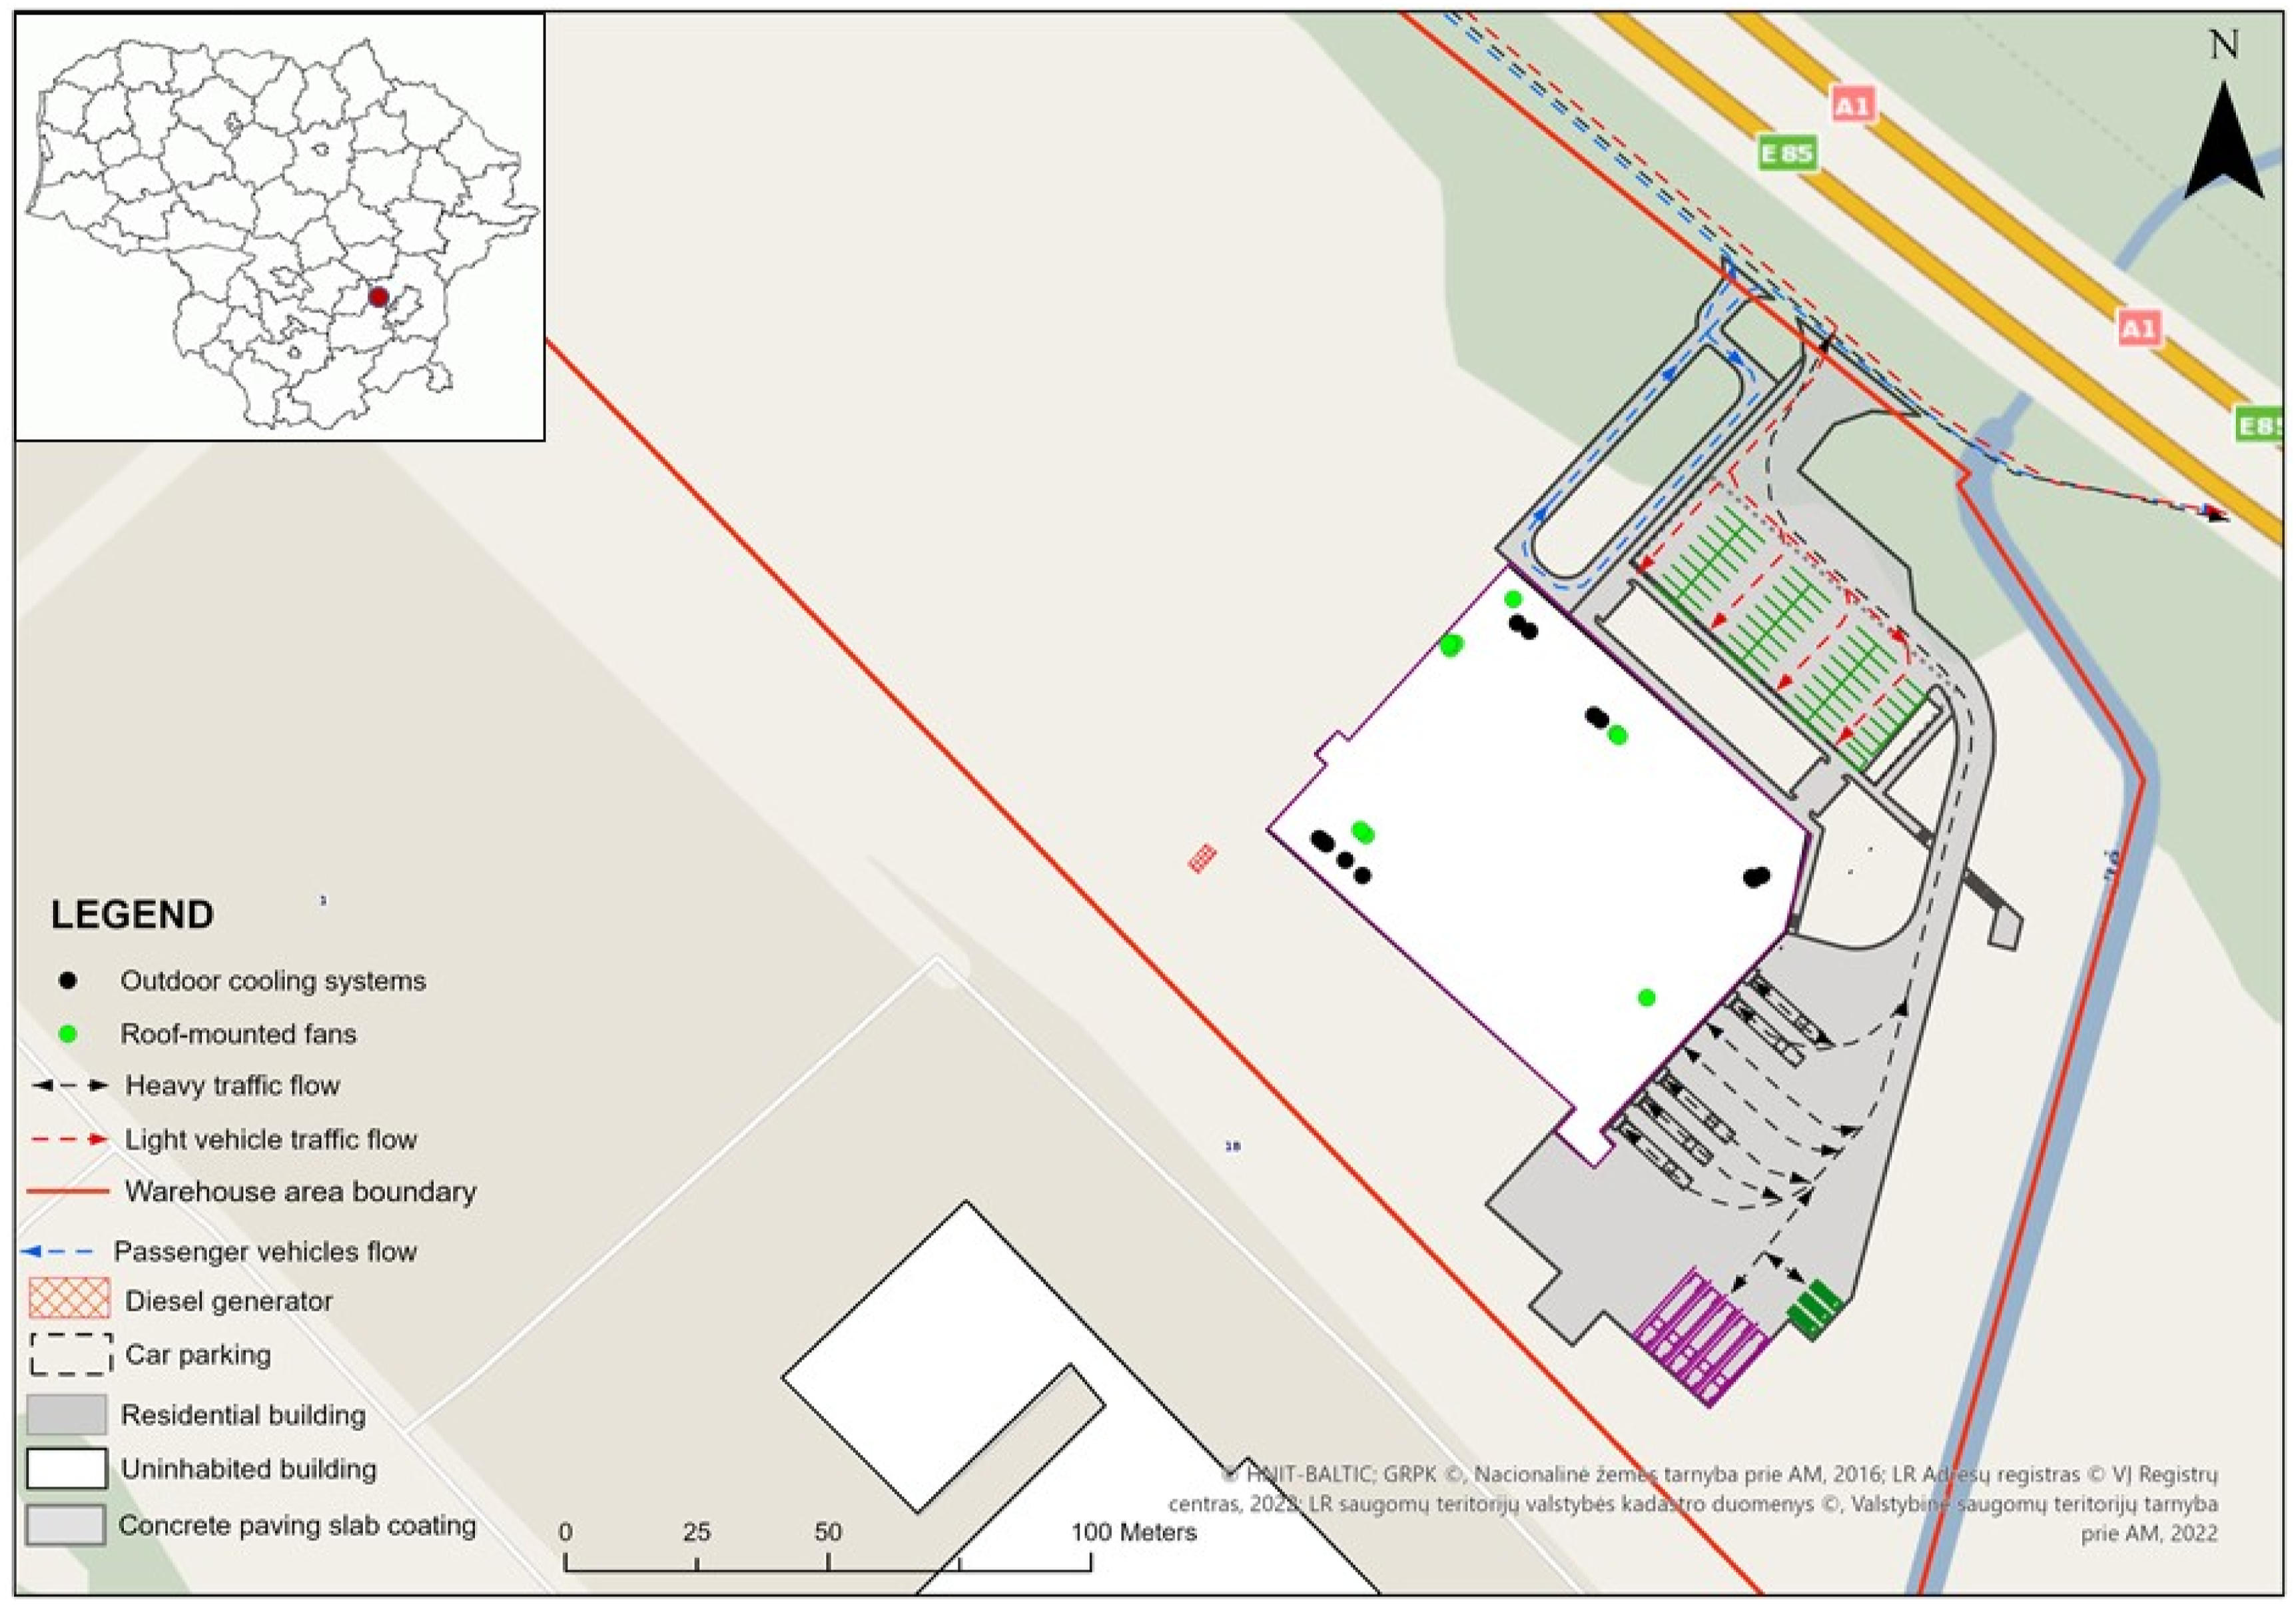
Noise sources.
Residential environment
The nearest residential building is located approximately 73 m from the boundary of the analyzed operational site. Other residential buildings and their protected (residential) areas are situated more than 600 m away; therefore, noise level calculations were performed only for the nearest residential location (see Figure 2). The residential buildings located closest to the warehouse’s operational activities.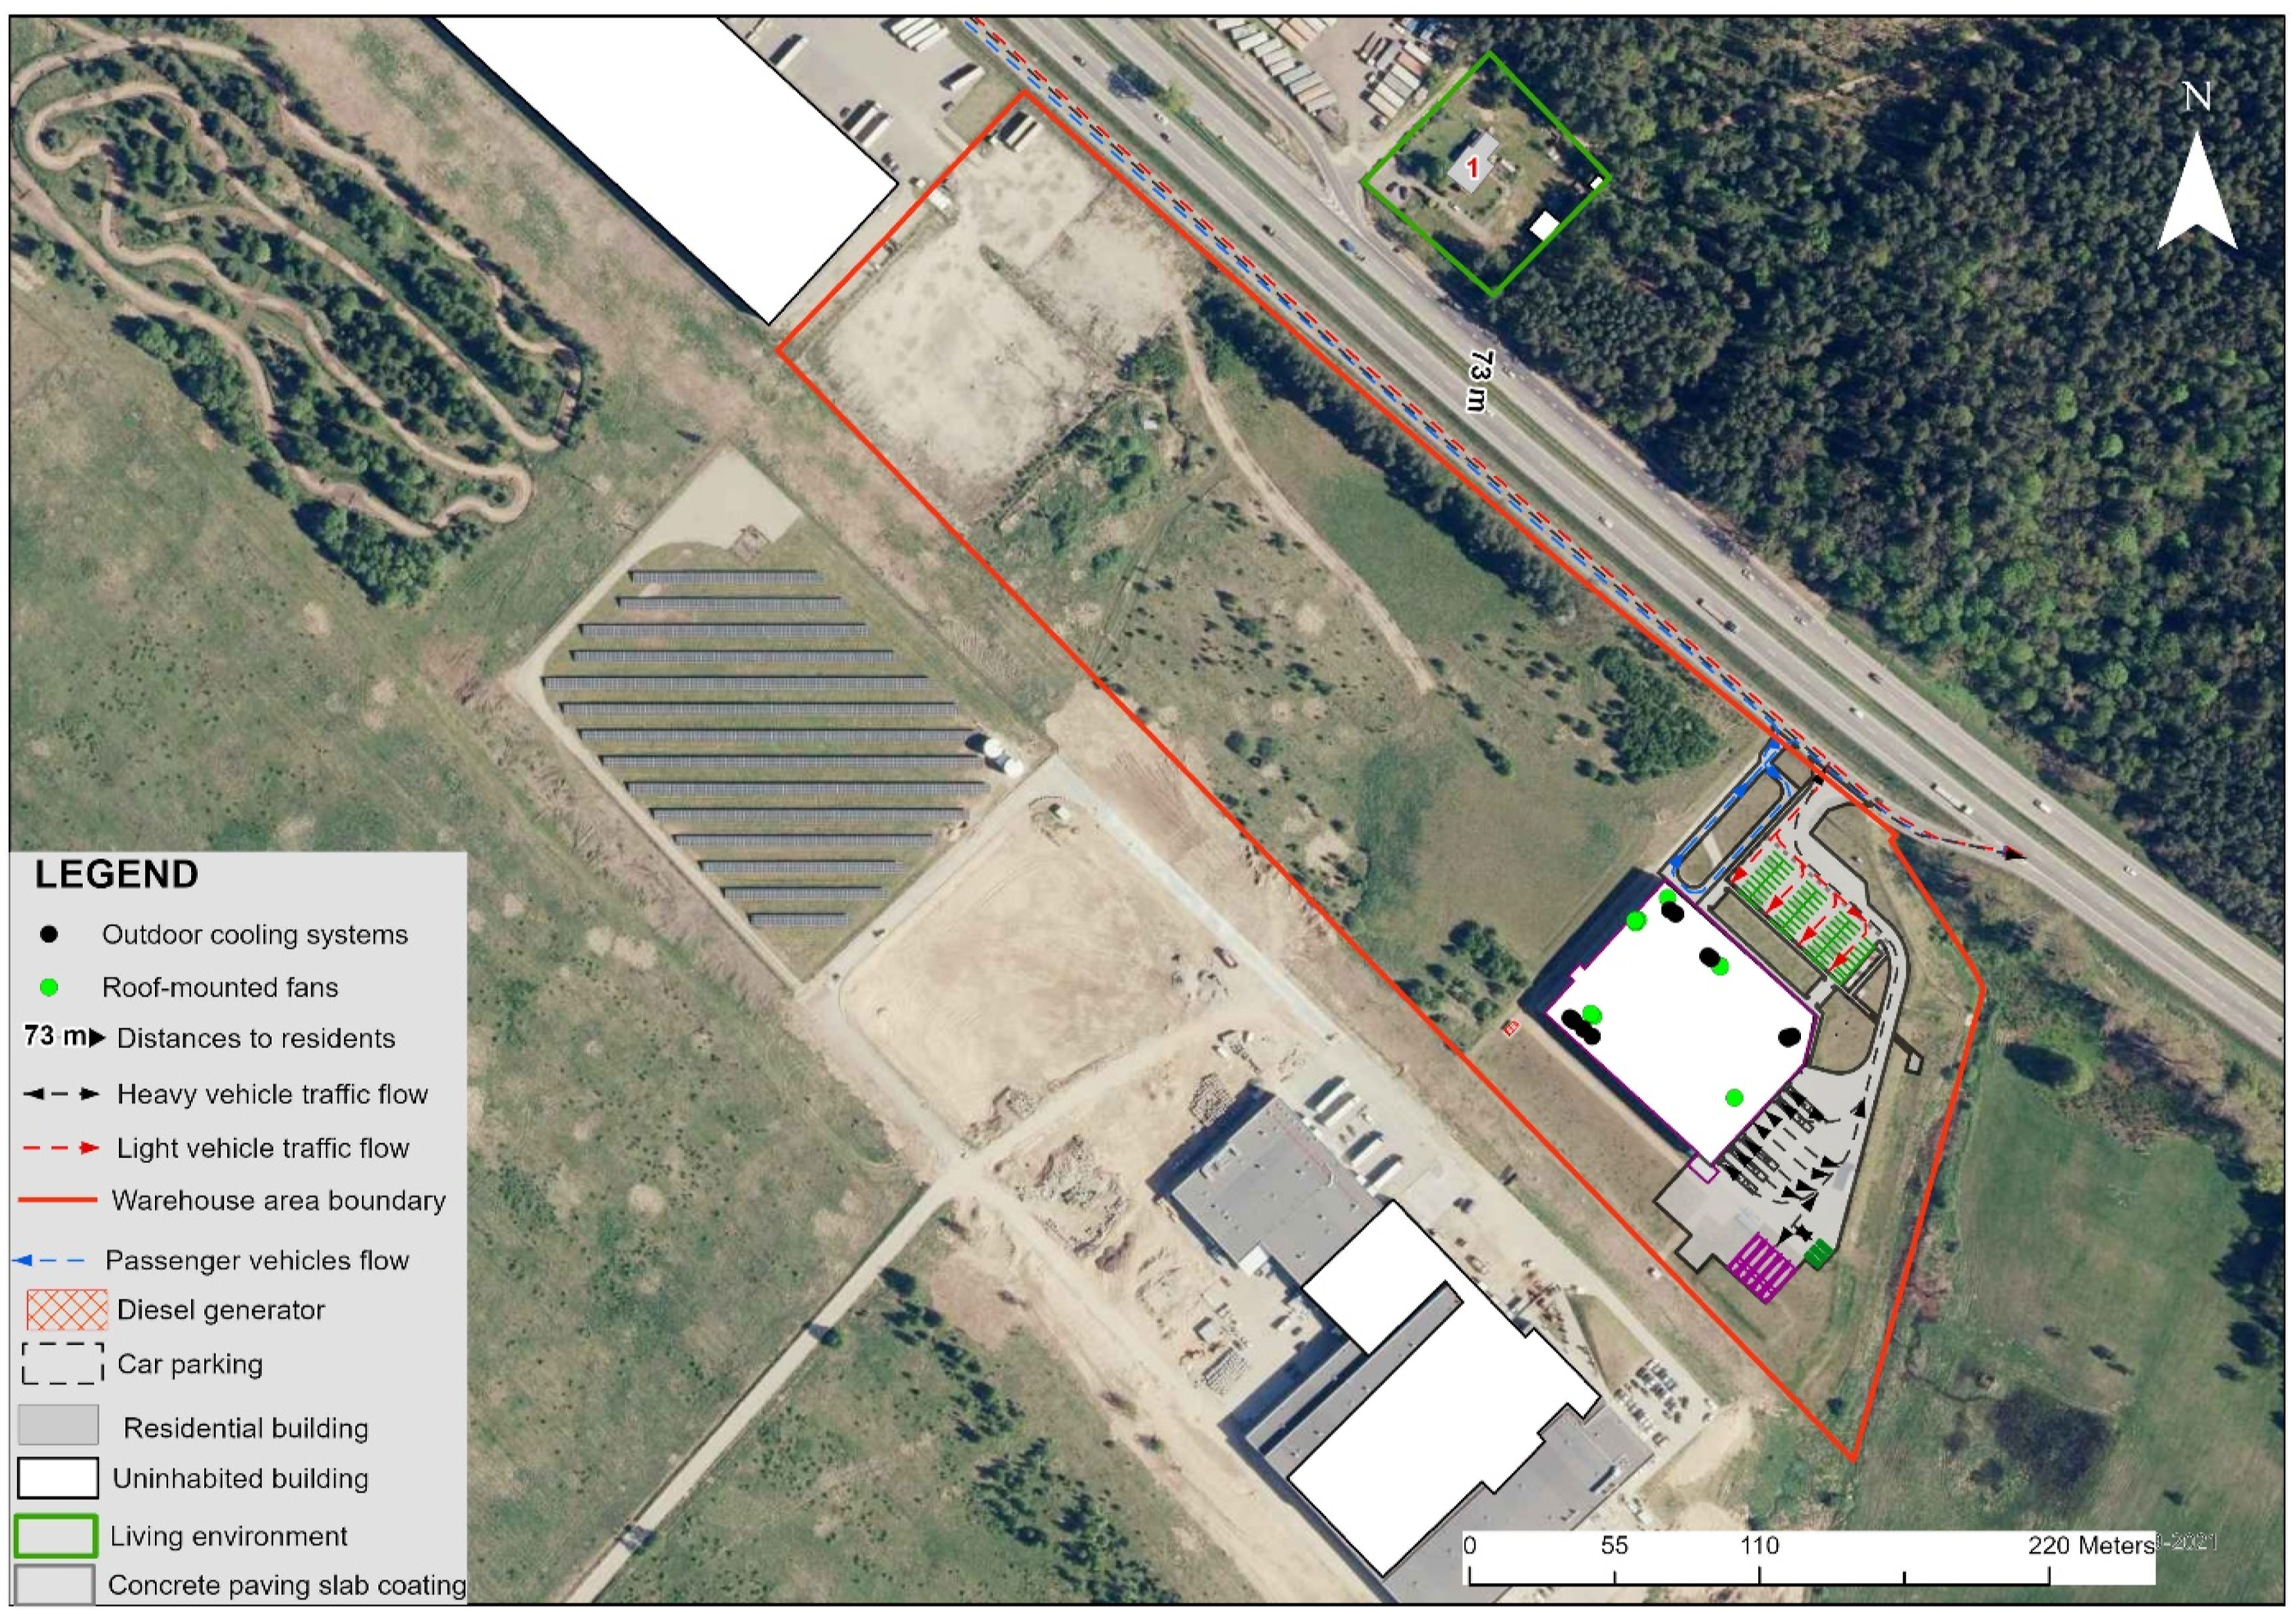
Assessment method
Noise from warehouse operations is evaluated using the Lday, Levening, and Lnight noise indicators.
Terms and conditions of legal documents and recommendations 9 .
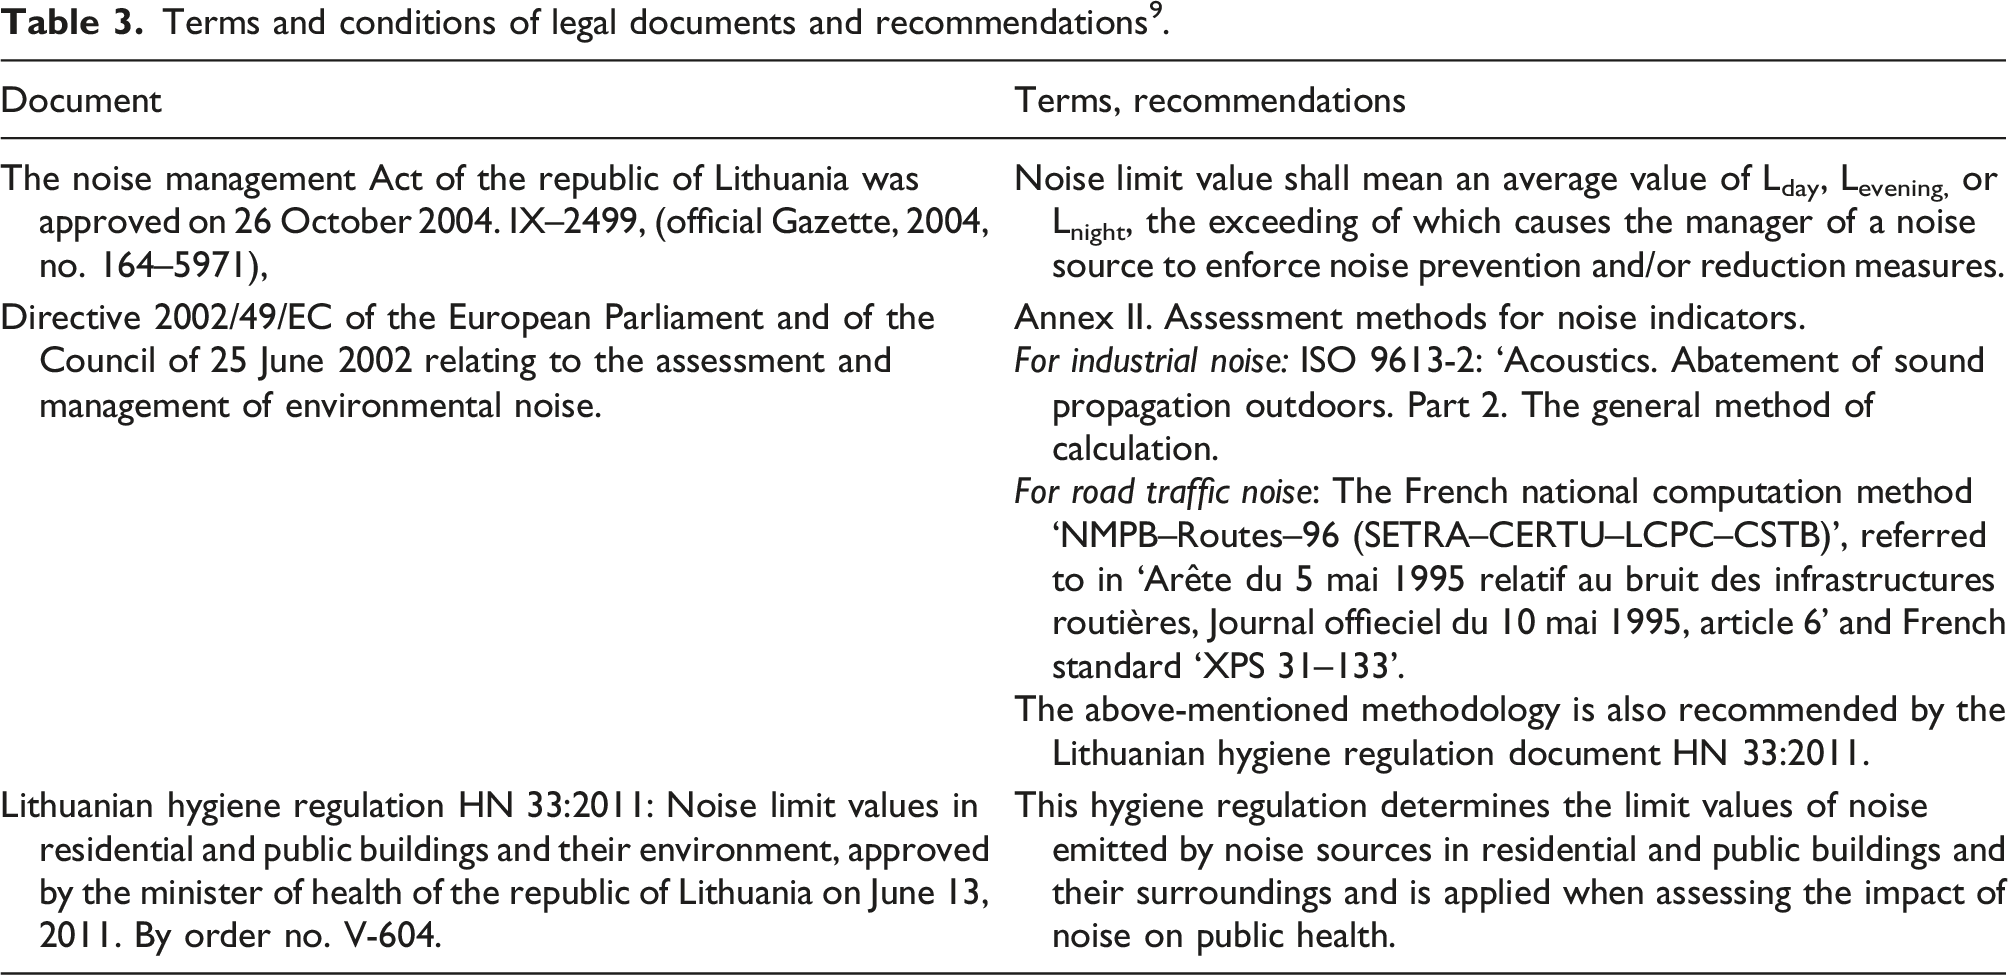
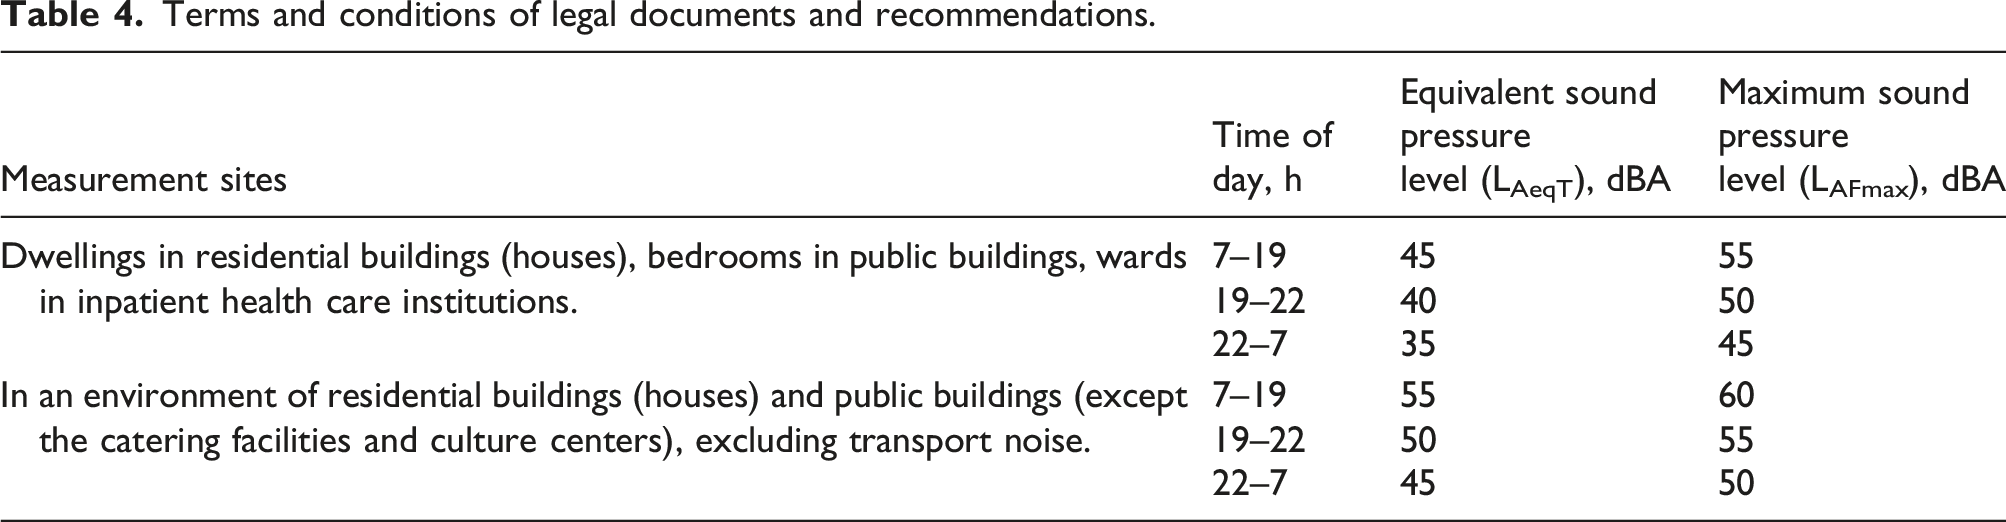
Terms and conditions of legal documents and recommendations.
Data preparation and spatial analysis
Noise calculations were performed using the IMMI software, applying the noise sources listed in Table 2. The calculations took into account building heights, Rw values, terrain, meteorological conditions, and the noise-absorbing properties of the area. The modeled noise indicators were Lday (12 h), Levening (3 h), and Lnight (9 h). The noise generated by the analyzed site was assessed according to the limit values of HN: 33:2011, which are intended for evaluating noise from industrial facilities. The assessment also considered the time of day during which the noise sources operate.
The resulting noise level calculations were visualized on maps using ArcGIS Pro software, with different color intervals representing every 5 dBA. Noise dispersion was calculated at a height of 1.5 m, with a grid resolution of dx = 5 m and dy = 5 m.
The raster statistical indicators (MEAN, MIN, MAX, RANGE, and STD) were used in this study as descriptors of the spatial variability and structural characteristics of the modeled noise field. These indicators were not treated as fully independent environmental predictors, but rather as analytical variables representing local spatial noise dispersion patterns derived from the standardized acoustic model output.
Application of machine learning models
The obtained statistical variables were used as input data in the WEKA software environment to determine the most accurate noise level prediction model. The machine learning analysis performed in this study has a methodological and exploratory character, aiming to evaluate the capability of ML algorithms to identify relationships between raster-derived spatial statistical indicators and modeled environmental noise levels. Five different models were applied in the study: Random Forest, M5P (model trees), Multilayer Perceptron (artificial neural networks), SMOreg, and Linear Regression.
The reliability of the models was evaluated using the correlation coefficient (r) and the mean absolute error (MAE). An attribute importance analysis was conducted using the Correlation Ranking Filter.
Model training and validation
To ensure the reliability of the predictive models and to prevent overfitting, a 10-fold cross-validation procedure was employed for all machine learning algorithms in the WEKA environment. In this process, the dataset was randomly partitioned into ten equal-sized subsamples; nine subsamples were used for training the model, and the remaining single subsample was used for testing. This process was repeated ten times, with each subsample used exactly once as the validation data. The exceptionally high correlation coefficients observed (e.g., r > 0.9984 for Random Forest) are attributed to the deterministic nature of the training data generated by the ISO 9613-2 methodology. Unlike empirical field measurements, which contain stochastic environmental noise and measurement errors, the simulated data follow consistent physical laws that the ML models can learn with high precision. All input features were checked for potential data leakage to ensure that no information from the target variable was present in the training set.
Model Implementation and Hyperparameters
To ensure reproducibility, all machine learning models were implemented in the WEKA (v3.8) environment using the following hyperparameter configurations: • Random Forest: 100 iterations (trees) were used to build the ensemble. No maximum depth limit was set for individual trees to allow the model to capture complex nonlinear relationships in the spatial data. • M5P: This model combined a decision tree with linear regression functions at the leaves. Pruning was enabled to prevent overfitting and ensure the interpretability of the model’s logic. • Multilayer Perceptron (MLP): The architecture consisted of a sigmoid-based hidden layer. The learning rate was set to 0.3, and the momentum to 0.2, with 500 training epochs. Input data were automatically normalized within the WEKA MLP wrapper. • SMOreg: A Support Vector Machine for regression was implemented using a polynomial kernel. Data were normalized by default to ensure the efficiency of the hyperplane separation. • Linear Regression: A standard least-squares approach was used, with an integrated attribute selection method (M5 method) to handle potential multicollinearity between zonal indicators.
Regarding data preprocessing, the Correlation Ranking Filter was applied before training to evaluate the predictive power of the input features. The analysis revealed that RANGE and MAX zonal indicators had the highest information gain (weights of 0.93 and 0.91, respectively), confirming their suitability for the model.
Results
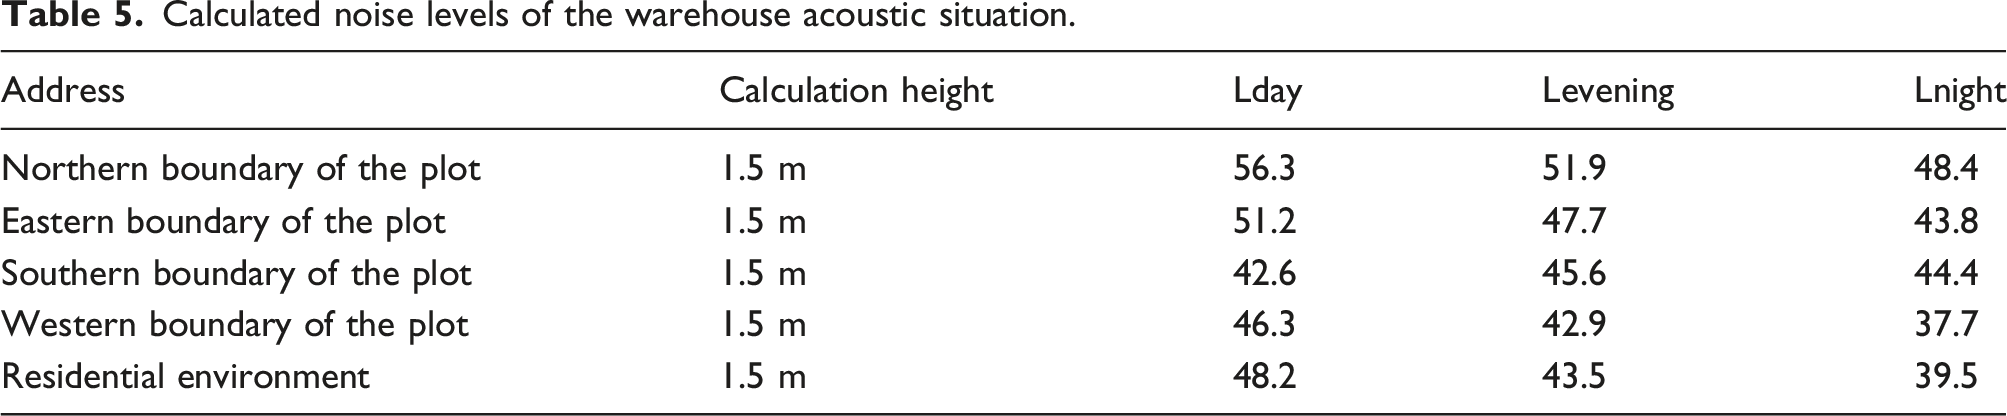
Calculated noise levels of the warehouse acoustic situation.
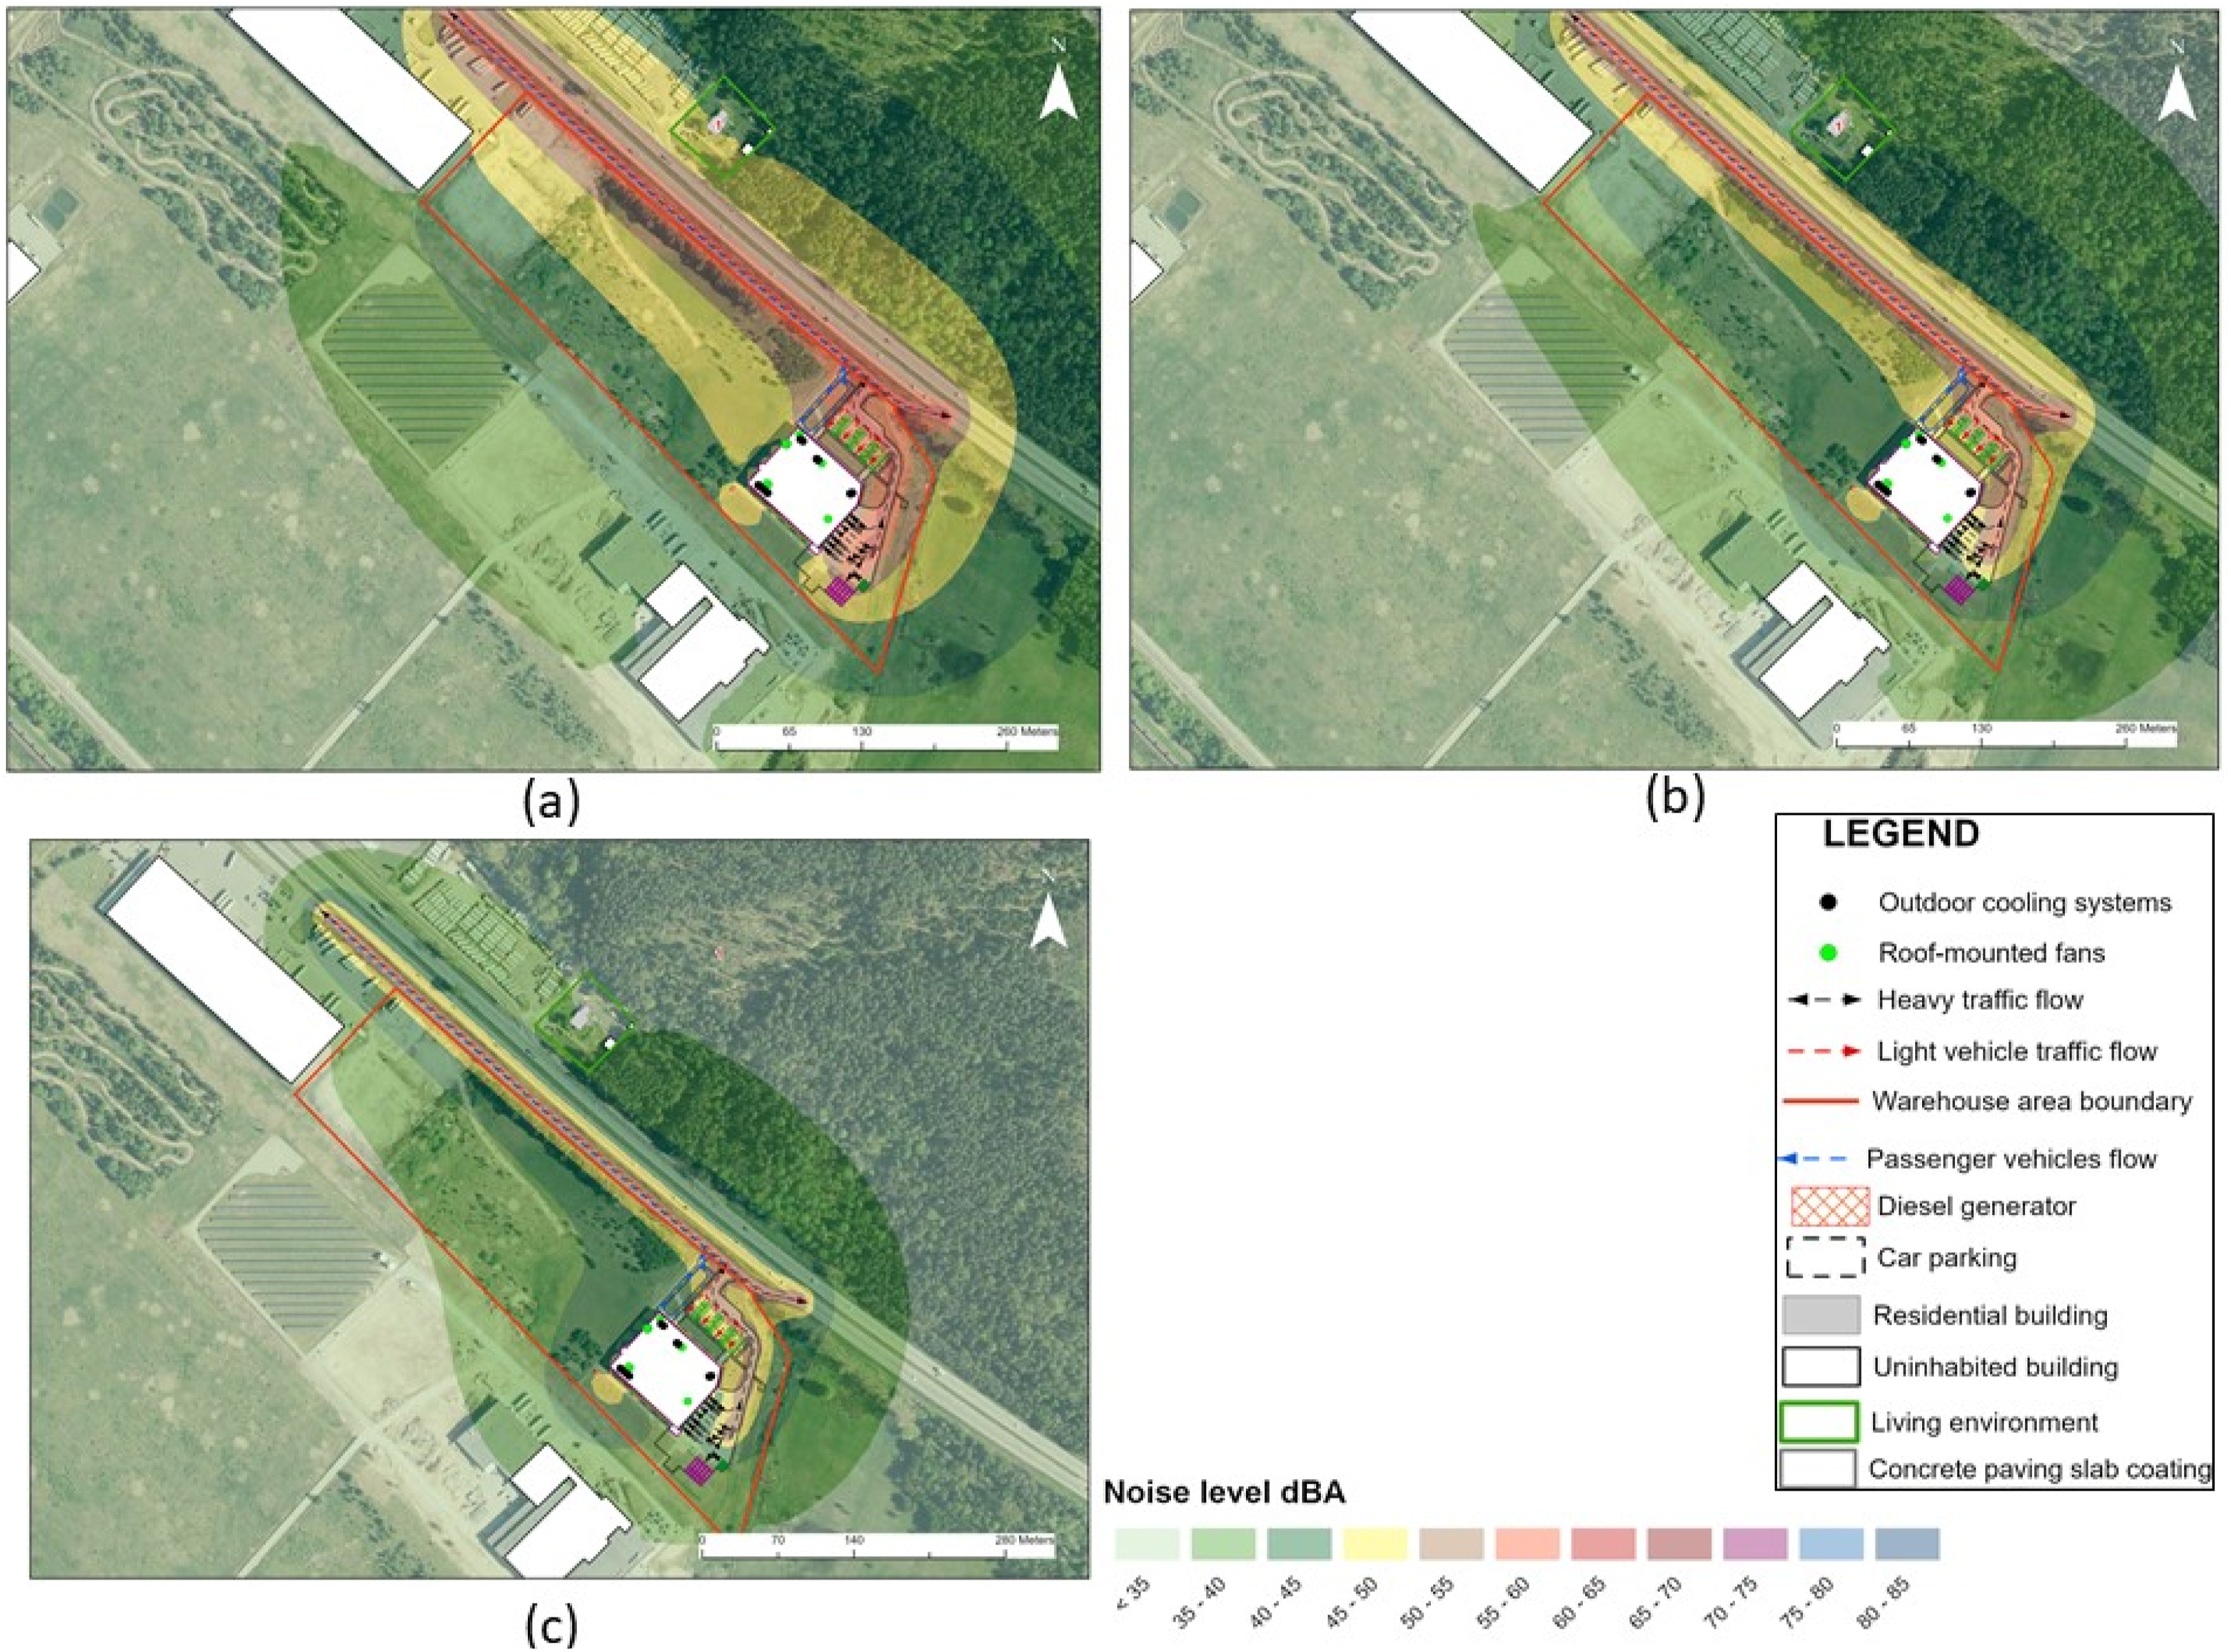
Modeled noise dispersion maps for: (a) Lday, (b) Levening, (c) Lnight.
The machine learning analysis was conducted using a sample of 1808 spatial objects derived from zonal raster statistical indicators. The dependent variable used in the analysis was the level of noise pollution. The following machine learning algorithms were applied: Random Forest, M5P, Multilayer Perceptron, SMOreg, and Linear Regression, all of which demonstrated very high predictive accuracy. In all cases, the correlation coefficient exceeded 0.97, indicating an extremely strong relationship between the independent variables and the predicted noise values.
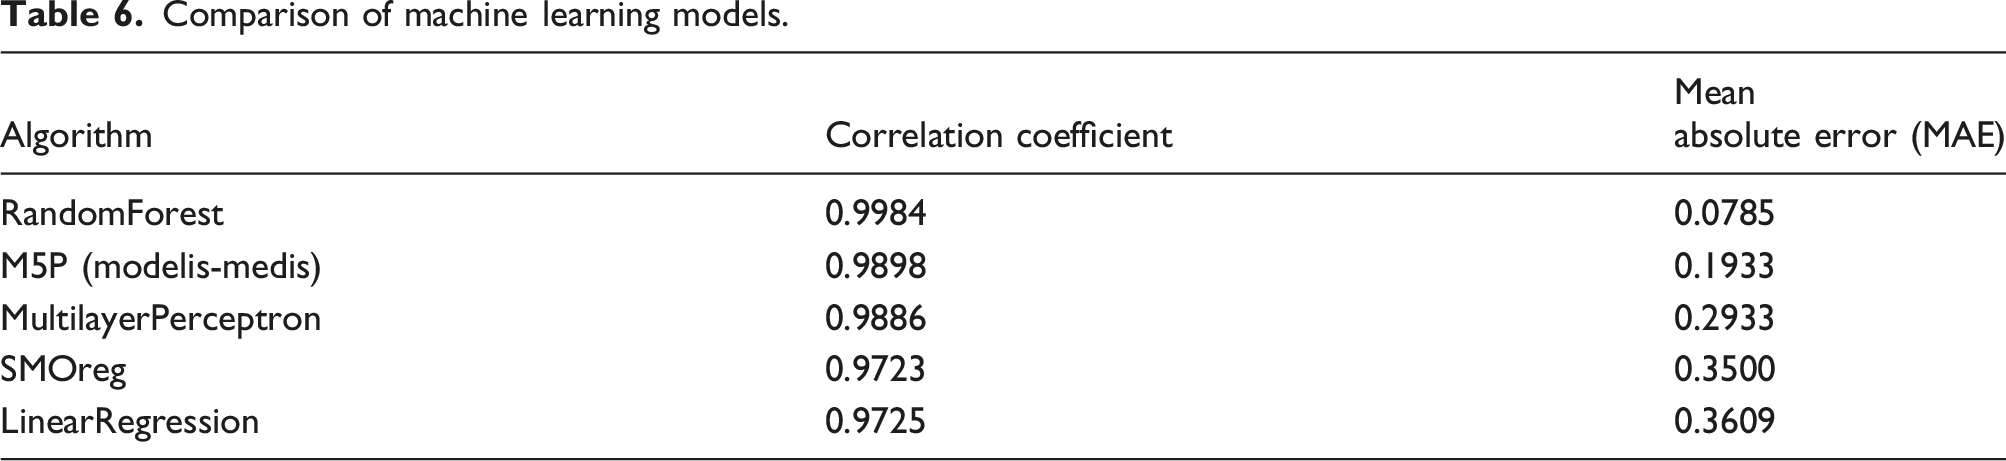
The highest accuracy was achieved using the Random Forest algorithm, which reached a correlation coefficient of 0.9984 and a mean absolute error (MAE) of 0.0785. This demonstrates that raster statistical indicators enable highly accurate prediction of noise levels. The M5P model tree ranked second in terms of accuracy, with a correlation coefficient of 0.9898 and MAE of 0.1933.
The neural network model (Multilayer Perceptron) also showed high accuracy (correlation coefficient of 0.9886); however, its error was higher than that of the tree-based algorithms. The poorest performance was obtained using the Linear Regression model, which achieved the lowest accuracy (correlation coefficient of 0.9725, MAE of 0.3609), indicating that the relationships within the analyzed data are not purely linear.
The comparative analysis performed in this study revealed a clear trend indicating that tree-based algorithms (Random Forest and M5P) describe the spatial patterns of noise pollution more effectively than linear or neural network models. This suggests that non-linear and hierarchical relationships between environmental factors have a significant influence on noise level formation.
Comparison of machine learning models.
The attribute importance analysis conducted using the Correlation Ranking Filter revealed that the value range (RANGE) has the greatest influence on noise pollution levels, with a correlation weight of 0.9316. The second most important indicator was the maximum value (MAX), with a weight of 0.9063.
The structure of the M5P model tree showed that the primary data-splitting criterion is RANGE ≤11.45. This enables the identification of two fundamentally different zones: areas with low value dispersion and areas with high dispersion.
In high-dispersion zones, the model becomes particularly sensitive to maximum values (MAX), indicating that extreme noise peaks in such areas play a decisive role in determining the overall noise level. In low-dispersion zones, predictions were more accurate, with minimal error.
The obtained results confirm that the spatial patterns of noise pollution can be modeled with very high accuracy using zonal raster statistical indicators and advanced machine learning methods. Tree-based algorithms proved to be especially effective, as they are capable of capturing both non-linear relationships and clear rule-based logical structures.10–14
Discussion
The noise pollution model proposed in this study, based on the application of spatial raster statistical indicators and machine learning methods, demonstrated high predictive accuracy, particularly through the use of Random Forest and the M5P decision tree. Analysis of the results revealed that non-linear models are more effective at capturing complex noise dispersion patterns than linear models, aligning with observations by other researchers regarding the superiority of non-linear methods in noise modeling. 15
Similar to our study, Random Forest-based methods are frequently identified as effective for predicting noise levels. Research combining GIS with Random Forest and Gradient Boosting exhibits higher predictive accuracy than traditional regression techniques, especially when spatial and topographical variables are incorporated into the model. 4 This indicates that such models better capture complex spatial noise dispersion patterns and may be more useful in practical urban noise studies. 16
Another significant study 2 introduced a hybrid noise prediction method that combines dispersion models with machine learning models, such as Random Forest, to improve predictions of spatial noise distribution and reduce model errors. This confirms the model’s effectiveness in complex spatial environments where traditional dispersion models may be inaccurate due to complex environmental conditions. 17
The literature also provides examples of applying deep neural networks to model noise propagation in three-dimensional environments. For instance, a study utilizing a model based on convolutional layers achieved a low error rate in noise pressure prediction while significantly reducing computation time compared to traditional methodologies. 8 Although such deep learning methods often require larger datasets and computational resources, their ability to process complex spatial and contextual relationships represents an important direction for development. 18
Another aspect concerns the inclusion of infrastructural factors in noise models. Studies using street view imagery in conjunction with ML models have found that incorporating street environment features improves the predictive accuracy of noise models. Non-linear models like XGBoost can detect critical spatial relationships that traditional analysis methods miss. 19 This suggests that multispectral variables, moving beyond simple dispersion statistics, can significantly improve noise predictions, particularly in urban contexts.
While many authors emphasize the application of ML methods to noise modeling, it is important to note that data quantity and quality are essential prerequisites for success.3,20,21 In most cases, large, diverse, and accurately measured noise monitoring samples are required to achieve high accuracy.1,15,22 In our study, although high predictive indicators were achieved, the accuracy of the ML models also partly depends on the quality of the spatial variables and their alignment with real-world noise source characteristics.
It is important to acknowledge that the raster statistical indicators used as predictor variables were derived from the same modeled noise raster used to define the target variable. Consequently, a degree of redundancy and spatial autocorrelation between predictors and target values is inherently present in the dataset. Therefore, the very high predictive accuracy achieved by several ML models partly reflects these mathematical and spatial relationships rather than completely independent predictive capability.
Future research should consider additional data sources, such as meteorological data or infrastructure parameters, which could further enhance the model’s ability to reflect real noise conditions.2,8,23
In summary, the application of machine learning methods in noise dispersion modeling is an intensively researched field, where neural networks and hybrid solutions are frequently used to improve prediction quality and ensure better spatial noise maps. Our results—specifically the high Although the machine learning models in this study were trained using noise data simulated according to the ISO 9613-2 methodology, this approach serves as a critical first step in validating the integration of zonal raster statistics with predictive algorithms. The use of standardized simulation data allowed for a controlled environment to evaluate the models’ ability to capture non-linear noise propagation patterns without the interference of complex background noise, such as the high-intensity traffic from the nearby A1 highway. This methodology aligns with recent trends where hybrid models are trained on established physical propagation outputs to improve computational efficiency in environmental planning. While field measurements remain the ultimate empirical benchmark, the current analysis demonstrates that ML can effectively replicate the regulatory assessment logic required by standard HN 33:2011. While it is true that the ML models in this study approximate a deterministic dataset generated by the ISO 9613-2 methodology, their added value lies in computational efficiency and diagnostic interpretability. Traditional acoustic modeling in software like IMMI requires detailed 3D spatial data and significant computational time for large-scale territories. In contrast, the trained ML models developed in this study can provide near-instantaneous noise predictions using only 2D zonal raster statistics as inputs. This makes them a highly efficient “proxy model” for rapid urban planning and preliminary environmental impact assessments. Furthermore, by utilizing feature importance analysis, this approach reveals the underlying spatial drivers of noise distribution - such as the critical role of the RANGE indicator - which traditional deterministic models do not explicitly quantify. Thus, the ML integration serves not just as a replication of ISO 9613-2, but as a diagnostic tool that enhances the understanding of spatial-acoustic relationships. The uniqueness of this study lies in the integration of zonal raster statistical indicators with interpretable machine learning models. This approach allows not only for highly accurate noise pollution forecasting but also reveals the role of internal spatial dispersion and extreme values in the process of noise formation.
Study limitations and future perspectives
Despite the high predictive accuracy achieved, this study has several limitations that must be acknowledged. First, the ML models were trained and validated exclusively on simulated data generated by the ISO 9613-2 methodology. While this approach is valid for creating a “digital twin” of standardized noise propagation, it does not account for real-world uncertainties such as fluctuating meteorological conditions or transient background noise that field measurements would capture. Therefore, the reported accuracy reflects the models’ ability to replicate a deterministic standard rather than empirical reality. Second, the current model’s generalization is limited to the specific spatial configuration of the analyzed warehouse site. While the methodological framework - utilizing zonal raster statistics - is highly scalable and could be applied to other industrial contexts, the specific model weights and decision rules (e.g., in the M5P tree) are site-dependent. Future research should focus on integrating multi-site data and in situ acoustic measurements to enhance the models' robustness and evaluate their performance across diverse environmental settings.
Conclusion
Noise dispersion modeling results indicate that the noise generated by the warehouse’s economic activities does not exceed the limit values set by HN 33:2011 at the nearest residential environment (located approximately 73 m away). The noise levels at the residential building reached 48.2 dBA during the day, 43.5 dBA in the evening, and 39.5 dBA at night. The contribution of internal equipment and rooftop units remained negligible, with calculated levels below 25.0 dBA at the receptors.
Random Forest was identified as the most accurate algorithm (r = 0.9984, MAE = 0.0785), making it the most suitable for practical noise level forecasting. The M5P model tree was designated as the optimal solution for result interpretation and rule analysis (r = 0.9898). Tree-based algorithms (Random Forest and M5P) described noise dispersion more effectively than linear or neural models due to their ability to capture non-linear and hierarchical relationships among environmental factors.
Attribute importance analysis revealed that the range of values (RANGE) with a correlation weight of 0.9316 and the maximum value (MAX) with a correlation weight of 0.9063 have the greatest influence on noise pollution levels.
The integration of zonal raster statistical indicators and advanced ML methods is an effective tool for industrial noise analysis. This methodology allows not only for accurate noise prediction but also for a better understanding of its formation mechanisms, which is crucial when planning noise management measures.
The high correlation coefficients achieved (r > 0.97) prove that machine learning models can accurately function as a “digital twin” of the ISO 9613-2:1996 standard, providing a significantly faster alternative for noise prediction during the planning stages of industrial facilities.
It should be noted that these findings are based on a single warehouse case study. While the developed methodological framework - utilizing zonal raster statistics - is scalable and adaptable, the specific predictive rules and noise dispersion patterns identified are site-specific. Therefore, further research involving a wider range of industrial facilities is required to generalize these conclusions to broader industrial contexts.
Despite the reliance on simulated data for model training, this study establishes a robust methodological framework for spatial noise analysis. Future research will focus on integrating in situ noise measurements to further calibrate the models and assess the variance between theoretical propagation and real-world acoustic environments.
Footnotes
Declaration of conflicting interests
The author declared no potential conflicts of interest with respect to the research, authorship, and/or publication of this article.
Funding
The author received no financial support for the research, authorship, and/or publication of this article.