
Abstract
This article explores two heretical thoughts regarding nuclear fusion as an energy source and the Earth’s climate. Nuclear fusion can only contribute to mid-century power by breeding fuel for nuclear fission reactors rather than providing steam to generate electricity. Converting 232Th and 238U to fuel for nuclear fission reactors is much less demanding. Fusion breeding could lead to sustainable, economical, carbon free energy with little or no proliferation risk. The second heretical thought involves climate. Assertions that increasing carbon dioxide in the atmosphere are leading to an environmental crisis can be checked out on the Internet. This paper suggests (1) the benefits of nuclear fusion can be realised long before it can economically generate steam and (2) the Internet search indicates that nothing in the past suggests that future climate will be significantly different before mid-century because of rising levels of CO2.
Introduction
For nearly 20 years, Manheimer 1 has argued that the goal of the controlled fusion project should be shifted to fusion breeding that is the use of fusion neutrons to breed fuel for separate nuclear fission reactors. In the future, civilisation will likely have to shift away from fossil fuel either for reasons of climate, or depletion of a finite resource, or both. He argued that thermal nuclear reactors, as opposed to much more expensive and complicated breeders, are likely to be the power base of future civilisation. However, the available fuel for these is very limited. Almost certainly fossil fuel will last longer in a fossil fuel based economy than nuclear fuel will last in a thermal nuclear reactor based economy. Hence some sort of fuel breeding, either by fission or fusion will become essential.
A series of articles on the subject were written, culminating in a review article, published open access 2 as well as an article solicited for the special issue on strategic opportunities in fusion. 3 Collectively, these articles have well over a hundred references. The crux of the argument is that an economical fusion breeder economy could follow relatively quickly a success by either ITER (the International Tokamak being built in France), NIF (the laser fusion facility in the Lawrence Livermore National Laboratory in Livermore, CA), or both, certainly by mid century or shortly thereafter. A pure fusion economy will take many additional breakthroughs, which might or might not be possible to achieve.
Pure fusion is the use of the 14 MeV fusion neutron’s kinetic energy to boil water. Fusion breeding uses this same kinetic energy to boil water, and what, for want of a better term, we will call the neutron’s potential energy to produce half to three-fourth of a 233U from thorium. However, when this is burned in a conventional nuclear reactor, it produces about 100–150 MeV, effectively increasing the neutron energy by about an order of magnitude. It is this order of magnitude increase in reaction that renders fusion breeding much more achievable than pure fusion. As the nuclear industry is currently configured, using mostly light water reactors (LWRs), less than 1% of the uranium resource and 0% of the thorium is available as nuclear fuel. Either fission breeding or fusion breeding makes nearly the entire resource available. However, as a fuel producer, fusion breeding is about an order of magnitude more prolific than fission breeding, its competitor. To illustrate, a single fusion breeder can fuel five LWRs of equal power. It would take two fission breeders, at maximum breeding rate to fuel one, implying a staggering cost.
In a fusion breeder, it is very important that blanket be a liquid, perhaps a molten salt such as FLiBe, in which some thorium is dissolved. This liquid would flow continually from the fusion reactor to a reprocessing plant, where the tritium and 233U (actually protactinium 233, which decays by beta decay to 233U in a month or so) would be continually removed. Hence, there would be no accumulation of fissile material anywhere near the fusion reactor, and as soon as the 233U is separated out, it is dissolved in 238U, so there is no build up of material with proliferation potential and there is no criticality issue.
It is important to understand that fusion breeding and hybrid fusion are not necessarily synonymous.4,5 Fusion breeding is only one manifestation of hybrid fusion, but it is by far the optimum. More typically, hybrid fusion means a fusion and fission reactor as a single unit. But this would be hopelessly complex and dangerous. A fission reactor is complicated enough, and nobody asserts that a fusion reactor will be simple. Furthermore, such a reactor stores gigajoules of energy (i.e. tons of TNT) in close proximity to a ton or so of plutonium. An uncontrolled quench of the superconducting magnets would be enormously destructive. In such a quench, the magnetic energy is released in some uncontrolled manner. While obviously many precautions are taken, uncontrolled quenches do happen. A few years ago, one occurred at CERN. It took the machine off line for over a year. But CERN is a tunnel tens of miles long. An uncontrolled quench in the confined space of say ITER would undoubtedly destroy the building and much around it, scattering any nearby plutonium all over.
So what will provide the world’s carbon free energy? Is it sustainable solar power (i.e. solar photovoltaic, solar thermal, wind and biofuel)? This is enormously controversial, the believers say it can meet our needs, the skeptics say no. Obviously, this paper will not settle it. However, Manheimer 6 counts himself among the skeptics. In his study, 6 the author analyses the world energy situation and how the needs can be met. Its analysis is very simple and it is not optimistic for solar power. Furthermore, up to this point, sustainable solar power has relied on large government subsidies for its development. However, these subsidies depend on the changeable political will of the countries involved. Without these subsidies, these ‘green’ industries would collapse very quickly, as many already have. More likely the future will be nuclear, as the present already is in France.
Many people claim the science is clear; continuing to emit carbon dioxide (CO2) into the atmosphere will cause such as a disastrous temperature increase, more intense storms, ocean rise, melting ice caps, wildfires, droughts, loss of agricultural productivity and accelerated glacier melt.
It is often claimed that ‘The science is settled’; 97.1% of knowledgeable scientists agree. This is most certainly not so. In the popular press, doubters are often characterised as flat earthers or in the pay of fossil fuel companies. I will not name names here, but could give a long list of extraordinarily qualified scientists who strongly doubt the consensus. This list would include heads or former heads of NASA labs, scientists with endowed chairs at major universities, department chairmen and chairwomen at major universities, scientists who developed the earthbound and space based atmospheric measuring equipment, etc, etc. I will name one person, Frederick Seitz (deceased) former president of the National Academy of Science and president of Rockefeller University. He led a petition drive attempting to get scientists to sign a petition skeptical of man made climate change; it garnered 32,000 signatures. It is not easy to support the 97.1% claim in view of such numbers. Are there really a million scientists willing to put their names on a petition saying that excess CO2 in the atmosphere has a major effect on the earth’s climate? Here is a link to it (http://www.petitionproject.org).
While it is impossible to check out these claims of imminent climate catastrophe by predicting the future, it is relatively simple to check the past. Much of the actual data required are available on websites of respected organisations and can be accessed through a search engine such as Google.
This publication is the attempt of an experienced scientist, although not a climate scientist, to navigate through readily available data to check out these claims. It appears that at least up to now, there is no sign of a planetary emergency from rising CO2 levels in the atmosphere.
This is something anyone can do, and the whole idea is to present data in a way that anyone can check up on what is presented here. All of the graphs presented here are valid measurements. They speak for themselves. There is no need for any expert to interpret and explain them. While this is not characteristic of the way scientific papers do referencing, there is an overwhelming advantage to it for our purposes here. Anyone can do this anywhere, anytime. He does not have to go to say the Library of Congress to and search out a bunch of dusty, obscure journals, journals to which the average person, in the average place, has no access.
However, there is one word of caution. A Google search is not constant. Let’s say one wants to do a Google image search of, for instance, ‘graph of frequency of hurricanes.’ You do it, get your result, and a half hour later you check it again, but now a whole different bunch of graphs show up. Perhaps you slightly changed the wording of your search. Usually their conclusions are not that different, just the graphs are. Several instances in course of preparing this paper, I had to eliminate a graph that seemed particularly convincing and important, because a day or so later, I could not find it again on Google images. To further complicate matters, click on a link, which worked today, but click on it next week, and the link would disappear. Generally, to the extent possible, I have used links of well known organisations, NOAA, NASA, Institute of Energy Research, various government statistics, etc. The graphs presented here did seem to occur regularly in the search, and generally there were many similar graphs to choose from. I have been as careful as possible, and trust no substantial distortion has occurred. For instance in the course of preparing this paper, I presented the editor and reviewer with 6 graphs, from 6 different web sites, of the frequency of strong tornados, all about the same as that presented here. To reiterate, it is simple matter for anyone to check up on what is presented here, and that is the strength of this methodology.
It is important to note, that all such a search can do is give information up to the present, it cannot predict the future. There are many theories that predict disaster if we follow our present course; they may be correct, they may not be. Such a Google search has nothing to say about these predictions of the future. However, it does give an accurate picture of the past and present. Furthermore, often there are obvious extrapolations of present data, which give important indications as well.
This simple search shows that the claims of the believers and alarmists are for the most part wildly exaggerated. It appears there is time to develop fusion breeding without tremendously disrupting society by greatly reducing the use of fossil fuel at this time.
Fusion breeding
The key to fusion breeding’s ability to generate mid-century power is that, as stated in the Introduction, the demands on the fusion reactor, whatever it is, are greatly reduced for fusion breeding as opposed to pure fusion. Fusion is a potentially vital mid-century energy source, but only if its goal is shifted from pure fusion, to fusion breeding. Fusion breeding is not a new idea. Andrei Sakharov and Hans Bethe, two giants of 20th century physics both advocated it7,8 instead of pure fusion.
The development of fusion has proven to be extraordinarily difficult. In its early days, many seemingly promising concepts were carefully considerd and rejected before settling on the tokamak, now the most highly developed device. It has has taken tens of billions of dollars and nearly 50 years of development to get the tokamak to where it is right now. All of this has led to the agreement and start of construction of an international tokamak project ITER. However, if ITER is successful, we will still be very far from having achieved pure fusion.
To see pure fusion’s dilemma, let’s stipulate the best possible outcome from ITER, 9 say it achieves Q = 10 (Q is the ratio of fusion power to driver power, typically microwaves or neutral beams, of whatever the fusion device is), producing 500 MW of fusion power and had the plasma heated and current driven by 50 MW of beams and/or microwaves in the 2030–2035 time frame. While ITER is an experimental device, not power plant, let us imagine a power plant having its parameters. Where would we be as far as energy production goes? Since electricity is typically produced with an efficiency of ∼1/3, the device would produce 170 MWe. However, it needs 50 MW to drive it. But beams and microwaves are not produced with 100% efficiency, again 1/3 is a better estimate, so 150 MWe is needed to drive the tokamak, leaving all of 20 MW for the grid! Of course one could calculate a higher estimate by stipulating higher efficiencies. In fact higher efficinecy power plants have been designed, but is a question of a tradeoff between their cost and efficiency. Up to now, 1/3 is really about right and corresponds to nearly all experience. Furthermore, the total beam and microwave systems used to heat the plasma struggle to reach even that efficiency. Also, given the size and cost of ITER, even if it were fully ignited and took no external power, its size and cost for 170 MWe would still render the device totally uneconomical.
To make pure fusion economically feasible, first of all, ITER’s Q would have to be increased by at least a factor of 3 or 4. Secondly, the device would have to be made smaller and cheaper while increasing the power by at least a factor of 5 or 6 (a typical power plant has about 3 GW thermal and about 1 GW electric power). As we will see, this means a tokamak would have to operate in physics regimes far beyond what it has operated in successfully so far. Finally since the device would be both smaller and more powerful, the neutron wall loading would be at least an order of magnitude greater. These are not minor details, they would take decades and billions of dollars, assuming they could be done at all. At best pure fusion could be a 22nd century power source. But the need is for carbon free power much sooner.
An obvious question then is whether one can sufficiently improve tokamak performance. Unfortunately, the answer is probably not. Tokamak performance is constrained by at least three restrictions which we have called conservative design rules (CDRs). These limit the current, density and pressure. These have been fully discussed in Manheimer.2,3 They are not controversial, they are well grounded in theory and have been extensively confirmed by experiment as discussed in the references. The maximum fusion power produced by JET 10 and TFTR 11 are about half of the maximum that CDRs would specify. 2 The same is true for the design powers of both ITER 9 and the original large ITER. 12 It is also true of the design power of ARC 13 a tokamak proposed by MIT based on new high temperature superconducitng, demountable magnets. The tokamak community has been loath to admit the combined effect of these constraints on power, even though individually, each constraint is well known. However, recently Friedberg et al. 14 have come to a similar conclusion. If tokamaks remain constrained by conservative design rules, they are very unlikely to develop into economical pure fusion reactors. A tokamak, which is a pure fusion reactor, would have to operate well beyond the constraints imposed by CDRs. However, a tokamak breeder could operate within these constraints. Tokamaks could almost certainly develop into breeders, likely by mid century, assuming ITER is successful.
The next obvious question is whether some alternate confinement configuration would work better. Again the answer is probably not. Manheimer 2 compares tokamaks with many other confinement configurations as measured by several metrics. With the possible exception of a stellarator, which is way behind the tokamak, every other configuration is way, way behind. The Japanese have built a stellarator, large helical device (LHD), 15 about the same size as their tokamak, JT-60. 16 However, its fusion rate is about 1/40 of JT-60, and its energy contained is just about 15%. Very briefly, a tokamak is a two-dimensional configuration, having azimuthal symmetry. A current driven in the plasma maintains the equilibrium. A stellarator is a three-dimensional configuration, one much more difficult to both construct and analyse, and which almost certainly has more loss channels than a tokamak. External magnetic fields maintain the plasma equilibrium. There are two reasons fusion plasmas might disrupt, current and pressure gradient. A tokamak has both, a stellarator has no current. Hence, it is likely that steady-state operation will be easier in a stellarator than in a tokamak. It will be very interesting to see what the Germans accomplish as they bring their Wendelstein 7 stellarator on line. 17 All other fusion devices (i.e. STs, magnetic mirrors, etc.) have fusion rates 3, 4 and 5 orders of magnitude less than a tokamak. 2 Surely, it would take additional billions of dollars and decades to bring one of these to where tokamaks are now, assuming it were possible to do so at all.
While it is always possible that a genius can invent a fusion device in his or her garage, the review article 2 expresses skepticism as to whether supporting fusion by venture capital, 18 which is all the rage these days is a viable approach. Does the private sector really have the billions of dollars, and patience for the decades it will take, to develop such a speculative concept? If so, this author can only wish them luck.
Fusion breeding envisions an energy infrastructure called ‘The Energy Park.’ In it, there is one fusion reactor fueling for instance five LWRs. The fusion breeder produces 233U, but this is immediately diluted with 238U so there is no proliferation or criticality risk from the fuel. As the wastes from these are discharged every year, the transuranic elements, those with atomic number greater than 92, principally plutonium and americium, but others as well (i.e. those with proliferation risk) are separated out and burned in a single fast neutron reactor of about equal power, for instance the integral fast reactor (IFR), which has been developed at the Argonne National Lab.19,20 This and the breeding of 233U would be done behind a high security fence. The British are now building a much more powerful version of an IFR now with the specific purpose of treating their large plutonium stockpile. 21 If a more advanced thermal nuclear reactor is used instead of an LWR, perhaps the CANDU (Canadian Deuterium uranium) developed by the Canadians, 22 or perhaps a molten salt reactor (MSR), originally developed by Oak Ridge National Laboratory, 23 the requirements on both the fusion reactor and IFR in the energy park could be relaxed. It is worth pointing out that a Korean company ThorCon is now attempting to market an advanced MSR, which it claims will be able, in many circumstances, to sell electric power cheaper than a coal fired generator can. 24 In the energy park, there is neither long-term storage, nor long distance travel of any material with proliferation potential, and it is all destroyed in the park. Only fission products would be retained there. These are intermediate atomic number elements, many of which are produced, for instance Strontium 90, Barium 137, etc. These typically have half-life of 30 years of less. Some have commercial value and would be separated out and sold. The rest would be stored for 300–500 years until they become inert. This is a time scale human society can reasonably plan for. It is far different from storing for instance plutonium, in say Yucca Mountain, where one must be concerned with storage for a million years or so.
To view the energy park in the most extremely simple way, for illustrative purposes, only thorium comes into the energy park to be burned, and only about 7 GW electric power, and/or manufactured liquid or gaseous fuel, for instance hydrogen, ammonia, gasoline goes out. Figure 1 is a schematic of the energy park. It is more than a dream, but much less than a careful plan.
The energy park: A. low security fence; B. 5 thermal nuclear reactors, LWRs or more advanced reactors; C. output electricity; D. manufactured fuel pipeline, E. cooling pool for storage of highly radioactive fission products for 300–500 years necessary for them to become inert; F. liquid or gaseous fuel factory; G. high security fence, everything with proliferation risk, during the short time before it is diluted or burned, is behind this high security fence; H. separation plant. This separates the material discharged from the reactors (A) into fission products and transuranic elements. Fission products go to storage (E), transuranic elements got to (I); I, the IFR or other fast neutron reactor where actinides like plutonium are burned; J. the fusion breeder.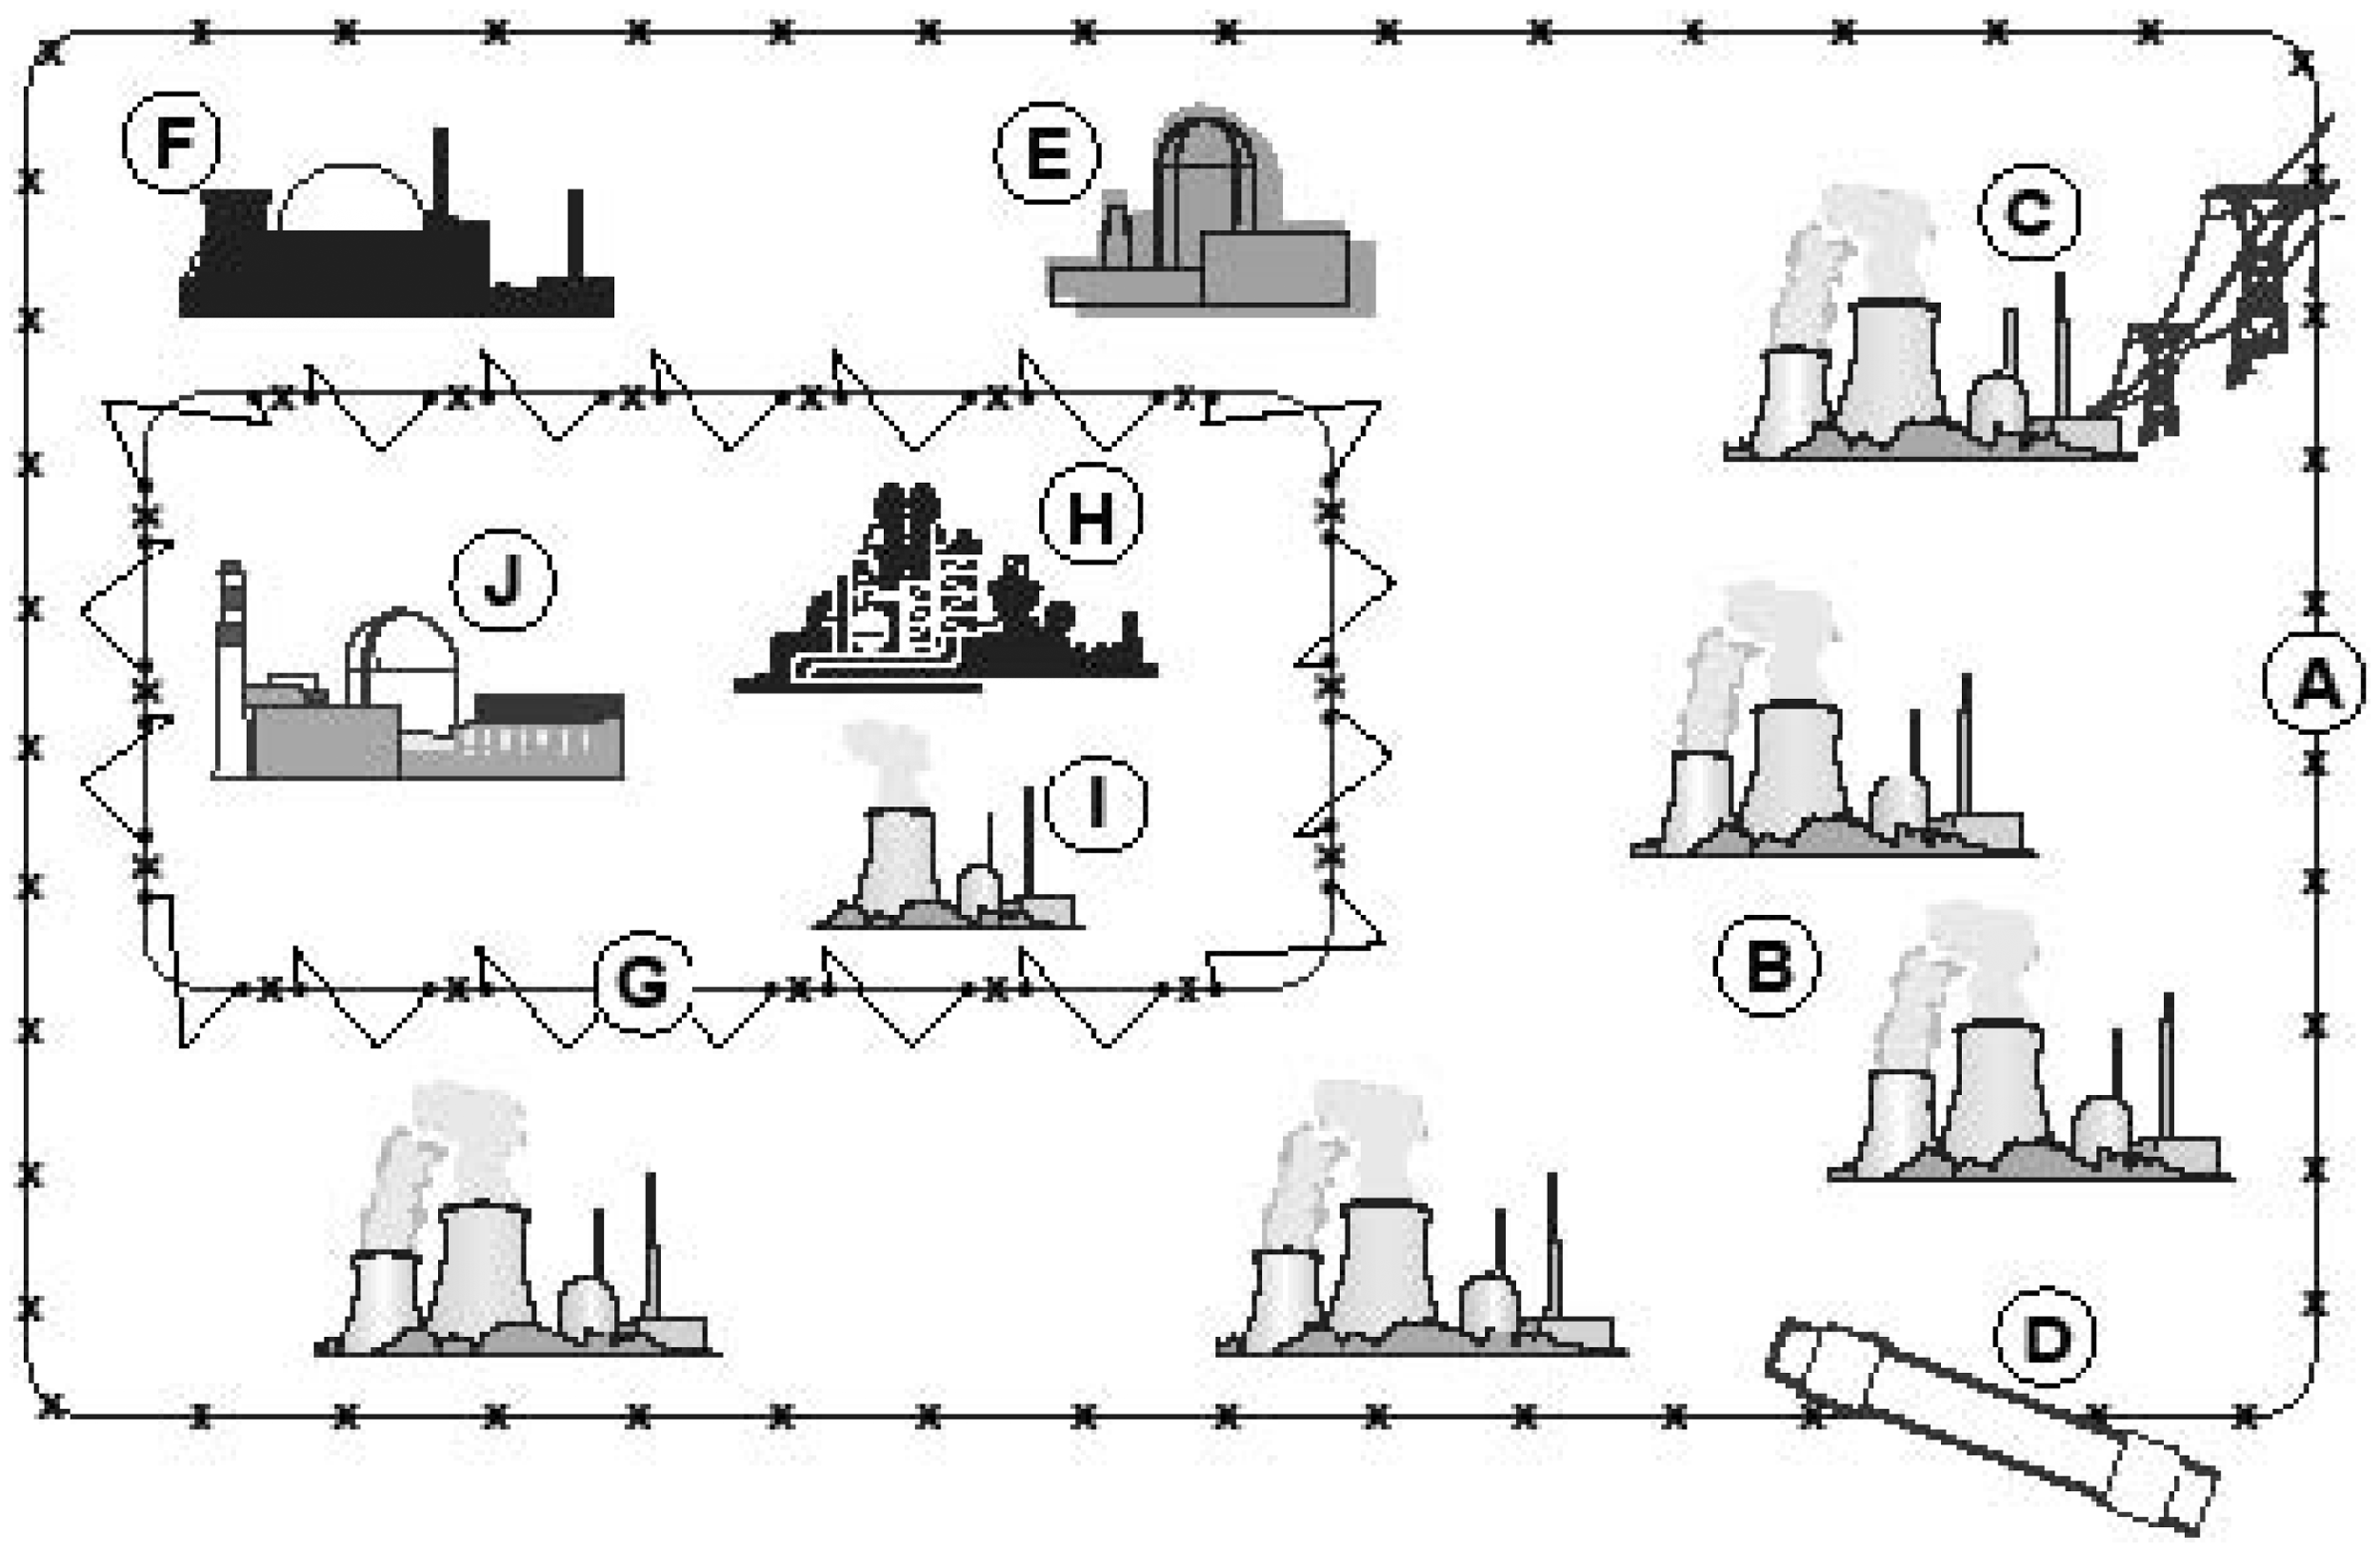
It is entirely possible that the world could build several hundred to a thousand energy parks by mid century or not too long thereafter. It would be a sustainable, economically and environmentally sound energy infrastructure with no proliferation risk. All except the fusion breeder exist now or are being actively developed. Several energy parks, but without the fusion breeder and transuranic element burner exist now in Canada 22 and Japan. 25 However, currently this is neither a sustainable, nor an environmentally sound energy infrastructure. The supply of fissile material is limited to less than 1% of the potential energy resource, and the transuranic wastes build up. The fusion breeder would solve the first problem; the IFR, the second.
The Paris agreement
Seemingly the Paris agreement indicates that the world is united on the need to reduce CO2 input into the atmosphere, sooner rather than later. 26
Among other things, the agreement states: ‘Also recognizing that deep reductions in global emissions will be required in order to achieve the ultimate objective of the Convention and emphasizing the need for urgency in addressing climate change,…(and)… holding the increase in the global average temperature to well below 2℃ above pre- industrial levels and pursuing efforts to limit the temperature increase to 1.5℃….’ This statement assumes that there is a causal, well-understood formula relating CO2 in the atmosphere to temperature rise. Also it assumes that an increase of 1.5℃, or at most 2° will be calamitous.
Where the temperature has already risen by one degree centigrade since the start of the industrial age, and there is no sign of any impending calamity, will another half degree really produce one? In fact, in all likelihood, this 1° rise has been beneficial. Over the millennia of human civilisation, warm periods have been beneficial; cold, harmful. If a degree and a half rise would cause a calamity, I would think that there would be unmistakable signs of it once the temperature rose by 1°.
Notice that the UN agreement gives no recognition to the role fossil fuel has played in advancing modern civilisation; ‘global emissions’ instead are portrayed as something more like smoking, something one can just quit. There is no recognition of the fact that without fossil fuel, or a different energy source available at about the same quantity and price, the world will sink back into abject poverty, for all but the privileged few, as had been humanity’s fate for most of its existence. The Paris agreement considers only one part of an enormously complex problem. Other parts of it, namely getting the energy needed to power civilization are ignored. One cannot solve a major problem by solving only half of it, any more than the French solved their problem in 1940 by building half a wall. No recognition that even if their assessment of the climate threat is correct, there are competing priorities. No recognition that these competing priorities would have to be balanced in some way. No recognition that it is extremely unlikely that what it calls sustainable power (solar thermal, solar photovoltaic, wind and biofuel) can come anywhere near filling the void the agreement is attempting to create. No recognition of the wisdom of Richard Feynman when he said regarding the Challenger disaster: ‘For a successful technology reality must take precedence over public relations, for nature cannot be fooled.’
But the main question is whether the Paris agreement has its facts and assertions right. It is demanding a BIG change in lifestyle for all of us. Is this really necessary, or are they shouting FIRE in a crowded theater?
The world temperature record
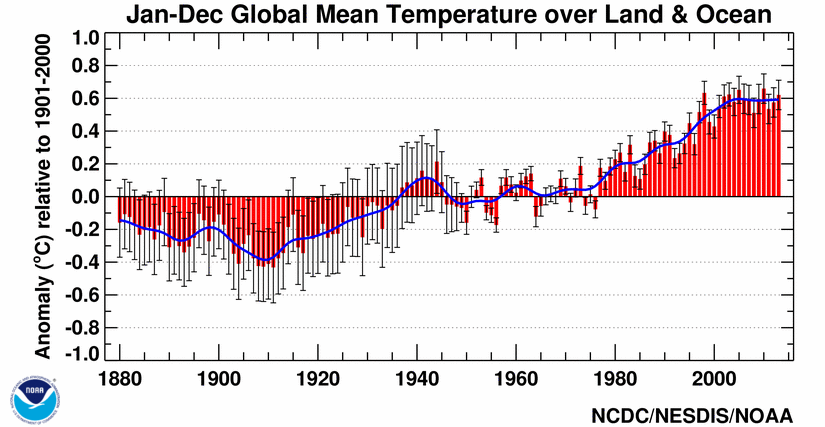
Let us now discuss the world temperature record. Until recently NOAA had published
27
a temperature graph form about 1860 to the present as shown in Figure 2. These take the results of many worldwide meteorological stations, and in some way average their results, to get this curve. The must carefully take into account where the measuring stations are, urban or rural, near lakes or factories, desert or ocean, field or forest, etc. However, there are also space-based temperature measurements. These have the advantage that they are from single suite of instruments that take nearly simultaneous measurements of the temperature of the entire earth. City or field, it does not matter, the space-based instrument averages over it all properly. The space-based temperature measurement
28
is shown in Figure 3.
NOAA data on ground-based worldwide temperature measurements showing a recent 20-year hiatus in warming. The temperature has risen about one degree centigrade since the start of the industrial age. NASA data on space-based temperature measurements. Raw data is in blue, a 13 month average showing a rough 5-year oscillation is in red, and a rough 45-year oscillation in black. At this point, neither gives strong support to a global warming hypothesis.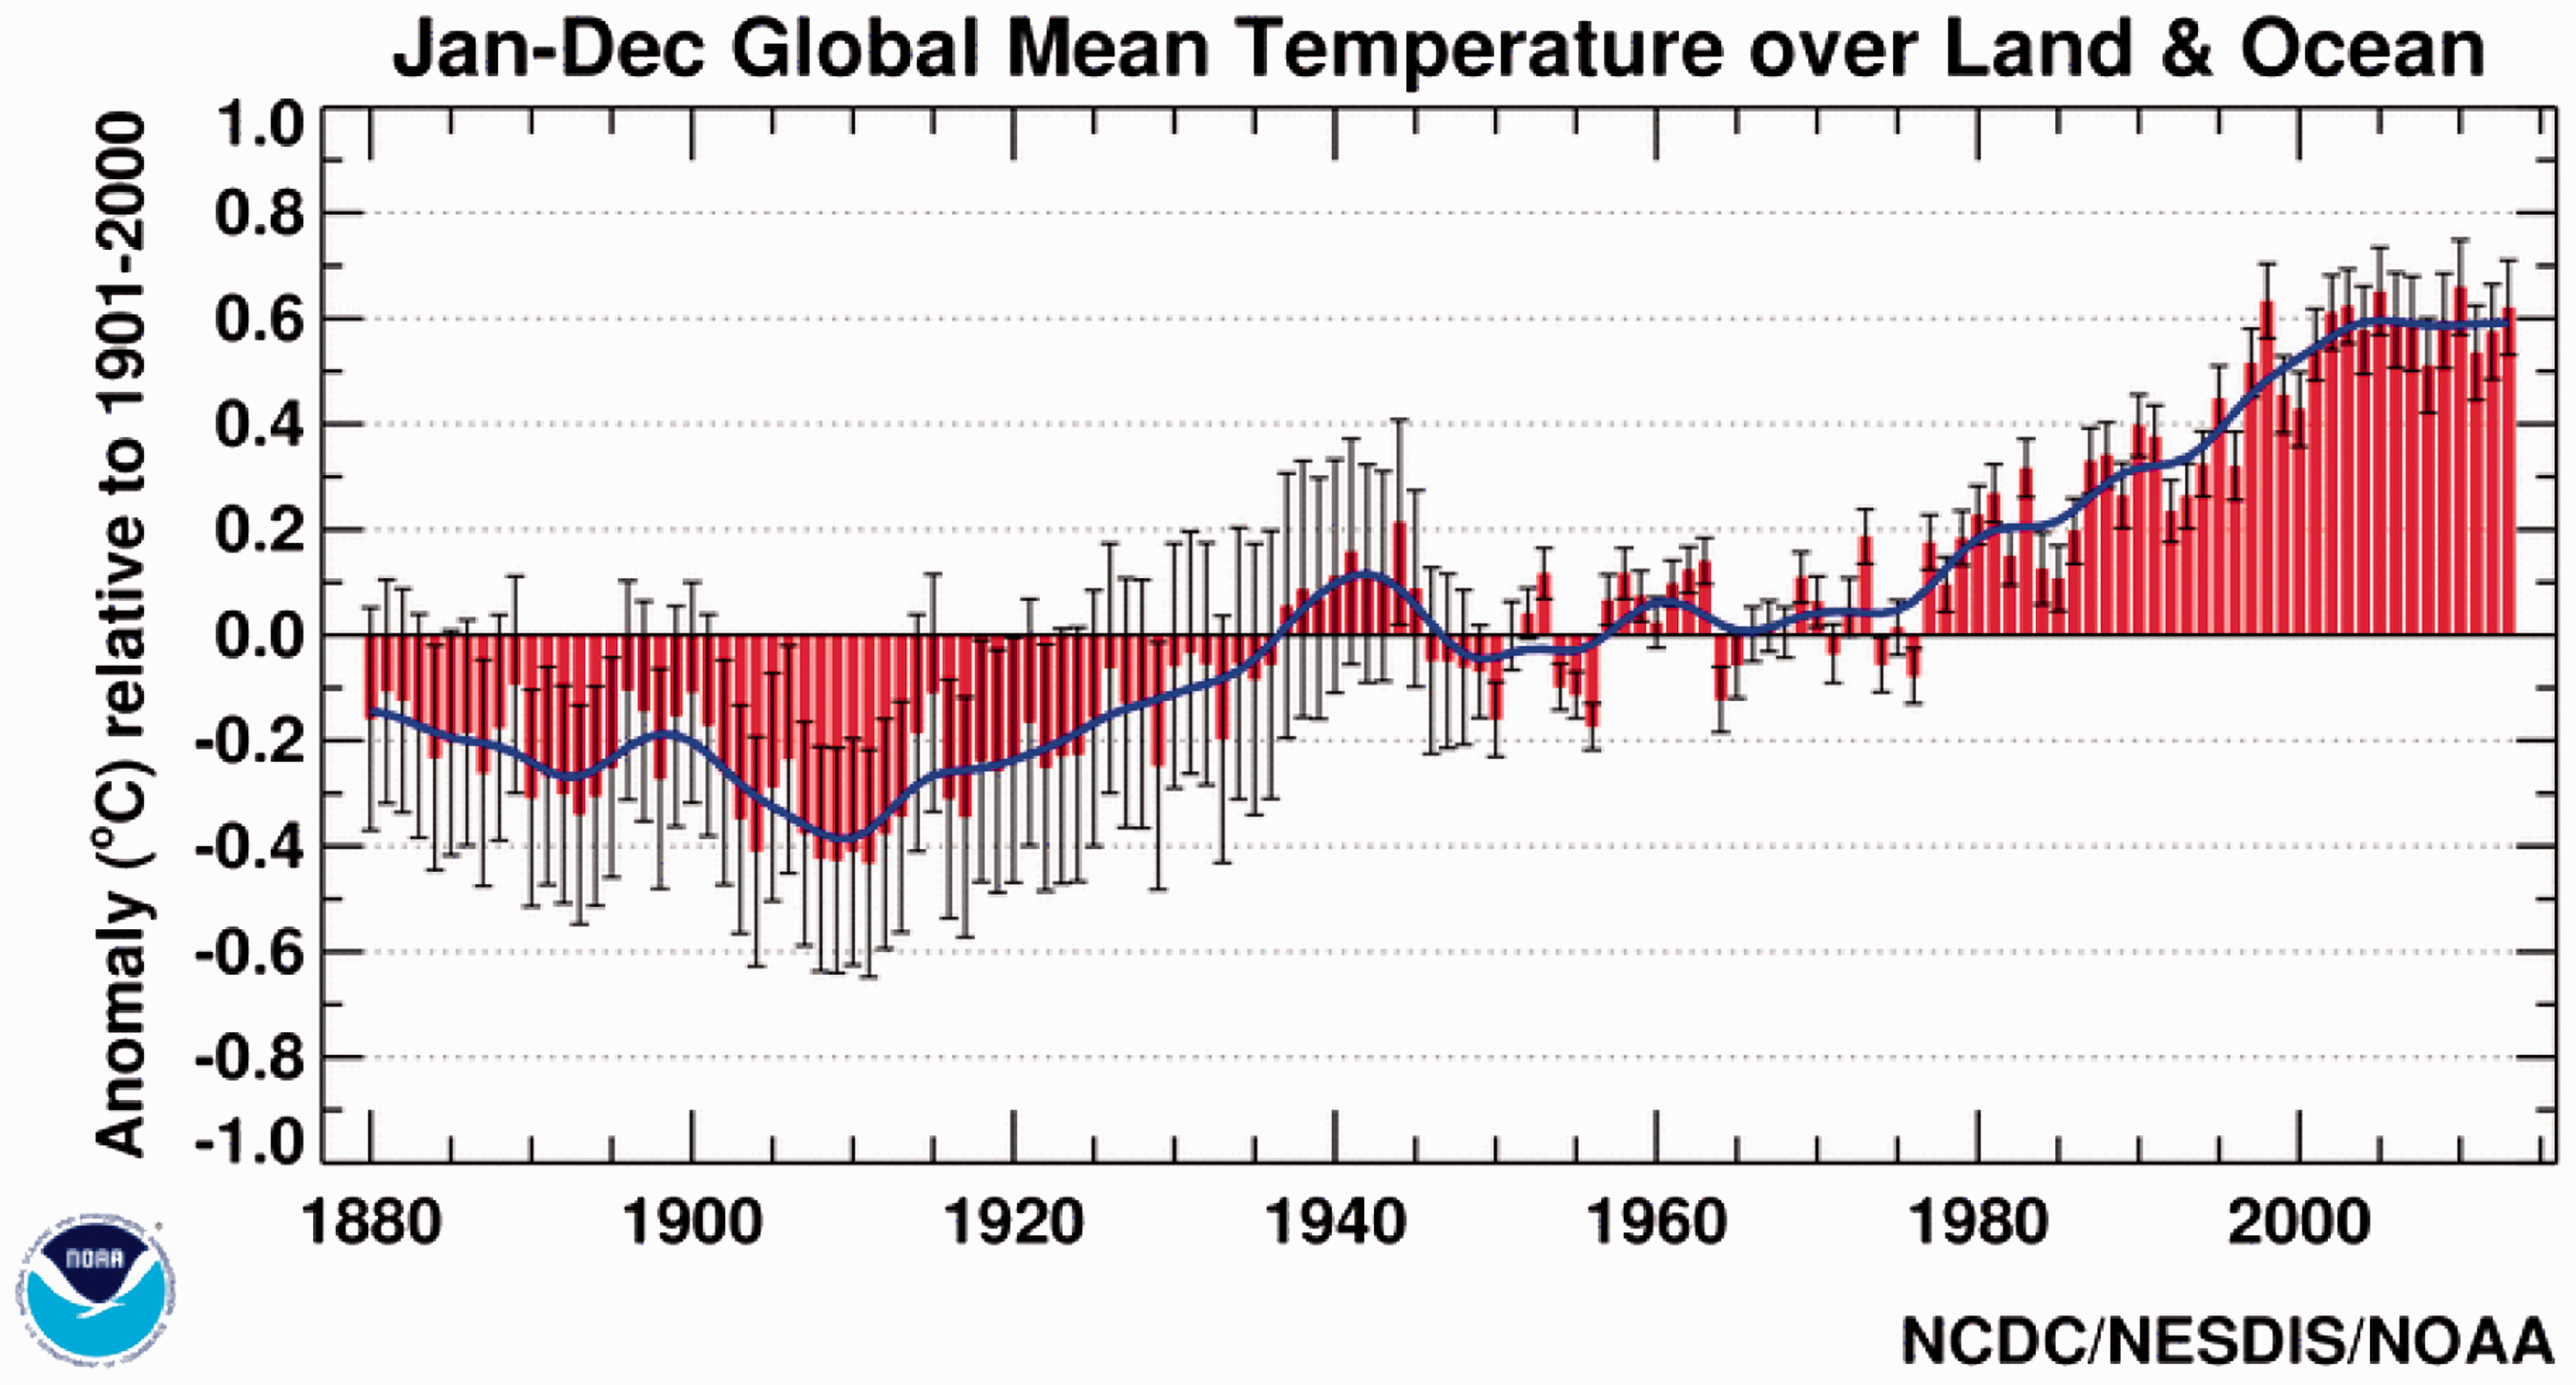
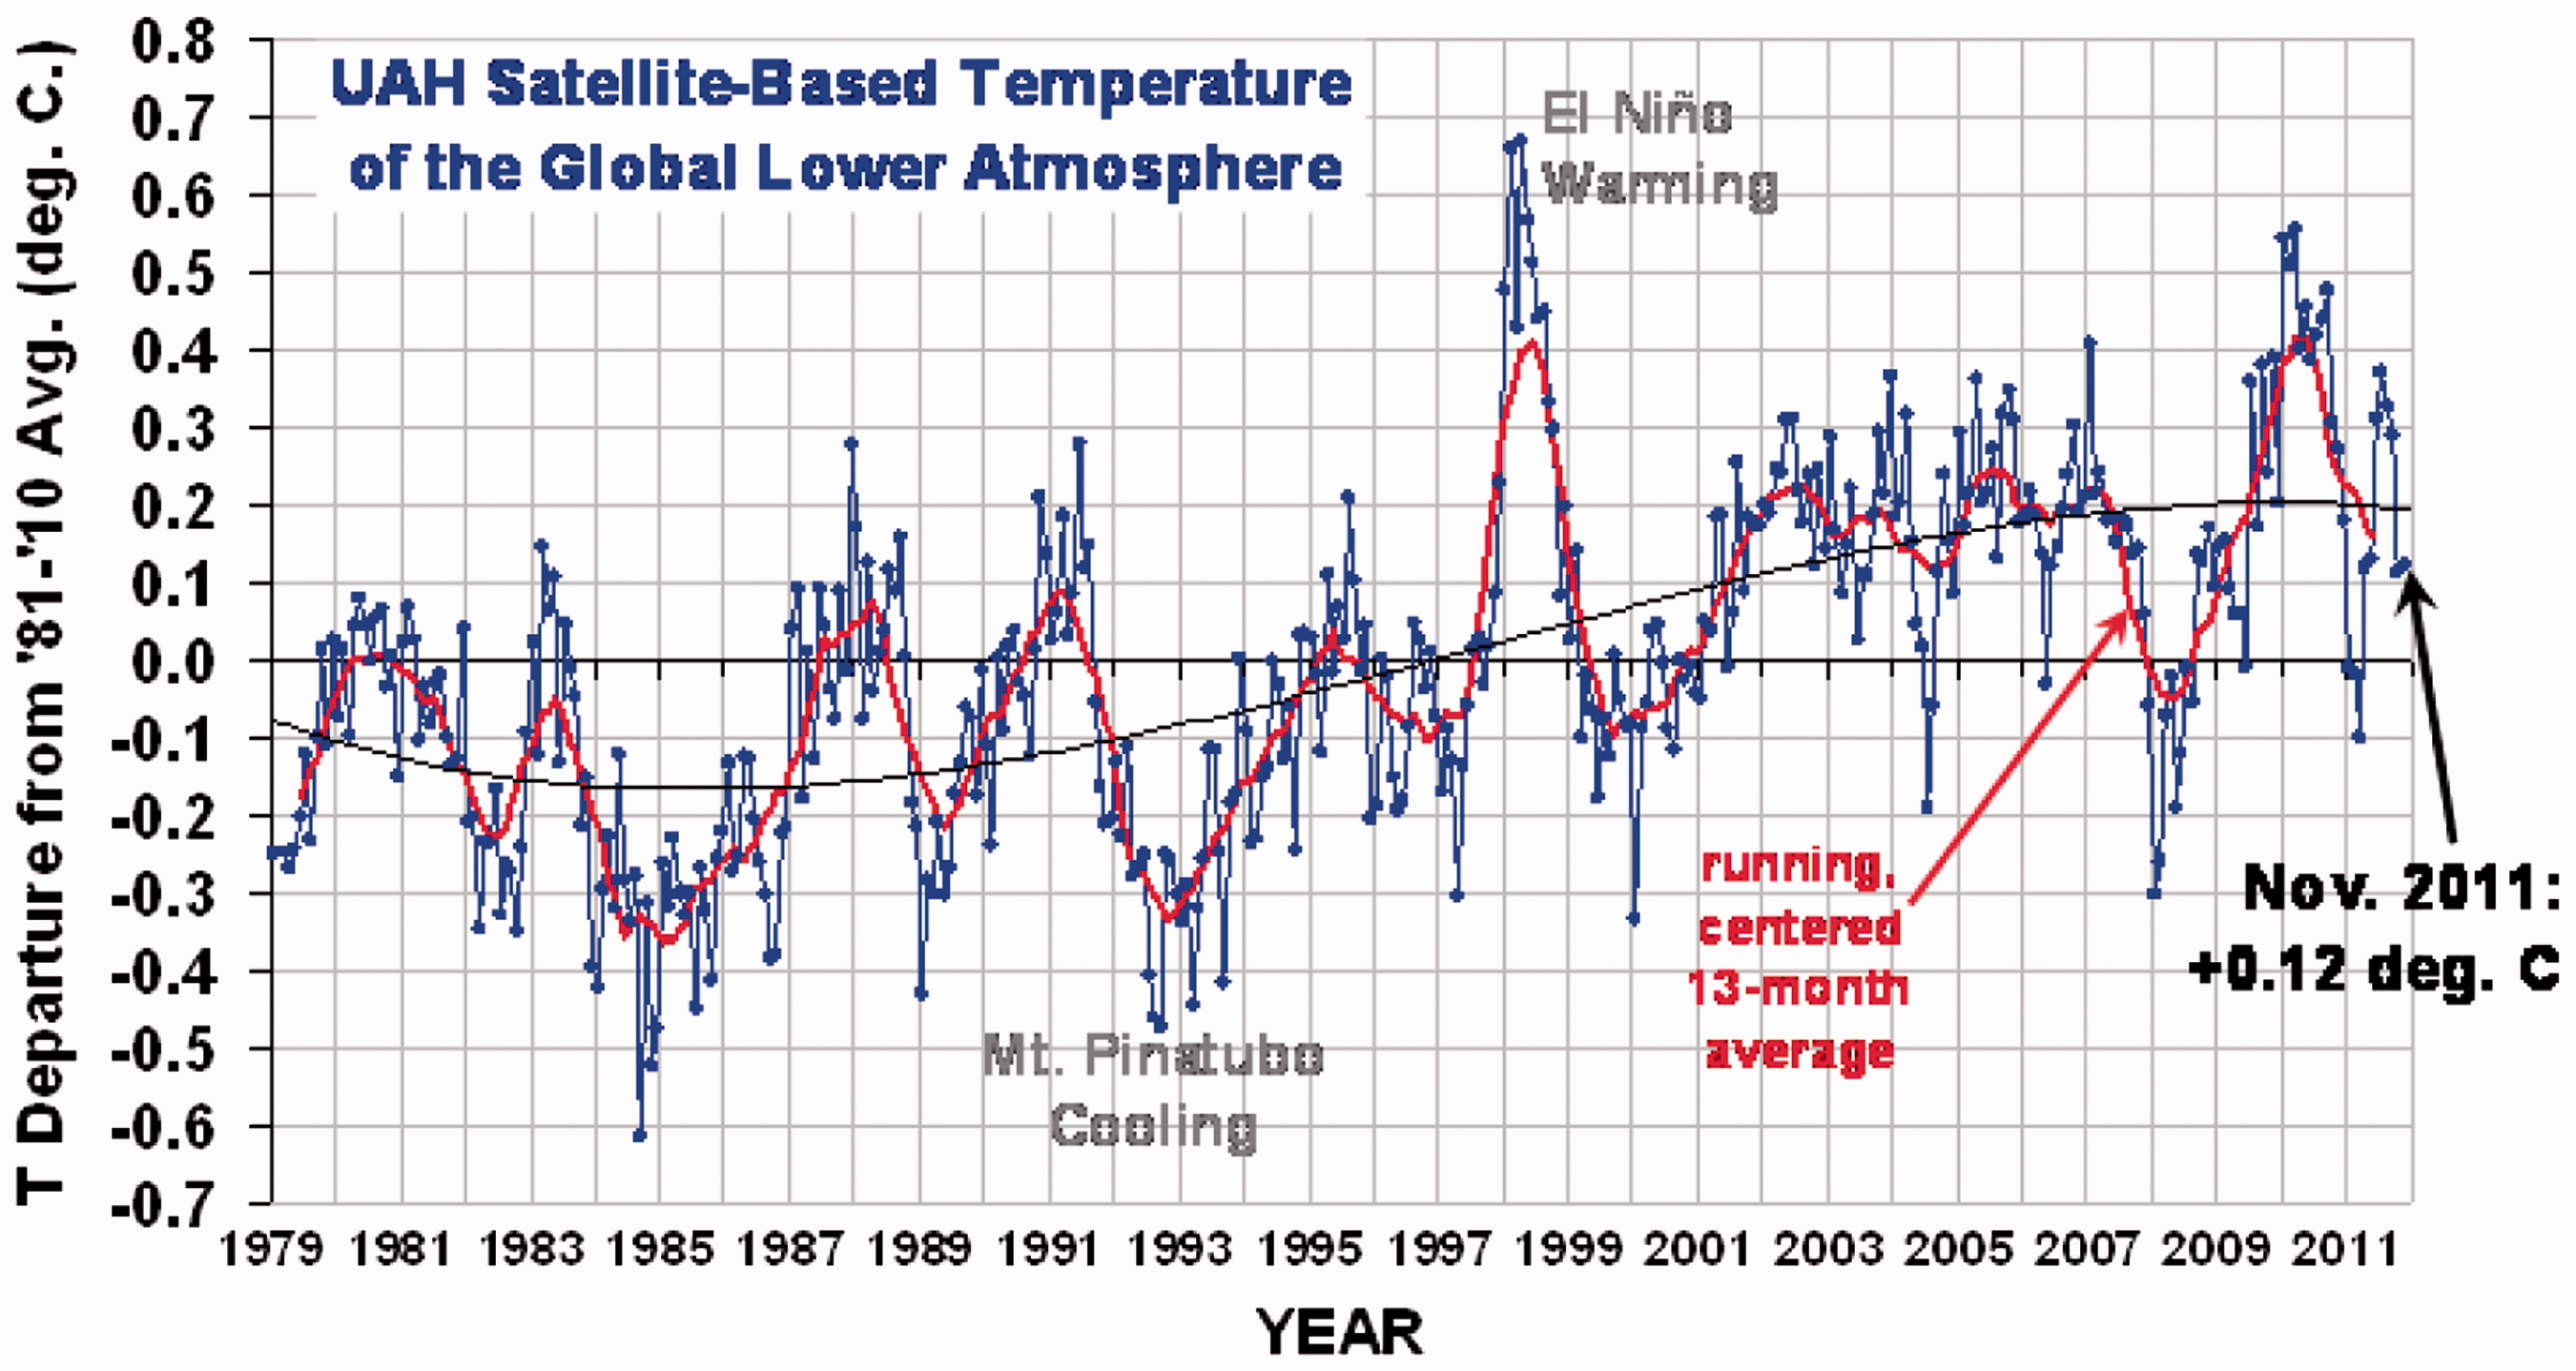
The obvious conclusion of Figure 2 is that there has been a nearly 20-year hiatus in the increase of the world’s ground based temperature measurements. The space-based measurement is rather different. It has been dominated roughly by a series of oscillations of various periods of about 5 years (red graph), and 45 years (black graph), and the actual data are shown in blue.
However, now the story gets interesting. NOAA now claims that there is no pause in global temperature rise
29
and presents the new graph in Figure 4.
30
A new NOAA graph showing no slowdown in global warming. However, it shows the same total 1℃ temperature increase since the start of the industrial age.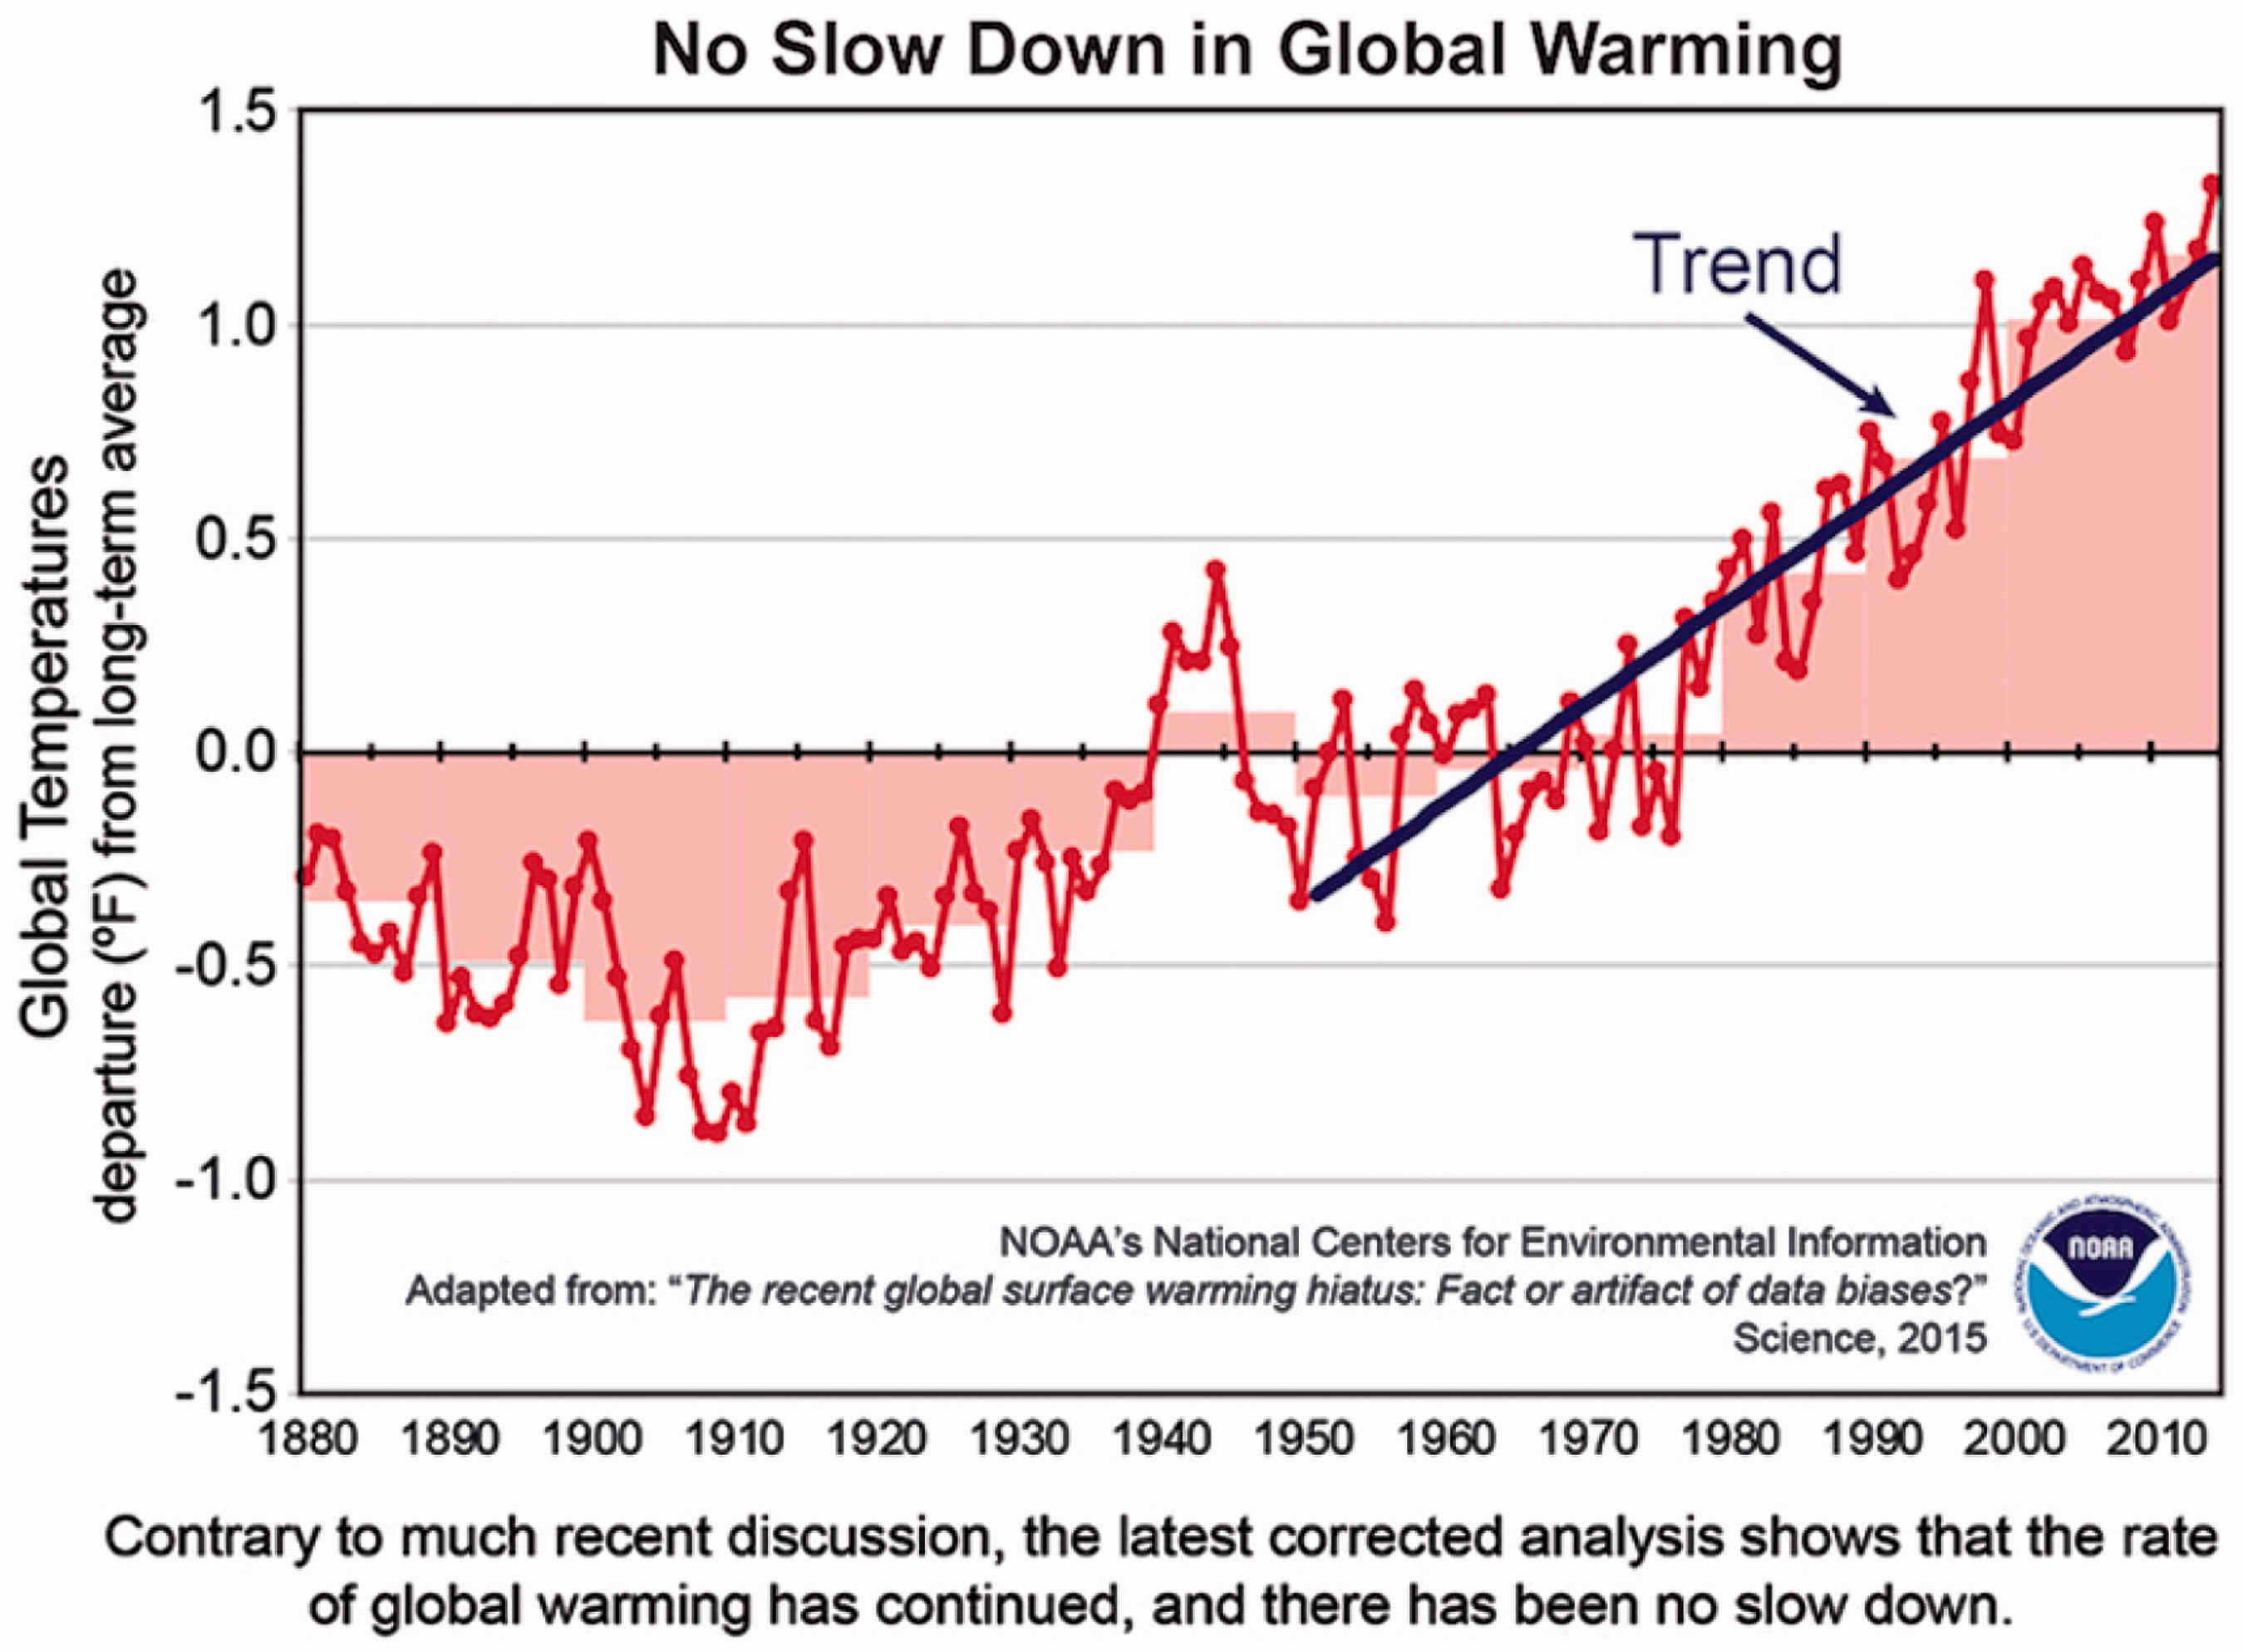
The latest NOAA graph shows a recent temperature rise of about 0.17℃ per decade. However, this same graph also shows a 0.22℃ rise per decade between about 1910 and 1945, when CO2 input into the atmosphere was not an issue.
What is striking about Figure 4 is that after nearly 20 years of measurements, NOAA decided that its measurements are incorrect. It suddenly presents new measurements that eliminate the pause. Notice that both Figures 2 and 4 have a NOAA seal affixed. This is extremely important because it is vital that civil service labs such as NOAA, NASA, NIH, NRL, NIST, etc maintain their integrity free from political influence. It appears NOAA might have lost credibility in regard to its ground based worldwide temperature measurements. The data should be re-examined by a different expert organisation, one with no position on climate change. So far NOAA has refused to make its data and new methodology publically available, 31 asserting: ‘Because the confidentiality of these communications among scientists is essential to frank discourse among scientists, those documents were not provided to the Committee,’ the agency said. It continued, ‘It is a long-standing practice in the scientific community to protect the confidentiality of deliberative scientific discussions.’ This author has been a practicing scientist for over 50 years and this is the first he has ever heard of ‘confidentiality of deliberative scientific discussions.’ Are we doctors, lawyers or priests all of a sudden? This is especially inappropriate because these ‘confidential discussions’ could have a major impact on the lives of billions of people.
Other relevant data
Figures in this section look into other potential claims of damage from additional CO2 in the atmosphere. Figure 5 is the graph of all yearly hurricanes as well as major hurricanes (categories 3–5) in the United States.
32
The worst decade was the 1940s. This hurricane data is confirmed by decade by decade raw numbers from 1860 to the present, enumerated by the National Hurricane Center, a part of the US Weather Service and NOAA.
33
There has been no discernable increase or decrease in hurricane incidence over the last 150 years.
Major hurricanes (blue) and category 1 and 2 hurricanes over the last 150 years.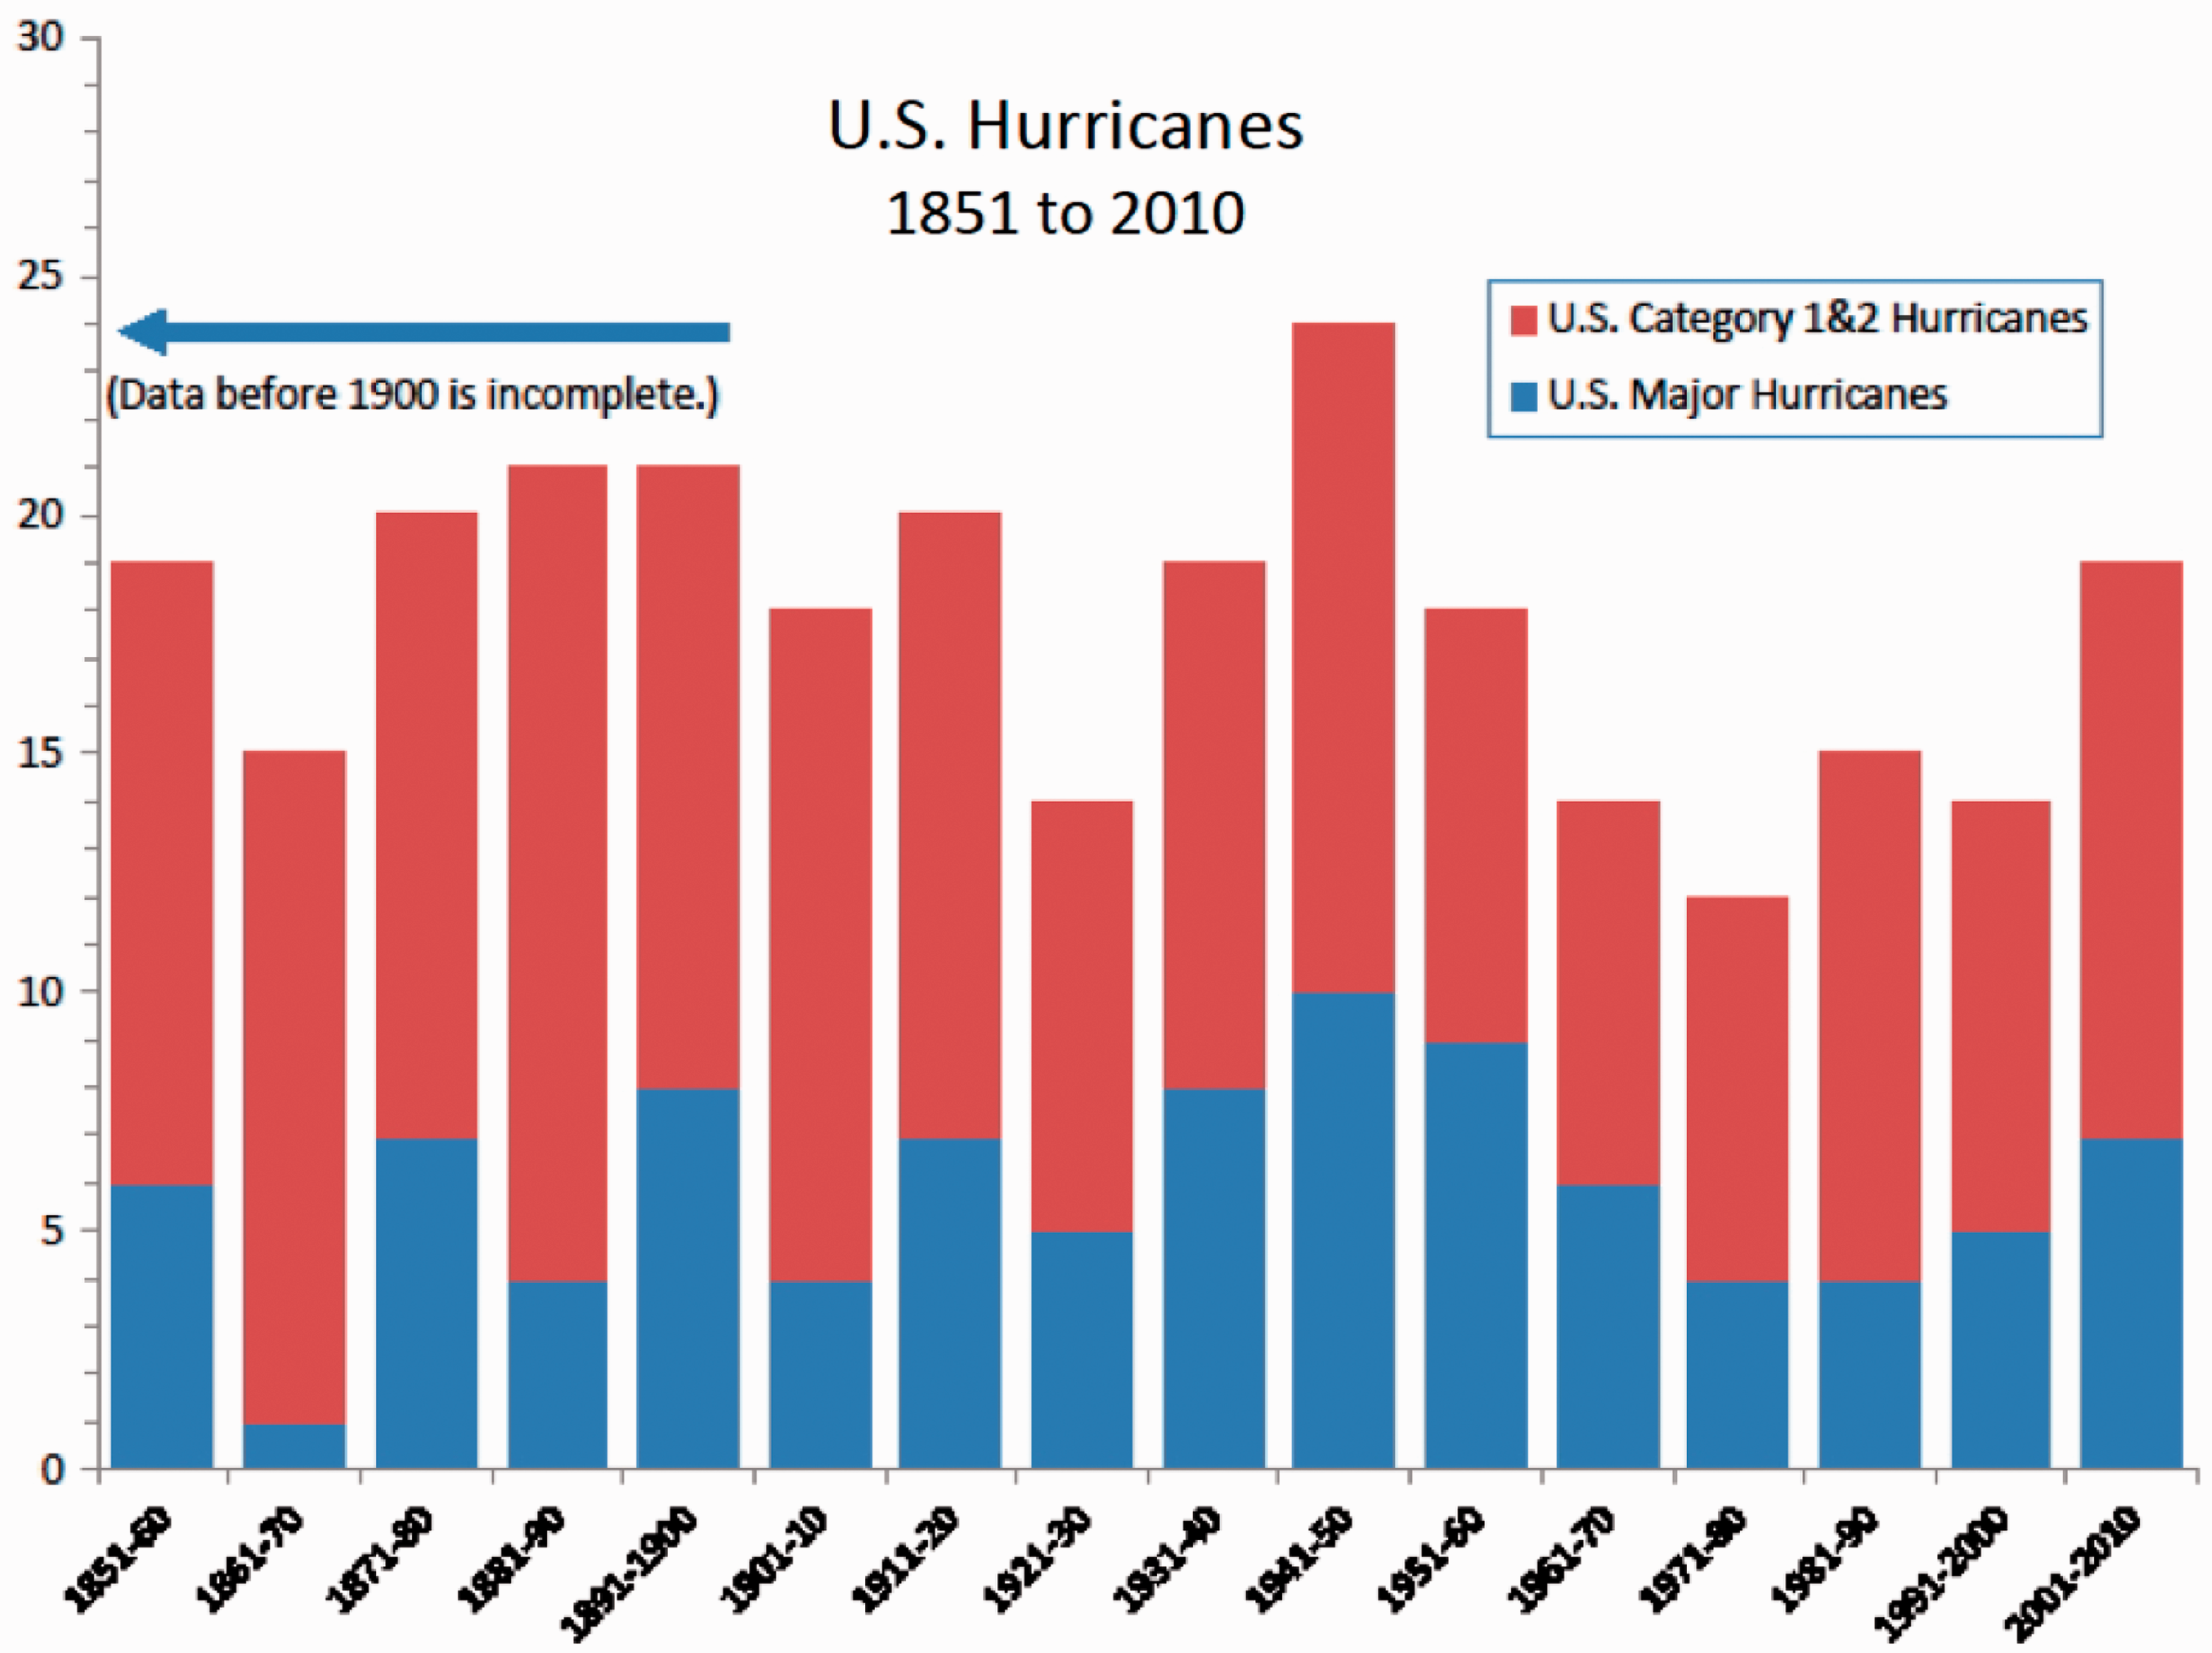
Figure 6 is the yearly record of tornados in the United States by decade.
34
Regarding tornados, the actual number of tornados has been slowly increasing, but as Figure 6 shows, the number of violent tornados, those that kill people and destroy large numbers of structures, are slowly decreasing. However, it is worth noting that the principal increase took place around 1980, when space-based measurements began. It is possible that since tornados, unlike hurricanes, are isolated storms, before space-based measurements, many smaller tornados in unpopulated areas may have been missed.
Tornado reports in the United States from 1950. All tornados in blue, major (category F2–F5) in red.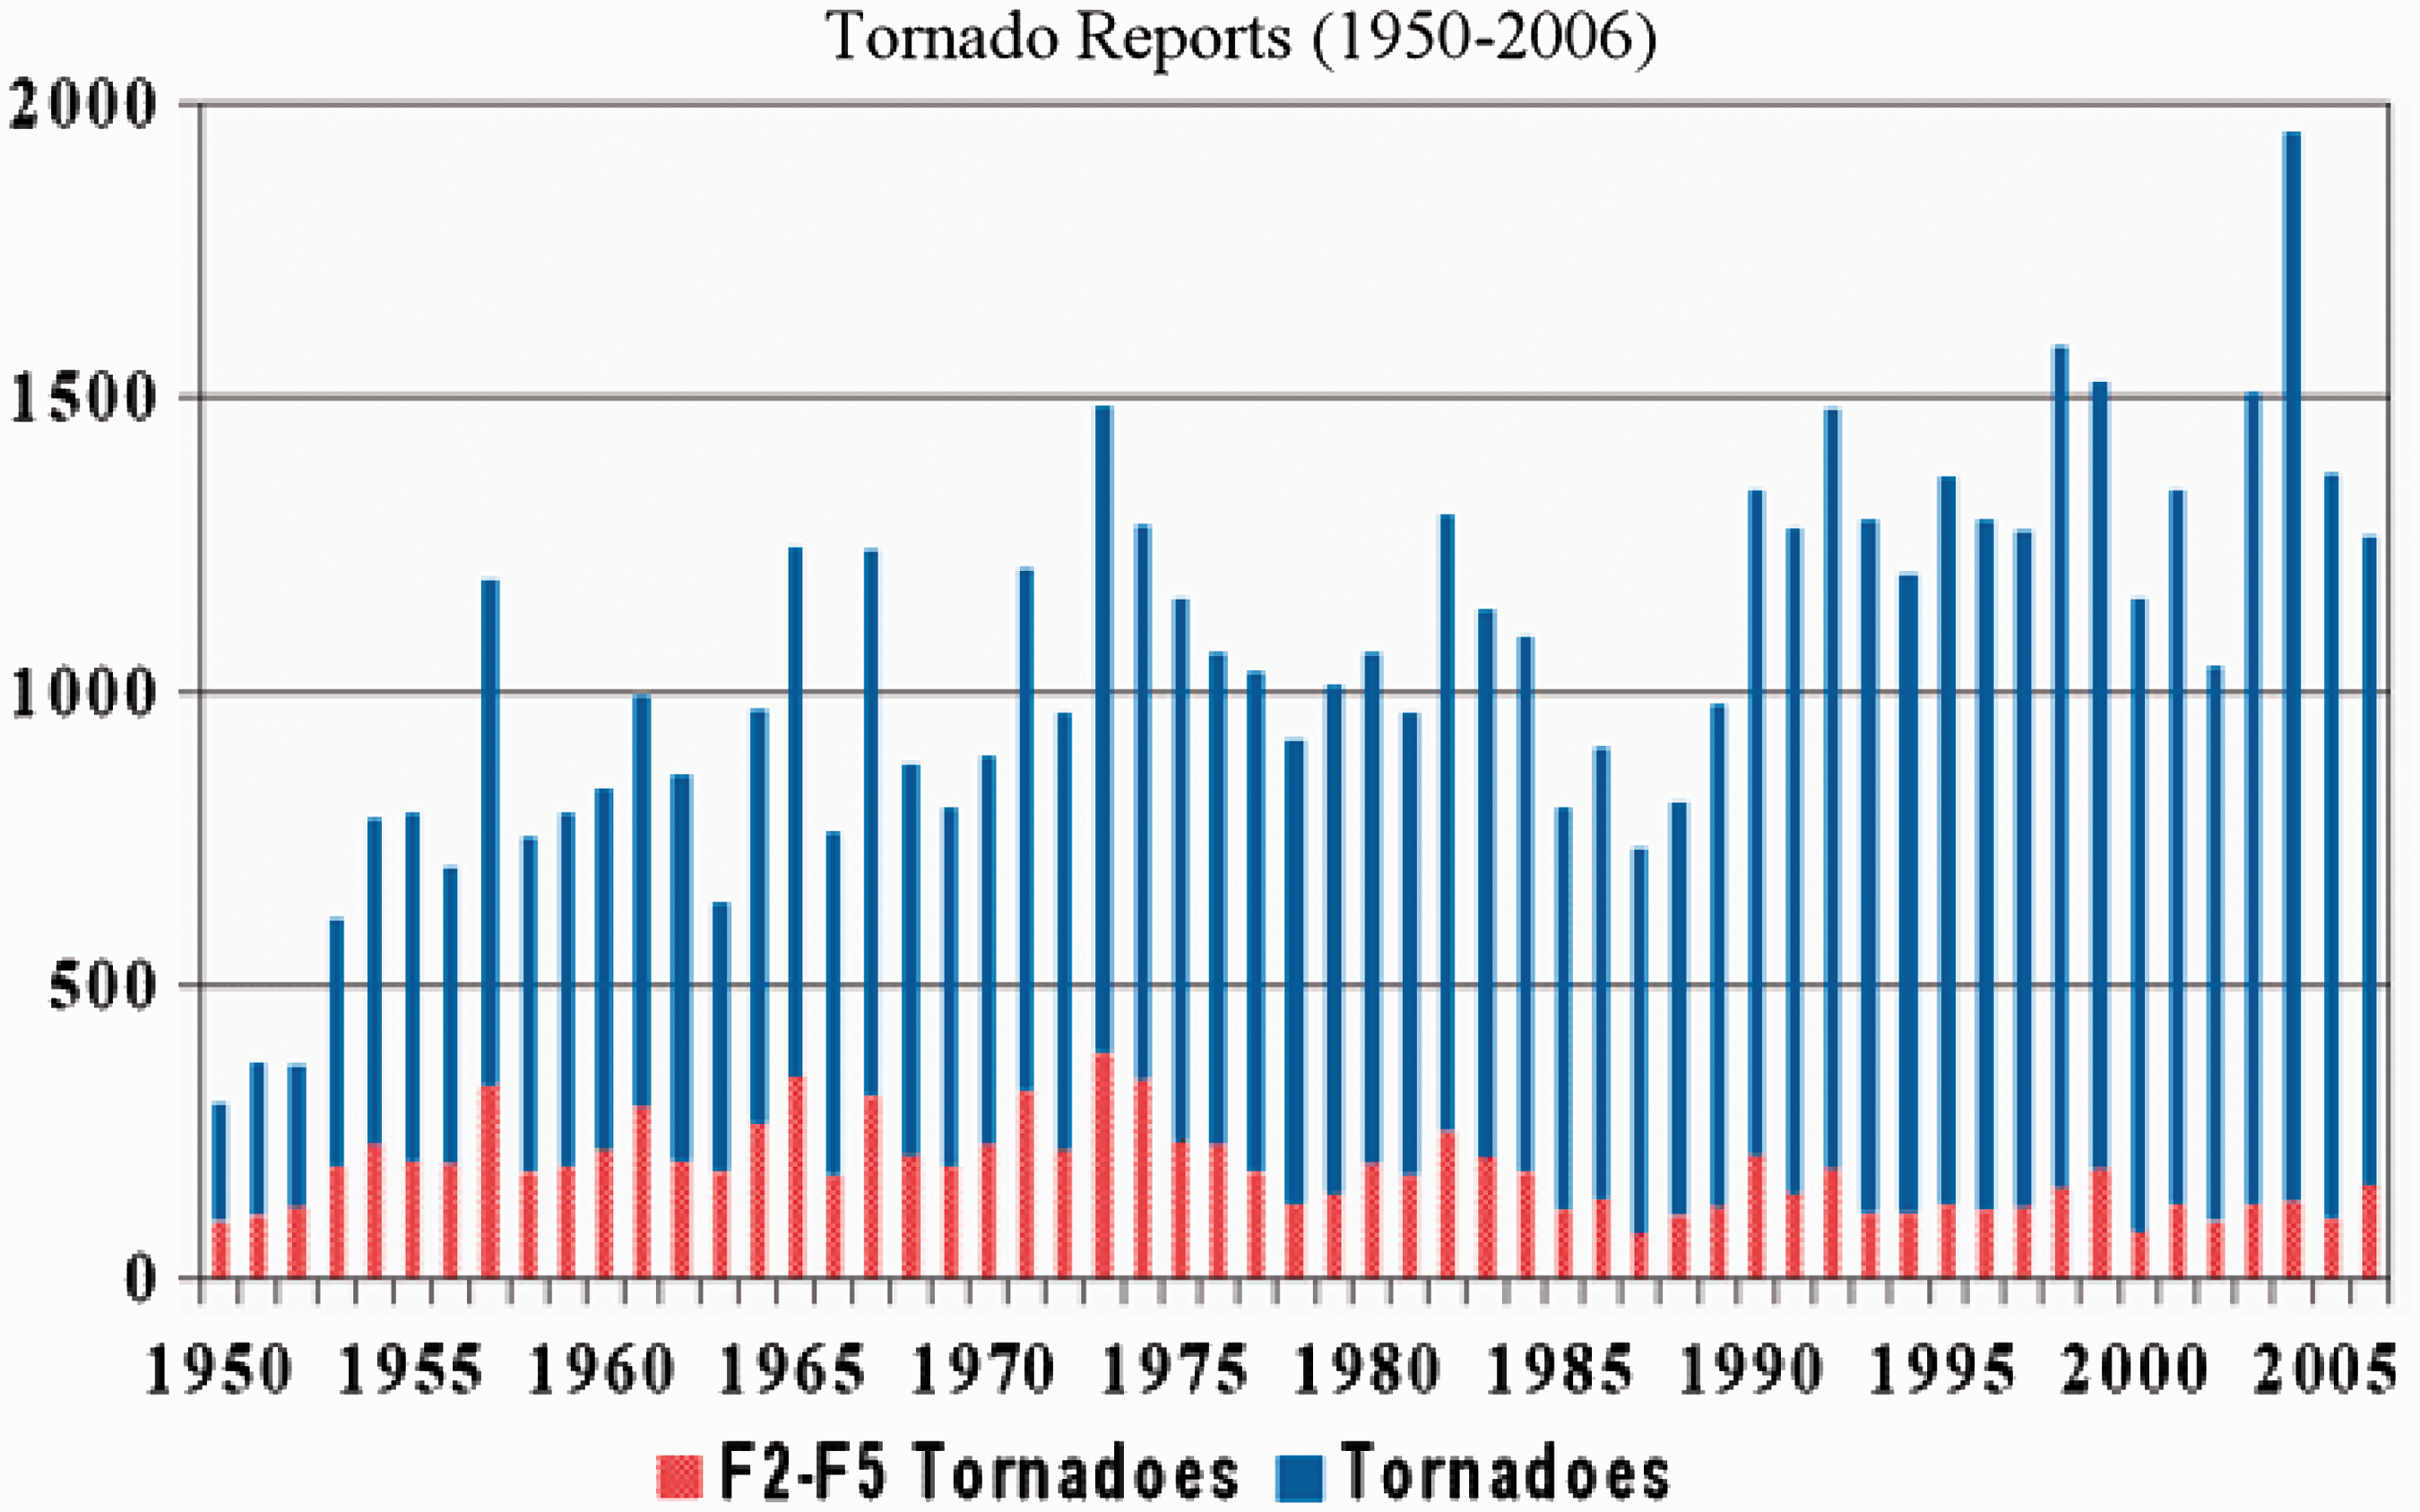
Figure 7, along with the link35 shows that sea level has been rising at a rate of about 25 cm per century since about 1920, that is since long before CO2 in the atmosphere became a concern. Note that Figure 7 on sea level rise is from IPCC data, the very organisation the UN uses to get its climate data.
For the past 80 years, the increase in sea level increased at the rate of approximately 25 cm per century.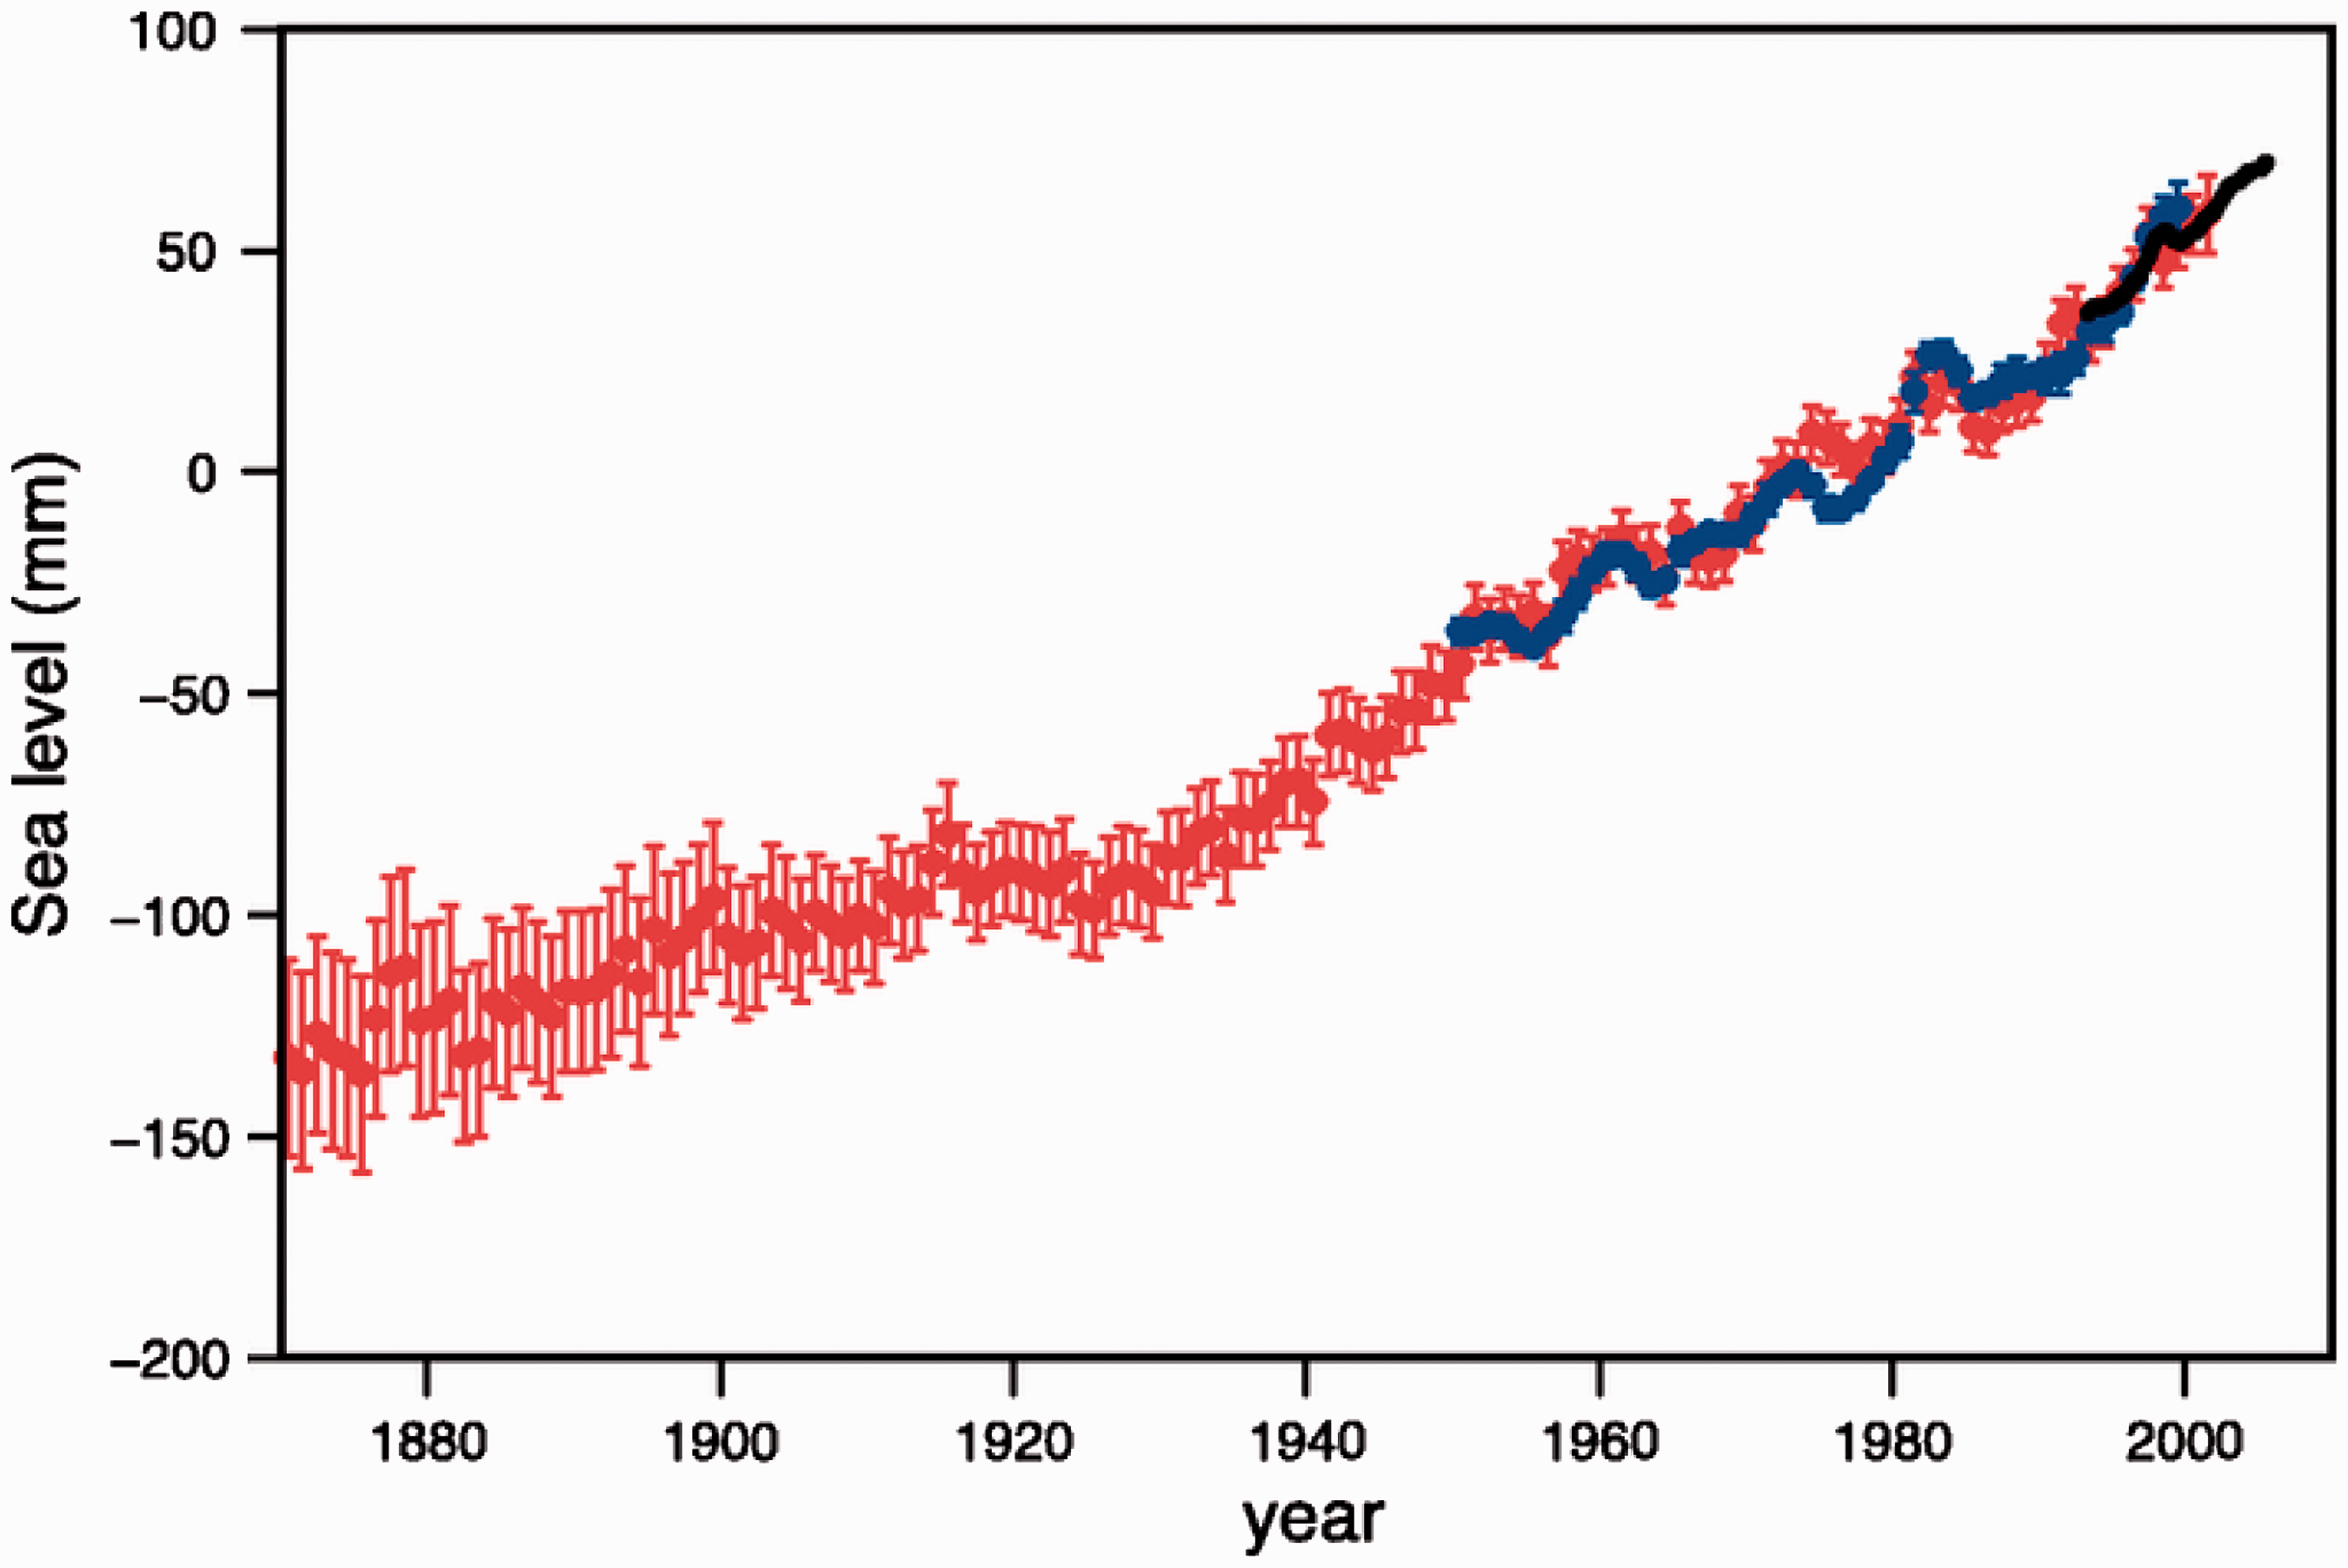
For low level islands to be submerged by a 4–6 m rise in sea level by century’s end, as suggested at the Paris conference, the rate of ocean level rise would have to increase by about a factror of 20 in a just a few years (i.e. the graph in Figure 7 would suddenly become nearly vertical!).
What about the increase in forest fires and wild fires? Figure 8 is a graph for the United States;
36
Figure 9 for Canada.
37
Data on acres burned by wildfires in the United States since 1960. Data on acres burned by wildfires in Canada since 1970.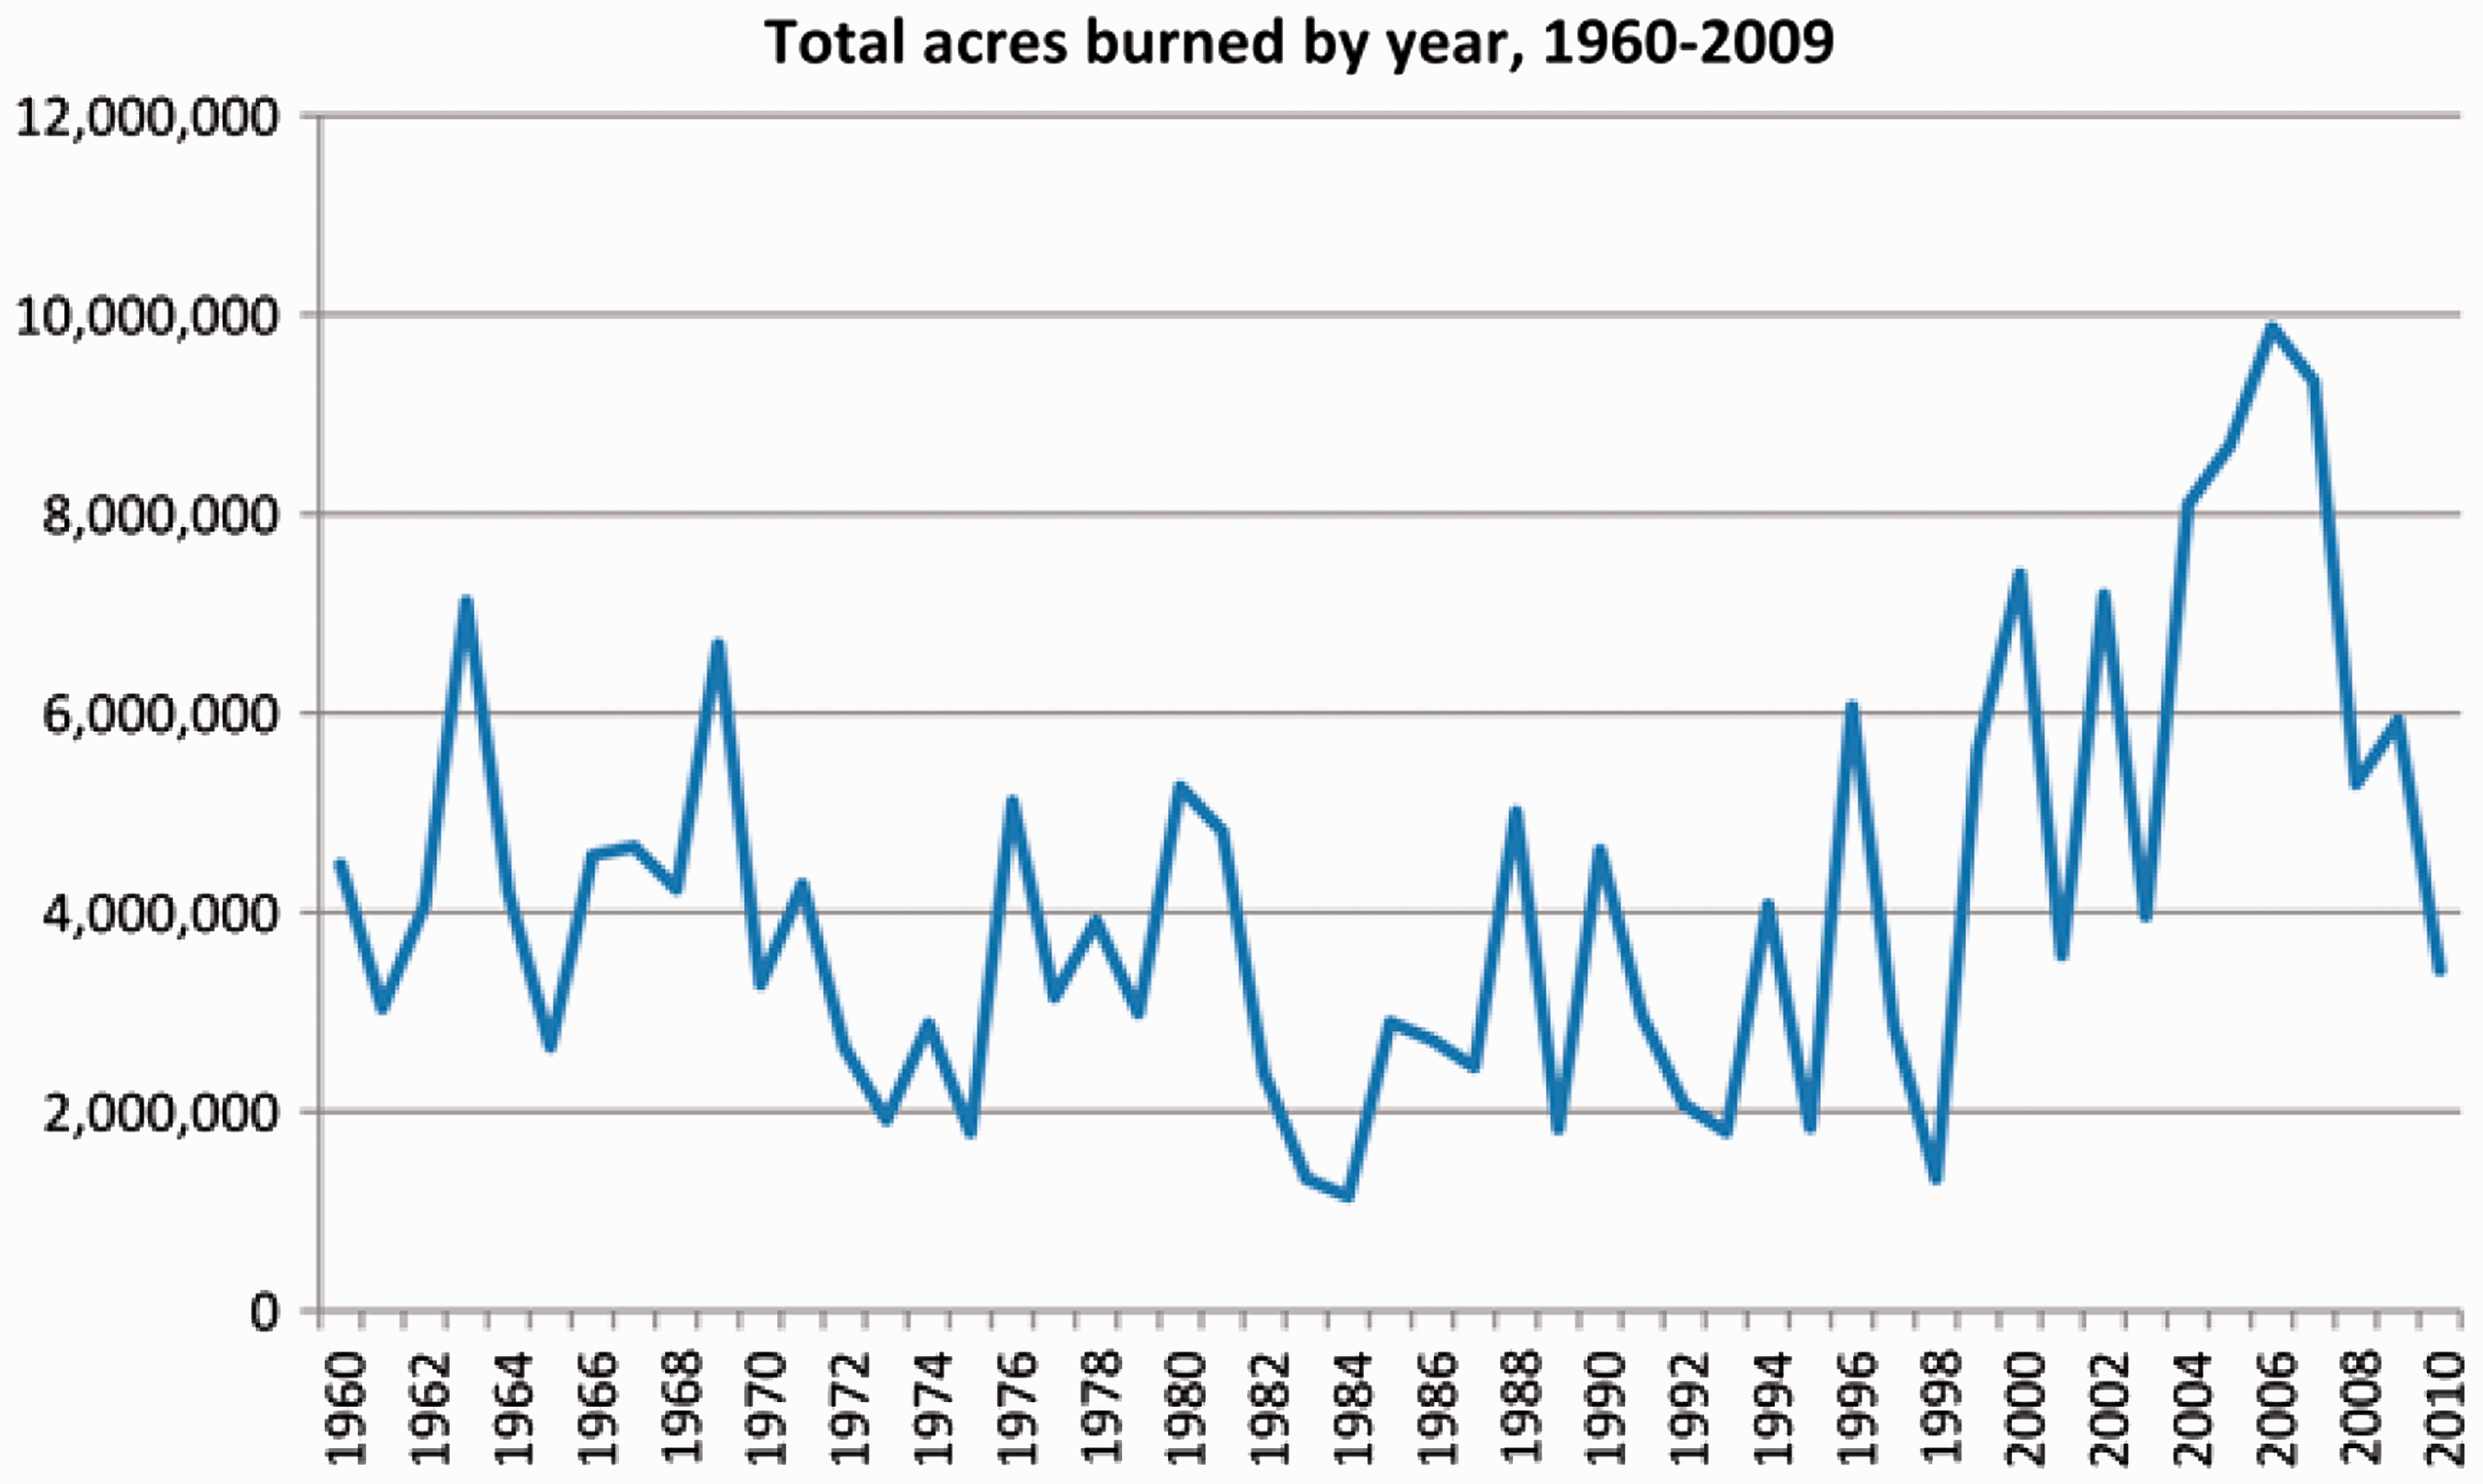
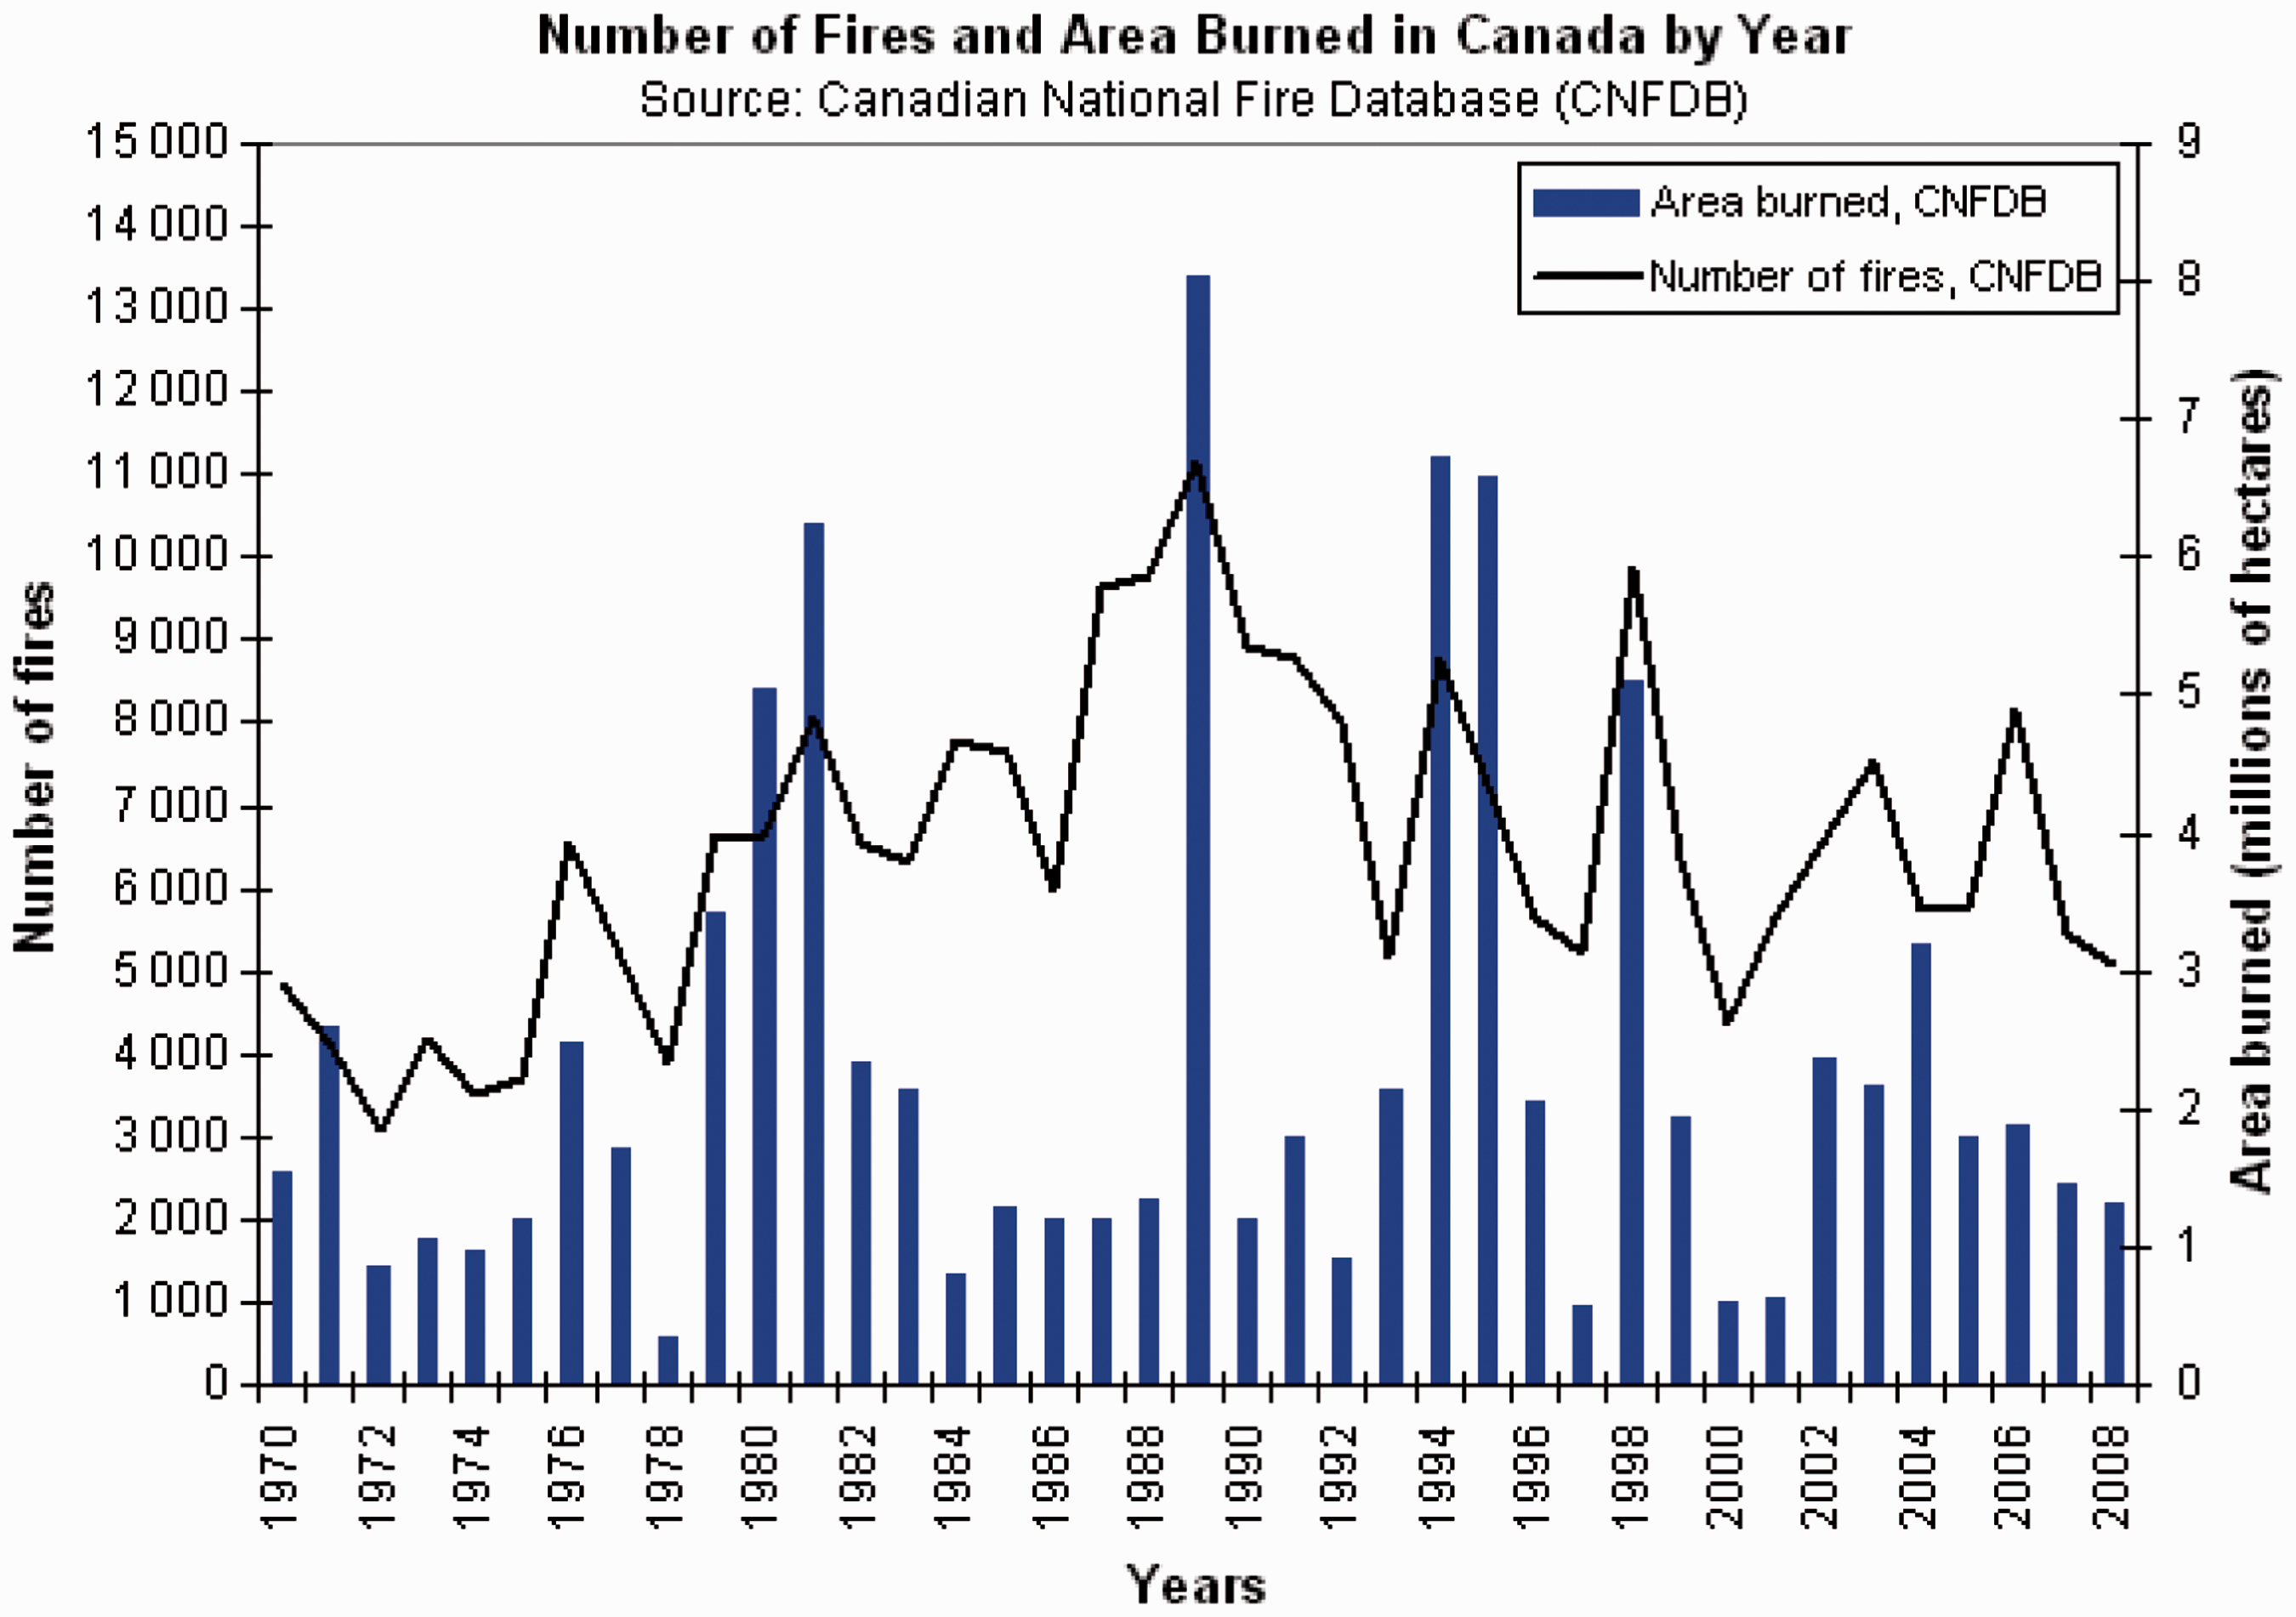
In the United States, the rate has been about constant except for a peak between about 2004 and 2008. From 1960 to about 1984 there has been a slight dip. Then from 1984 to the present, there has been a slight increase up to the 1960 level except for the aforementioned jump from 2004 to 2008. In Canada, these peaks appeared earlier, in the early 1980s and 1990s, but otherwise there has been no upswing in either country. The Canadian National Fire Database of the Government of Canada has issued Figure 9.
There have been claims that there will be more and more intense droughts. Figure 10 shows NOAA data on the frequency of droughts in the United States.
38
Percent of American land parched by extreme drought over the last 110 years. Note that there has been no steady increase, and no drought comes near the severity of the dust bowl of the 1930s.
There have also been claims that climate change will affect world food production. A graph of world food production by continent is shown in Figure 11.
39
A graph of per capita food production from 1961 to 2005.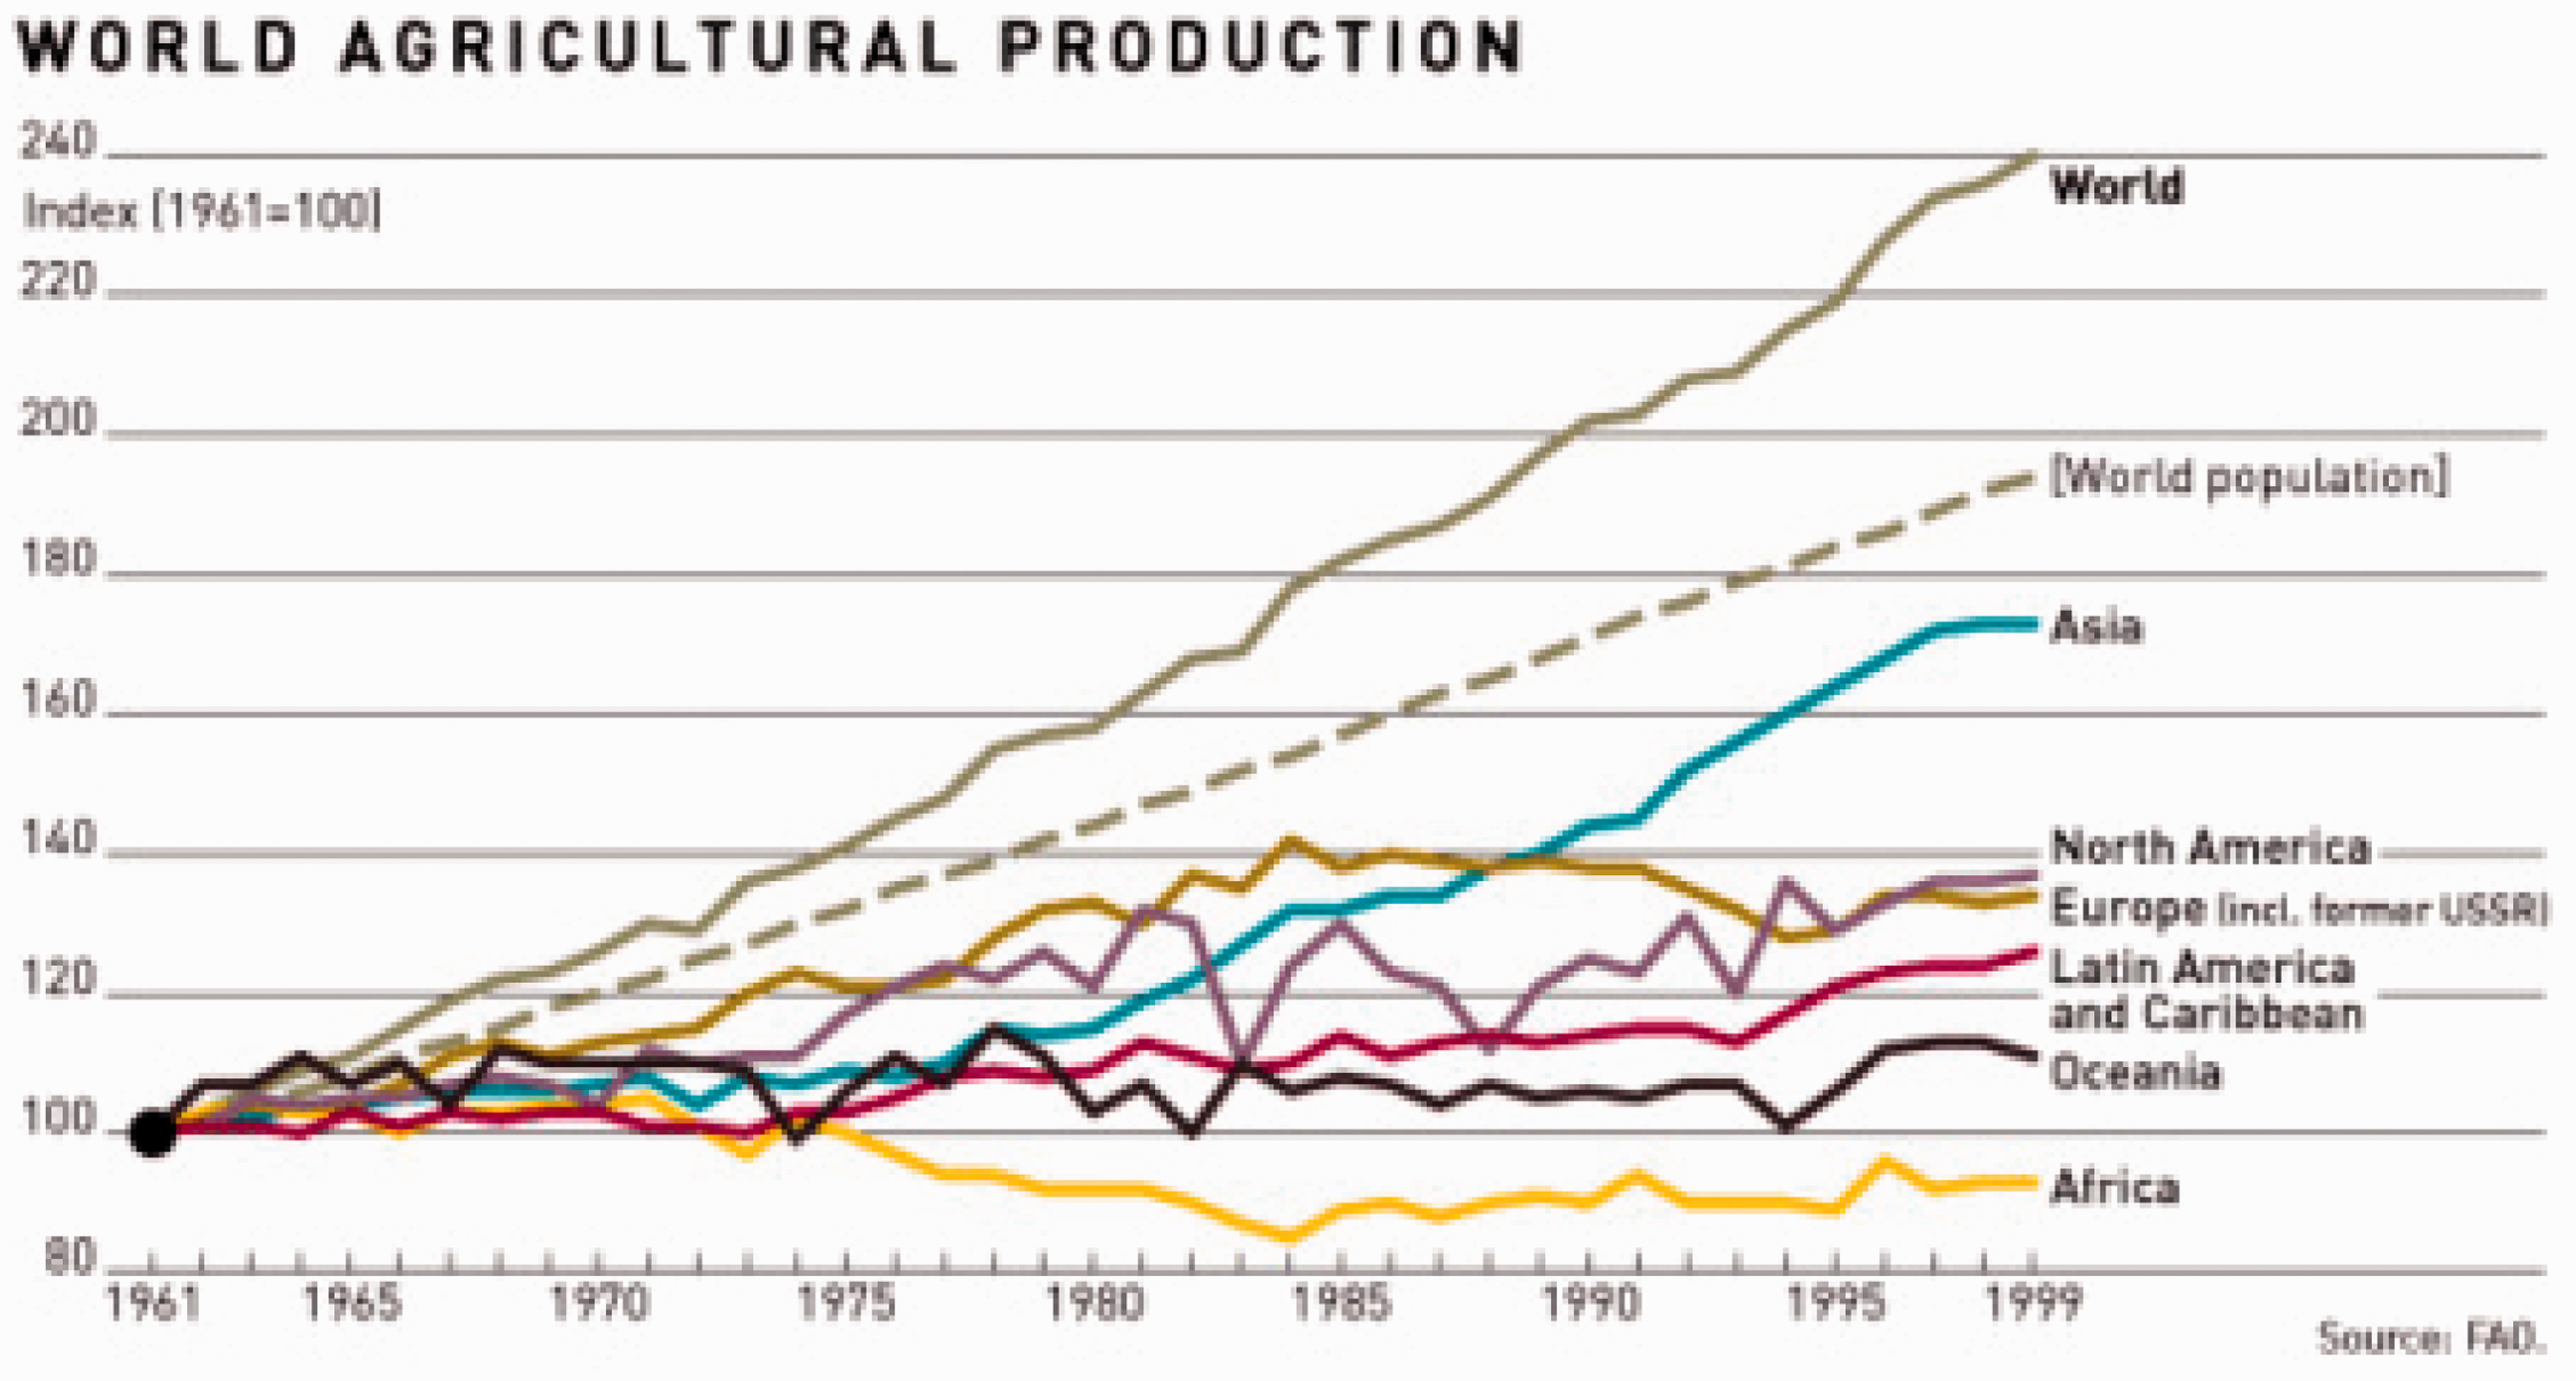
Clearly worldwide per capita food production is rising, not falling; with a particularly dramatic rise in production in Asia. If climate change is going to cause any decrease in food production, there is no evidence of it yet.
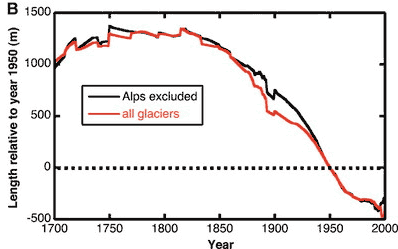
Another factor believers point to is the retreat of glaciers. President Obama pointed this out on a trip to Alaska in the summer of 2015. Figure 12 40,41 show graphs of glacier length over the centuries. The glacial retreat started about 200 years ago, and there has been no special change over this period.
Two graphs showing glacial retreat over about 300 years. Clearly the trend toward melting glaciers has been proceeding at about the same rate since about 1825.
As an example of a single glacier system, there is a great deal of evidence for the yearly retreat of glaciers in Glacier Bay, Alaska, obtained by various voyages there over they years. Figure 13 shows such an annotated map.
42
Map of Glacier Bay, Alaska showing the glacier edges at various times in history. The red lines mark the glacier boundaries at the various years shown.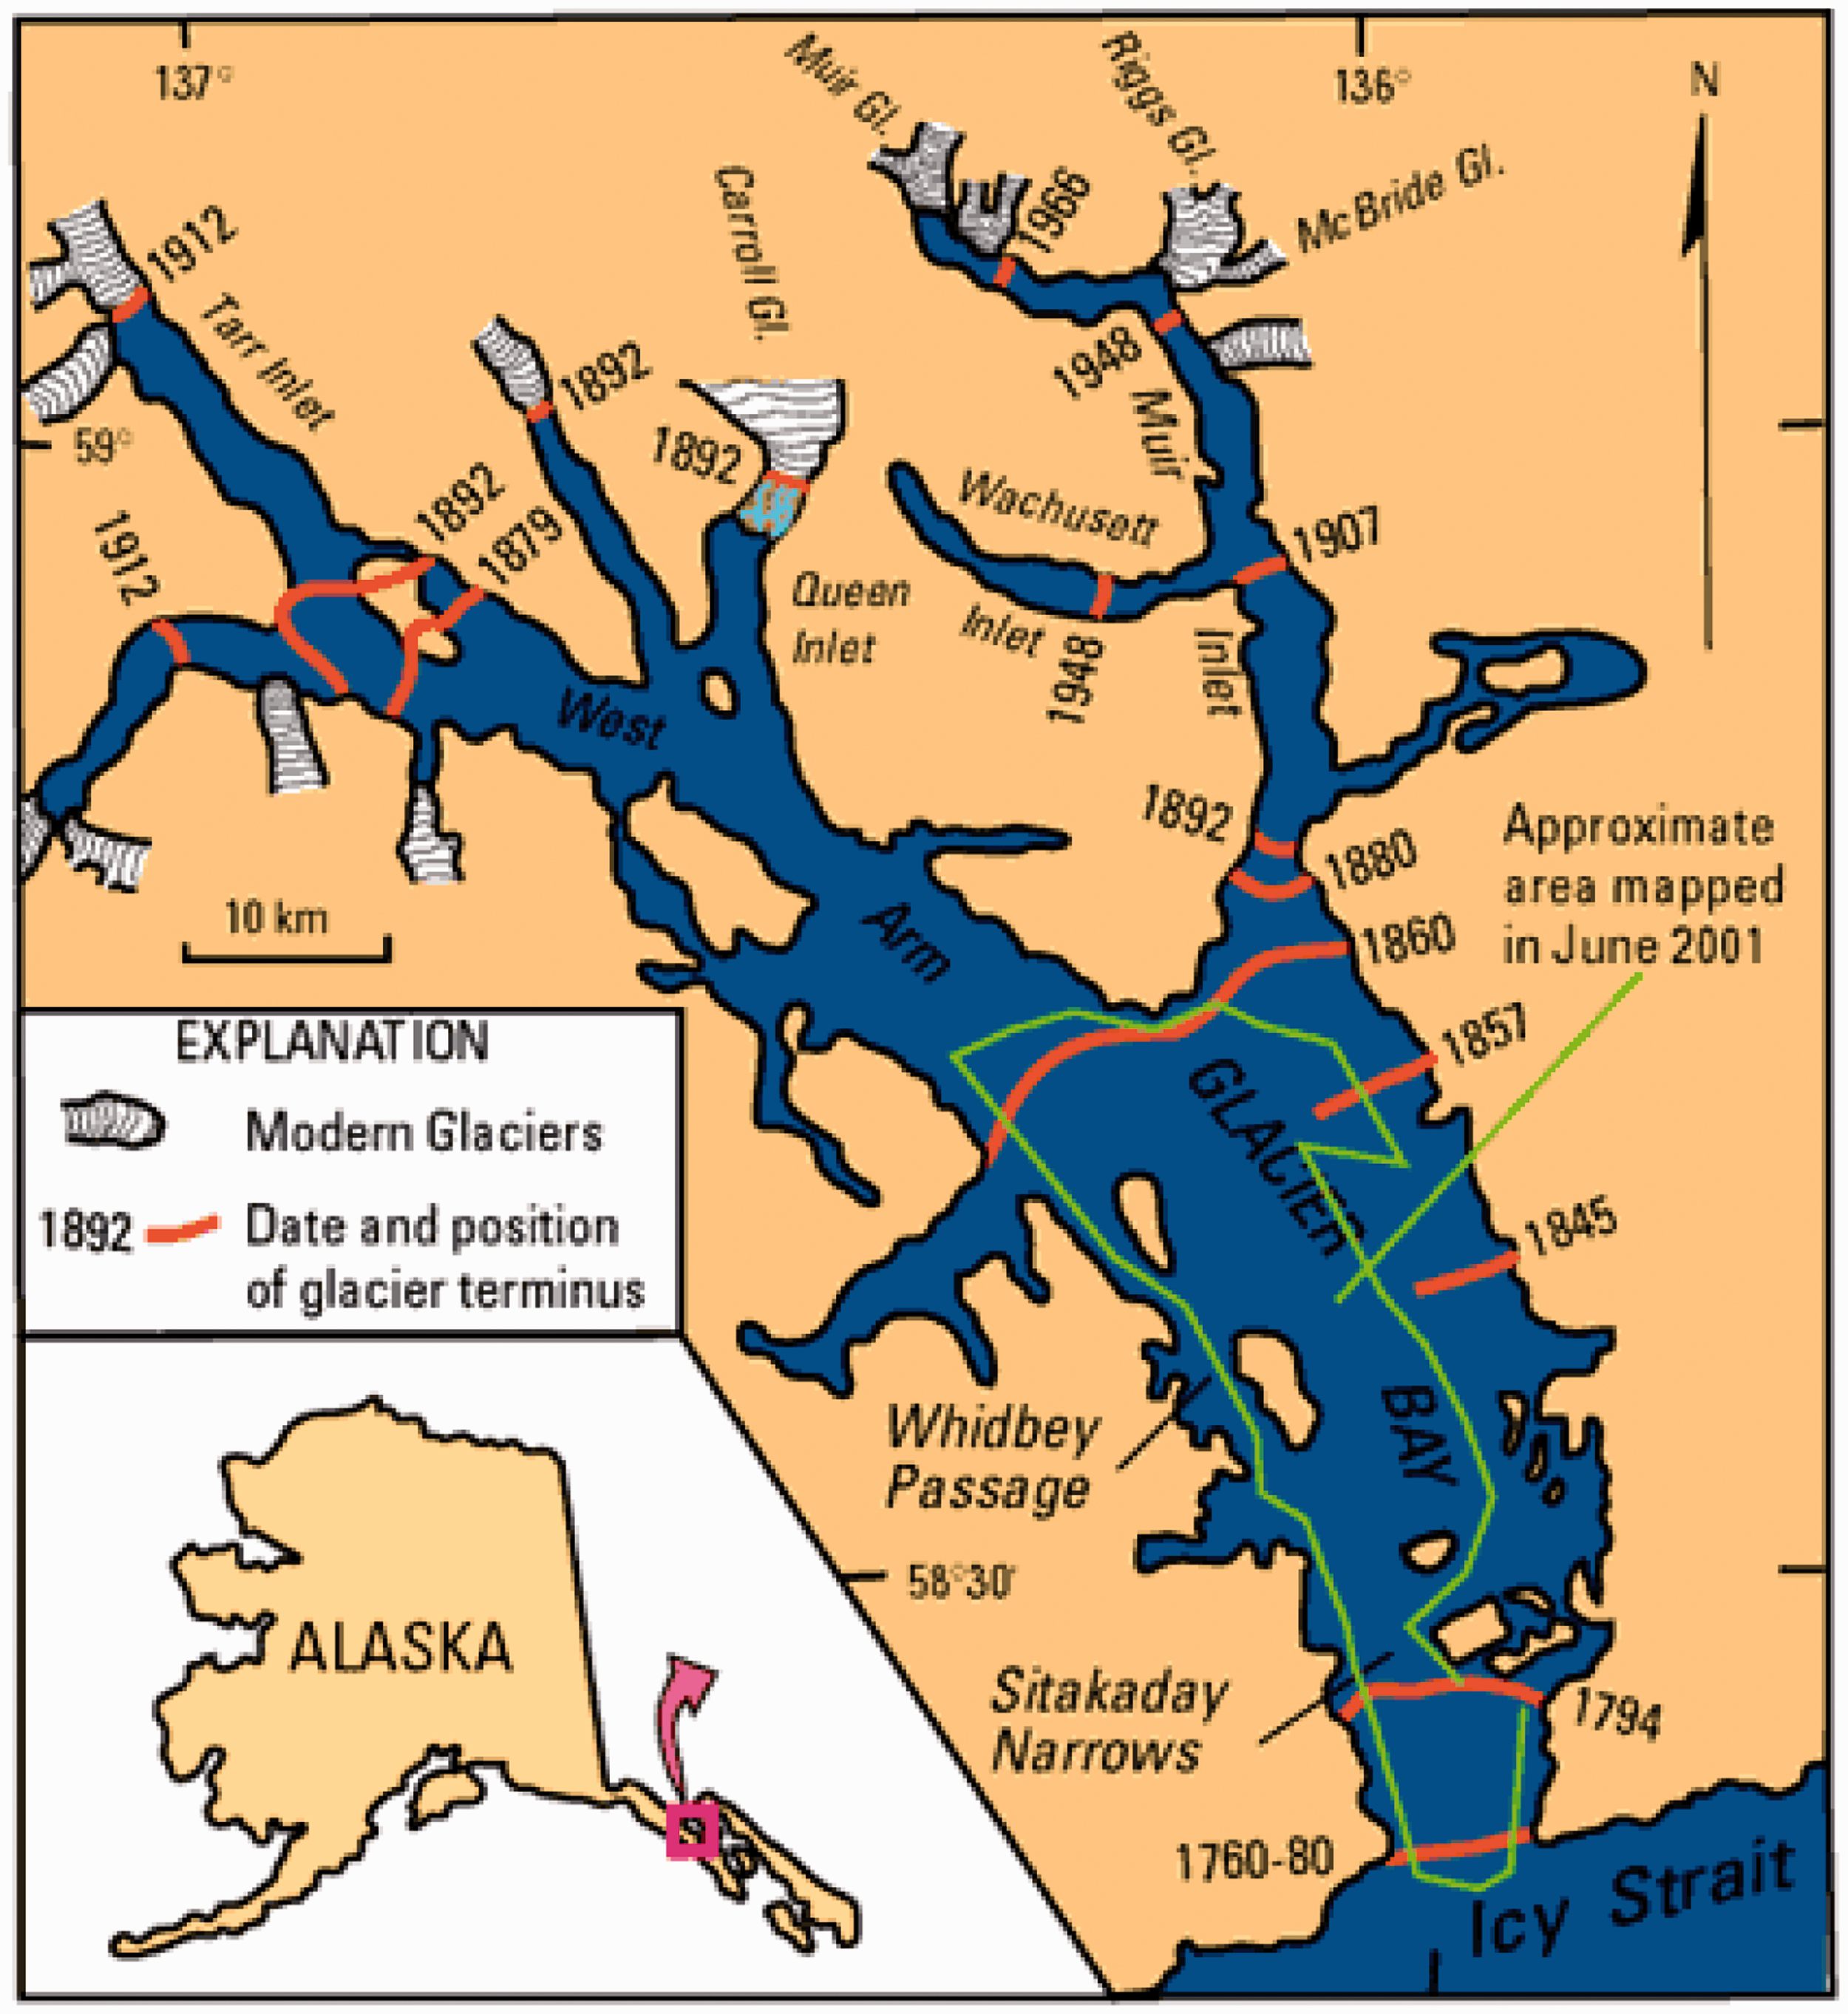
Clearly, most of the glacial retreat in Glacier Bay occurred before 1907, so it has little or nothing to do with man-made climate change caused by burning fossil fuels.
Another frequent assertion is that ice caps are melting. This is the most difficult assertion to check out. First of all, one must be careful to distinguish between floating ice in the Arctic and land based ice in Greenland and Antarctica. If there former melts, there will be no rise in sea level. If the latter were to melt, there could be an enormous rise, and this is what we consider here. However, it is very cold in these two places.
It has long been known that in Greenland and Antarctica, ice has been melting in some places and thickening in others, but it has been difficult to measure the net effect. 43 However, these days you can hardly turn on your TV these days without seeing a gigantic ice mass, thousands of year old, breaking off and floating into the sea to begin its melt, with the commentator saying doom is at hand.
Nevertheless, a NASA study
44
seems to indicate that melting ice in some places (for instance the Antarctic peninsular) is more than balanced by thickening ice in others (Eastern and interior western Antarctica). Here is quote from Jay Zwally, the leader of the NASA study: “We’re essentially in agreement with other studies that show an increase in ice discharge in the Antarctic Peninsula and the Thwaites and Pine Island region of West Antarctica,” said Jay Zwally, a glaciologist with NASA Goddard Space Flight Center in Greenbelt, Maryland, and lead author of the study, which was published on Oct. 30 (2015) in the Journal of Glaciology. “Our main disagreement is for East Antarctica and the interior of West Antarctica – there, we see an ice gain that exceeds the losses in the other areas.” Zwally added that his team “measured small height changes over large areas, as well as the large changes observed over smaller areas.”
So the actual data on what is claimed to be the many effects of climate change up to now, gives no support to notion that we are anywhere near a calamity. These assertions then rest entirely on theory. The theory of greenhouse warming is simple, and undoubtedly anyone reading this paper in this journal knows it. However, the earth’s atmosphere is extremely complicated and much more is going on besides the greenhouse effect. To do theory requires that one perform computer simulations. However these computer simulations are difficult to do, and depending on the assumptions the modeler makes, one can get many different answers.
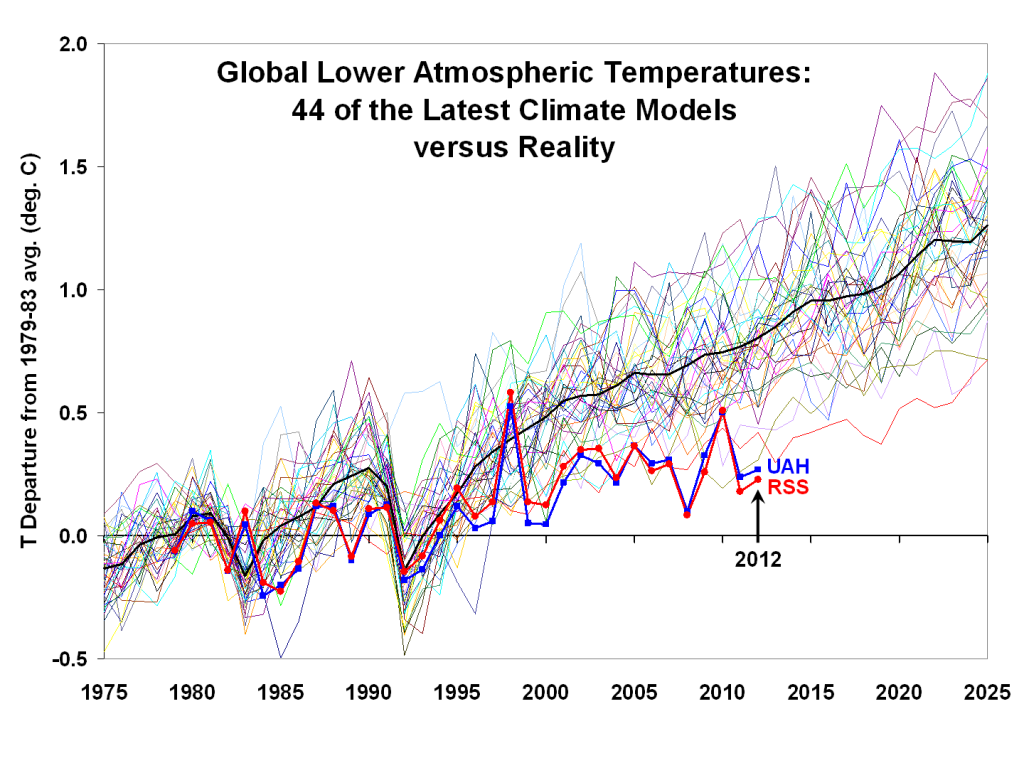
45
A typical graph showing the enormous variation in the results of numerical simulations is shown in Figure 14.
A compendium of many different numerical simulations of predictions of global temperature rise. The actual measurements are also shown as the red and blue solid lines with the dots.
All of the calculations shown in Figure 14 show more temperature rise than were measured from 1975 to 2012 (i.e. the present). Figure 14 makes the case that climate computer simulations have a long way to go before one can base public policy on them, especially public policy that would have a major effect on the lifestyle of billions of people.
Conclusions
To summarise, the two unconventional thoughts expressed here are:
First, for fusion to have a significant impact on mid-century power requirements, when it may well be urgently needed, the only option is to switch from pure fusion, to fusion breeding. ‘The Energy Park’ could become an achievable, sustainable, economical, carbon free, environmentally sound mid-century energy infrastructure, which could provide terawatts of power to the world. A further discussion is available in Manheimer, 2 which is available open access.
Second, the actual data show that up to now fears of imminent climate catastrophe are not supported by data, or else involve processes occurring since long before excess CO2 in the atmosphere became a concern. Based on actual measurements and reasonable extrapolation of them, there is no reason why the responsible use of fossil fuel cannot continue to support worldwide civilisation. The argument to greatly restrict fossil fuel rests entirely on the theoretical assertion that at some point in the near future there will be a sudden and dramatic change in the very nature of the data presented here. If implemented, these would be sufficient to greatly upset the lifestyle of billions of people, and to further impoverish the already most impoverished parts of the world.
Footnotes
Declaration of conflicting interests
The author(s) declared no potential conflicts of interest with respect to the research, authorship, and/or publication of this article.
Funding
The author(s) received no financial support for the research, authorship, and/or publication of this article.