
Abstract
Polish international obligations, in particular the European Union and European Commission directives, pose a real challenge for Poland to radically reduce emissions of atmospheric pollutions and significantly increase the usage of energy coming from renewable sources in the overall energy balance of the country. These goals seem to be difficult to achieve, nevertheless the development and implementation of innovative concepts is always a step forward. Nowadays the renewable energy sources seem to be the panacea for the problems of pollutions and energy saving. Many inventors and scientists work on concept of smart grid technology. The basic concept of this technology is producing energy directly in the cities. It seems to be a good idea but often in urban areas there is no place for new installations or cost of land is the barrier. Therefore to produce and manage energy directly in the cities, we have to take into account many aspects such as cost of land, location, available renewable energy sources, number of inhabitants, electrical network, terrain obstacles, and local plans. Here is the good place to use geographic information system technology which can help us to analyze all these issues and combine spatial, satellite, and statistical data to create one coherent concept of managing various sources of energy in the cities. The aim of this study is to consider opportunities of using geographic information systems in supporting process of energy management in the cities. It was taken into account many important elements: solar conditions, impact of cloudiness on value of solar radiation, spatial data, buildings and electrical network, obstacles, and number of inhabitants. It is all for identify the advantages and disadvantages of geographic information system in the analysis of solar energy potential in the city.
Introduction
International obligations, the European Union directives in particular, make Poland face a difficult challenge to reduce the emission of atmospheric pollutants and increase the share of energy from renewable sources in the overall energy balance of the country. The recent agreement, which Poland ratified, is the Paris Agreement signed at the United Nations Conference on Climate Change on 12 December 2015 in Paris, under which 195 participating countries agreed to adopt the final global agreement, according to which the reduction of the emission is to take place as a part of a process to reduce the emission of greenhouse gases. Under the 12-page document, the parties agreed to reduce the production of carbon dioxide “as soon as possible” and ensured that they are going to make every effort to keep global warming at “significantly lower level than 2℃.” The text of the agreement also includes provisions establishing periodic reviews of the undertakings every five years, starting from 2023. 1
The set aims seem to be difficult to achieve. However, the development and implementation of innovative concepts is a step forward in this struggle.
Essential are here urban areas, as they consume a huge amount of energy. Therefore, the need to produce energy directly at the point of consumption seems to be obvious. The compact city structure, however, brings certain limits to the location of power plants. The obstacle may also be the price of land for investment.
These problems can be solved, however, by micro-energy installations of distributed power engineering forming a mutually cooperating network. The so-called smart grid technology has been repeatedly described in the world literature and now there are the first examples of the implementation of this concept. 2
Placing micro-installations in the city, not developed roof surfaces are used for investments, and, what is more, due to the fact that no new building is created, issues concerning building permits can be omitted. Obviously, the roof does not locate a power plant, but placing there photovoltaic (PV) cells can be considered. The issue of choosing the best locations is left open so that PV cells provide the most of energy, and that their location meets other requirements, such as the distance from power lines, etc. Here, geographic information systems (GIS) come to aid.
Aim and scope of this study
The main goal of this study is to consider opportunities of using GISs as an instrument helpful for energy management in the cities. Urban areas consume a huge amount of energy. Therefore, the best way is to produce energy directly at the point of consumption. However, city structure and the price of land for investment constitute as obstacles for energy plant location. To efficiently use and produce energy in cities there is a necessity to take into account many elements which can have influence on solar panels’ (PV) energy productivity. The most important elements that should be taken into consideration are solar conditions, impact of cloudiness on value of solar radiation, spatial data, buildings and electrical network, obstacles, and number of inhabitants.
The aim of this study is to appraisement of GIS as tool supporting energy management in city areas. Study scope consider appraisement of geographic information systems (GIS) as tool supporting energy management in the cities e.g. as a part of wider system (Smart City concept). These systems are designed for analysis major factors that could have an impact for efficient energy management in cities.
Smart City concept
The future of cities management is the concept of Smart City. There are many definitions of Smart Cities used globally; Standardization Administration of China—the general working group of Chinese national smart cities standardization—uses the following definition published in Smart City Report
2
: a new concept and a new model which apply the new generation of information technologies, such as the internet of things, cloud computing, big data and space/geographical information integration to facilitate planning, construction, management, and smart services of cities. Thanks to the development of Smart Cities synchronized development, industrialization, computerization, urbanization, and agricultural modernization as well as sustainability of cities development can benefit.
The main goals for developing Smart Cities are to pursue:
high standard of public services; simplicity of city management; liveability of living environment; smartness of infrastructures; long-term effectiveness of network security.
According to the purpose of the Smart Cities Mission, these conceptions should be considered with elements such as smart transport, data access, smart administration, education, smart energy, health care, smart public security, and smart home (Figure 1).
Smart City elements.23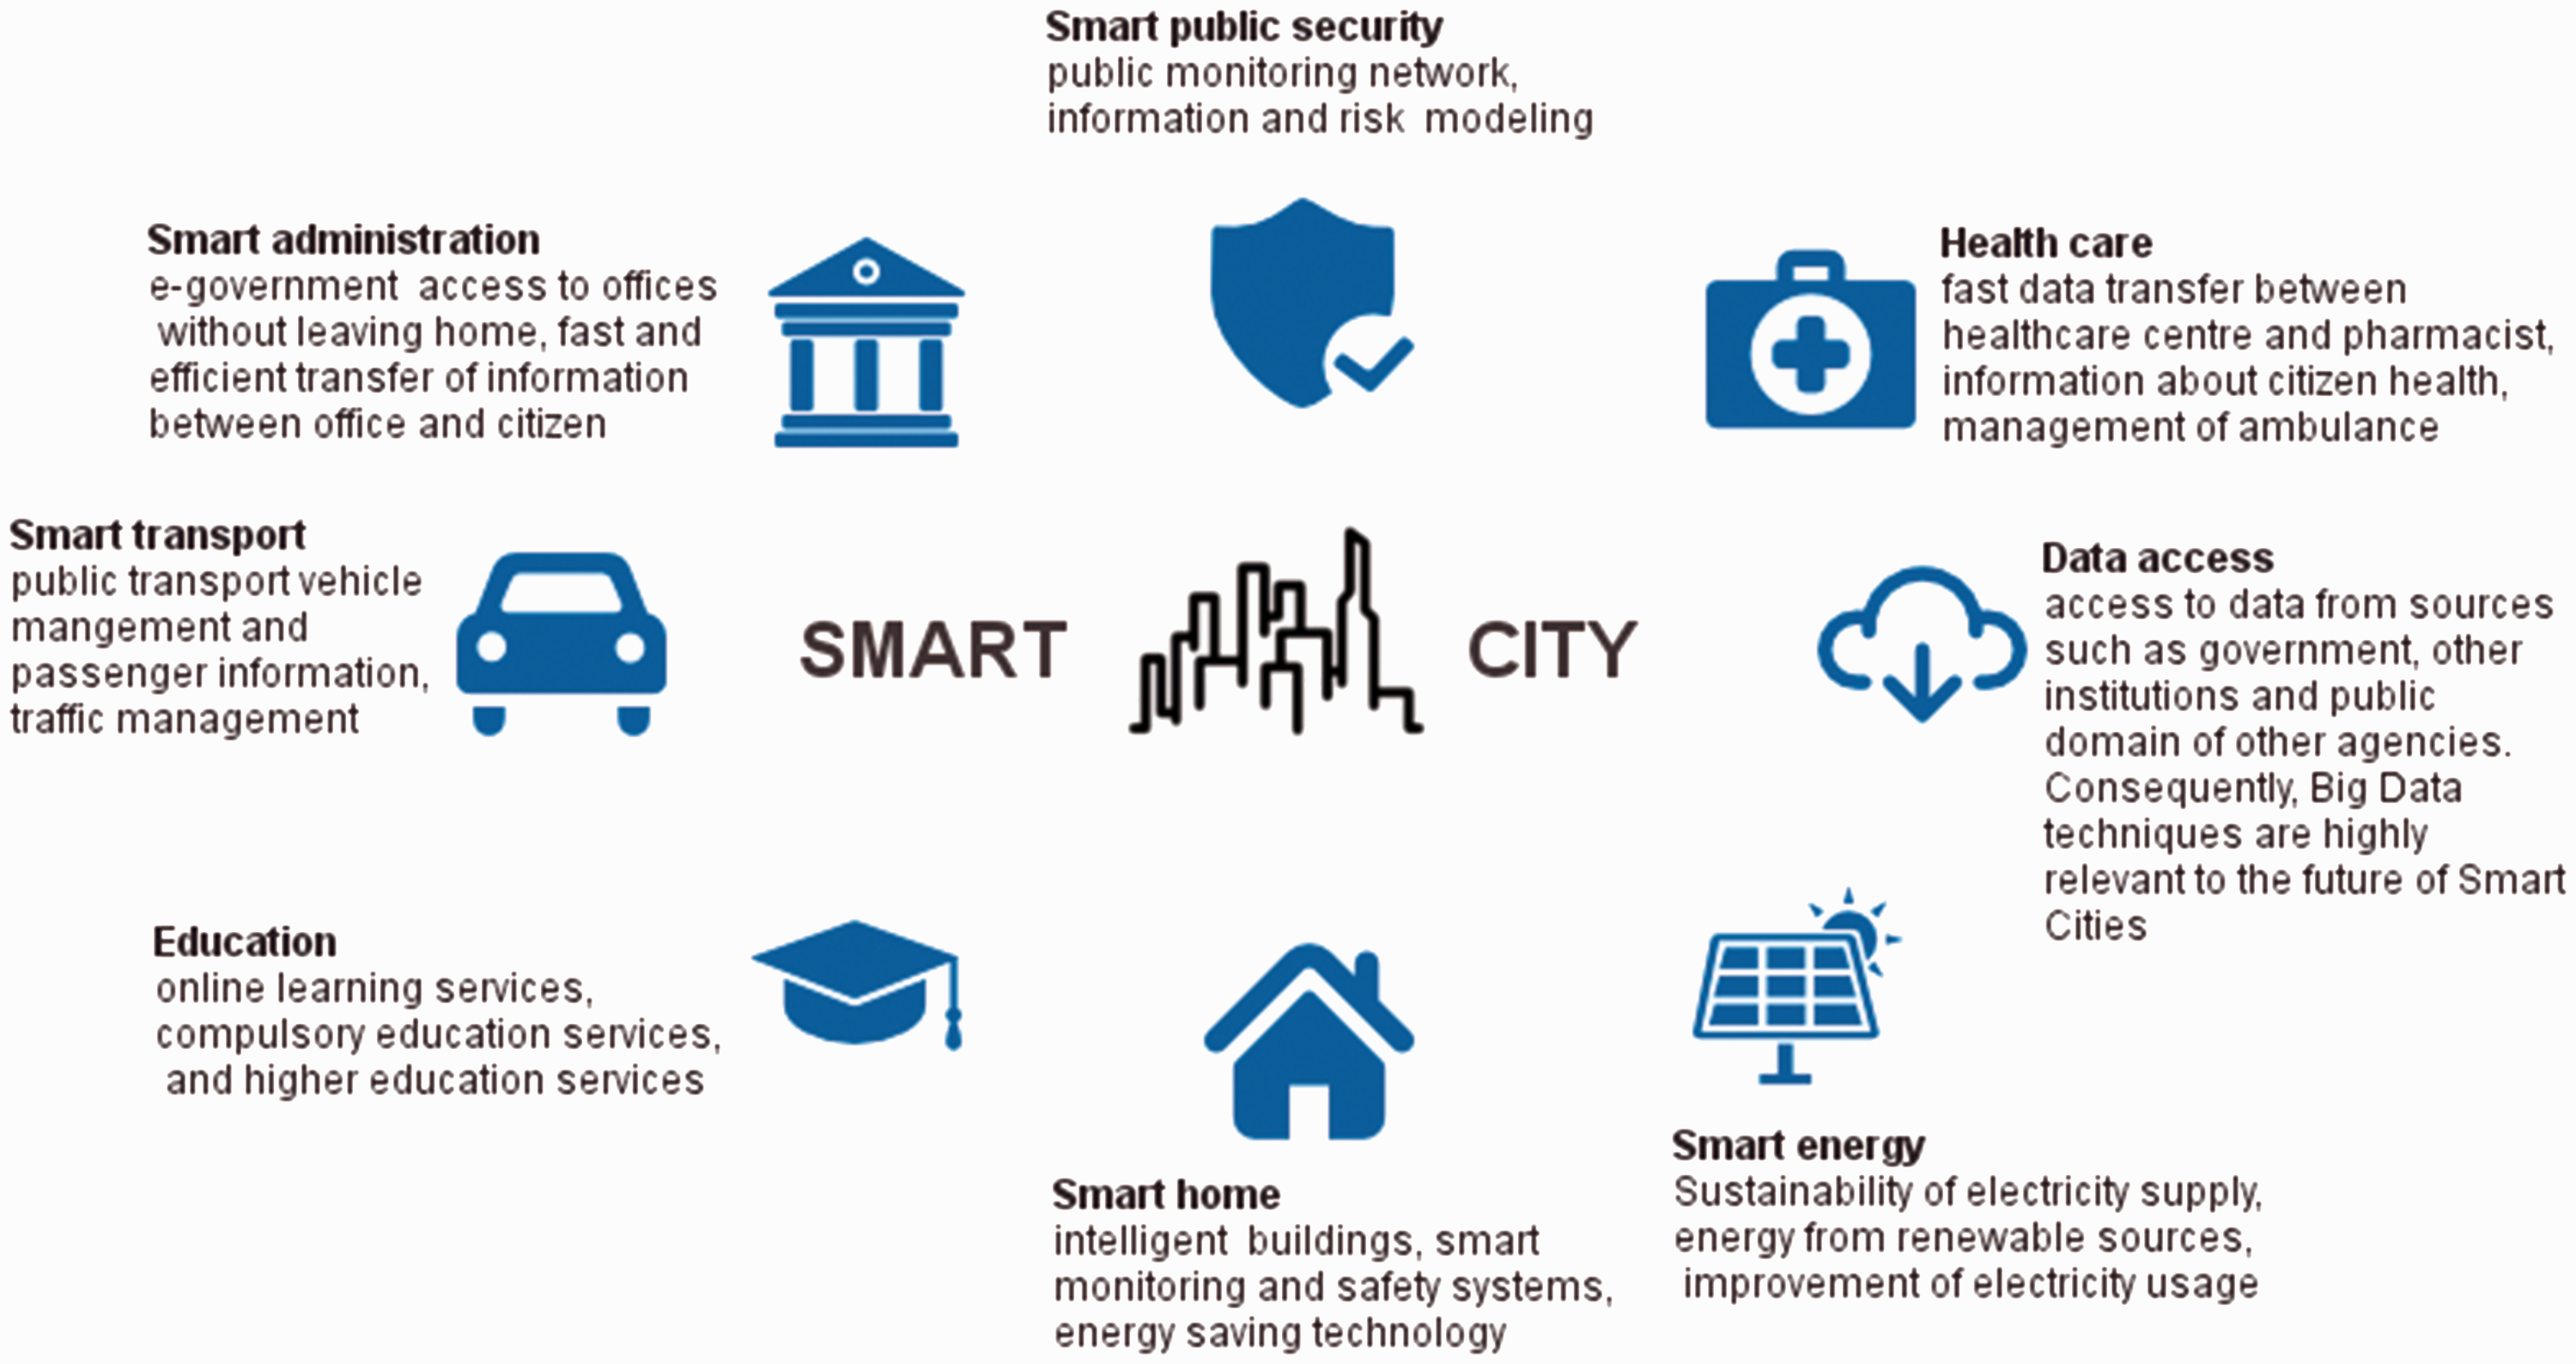
GIS technology as a part of Smart City
A GIS is computer system technology designed to collect, store, analyze, manage, and present all the types of geographical data. GIS can be referred to a number of different technologies, processes, and methods. It has many applications related to engineering, planning, energy management, infrastructure, transport, logistics, insurance, telecommunications, and business. In Smart Cities, GIS is used to provide location-based services. The implementation of a GIS in Smart City is obvious. GIS technology, especially location applications can be the base as far as many services that rely on analysis, visualization, and dissemination of results are concerned. GIS provides a technological platform to locate, search, and update geographical data without wasting time to visit the field and update the database manually.
For that reason, GIS is a tool that allows authorities and citizens to use online maps and reports, create interactive queries, and analyze spatial information. This technology can be useful in each of eight Smart City elements. In this paper, one of them, GIS use in energy management, will be taken into consideration.
Nowadays the renewable energy sources seem to be the panacea for the problems of pollution and energy saving. Many inventors and scientists work on a concept of smart grid technology. The basic concept of this technology is producing energy directly in cities. It seems to be a good idea, but there is often no space for new installations in urban areas or the cost of land is the obstacle. Therefore, to produce and manage energy directly in cities, many aspects such as cost of land, location, available renewable energy sources, number of inhabitants, electrical network, terrain obstacles, and local plans have to be taken into account (Figure 2). GIS technology may be useful here as it can help to analyze all these issues and combine spatial, satellite, and statistical data to create one coherent concept of managing various sources of energy in cities.
GIS as a part of Smart City concept in energy management.23 GIS: geographic information system.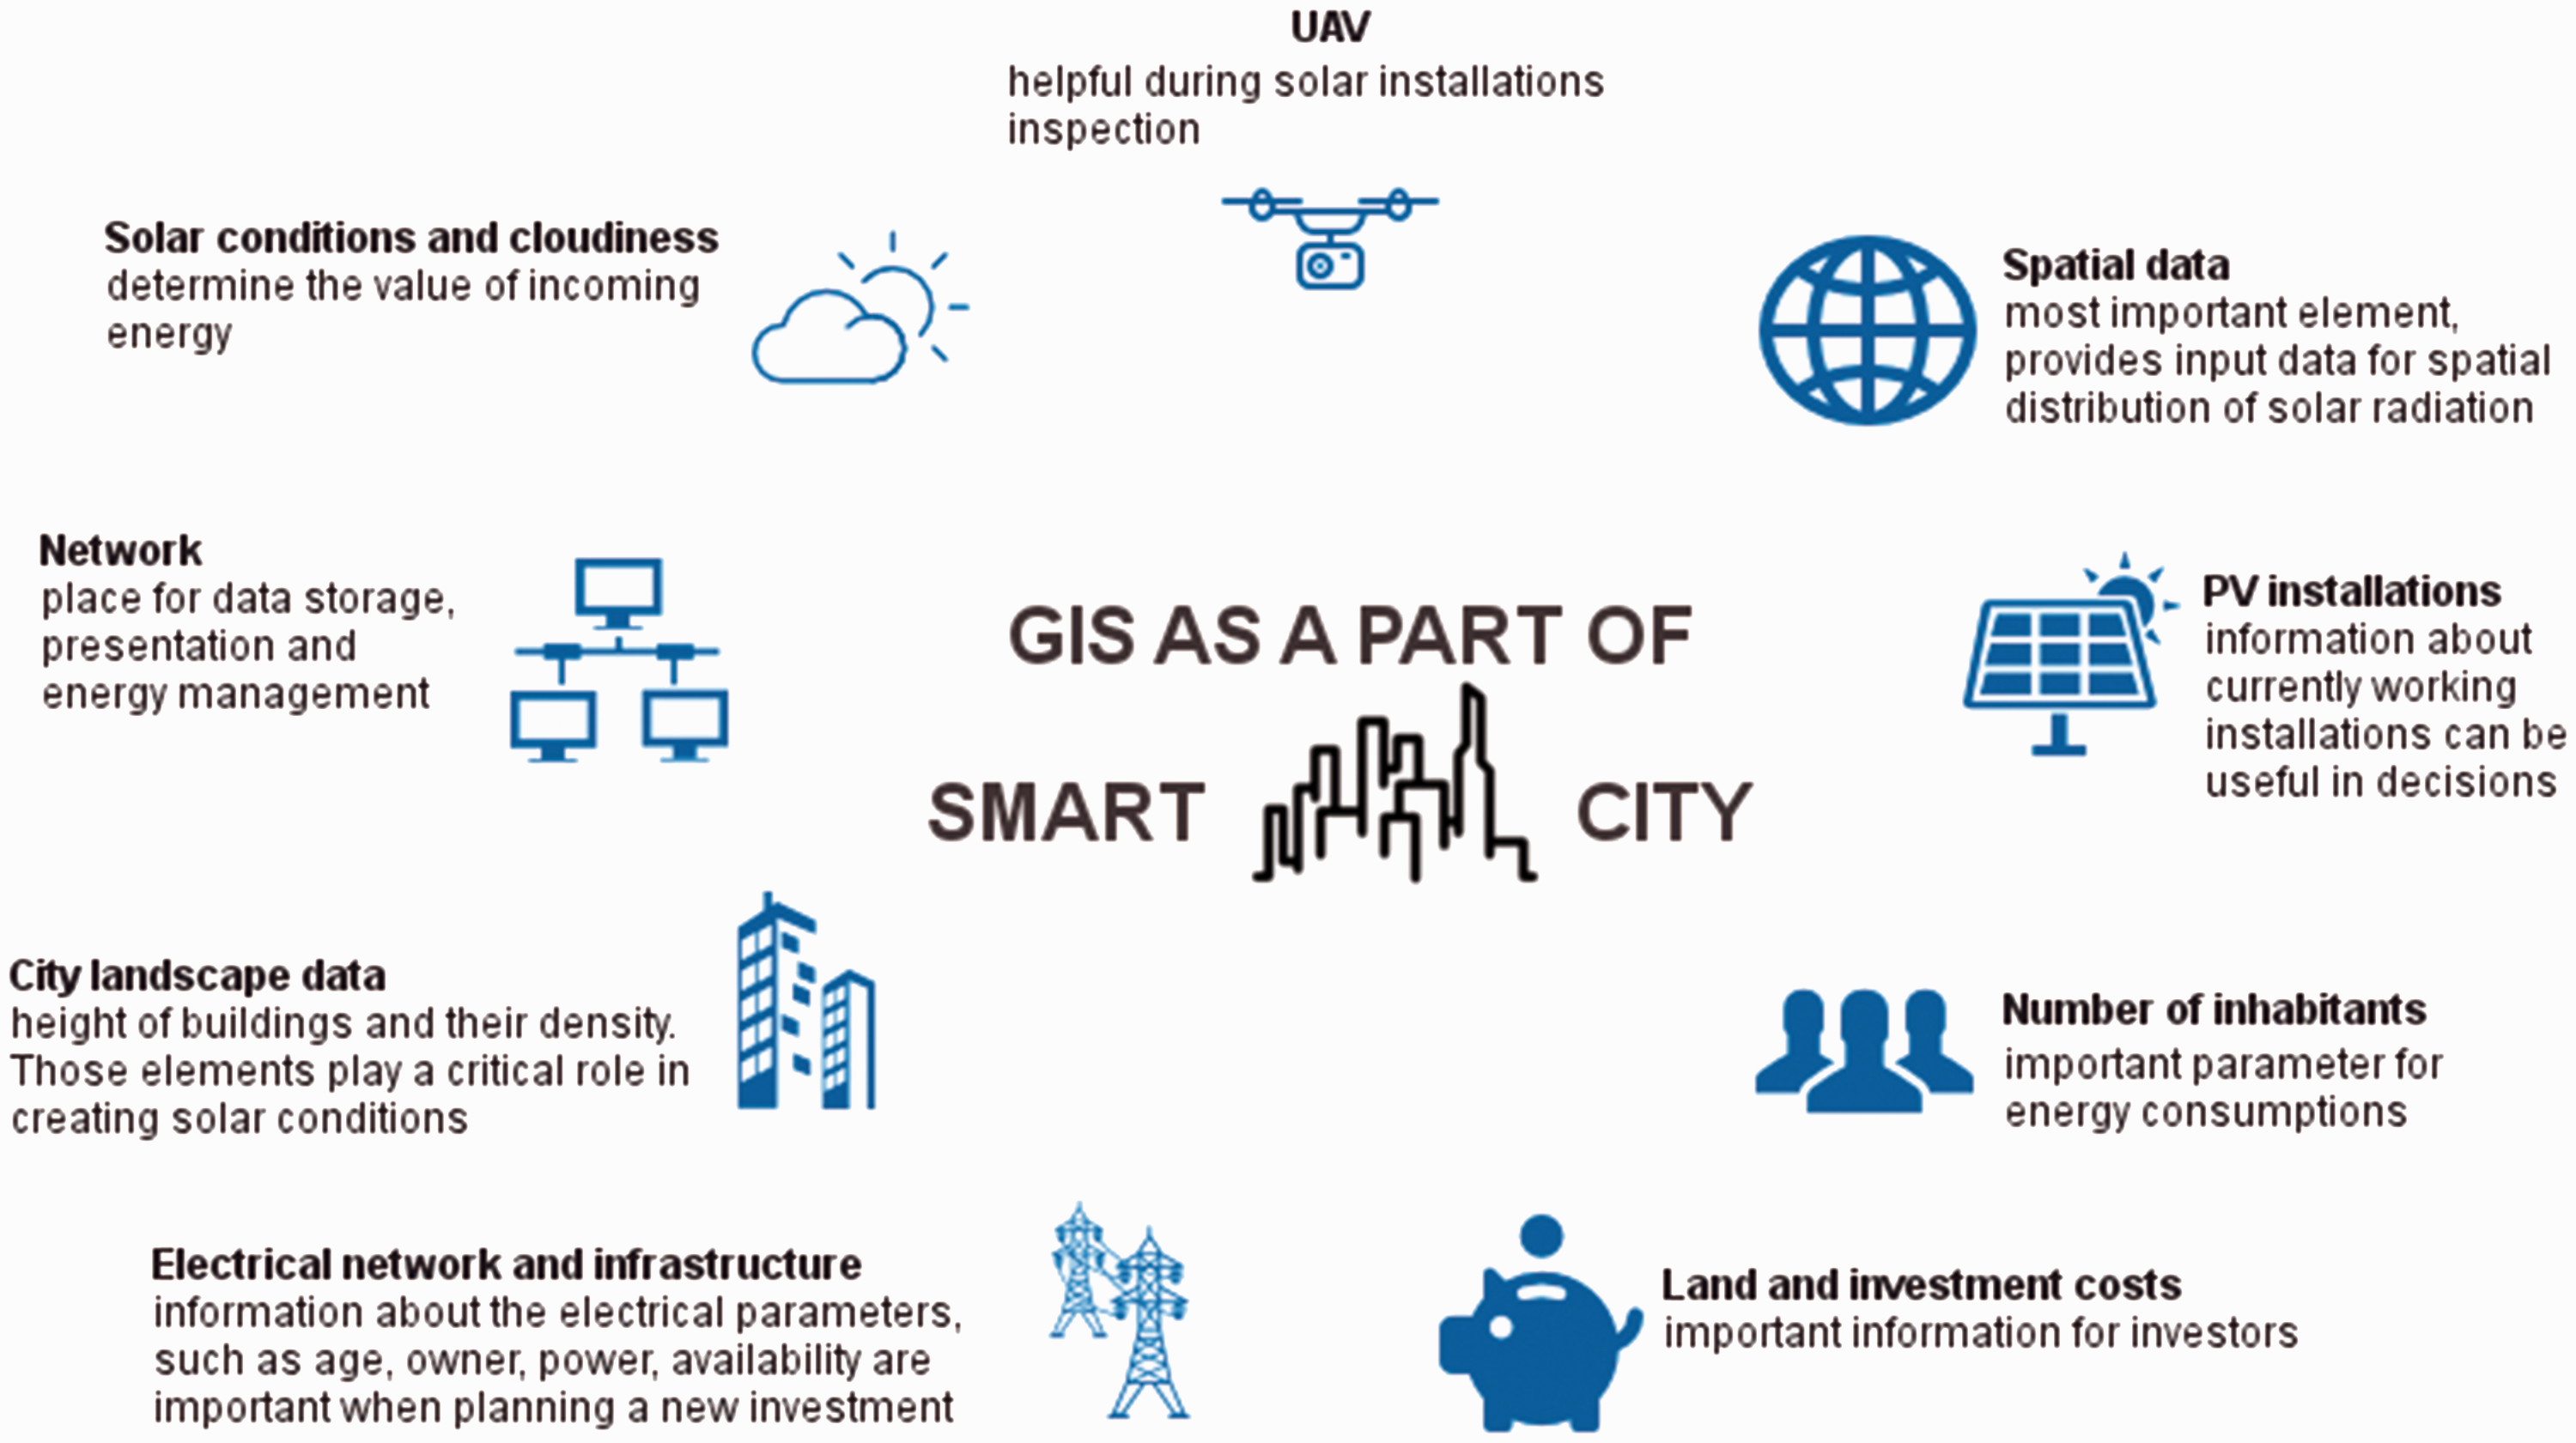
A conception presented here should be seen as the admission of the use of GISs to generate spatial distribution of total solar irradiation in real sky condition. In the future, this solution should be a part of an energy management system in the city and may also forecast the solar resources in the selected area.
For the efficient management of energy in the city, the following GIS elements should be taken into account: solar conditions, impact of cloud cover on the value of solar irradiation, spatial data, buildings and electrical network, obstacles, and number of inhabitants. The data from the Department of Climatology and Atmospheric Protection together with the orthophotomap of Wroclaw can be employed to create concepts of managing solar energy in the city.
The management of PV installations can be supported by unmanned air vehicles (UAVs). This technology is helpful during the inspection, for example, in search of damage, pollution, and devastation.
Methodology of appraisement solar conditions using GIS techniques
To make the use of solar energy effective, its resources should be recognized well. So far, assessing the resources of Polish solar energy, parameters such as the number of hours of sunshine, the sums of the monthly and annual solar irradiation, transparency of the atmosphere, and the local diversity of the terrain have been taken into account. In many studies, the basis was the actinometrical data from the measuring stations. It should be noted, however, that the number of such stations in Poland is low. In Lower Silesia actinometrical stations are located in Wroclaw, Jelenia Góra, Kłodzko Legnica, and Śnieżka. Therefore, the studies based on the interpolation of the measurement data are vitiated by a considerable error.
Due to the high inaccuracy of the studies based on the data from the actinometrical stations, it is more efficient to use the capacities of the GIS programs—GIS.
These programs have implemented physical models, thus enabling parameter setting of the atmospheric elements, e.g., declination of the sun, shade, and cloud cover, although the latter element causes a lot of difficulties.
Nowadays there are several models for calculation of solar irradiation. One of the first models was a SolarFlux 5 of ArcInfo and Solei model in GIS IDRISI. 6 Both, due to the use of simplified algorithms, were effective only in the calculations for small regions. More advanced models are the Solar Analyst of Arc Viev 7 and SRAD, which allow taking into account in the analyses the relief as well as the atmospheric interactions; however, they work well only for small regions. 8
R.sun model was created on the basis of the earlier work of Hofierka. 9 It allows to calculate the amount of incoming solar irradiation on the basis of a digital terrain model and a parameter setting of the atmospheric processes.10–13
One of the objectives of the presented approach is using r.sun model in the evaluation of the solar potential of a selected area. Work on parameter setting of the existing model in such a way that the results obtained are as close as possible to the measurement data is concerned.
R.sun model, which is a part of GIS GRASS available under license GPL (GNU General Public License), was used as a tool for the analysis. 9 The selected program was GRASS, constituting the so-called free software. Its main advantage is the lack of costs arising from the purchase of the license and unlimited freedom of a user when introducing modifications. Another advantage is the speed of work and the ability to use scripts of simple programming languages (python, bash) in the analyses.
R.sun model allows the calculation of parameters such as the intensity of direct radiation, the intensity of reflected radiation, and the intensity of diffused radiation. The amount of the intensity of solar irradiation is given in W/m2, while total solar irradiation in W h/m2. 14
All the input data and model parameters have been already described.15,16 In this study, the attention has been paid to the effects of analyzes employing r.sun model based on the city. The fundamental novelty the analyses introduce, the results of which have been presented below, is taking into account cloud cover and atmospheric turbidity caused by pollutants present in the atmosphere. That is why the results present the intensity of total solar irradiation in real conditions.
The issue of using r.sun model for generating spatial distribution of total solar irradiation was discussed in previous works, e.g., those of Hofierka, Suri, and Kryza. However, these works have not included the clouds’ impact on the total amounts of solar irradiation. In general, the spatial distribution of solar irradiation is determined by numerous elements such as terrain, atmosphere, pollutants, water and aerosol in atmosphere, as well as clouds and shadowing effects of the surrounding buildings.
The underlying problem is calculating incident solar irradiation on a regional scale. In such a case, the major factors modifying the distributions of radiation are the local shadowing effects of the terrain (e.g. slopes and aspects). Apart from that, the local shadowing effects of the terrain are also important. Another crucial feature that should be taken into account during the solar analysis is cloud cover. As clouds constitute a barrier for irradiation of the sun, the solar irradiation models should include cloud cover. So far, this problem has been examined in numerous studies and Miklánek 6 and Hofierka and Suri 17 used the data from the local ground stations to determine the range of clouds. However, such data are reliable exclusively for a region surrounding the station.
R.sun model was first used to develop the maps of the solar potential for the province of Lower Silesia. During the work on the methodology aimed at improving the results of the calculations, the idea of using r.sun model for the urban area arose. Using the previously developed methodology, 16 which allows to take into account cloud cover, atmospheric turbidity, and solar declination in calculations, they were performed for a part of Wroclaw. The data describing the geometry of the buildings come from the resources of the Central Documentation Centre of Geodesy and Cartography.
In addition to calculating the amount of radiation reaching surface of buildings roofs, the model shows a decrease in the amount of reaching radiation caused by shading effect of surrounding objects. Currently, the works on taking into account the size of shading caused by vegetation are taking place. However, it is a complex issue due to the seasonal variation of the compactness of crowns of trees of different species.
Input data
Input data for spatial solar irradiation distribution consist of:
The orthophotomap registered on the index of numerical elevation data as M-33-35-C-a-3-3 obtained from the Central Documentation Centre of Geodesy and Cartography.
Digital orthophotomap is a raster cartometric image of an area formed by orthogonal processing of aerial photographs or satellite images.
Maps are available in flat rectangular coordinate system 1992 or 2000, true color (RGB), grayscale (B/W), or false color with near infrared channel (CIR). The applied orthophotomap was shared in a digital form in GeoTIFF format and in field physical pixel size of 0.10 m.
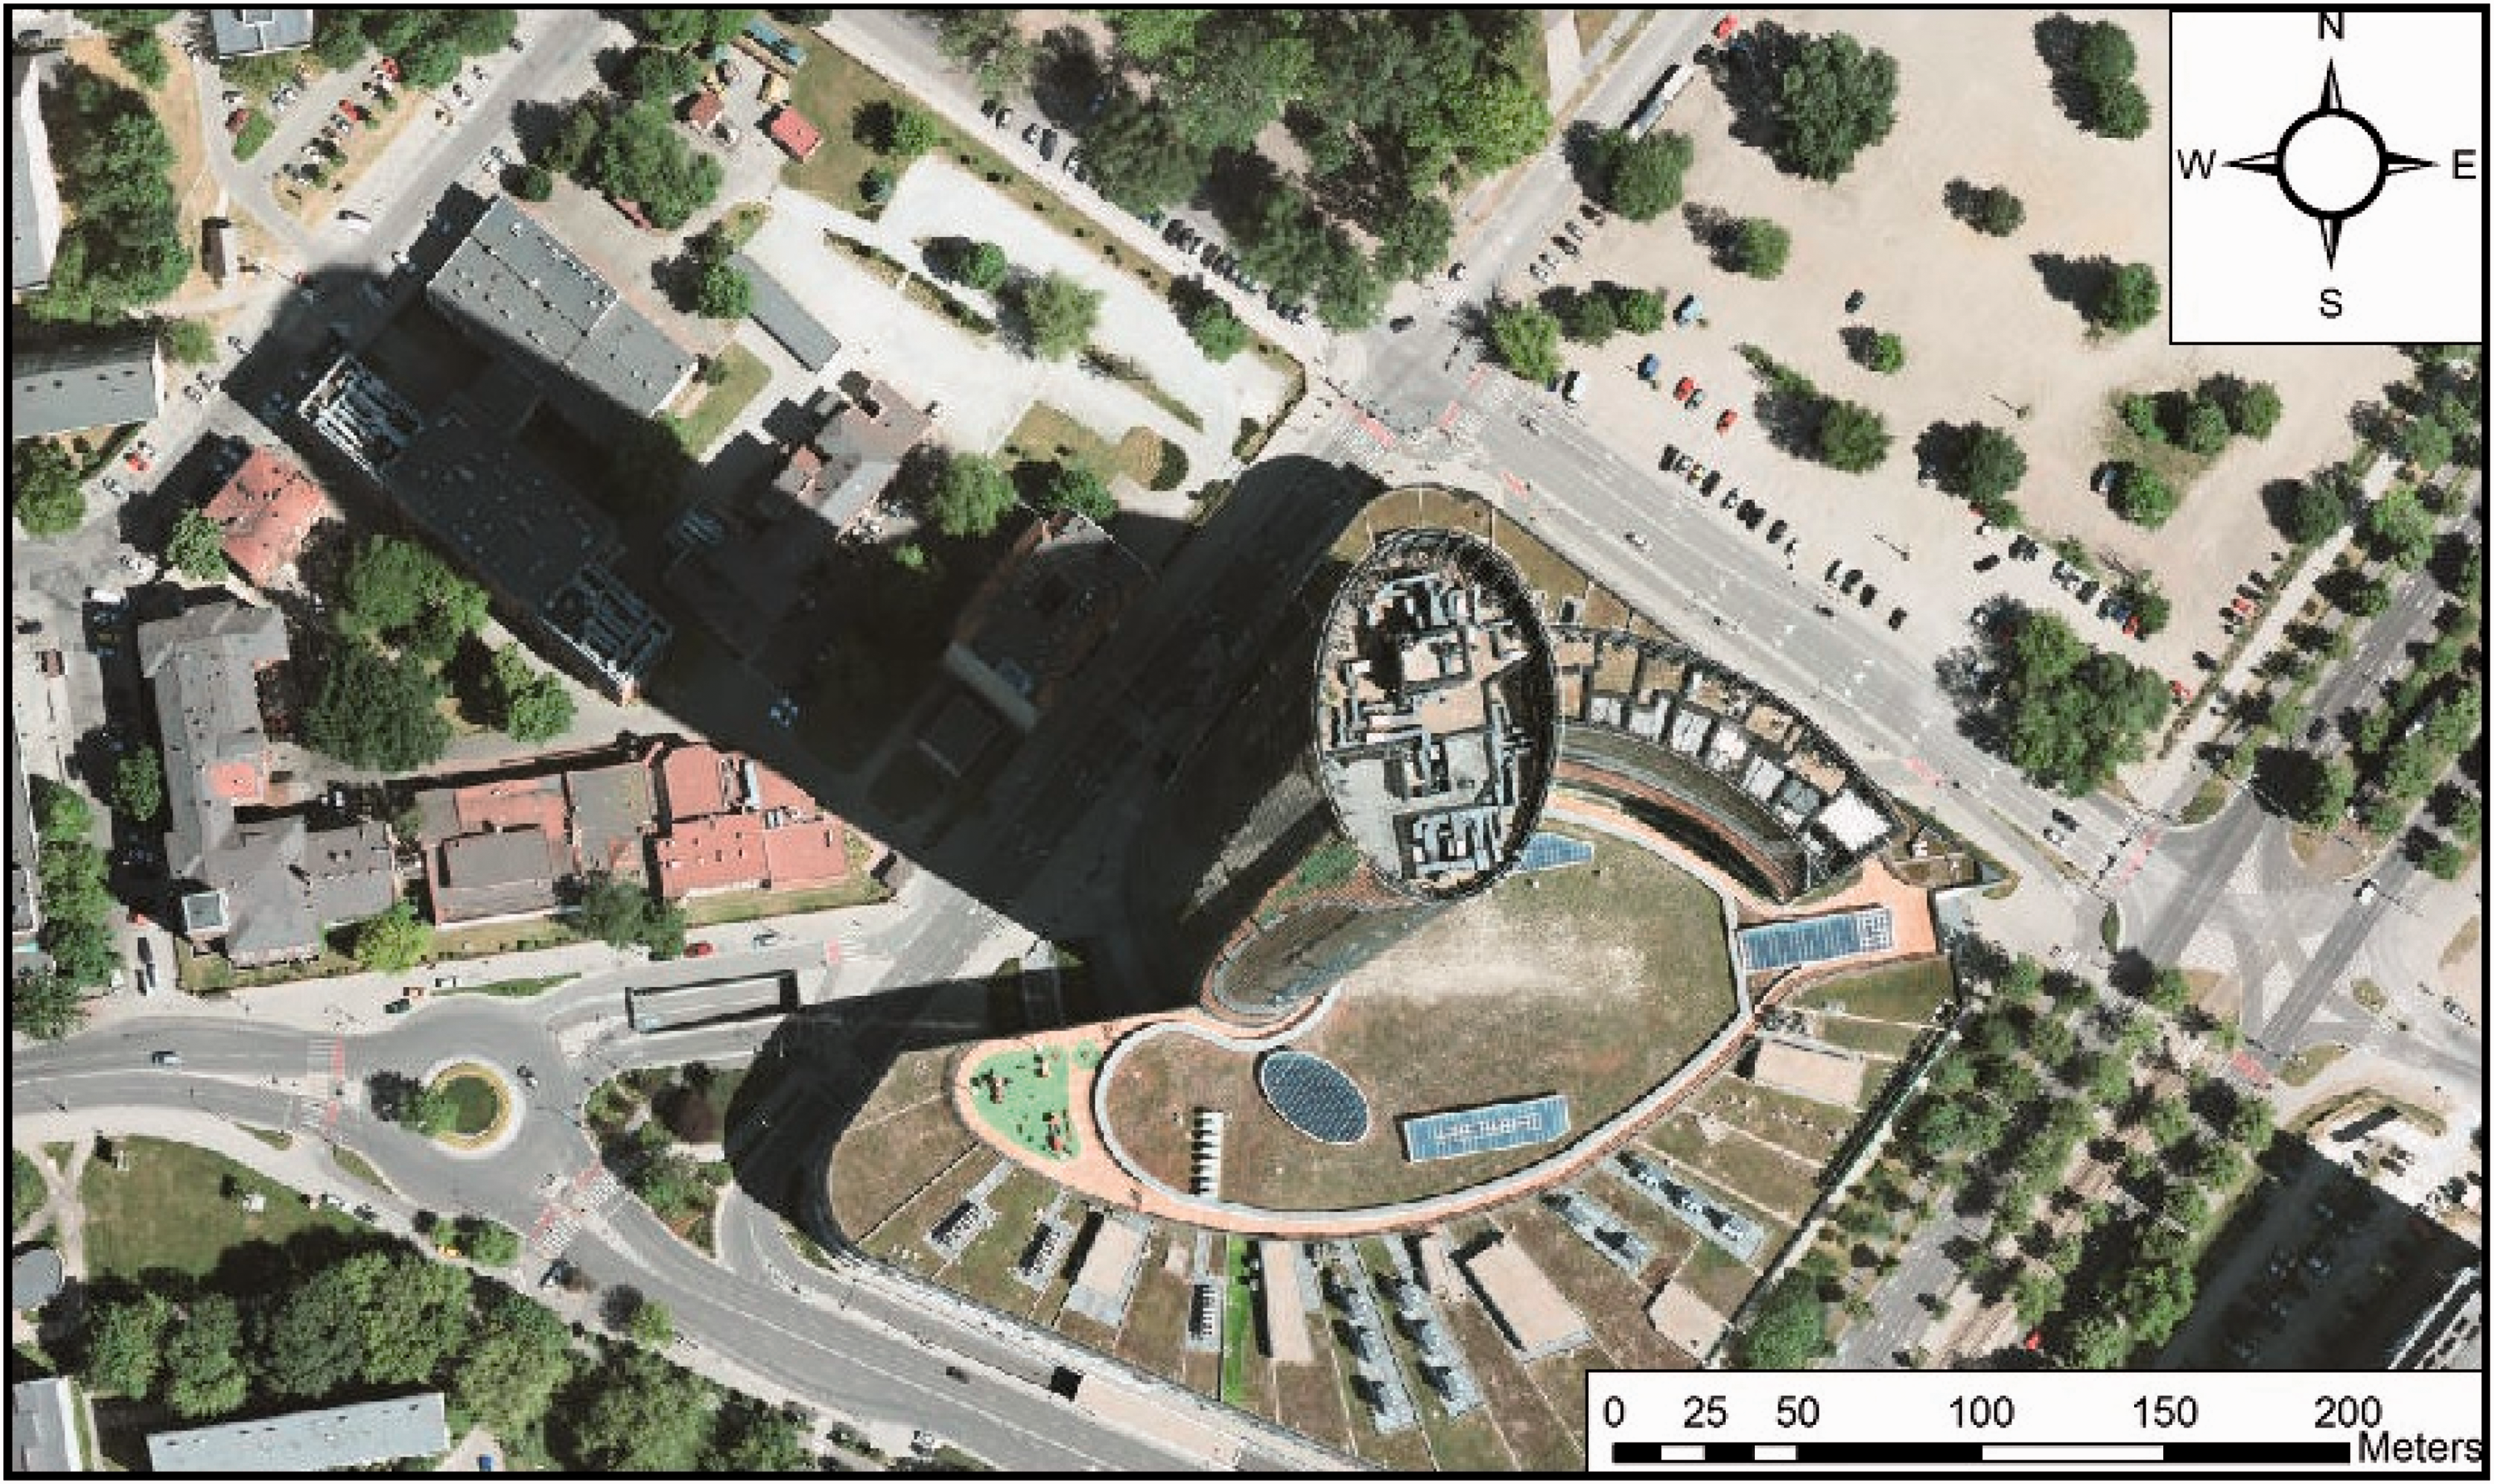
In order to process the data more efficiently, the area shown in Figure 3 was separated. This is the area in the center of Wroclaw—the intersection of Gwiaździsta and Szczęśliwa Streets. The map shows the tallest building in Poland—Sky Tower.
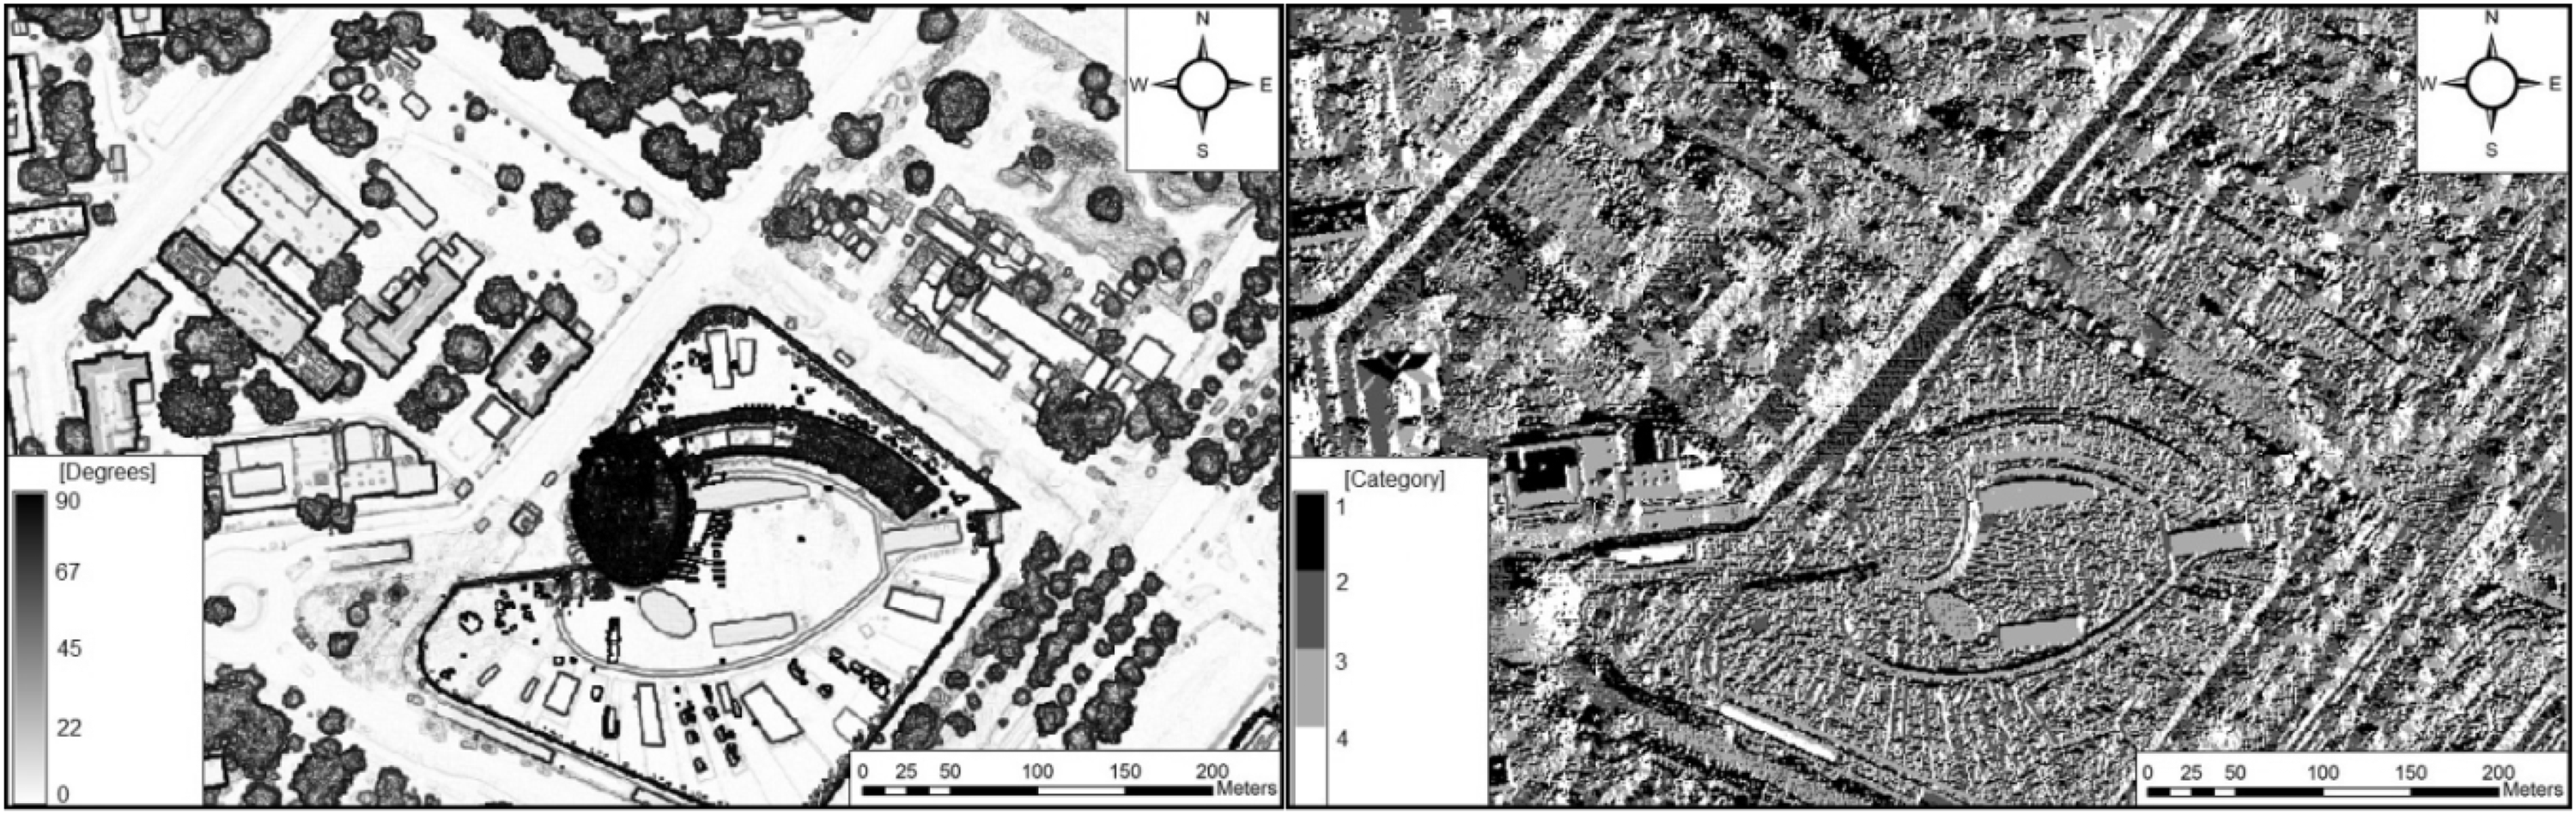
The maps of the slopes and aspects. Those maps were created using the r.slope.aspect command in GRASS. The slope and aspect values were calculated based on Wroclaw ortophoto raster map. The examples of slope and aspect raster maps are presented below. Slope and aspect are given in degrees by default. In case of aspects maps, the categories represent the degree number from the eastern direction, increasing counterclockwise: 90° is North, 180° is West, 270° is South, and 360° is East. The aspect value 0° is used to indicate undefined aspect in case of flat areas with a slope of 0°. Slope and aspect raster maps will be used as input data in the analysis of the spatial distribution of solar irradiation, using r.sun model. The display (Figure 4, right side) is shown on the map in four categories: 1—northern exposure, 2—western exposure, 3—southern exposure, 4—eastern exposure. The slope is given in degrees between 0° and 90° (Figure 4, left side). The atmospheric turbidity data, in this case the Linke turbidity factor (LTF). This parameter describes the value of solar irradiation attenuation by the atmosphere.
17
The attenuation of solar irradiation is the result of absorption and dispersion of solar irradiation by the atmosphere. It can be de-composed into two components: the weakening caused by the gas constant (ideally present in the atmosphere) and caused by the water vapor and aerosols. The extinction coefficient includes both these components. Because the extinction coefficient for the ideal atmosphere is known, the ratio of extinction coefficients for the real and ideal atmosphere can be designated. This ratio is called the atmospheric turbidity factor. The average value of this factor in the temperate latitudes in lowland areas shall be 3, in big cities,
18
where the air is particularly polluted, it exceeds 4, in mountainous areas is in the range of 2–3. In winter, the value of turbidity factor is the lowest. The highest value is in summer; this is the result of the annual course of air humidity and dust changes.
18
Range of analyses. Slope (left) and aspect (right) raster maps.
The average monthly values of the Linke turbidity factor for mild climate. 17

In case of Linke factor, the data presented in Table 1 for the urban area were used. However, to optimize obtained results it is recommended to use individual value of LTF for every day. It is possible by using e.g. python language scripts (NumPy19) to determine the size of this parameter for single days.
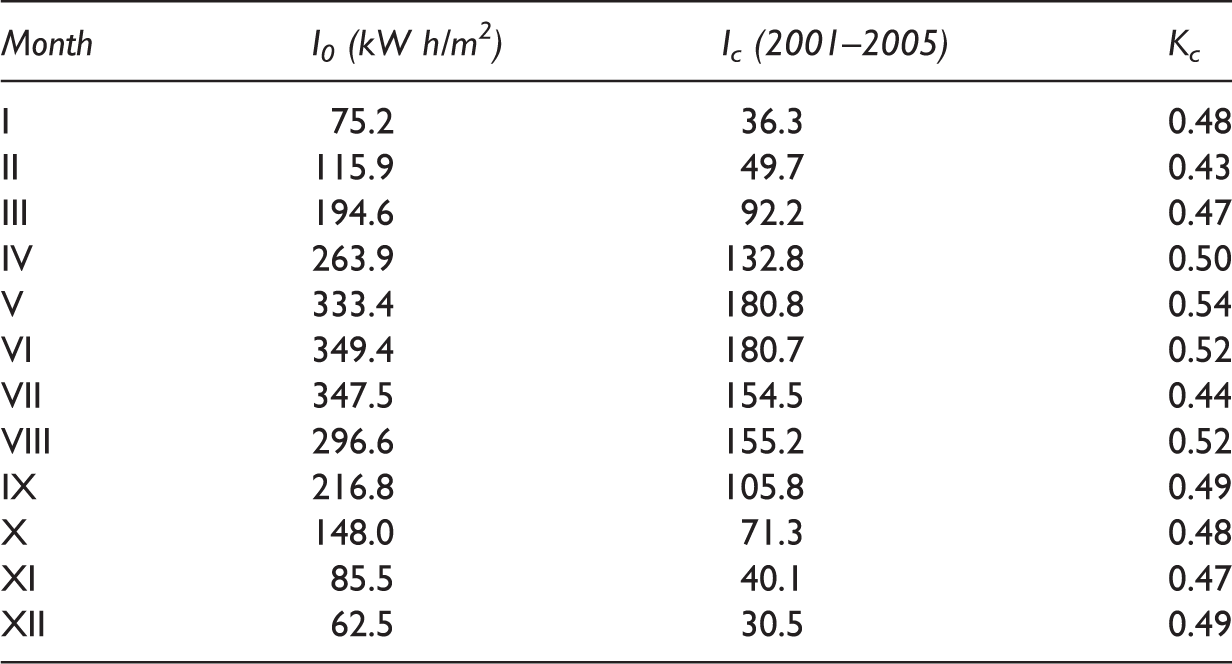
Kc factor expresses the amount of cloud cover defined as the density of the cloud as an obstacle to solar irradiation.
The size of this parameter may be set based on known solar irradiation on the upper limit of the atmosphere for a particular latitude and the measured solar irradiation at the ground station.
20
Kc = Gh / Ghc, where Gh is the intensity of real radiation and Ghc is the intensity of radiation against the clear sky. In case of the lack of information about the intensity of irradiation at a given point, the information describing the amount of cloud cover is useful. In this case, the Kc factor is determined using the method proposed by Kasen and Czeplak
20

Size of Kc parameter determined for Wroclaw.
Results
The majority of studies describing the modeling of the solar conditions discuss potential radiation—the effect of cloud cover on the sum of solar irradiation reaching the earth’s surface is neglected there. These studies are therefore only of indicative value, which means that it is possible to base on them as far as choosing a location for installation is concerned, but it is not possible to calculate profits from its work as the actual amount of solar irradiation reaching the location is unknown.
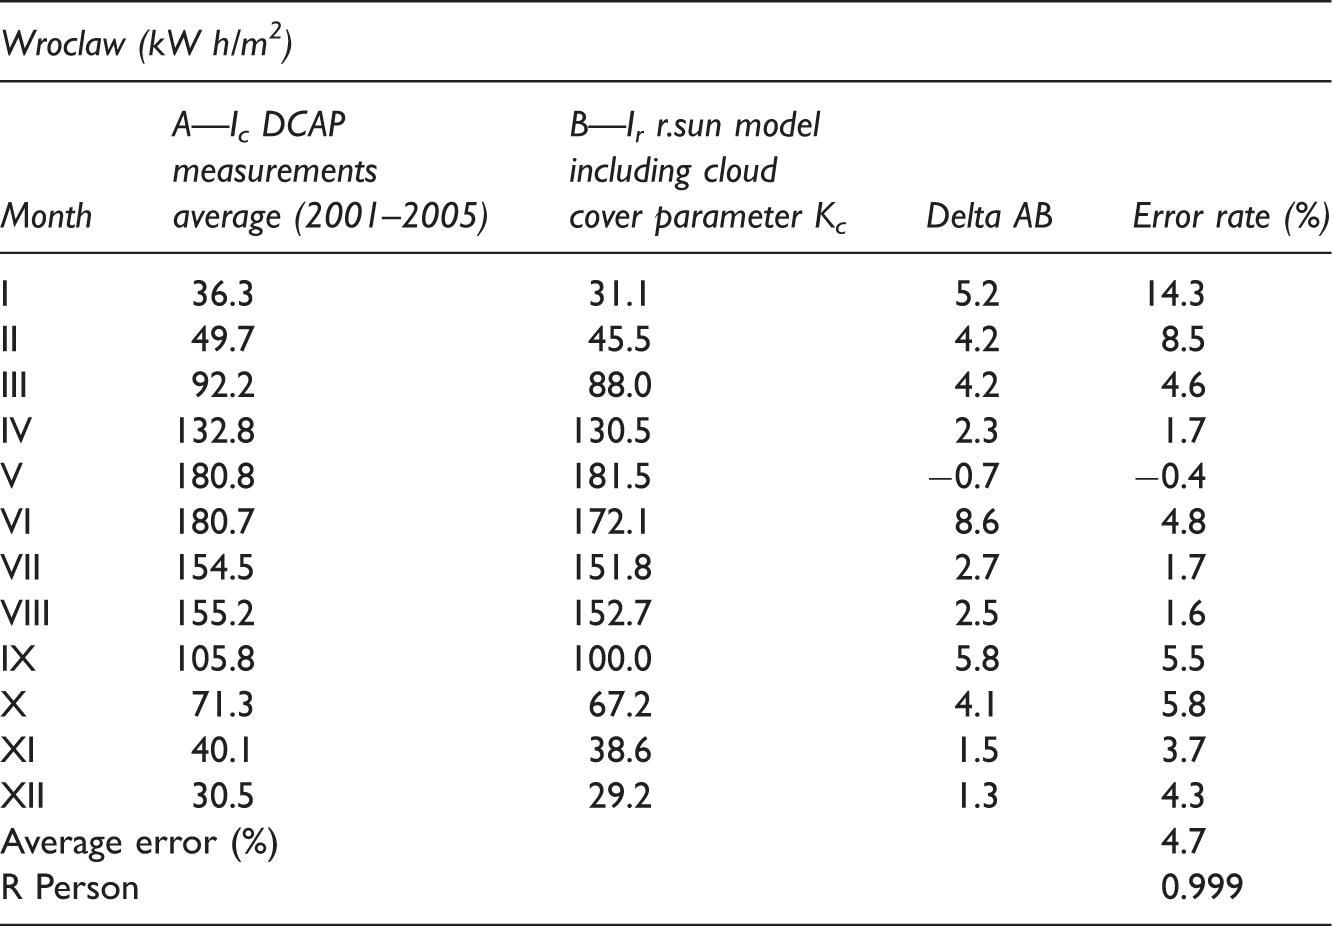
Monthly sums of radiation A—measurement (Ic) and B—model (Ir).
Real radiation was calculated as follows:
Ip—potential radiation—the result of work of r.sun model without considering cloud cover.
Ir—real radiation—the result of the work of r.sun model adjusted by Kc factor.
The presented maps have been developed in the above described methodology. The map of potential radiation (Figure 5) contains the information about the intensity of solar irradiation that reaches the earth’s surface against the clear sky. For this reason, it may be used as the development differentiating the data in terms of solar conditions, but it does not allow for the assessment of the real energy conditions prevailing in the area.
R.sun model radiation intensity, potential radiation (Ip).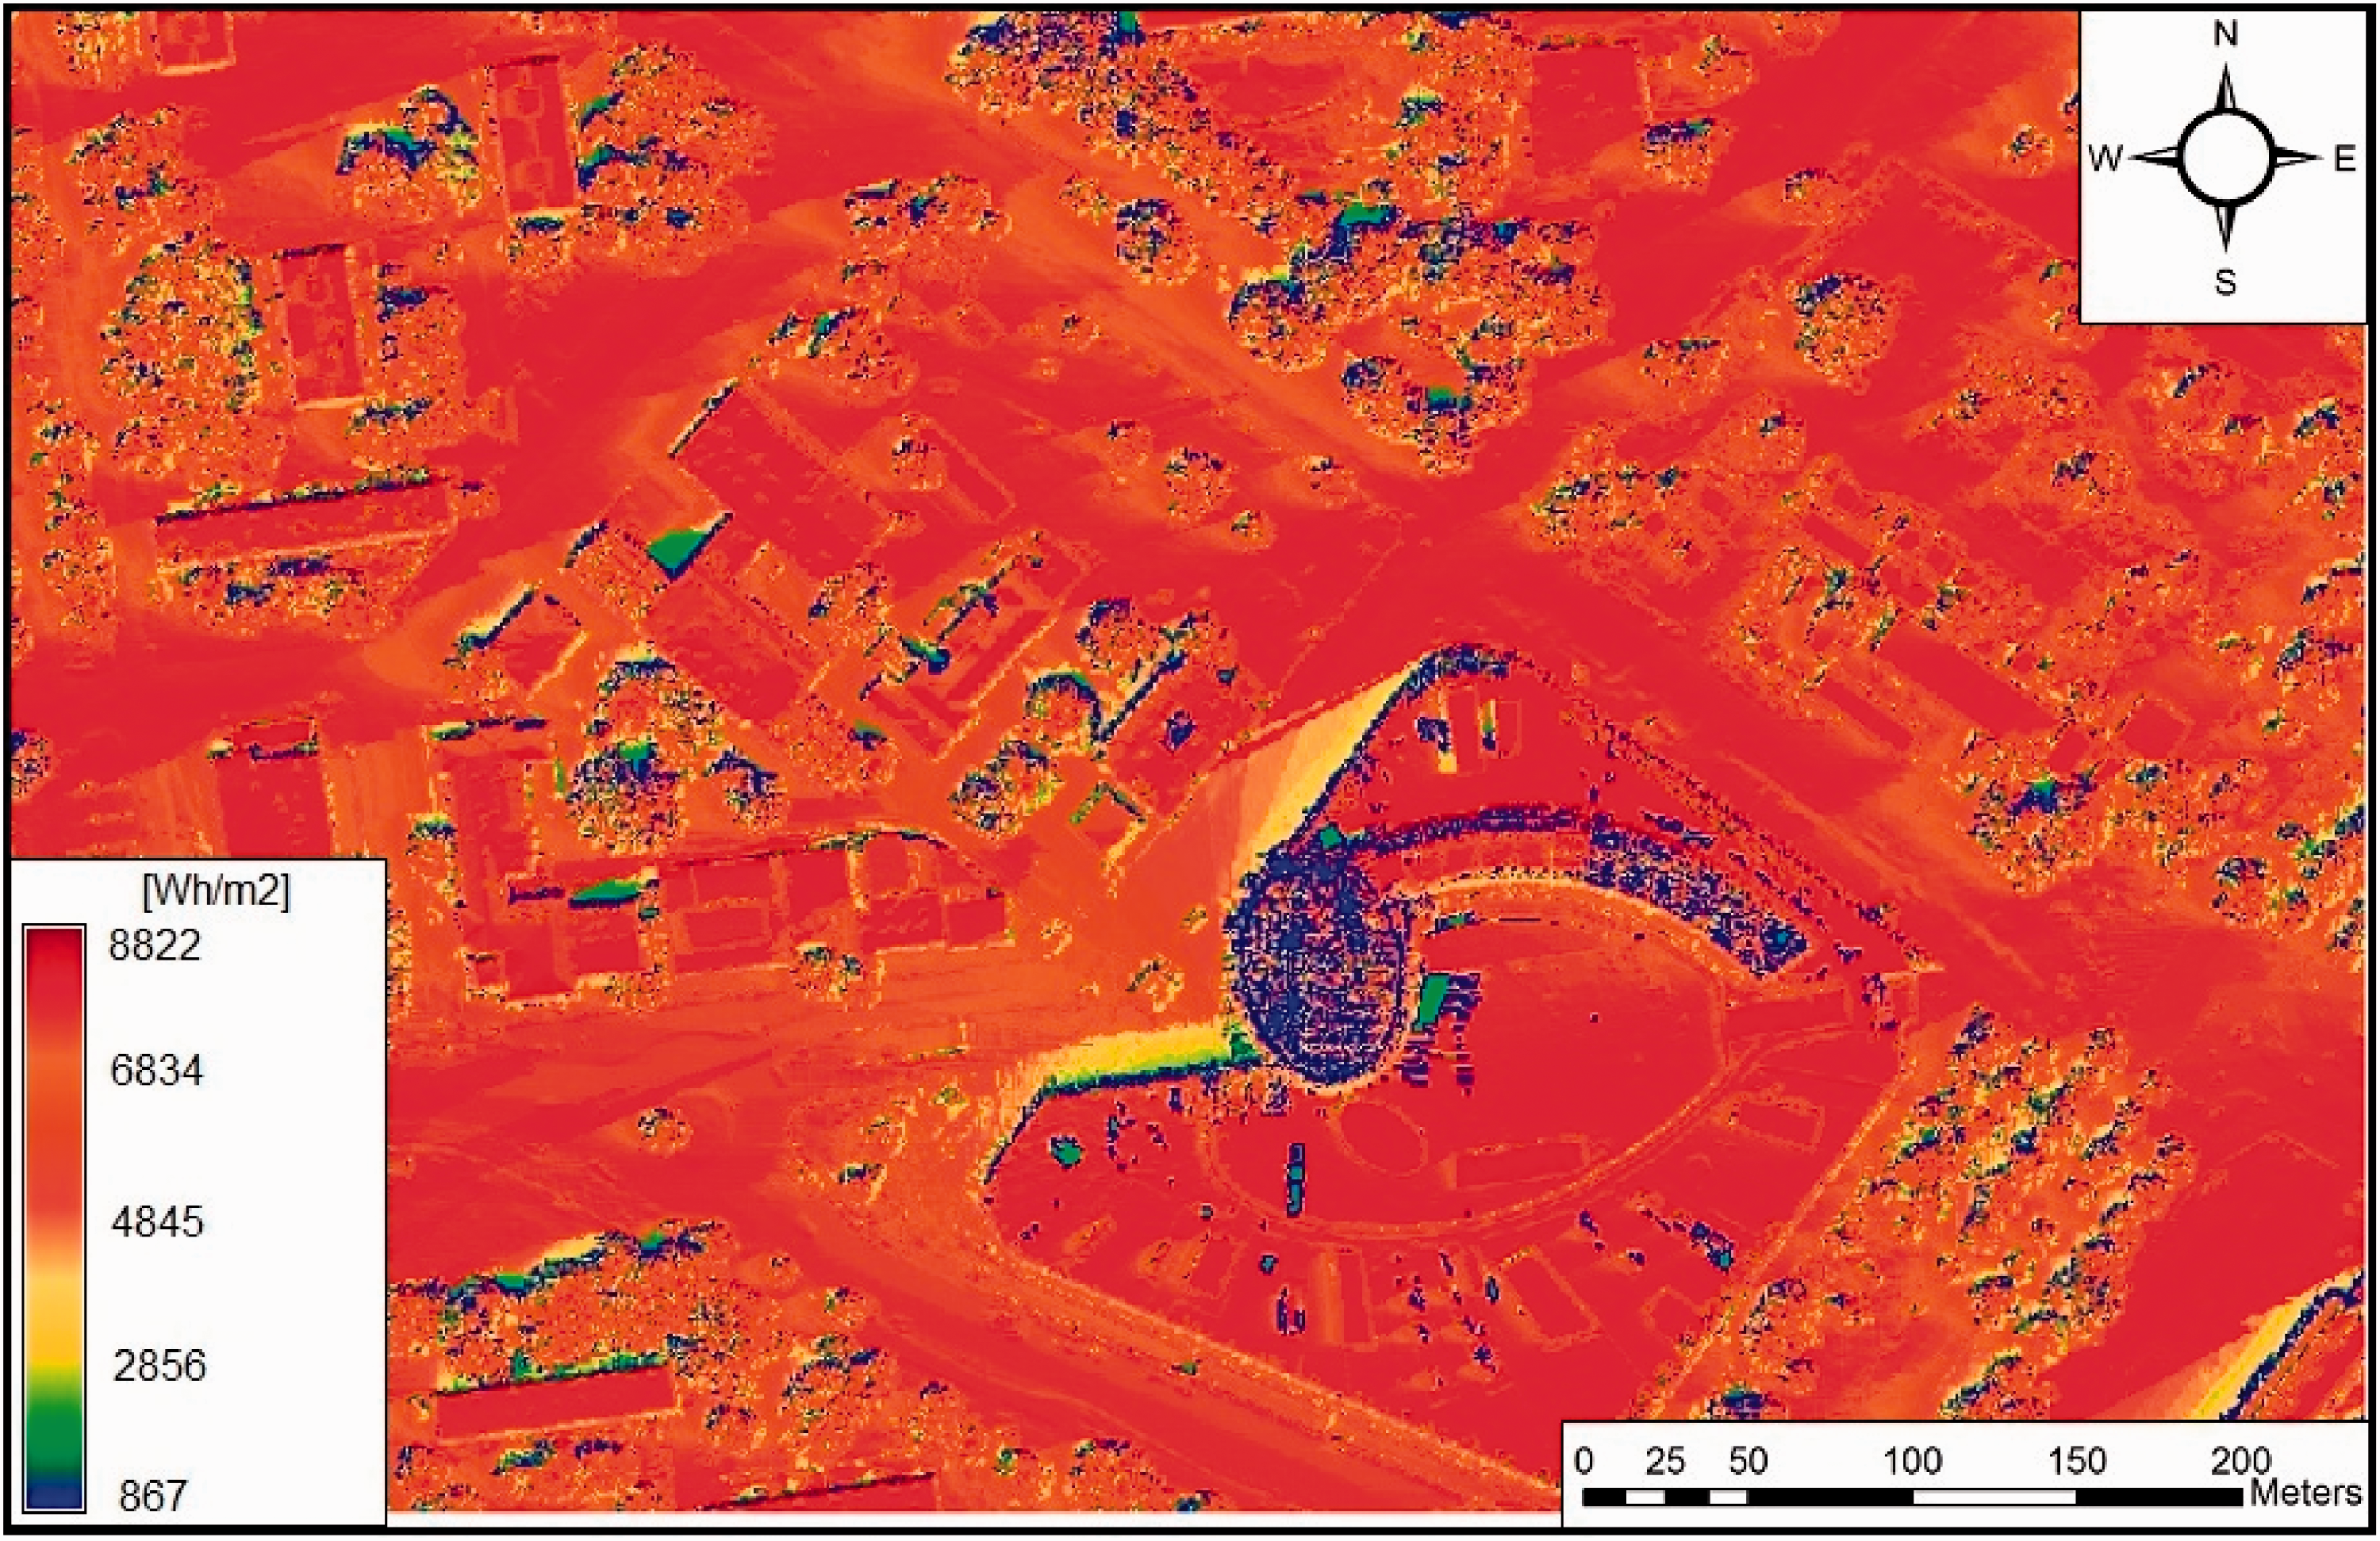
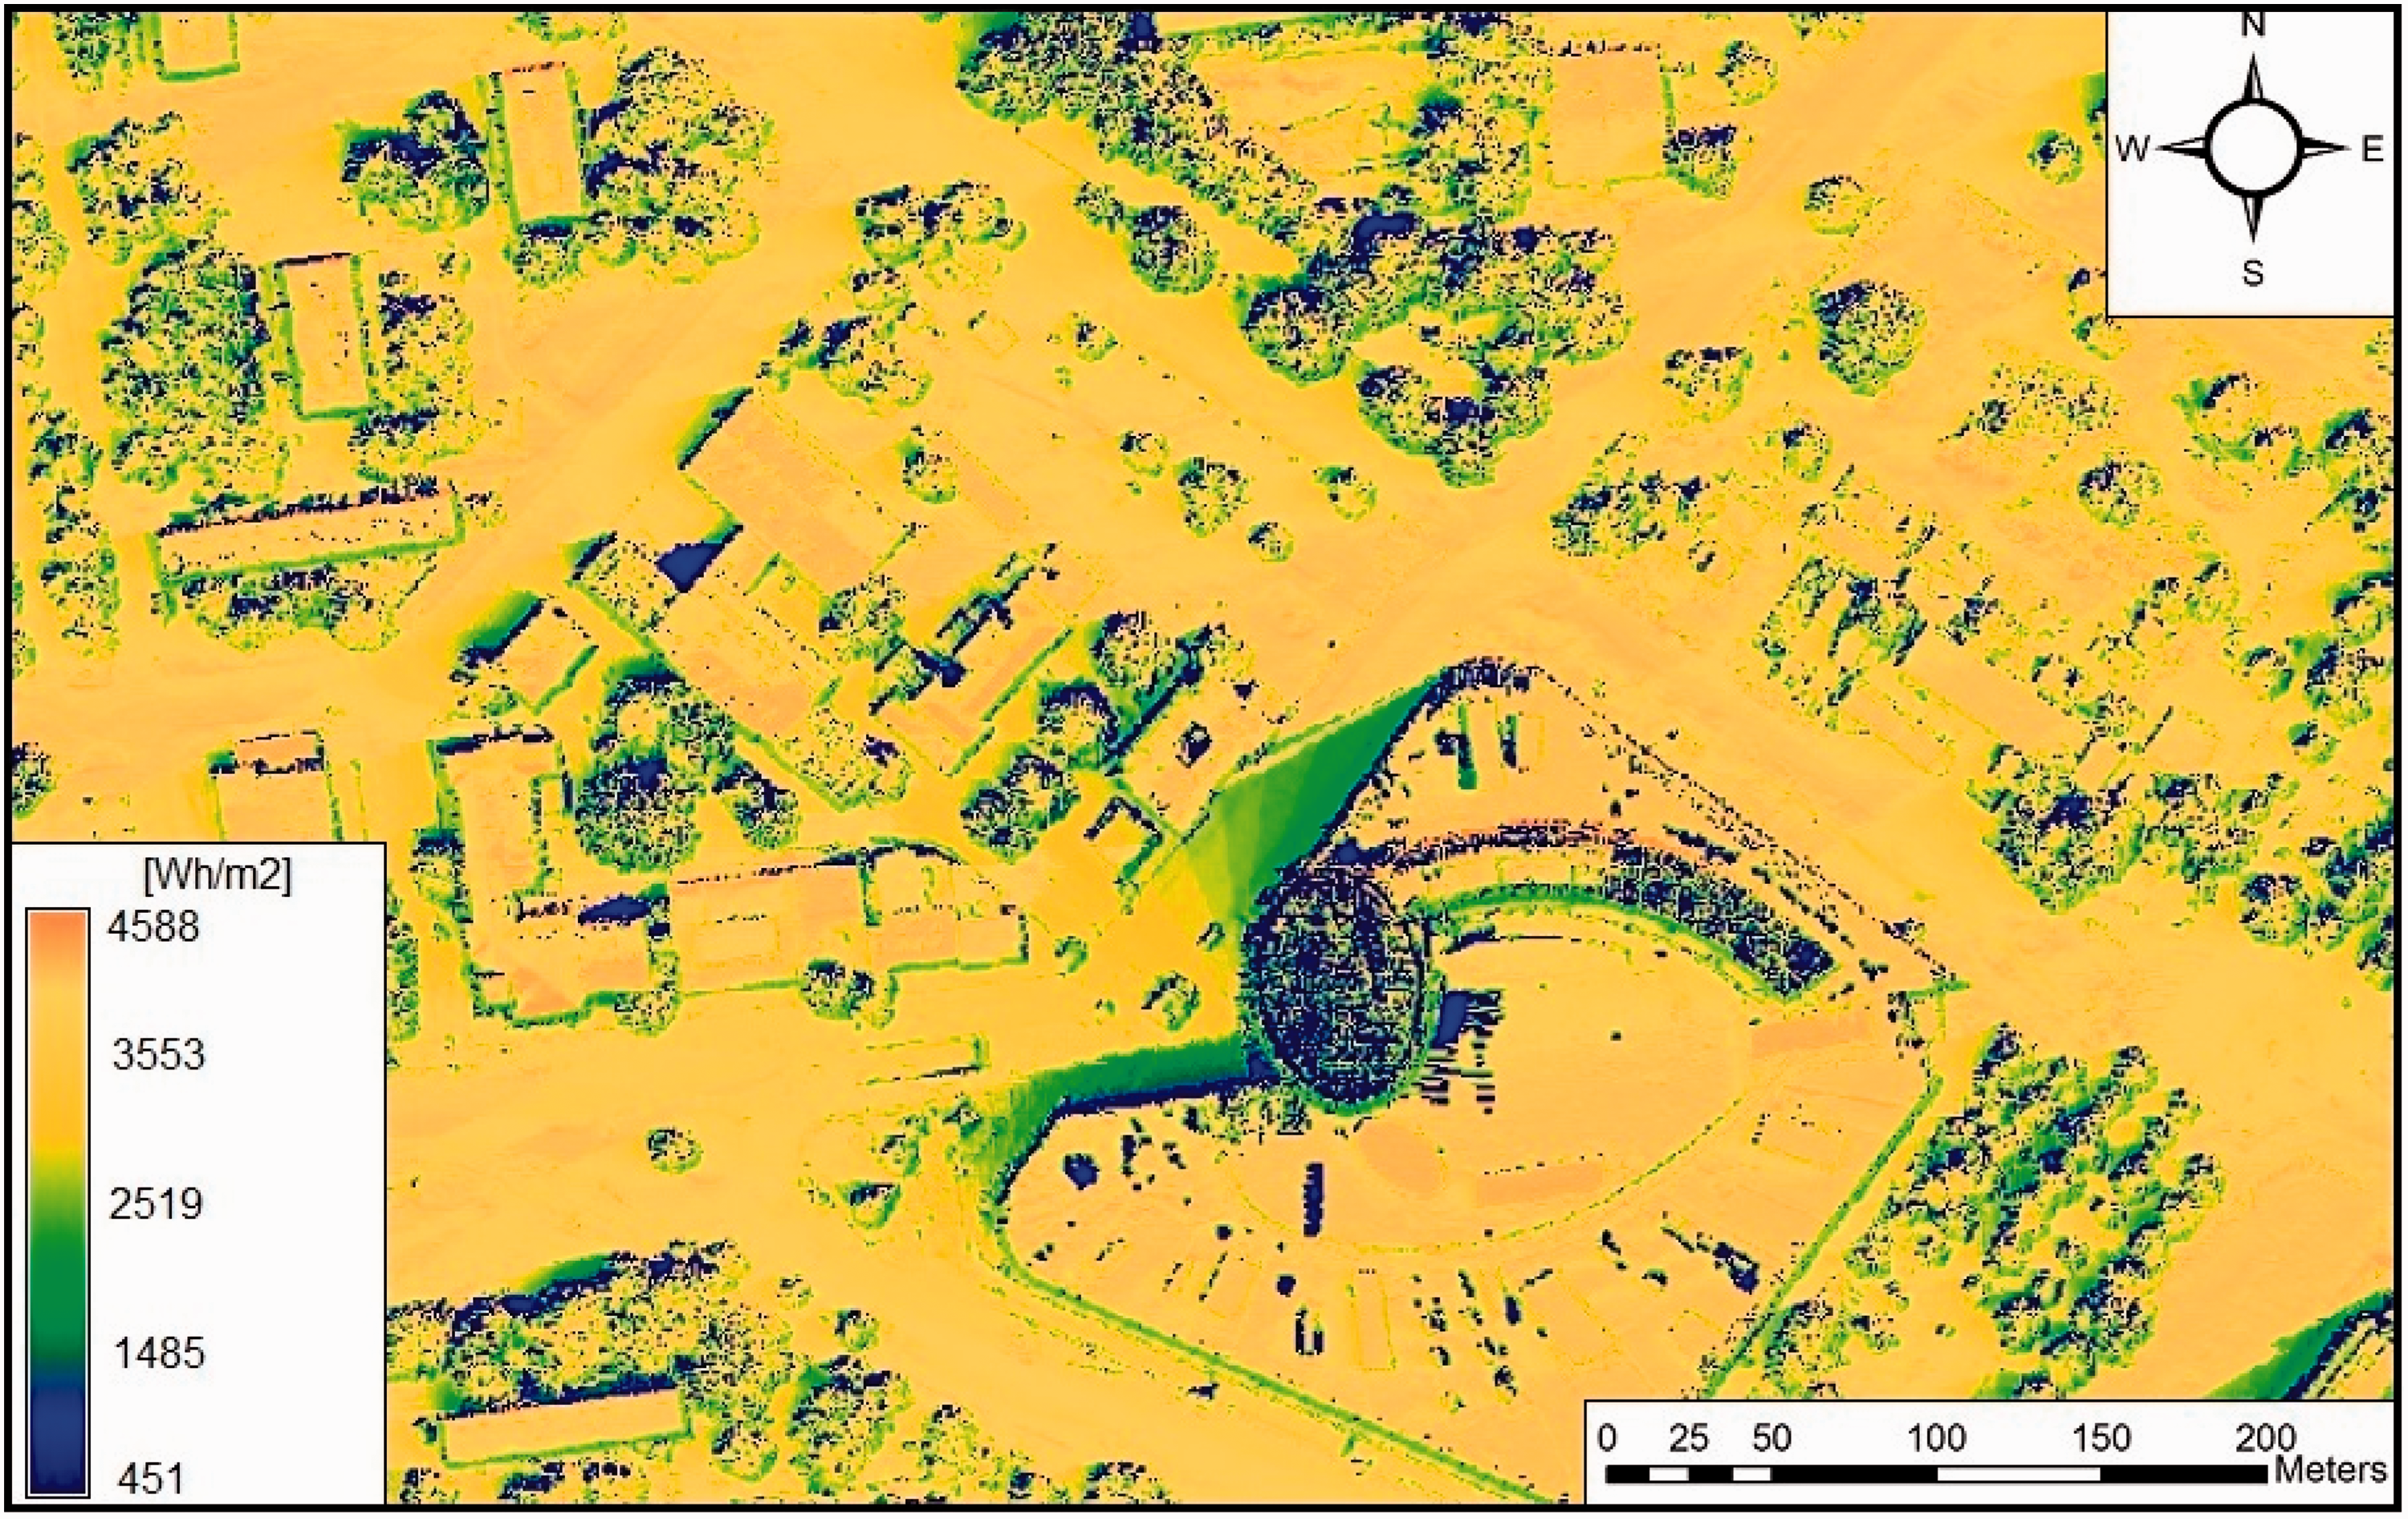
The map presented in the picture no. 6 (Figure 6) contains the information about the intensity of solar irradiation in real conditions so with regard to cloud cover. The parameter of cloud cover was calculated according to the methodology described above. Additionally, the information about atmospheric turbidity and shading caused by objects, buildings and trees, is included. The use of r.sun model with the described modifications gave a good result. The results of the conducted analyses are consistent with the measured values obtained from the actinometrical measurements (Table 3).
R.sun model radiation intensity, real radiation (Ir).
The measurement data which the obtained results were compared with are the average of five years of the actinometrical measurements at the Department of Climatology and Atmospheric Protection at the University of Wroclaw.
The obtained result of the analyses is consistent with the measurement data. The parameter of shading caused by buildings and vegetation still requires to be refined. However, in the current phase of the development the presented study may be used as the information material supporting the decision to locate micro-PV plants in urban areas.
Conclusion
New technologies can help build high-performance and efficient energy management systems in cities. Thanks to such IT systems as GIS, it is possible to design, implement, and manage a network of micro-installations which provide the amount of the energy needed for the functioning of the city. Since the energy produced in micro-systems comes from renewable sources, such energy production will allow for reduction of the emission of atmospheric pollutants, which will lead to the improvement of the air quality in the city. In case of micro-installation, monitoring is important, because the damage or contamination of the cells will be reflected in a decrease in power and the functioning of the entire network.
GIS technology can become a part of wider system dedicated to energy management in the cities. The biggest GIS advantage is the opportunity to analyze major factors important for efficient energy management.Also to choose best location for micro installations.
Another advantage of GIS technology is opportunity to expand the system on the new elements like models with new features for spatial analysis or external elements and data like satellite data or UAV. UAVs can be helpful during the inspection, for example, in search of damage, pollution, and devastation. UAVs are also able to perform thermal imaging to see where excess heat is degrading PV panel performance. Skycatch company built UAV that is used for remote monitoring and inspecting construction, mining, and farms. Now Skycatch is working on developing the solar farm inspection. UAV inspection of PV farms has the economic impact on solar energy production. The National Renewable Energy Laboratory estimates that PV panels have had a failure rate of less than 1% per year, 22 which is not much, but adds up over time. Because of the relatively low cost of UAVs, it is probably worth having UAV inspectors doing flyovers of solar farms and detecting all the failures.
Especially in the area of the city, where the locations of installation are fragmented and spread over, the effective monitoring to ensure a rapid response to any damage or installation faults is required. Therefore, drones are to be employed; especially mobility speaks for them. Because PV installations are often on roofs of tall buildings, it is the drones that provide quick access to the site and quick inspection of many small PV farms in urban area.
Footnotes
Declaration of conflicting interests
The author(s) declared no potential conflicts of interest with respect to the research, authorship, and/or publication of this article.
Funding
The author(s) received no financial support for the research, authorship, and/or publication of this article.