
Abstract
Selection of the optimum level of current for charging and discharging operations is an important factor for the performance of lead–acid batteries in PV application. Realizing this situation, an experimental study was carried out to determine the performance of battery under different charging and discharging current. The battery was charged at an input current of 6, 12, and 18 A, whereas under these input charging currents the battery was discharged at constant loads of 5.7, 11.4, and 17.1 A. Then algebraic equations for the determination of battery ampere-hour capacity, in relation with state of charge, were formulated with the help of MATLAB software. The proposed model provides the battery output directly without going through the calculation of constant unknowns and battery ampere-hour capacity. It is different from previous models, which only evaluate the battery ampere-hour capacities with the help of already calculated battery ampere-hour capacities and other battery parameters from the same battery. During the study, it was found that the rate of charge and discharge affected the duration of charge and discharge as well as battery ampere-hour capacity. When the rate is increased, the number of ampere hours was decreased along with the battery operational time duration. The developed model equations were validated with ours as well as other researcher’s measured values; the corresponding values were much closer when the values of state of charge were at the range of 100–90%. This study may be useful to understand the energy storage within a PV system and to select the optimum level of current, which consequently lengthens the life of the battery and improves the overall performance of a Photovoltaic panel (PV) system.
Keywords
Introduction
Energy produced by fossil fuels and by nuclear energy comes with shortages due to their negative impact on our health and our environment such as the carbon dioxide (CO2) emissions and nuclear waste products. In contrast, as a promising source of green and sustainable energy, batteries that store and provide electrical power have been widely used in various applications, such as in wireless sensor networks (PV battery systems), mobile devices, electric vehicles (EVs), and hybrid EVs (transportation systems), which help to reduce CO2 emissions. 1 With respect to reliability and cost of stand-alone PV power systems, storage batteries represent main and important components. Even a battery block represents only 8% of the initial cost of a new PV system; it represents 23% of the total system cost when considering the replacement of batteries during the total lifetime of the system (20 years). 2
Batteries are very often badly used because of the lack of knowledge about the nature of batteries and optimum connections of load, which results into short battery performance. Therefore, the life of battery is important which can be enhanced by avoiding critical operating conditions such as overcharge and deep discharge. According to the Peukert’s equation, if the battery is being discharged very quickly, then the amount of energy that can be extracted from the battery is reduced.3–5 Knowing the current discharge of the battery and the total capacity in ampere hour (A h), one can compute the theoretical lifetime of the battery using the equation, T = C/I, where T = battery lifetime, C = rated maximum battery capacity in A h, and I = discharge current. 6 Batteries are commonly rated in terms of their ampere-hour capacity (A hC), which is defined as the quantity of discharge current available for a specified length of time valid only at a specific temperature and discharge rate. High discharge current would result in reduction of the battery capacity and will shorten its life. 7 Estimating the A hC of a battery is probably one of the most important topics in battery research, which is the most critical state parameter and plays an essential role in defining other state functions for the proper functionality of the battery, viz. performance, reliability, and safety.
Earlier researchers have developed battery models6,7 which allow the user to see the efficiency of the user’s application by providing how much capacity in A h is consumed by the user. These models require various input parameters and constant unknowns to solve the equations for the estimation of A hC of batteries. Our proposed method provides the battery output directly without going through the calculation of constant unknowns which require only one input parameter.
Material and methods
In this research work, battery testing setup was developed for performance analyses of battery at different charging and discharging operations. The complete system consisted of a panel box, batteries, battery charger, and a battery tester. The battery box and typical digital diagram of complete battery circuit are shown in Figures 1 and 2 and their specifications are mentioned in Table 1.
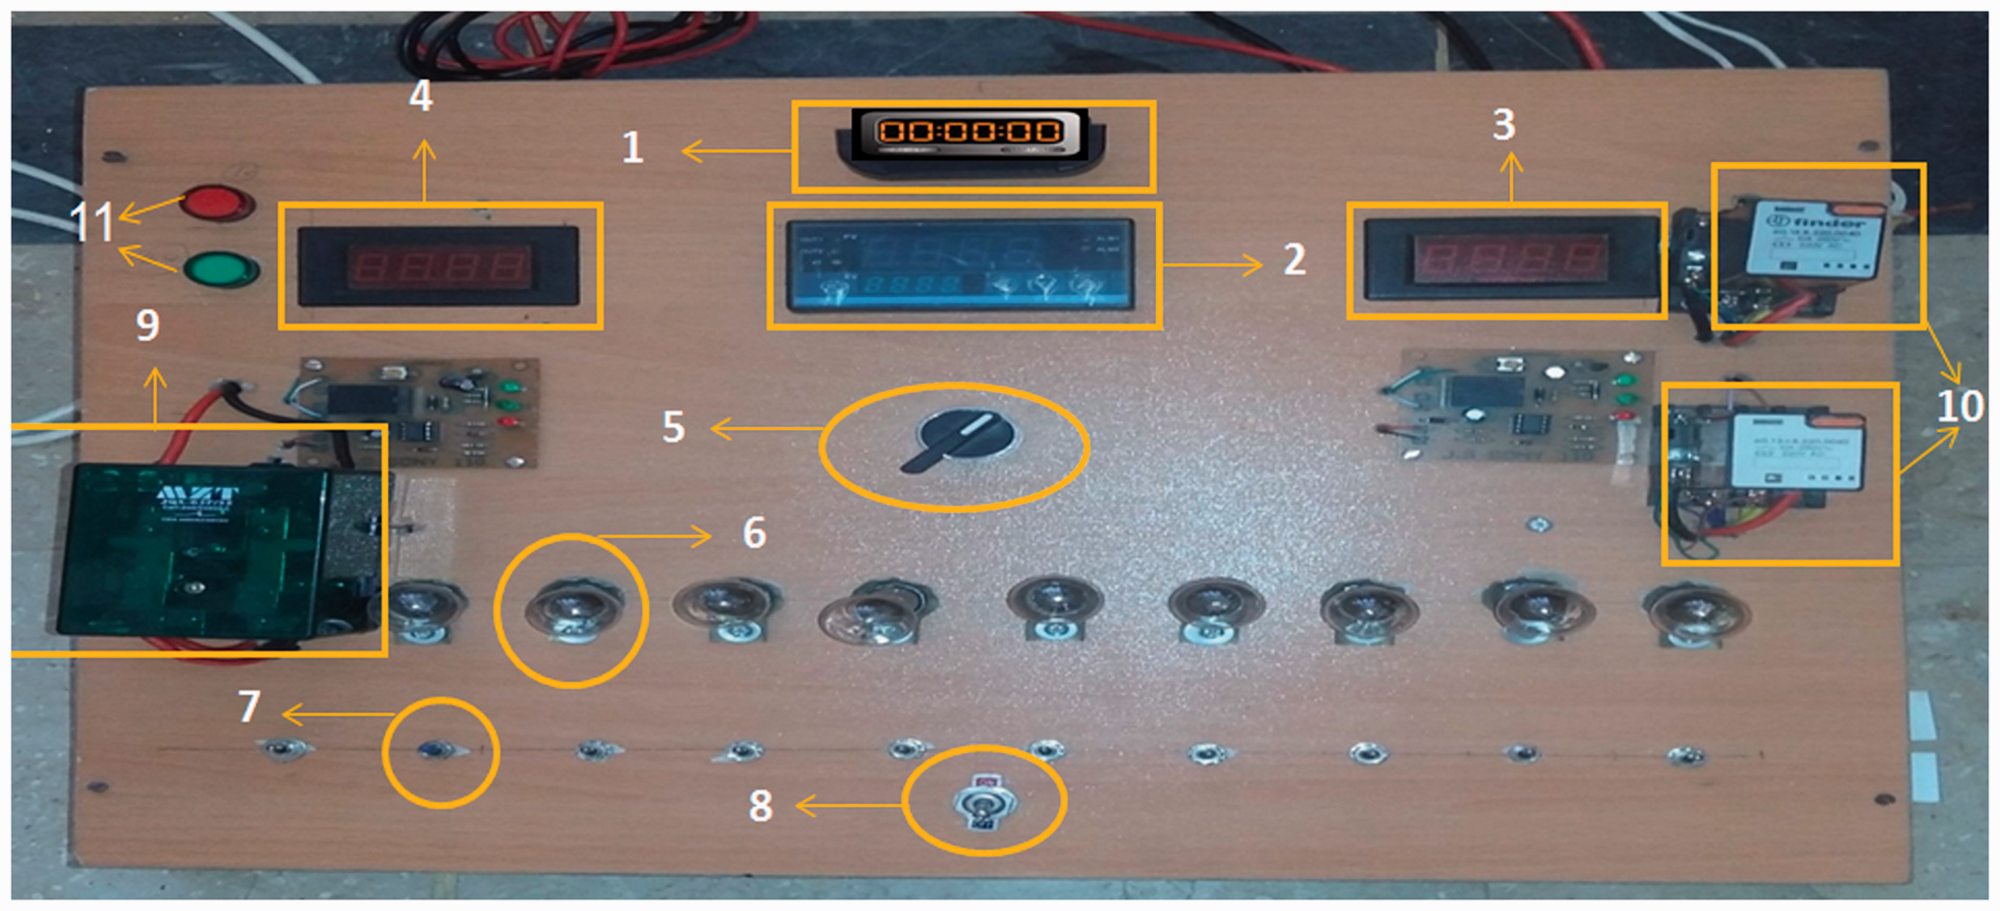
Pictorial view of panel box: (1) stop watch, (2) temperature controller, (3) ammeter with current transformer, (4) voltmeter with potential transformer, (5) selector, (6) lamps, (7) toggle/one way switches, (8) main control switch, (9) interchange relay, (10) primarily relays, (11) light indicators.

Typical digital diagram of complete battery testing setup.
Specification of battery testing setup.

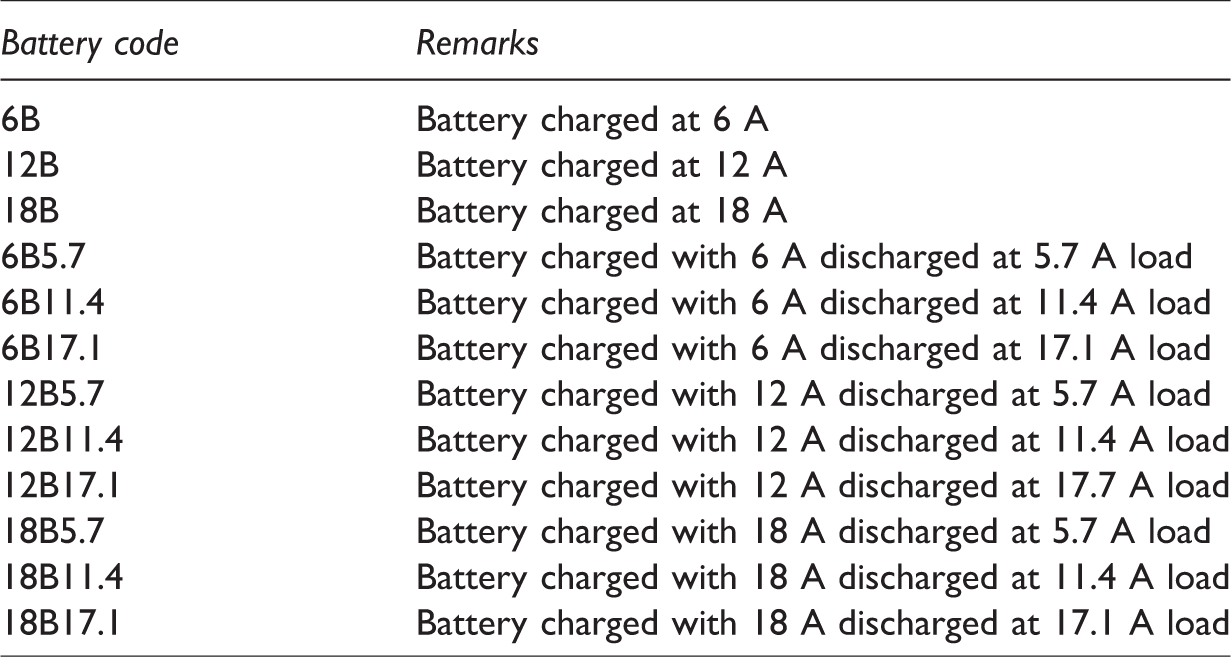
Two kinds of tests were performed: charging and discharging operations. The batteries were charged at input currents of 6, 12, and 18 A, whereas under these input charging currents the batteries were discharged at constant loads of 5.7, 11.4, and 17.1 A. Then, a simplified method was developed for the determination of battery A hC in relation with state of charge (SOC) with the help of MATLAB software as discussed in Appendix 1. Our proposed method was validated with our measured values as well as the measured values of other researchers. The charging and discharging at different loads are coded with different symbols as shown in Table 2.
Parameter codes of charging and discharging operations.
Battery
Lead–acid battery was selected for this research work, which was purchased from INVEREX Company having 12 V and 18 A h specifications. The reversible electrochemical process taking place inside the battery is presented in equations (1) to (3)


Result and discussion
A “two-approach” experimental program was carried out to study the charging and discharging operations of the lead–acid battery. The results obtained from operations of lead–acid battery are discussed as follows.
Charging operation
The battery was connected to the battery charger and the value of charging current was adjusted accordingly. First, a constant current of 6 A was passed through it, the voltage initially raised to about 4.3 V and then raised more slowly until the battery was 88% charged and the voltage was around 9.7 V. Battery charged quickly at initial stage but when charging reached 90% then it took longer time to complete the remaining 10% charging. When the battery was fully out of charge initially, it took a sufficiently large current to charge the batteries. However, as the charge inside the batteries increased, the charging current started decreasing. This is mainly because when the battery charge is increasing it offers more resistance to the incoming (charging) current in to the battery. For a battery-like response, the charging time is proportional to the internal resistance and the total charge. 8 During the constant current charge with 6 A, the battery charged to about 70% in 55 min; the remaining 30% was filled with the slower that lasts another 50 min. When the battery reached a full charge condition, then charge controller was disconnected to prevent the overcharging which may tend to cause mechanical and chemical destruction. Chemical destruction may decrease the capacity of the battery, and the capacity may ultimately be reduced considerably after several such charging.
After completely discharging the battery, the setting of charge controller was altered to set the charging input current at the level of 12 A. Then same practice was followed for 12 A charging current as adopted for 6 A input charging current. During the charging operation it was observed that it took 1 h 40 min, 1 h 10 min, and 1 h to completely charge the battery at the input charging current of 6, 12, and 18 A, respectively, as shown in Figure 3.

Charging operation with different charging rates.
Discharging operations
A fully charged lead–acid battery was exposed to discharge process by loading it with different DC lamps. Battery voltage, current, electrolyte density, and SOC were continuously measured during the discharge process at constant load. The 6B battery was discharged first at 5.7 A current until it reached minimum SOC. Then this battery was again charged and discharged at 11.4 A until it reached maximum level of depth of discharge (DOD). Finally, the same practice was applied for 17.1 A discharging current. As shown in Figure 4, SOC at the mentioned discharge current tended to stabilize at the initial time period. The SOC for 6B17.1 and 6B11.4 started to reduce after 15 and 30 min, respectively, and then further decreased sharply, whereas the SOC for 6B5.7 showed an opposite tendency to 6B17.1 and 6B11.4, indicating that it takes more time to discharge 6B5.7. The SOC followed the order 6B5.7> 6B11.4 > 6B17.1. The obtained measured results of different parameters are of 6B5.7 as presented in Table 3.

Discharge process of 6B battery.
Battery (12 v/18 A h) behavior under 6 A charging and 5.7 A discharge current.
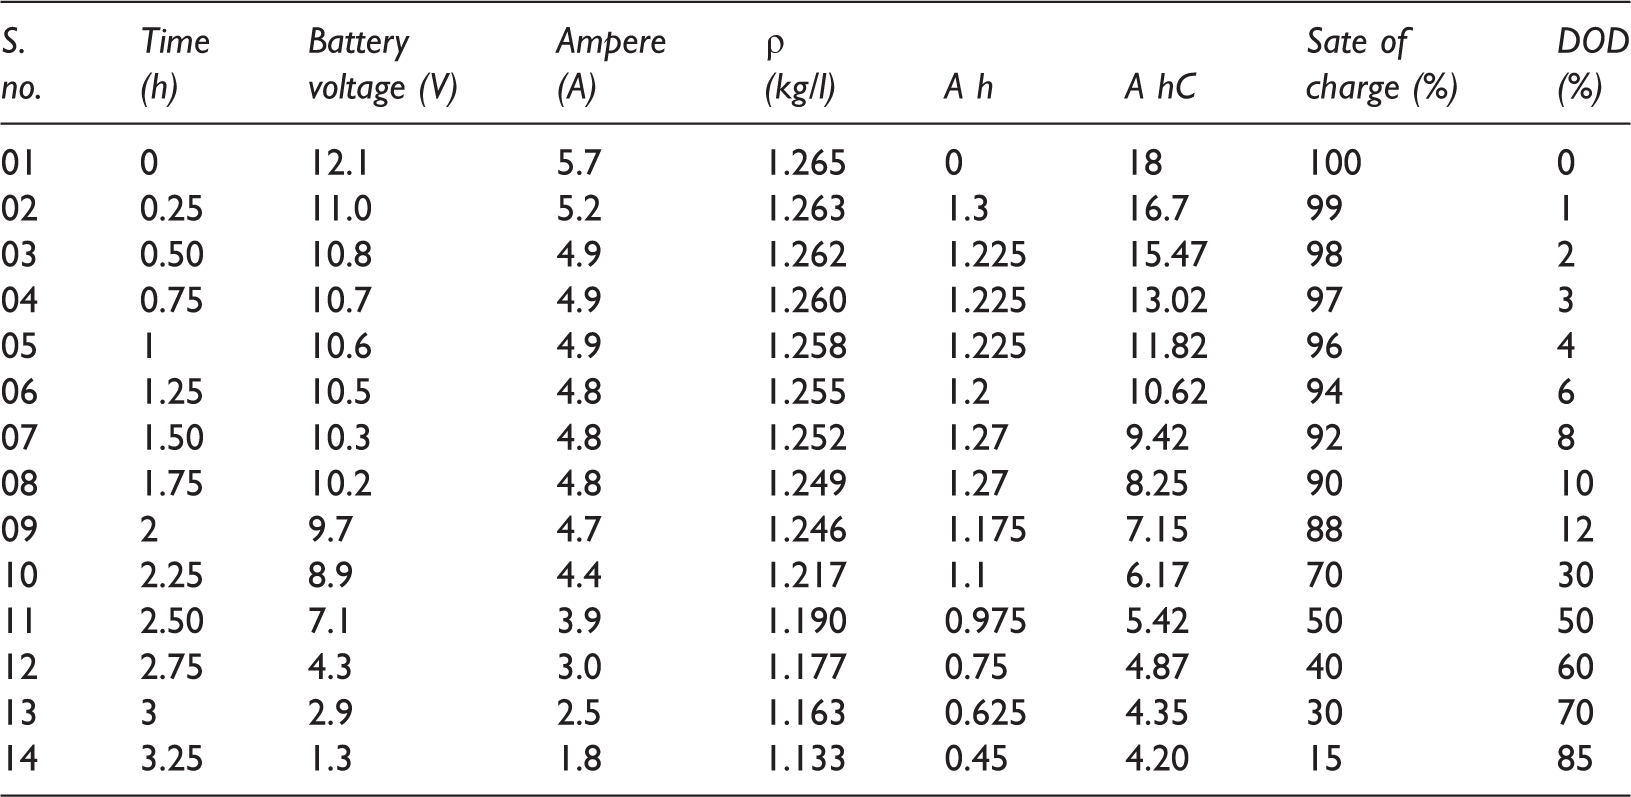
DOD: depth of discharge.
Battery at 6B11.4 and 6B17.1 stopped the power supply after 75 and 105 min, respectively. However, the time consumed for 6B5.7 was higher which was noted 195 min and then stopped the power supply to load.
The discharging behavior of 12B was quite different than 6B as shown in Figure 5. The battery discharge time duration of 12B11.4 and 12B17.1 were 15.3 and 22.2% less than 6B11.4 and 6B17, whereas percentage difference of 12B5.7 against 6B5.7 was recorded as 16.6%. However, the SOC followed the same order 12B5.7> 12B11.4 > 12B17.1.

Discharge process of 12B battery.
Figure 6 shows the SOC of 18B. As can be seen, the SOC for 18B17.1 and 18B11.4 reduced sharply and stopped the power supply at 45 and 75 min, respectively, leading to low A h, whereas the SOC for 18B5.17 behaved differently and reduced linearly with occasional fluctuations, indicating that charging and discharging currents play important role in terms of battery operation time period.

Discharge process of 18B battery.
From the “Result and discussion” section, it is clearly noted that battery charged with less current possess good performance in terms of battery A h increments if discharged at optimum load. It can be observed that with this rather high discharge rate, the utilization of the battery active mass is not very good.9,10 Battery charge and discharge processes are subject to polarization effects, as with all faradaic electrochemical reactions. Normally, this leads (i) to diminished cell voltage with increasing discharge rate and (ii) to decreased capacity due to material isolation or materials irreversibility in the chemical and physical changes associated with discharge (or recharge), especially when phase changes arise. 11 The observed time duration for charging and discharging operation at different current is summarized in Table 3. The battery at 6B5.7 and 18B17.1 showed the best and worst performance, respectively, in terms of battery operation time duration. The time consumed for 18B17.1, in discharge operation, was only 45 min, indicating that electrochemical reactions in battery occurred faster which converted active material into lead sulfate (H2SO4) and water (H2O). However, active materials remain in its original state for longer time period with 6B5.7.
Development of simplified method for determining the battery A hC
The most common measure of battery capacity is A h, defined as the number of hours for which a battery can provide a current equal to the discharge rate at the nominal voltage of the battery. The charging/discharging rates affected the rated battery capacity. If the battery is being discharged very quickly (i.e. the discharge current is high), then the amount of energy that can be extracted from the battery is reduced and the battery capacity is lower. Mahmoud
7
developed an algorithm to determine the battery A hC. The A hC of a battery (C) can be represented as a linear function of voltage and acid concentration, at quasi constant acid temperature, according to equation (4), and we adopted this model to determine A hC from measured values of our battery as described below

Applying the least square method on the measured V and ρ values presented in Table 2 we obtain equation (5)


Calculating V2, Vρ, VC, ρ
2
, ρC and their summations from Table 2, and substituting the corresponding values in equations (7), (9), and (11), we obtain the following three equations with three unknown constants


Solving these equations, we obtained the values for a, b, and c

Substituting V and ρ values from Table 2 in equation (4) we obtained the calculated values for the A hC (Cn) presented in column 2 of Table 4. Comparing these values with the measured capacity values (Cn) in column 1, it is shown that the corresponding values are much similar.
Summary of time duration of battery at different charging and discharging rate.

Although, above estimation method may be useful for the validation of measured A hC of lead–acid battery, hence it couldn’t be meaningful to predict A hC. Furthermore, the calculation process is also somehow complex, requires the values of different parameters including measured A hC, and three linear equations are needed to solve simultaneously for determination of coefficients, e.g. a, b, and c. Realizing above problems, a simplified method, to determine A hC of lead–acid batteries, was developed which requires only one parameter, having already measured values for unknown coefficients of the equation. The proposed model provides the battery output directly without going through the calculation of constant unknowns and battery A hC. Our proposed method is based on determination of A hC of lead–acid battery in relation with the measured values of SOC. Curve fitting tool in MATLAB was used to find the best fit between A hC and SOC by means of Gaussian line curve as shown in equation (15)

The coefficient values for a, b, and c are set with respect to range of measured SOC of the battery as presented in Table 6.
Measured and calculated parameters of a lead–acid battery.

Coefficient values of a, b, and c.

Based on the results obtained from our experimental work and literature review of other researchers it is obvious that SOC of batteries reduced slightly from 100 to 80% and then decreased sharply from less than 80% during the discharge process. Therefore, our developed equation is valid only for measured values of SOC in the range of 80–100% and values of coefficients are shown in Table 5. In fact, this range of SOC is critical in determination of battery capacity. 12 When the battery has been used for a sufficient amount of time, then because of aging, the battery would charge only to 80% of its total capacity even when it is fully charged owing to aging of the battery. 13
Our developed equation was validated with measured values of previous research.7 He examined the lead–acid battery rated at 12 V/110 A h to analyze different battery related parameters including DOD and A hC and our equation model (15) was developed based on measured values of these parameters from his research work. The measured values of SOC from his experimental setup were applied in our equation model to determine the battery A hC. The results from our calculation method were very similar to his measured values as shown in Table 7.
Validation of our simplified method with measured SOC of Mahmoud. 7
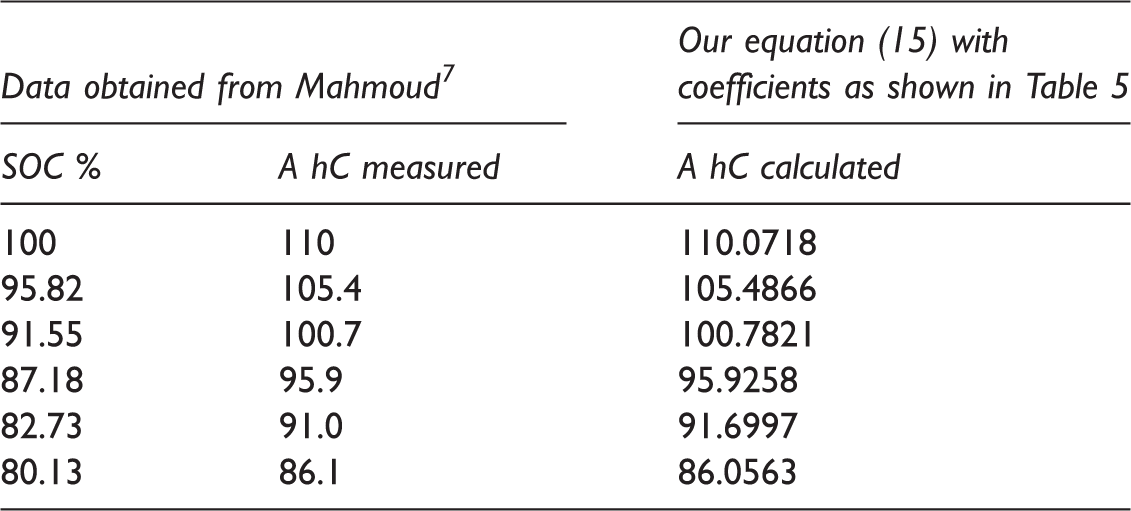
SOC: state of charge.
Our developed model equation having calculated coefficient values may also be adopted on all lead–acid batteries rated at ≤110 A h. In this regard, another equation (16) was formulated to support equation (15) if the rated battery is less than 110 A h

Validation of our simplified method with our obtained data at 6B5.7.

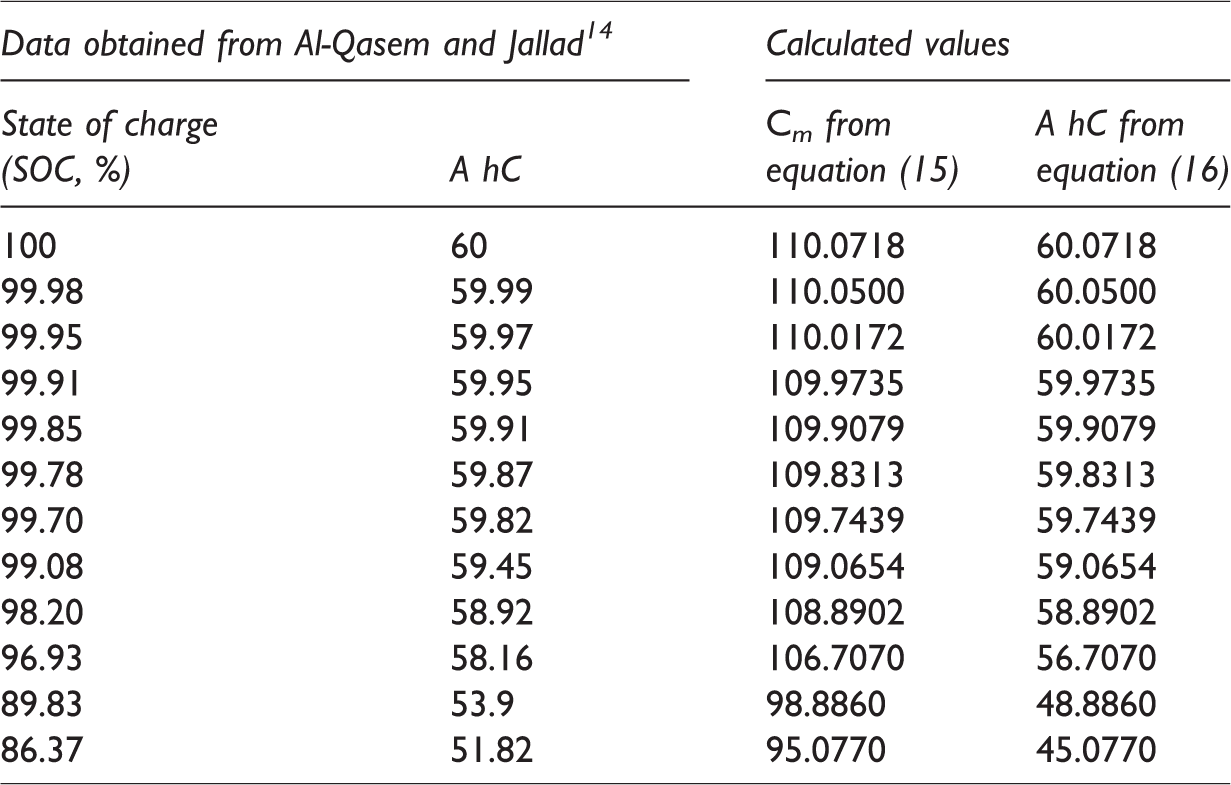
Our developed models were further validated with other researcher’s measured values from experimental work of lead–acid battery. Al-Qasem and Jallad 14 investigated the lead–acid battery rated at 12 V/60 A h and analyzed battery-related parameters including SOC and A hC. Their measured values of SOC were simulated using our developed equations (15) and (16) to determine the battery A hC. Both the measured and calculated results were found almost same with slight difference when battery SOC is less than 90% as shown in Table 9.
Validation of our simplified method with obtained data of Al-Qasem and Jallad. 14
Mahmoud 7 illustrated an experimental procedure for developing an algorithm for determining the A hC of batteries operating in PV systems, which is applicable, in general, for all lead–acid battery storage systems used in PV power systems. His developed algorithm enables determining the state of charge of a battery by measuring voltage and electrolyte-specific gravity at definite temperature and is applicable also for large battery storage systems. In his research work, battery voltage and specific gravity were measured at the same time and substituted their values along with three constant unknowns in his developed algorithm, resulted the capacity of the battery in A h. Whereas, our developed equations require only one input parameter to determine the A hC of battery which is applicable for lead–acid battery rated at ≤110 A h only in PV power systems.
Conclusion
The charging and discharging operation was performed to evaluate the performance of lead–acid battery. The battery was charged at input current of 6, 12, and 18 A, whereas under these input charging currents the battery was discharged at constant loads of 5.7, 11.4, and 17.1 A. Rate of charge and discharge affected the duration of charge and discharge as well as the number of A h removed and returned. When the rate is increased, the number of A h is decreased along the duration. Then, a simplified method, to determine A hC of lead–acid batteries, was developed which requires only one parameter, having already measured values for coefficients of the equation. Our proposed method is based on determination of A hC of lead–acid battery in relation with the measured values of SOC. Curve fitting tool in MATLAB was used to find the best fit between A hC and SOC by means of Gaussian line curve. The coefficient values for unknown constants were calculated and settled according to range of measured SOC of the battery. The developed model equations were validated with ours as well as other researcher’s measured values; the corresponding values were much close when the values of SOC were in the range of 100–90%. Batteries within PV power systems should always be connected to charge controllers to protect them against deep discharge and extremely over charge which shorten the battery lifetime. This study was carried out on lead–acid battery having rated capacity at 12 V ≤110 A h; a further investigation on the same type of battery, rated at more than 110 A hC, should be carried out. It is further recommended to adopt our calculation methods for investigation of other types of batteries in PV power systems.
Footnotes
Acknowledgements
The authors acknowledge the support provided by authorities of Southeast University, Nanjing, China for completion of this work in School of Energy and Environment and one of the authors, Ahsanullah Soomro.
Declaration of conflicting interests
The author(s) declared no potential conflicts of interest with respect to the research, authorship, and/or publication of this article.
Funding
The author(s) disclosed receipt of the following financial support for the research, authorship, and/or publication of this article: The authors thank authorities of Quaid-e-Awam University of Engineering, Science and Technology, Nawabshah, Pakistan for financial support of this project.