
Abstract
This paper analyzes the decoupling states between CO2 emissions and transport development in China from 1994 to 2012. The results indicate that, at the aggregate level, the Chinese transport sector is far from reaching the decoupling state. Negative decoupling or non-decoupling years account for 72.2% of the study period. At the disaggregated level, the decoupling states between CO2 emissions and eight primary fuels are as follows: raw coal and coke are in the absolute decoupling state; crude oil, gasoline and diesel are in the weak negative state; and the other three types (kerosene, heavy fuel oil, and natural gas) are in the strong negative decoupling state. Policy implications underneath the identified decoupling states are also revealed to help China build a more sustainable transportation system.
Introduction
China faces the dynamic of rapid economic development that drives ever-increasing energy use and, consequently, increasing CO2 emissions.1 As its economy increased at an impressive rate over the past two decades, energy-related CO2 emissions grew by 50% between, 1990 and, 2000 and doubled from, 2000 to 2010, reaching 7 billion tons of CO2 in, 2010.2 However, China has committed to peak CO2 emissions around 2030 while striving to peak early and boost the share of nonfossil fuel energy to around 20%.3 In this context, the transport sector plays an essential role in addressing this challenge since it consumes nearly half of all global oil and contributes one quarter of total fossil fuel combustion related CO2 emissions through road, rail, air, and marine transportation.4 Additionally, mitigating emissions from the transport sector are also particularly attractive in yielding both rapid and long-term climate benefits, such as improving urban air quality and tropospheric ozone production.
To help the government adopting specific actions that are likely to promote the delinking of environmental harm from transport growth, researchers and practitioners are working toward a better understanding of the key challenges in achieving the sustainability goal of raising transportation growth with a minimum negative impact on the environment and society. Among all the existing methods, the decoupling index is a proper technique to determine the link between environmental pressure and transport growth. The concept of “decoupling indicator” was first proposed by Organization for Economic Co-operation and Development (OECD),5 which divided the decoupling into relative decoupling and absolute decoupling. In this decoupling conceptual framing, relative decoupling occurs when both transport growth and environmental pressure change in the same direction, but their relationship has weakened (or the ratio of the latter to the former is reduced). Absolute decoupling relates to the situation when transport growth and environmental pressure change in different directions with the former increasing and the latter either staying at the same level or falling. Tapio6 further redefined decoupling indicators to qualify situations into eight types of decoupling states in total, which reflect the advantages of OECD indicators. Due to the rational decoupling positions with eight possible combinations, the Taipo decoupling method has been widely used by many researchers.7
At first, decoupling research was primarily conducted in Europe, especially with respect to CO2 emissions. These studies have focused on income,8 economic growth9 energy and transport sectors,6,10 transport and economic growth.11–14 Since Zhang15 firstly utilized the decoupling concept to explore the relationship between China’s energy-related CO2 emission and economic growth, extensive studies have been carried out to decouple CO2 emissions from rapid economic development and energy consumption in China at the national level16–18 or the provincial level.7,19 The literature focused on decoupling carbon emissions from the industrial production sector,20 the tourism sector,21 the power sector,22,23 and the transport sector at the national level24–29 and the regional and provincial level (Guangdong Province;30 Jiangsu Province;31,32 Xijiang Province33; and other provinces.34–37
However, to the best of our knowledge, most of these studies have put their attentions on studying the decoupling effects of CO2 emissions at a macroeconomic level, e.g., gross domestic product (GDP), population, income, economic development, etc. There are very few studies attempting to explain the decoupling effects at a microscopic level, particularly from a perspective on fuel type. In this regard, this study aims to fill this gap and reveal the policy implications underneath the identified decoupling states that help China build a more sustainable transportation system. This paper provides at least three major contributions: (1) developing a customized decoupling methodology for the transport sector in China; (2) performing decoupling analyses for China’s transport sector from, 1994 to, 2012 at the aggregate and disaggregated levels; and (3) revealing more targeted energy policy implications on a fuel-by-fuel basis.
The remainder of this paper is organized as follows. Methodology section develops a customized methodology for analyzing the decoupling states of CO2 emissions in Chinese transport sector. Data consolidation section collects and processes the historical data of travel activities and emission intensities in Chinese transport sector during the given study period (from 1994 to 2012). The CO2 emissions data are calculated based on the collected data and further decomposed by fuel types and transportation modes. Decoupling analyses section performs decoupling analyses using the proposed methodology in Methodology section. The identified decoupling states and major findings are also reported in this section. Policy implications section reveals policy implications behind the identified decoupling effects to build a more sustainable transport system in China. Finally, Conclusions section concludes this paper. The main study framework of this paper is shown in Figure 1.

The main study framework of this paper.
Methodology
The term “decoupling” refers to breaking the link between “environmental bads” and “economic goods” or breaking the relationship between environmental pressures and economic performance. The decoupling theory was first established by the OECD in 2001, which aimed at decoupling environmental pressures from economic growth. According to the OECD’s definition, decoupling occurs when the growth rate of an environmental pressure is less than that of its economic driving force (e.g., GDP) over a given period. The Degree of Decoupling (DD) can be either absolute or relative, depending on the relationship between the growth rates of the environmentally relevant variable and the economic variable. This relationship can be measured by Decoupling Elasticity (DE), as shown in equation (1).5

The basic principle of the OECD’s decoupling theory is illustrated in Figure 2(a). In the transport sector, absolute decoupling will occur when transport turnover increases while CO2 emissions are kept at the same level or even decrease; relative decoupling will occur when transport turnover and CO2 emissions grow toward the same direction, but transport turnover increases faster than CO2 emissions. However, the decoupling concepts proposed by the OECD may not describe all possible relationships between environmental pressures and driving forces, e.g., transport turnover may decrease in a specific period. In this regard, Tapio6 further developed the decoupling theory to cover all eight-logical coupling or decoupling possibilities of the relationship between environmental pressures and driving forces by introducing the concept of elasticity index. He also redefined decoupling relationships into weak, strong, and expansive/recessive states while laying emphasis on the absolute increase or decrease of elasticity variables, as illustrated in Figure 2(b).6
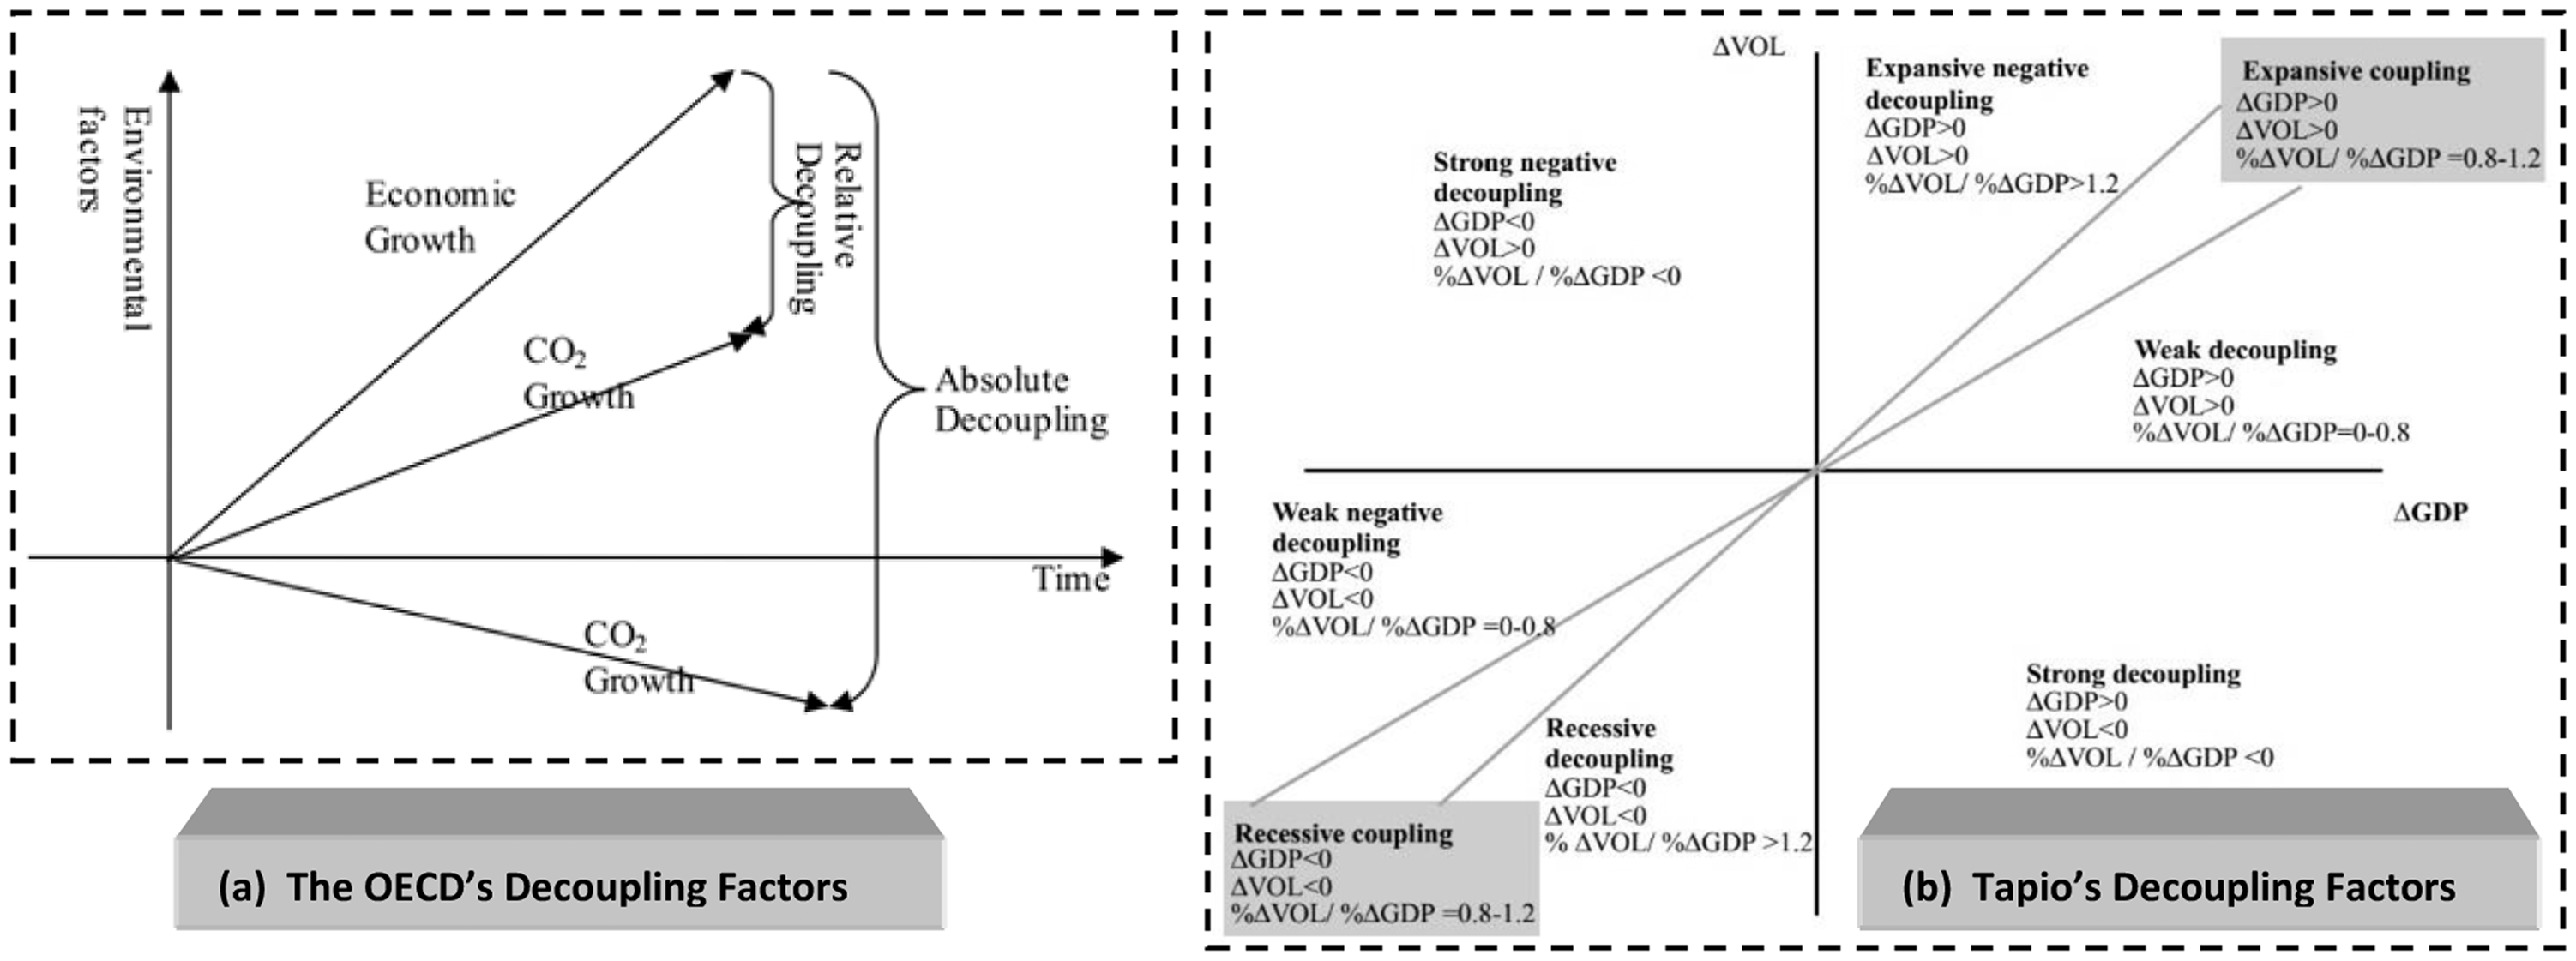
Decoupling theories developed by the OECD 5 and Tapio.6
In this study, according to the OECD’s and Tapio’s decoupling theories on the environmental cost of economic growth, the relationship between environmental impact and economic growth in transportation sector can be particularly expressed as:

Assuming the study period is from base year T0 to target year Tn, the environmental impact in this given period can be expressed as follows:


By substituting equations (5) and (6) into equation (4), the environmental impact at target year Tn can be expressed as:

Then, the changing rate of environmental impact in any two consecutive years is:

According to equation (8), if

Finally, in this study, the decoupling factor (Df) for the transport sector can be quantified by equation (10):

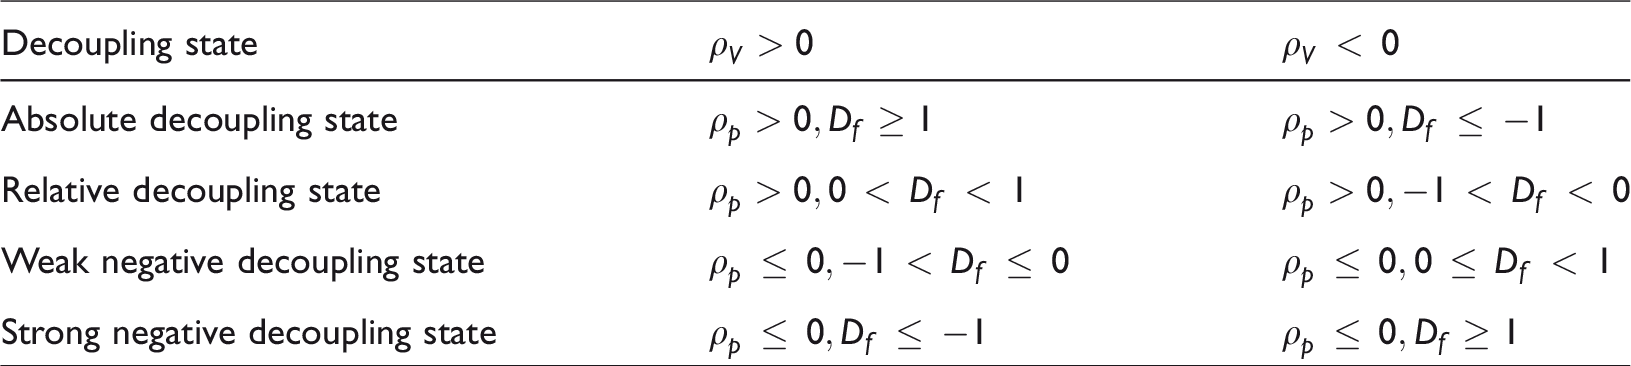
Based on the different decoupling factor values specified in Table 1, the decoupling states between environmental pressures and driving forces in the Chinese transport sector can be grouped into four categories: absolute decoupling, relative decoupling, weak negative decoupling, and strong negative decoupling. For illustration purposes, the four defined decoupling states (shaded in different colors) and decoupling curves (dashed lines) are also presented in Figure 3. The decoupling curves can represent different decoupling factors Df from equation (10) by substituting various values of ρv and ρ p .
The identified decoupling states in the Chinese transport sector.
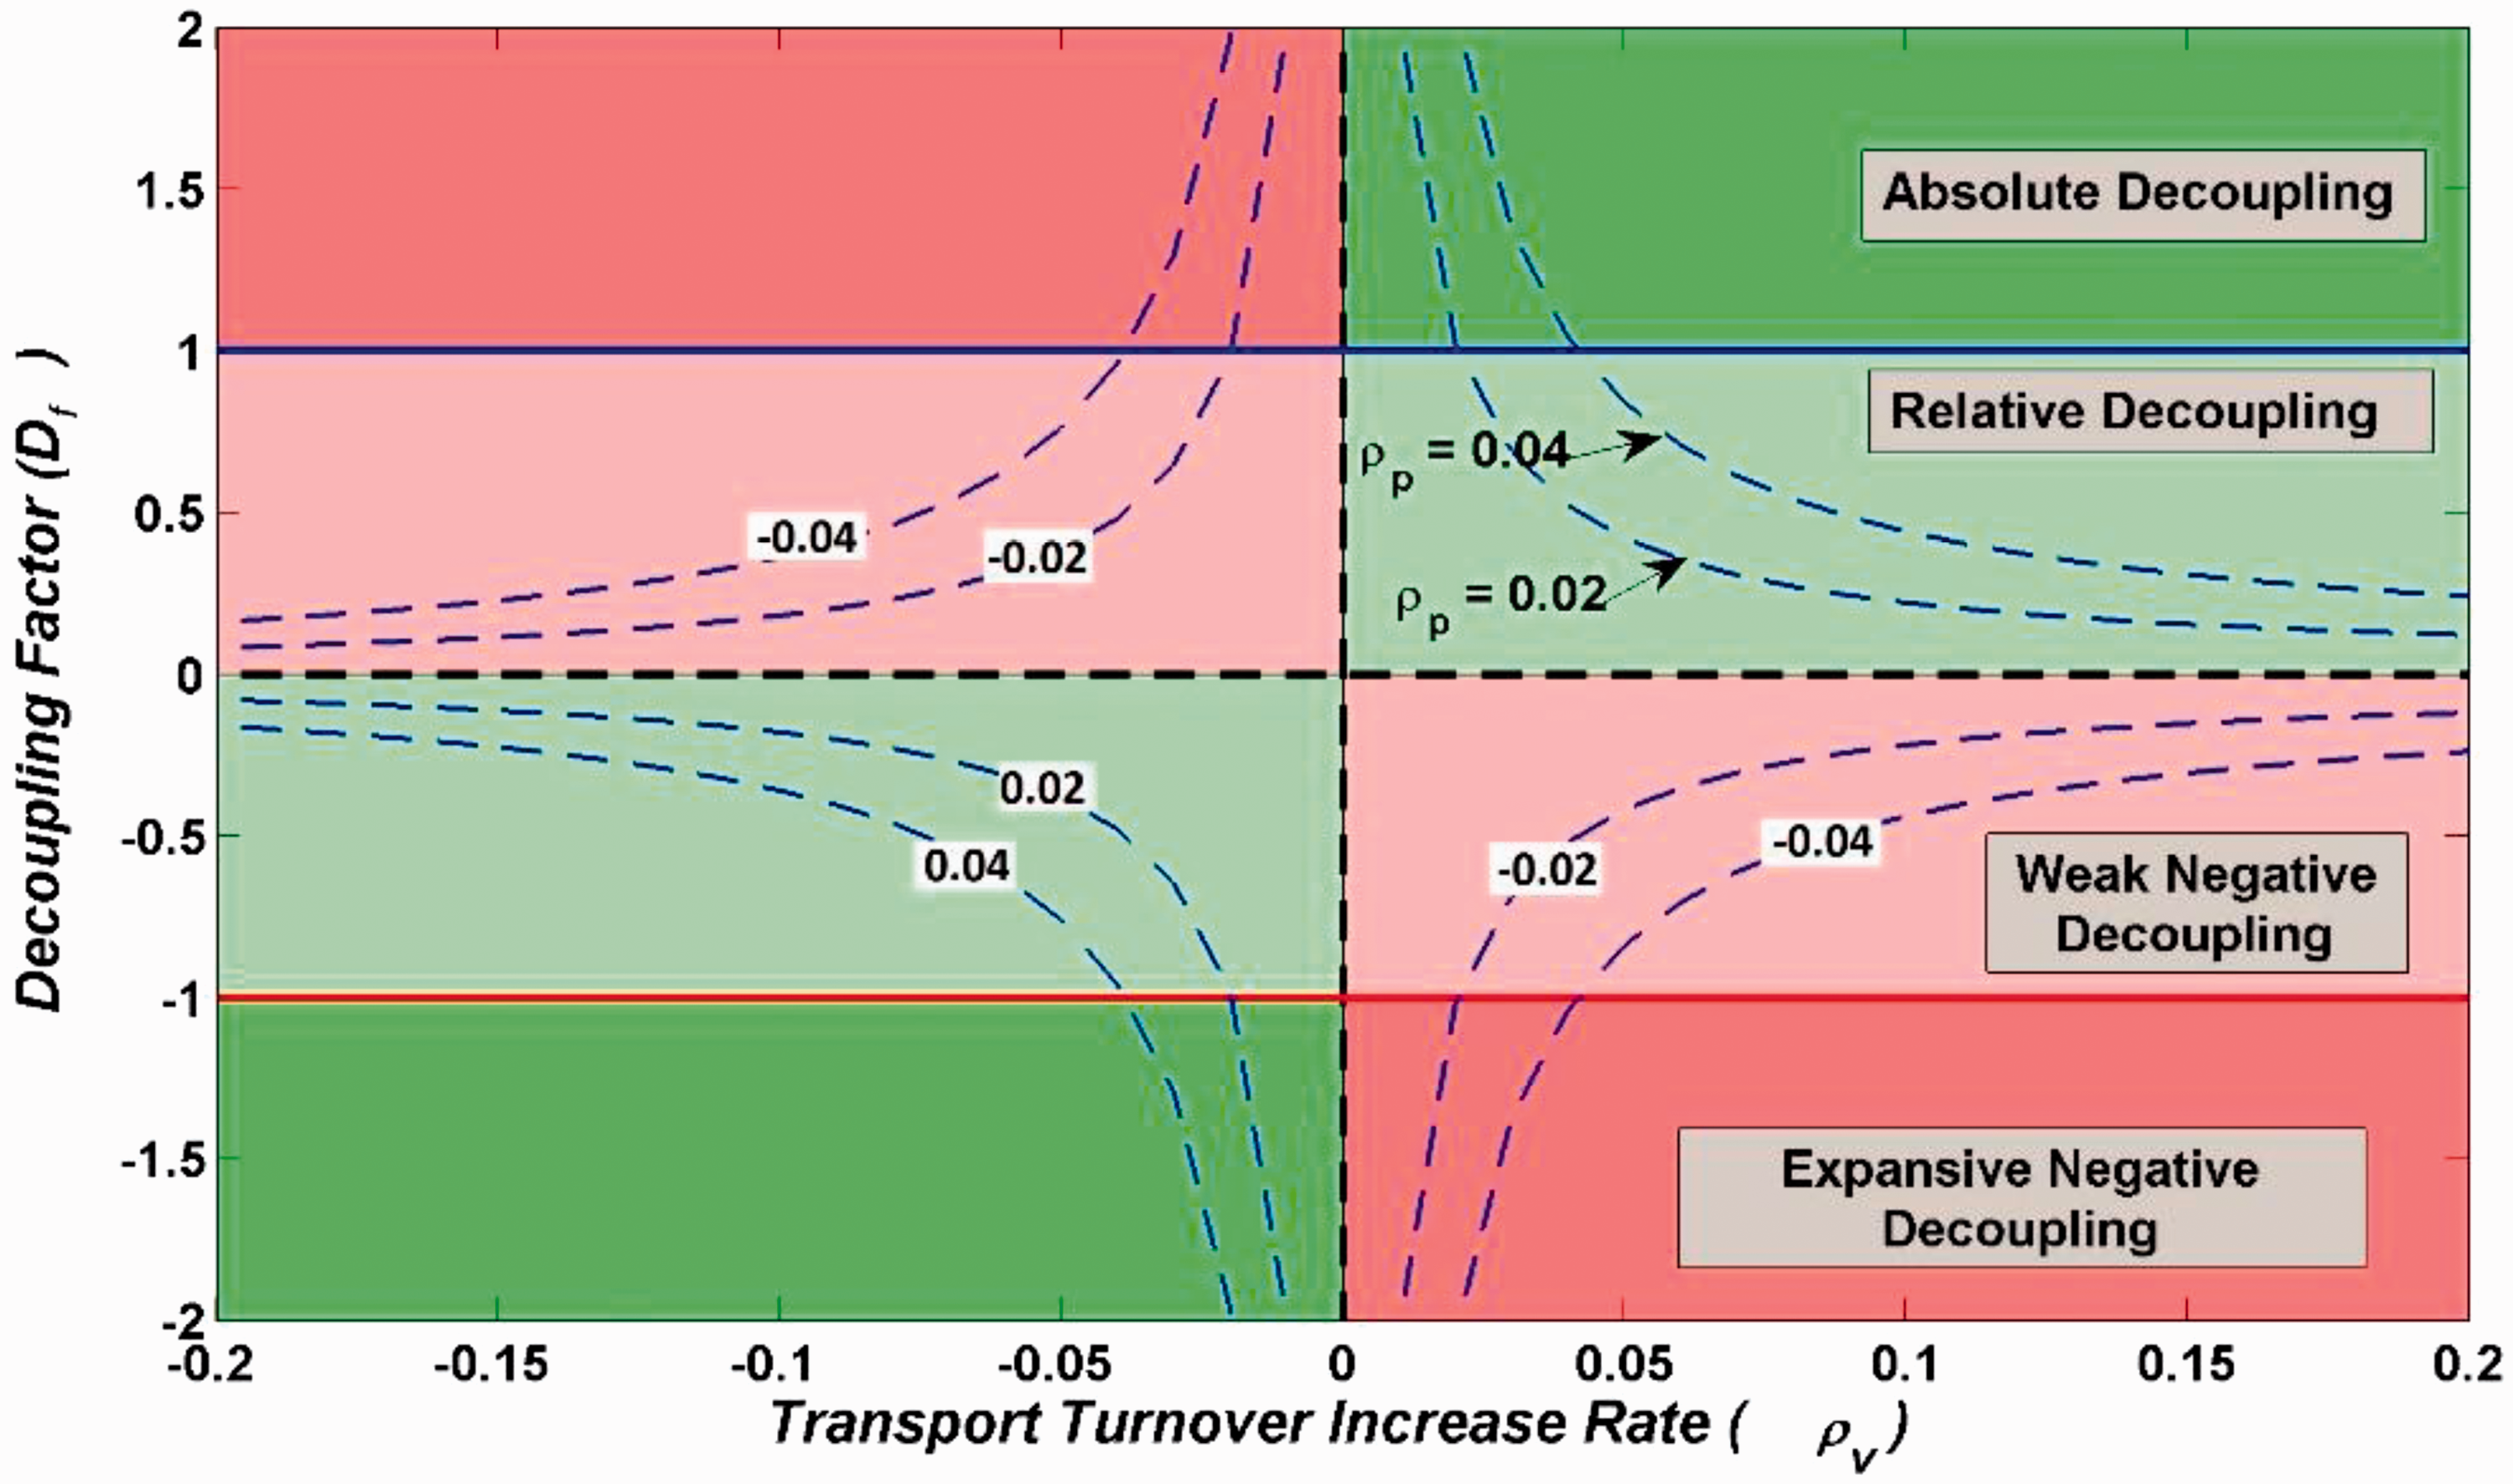
Decoupling state chart for China’s transport sector.
Data consolidation
Transport activities data
The transport system in China consists of five essential modes: road, railway, water, air, and pipeline transport. The raw data of transport turnover by mode for the study period (from 1994 to 2012) were collected from the Yearbooks of China Transportation and Communications (CTCY38). It should be noted that the turnover data are measured by ton kilometers (ton-km). In this regard, the turnover of passenger trips that is measured by person-kilometers should be converted to the data in ton-km. The converted turnover of passenger and freight traffic is equal to the turnover of passenger traffic divided by a conversion coefficient, plus the turnover of freight traffic.25 The conversion coefficient is determined by comparing revenues and expenditures per person-km (or moving one person 1 km) with those of moving one ton of goods 1 km, based on the Transportation Enterprise Cost Management Method issued by the Chinese Ministry of Finance and the Chinese Ministry of Transportation. The conversion coefficients are summarized in Table 2, and the converted transport turnover data by mode are presented in Table 3.
Transport turnover conversion coefficients by mode in China.

Transport turnover by mode in China from 1994 to 2012.
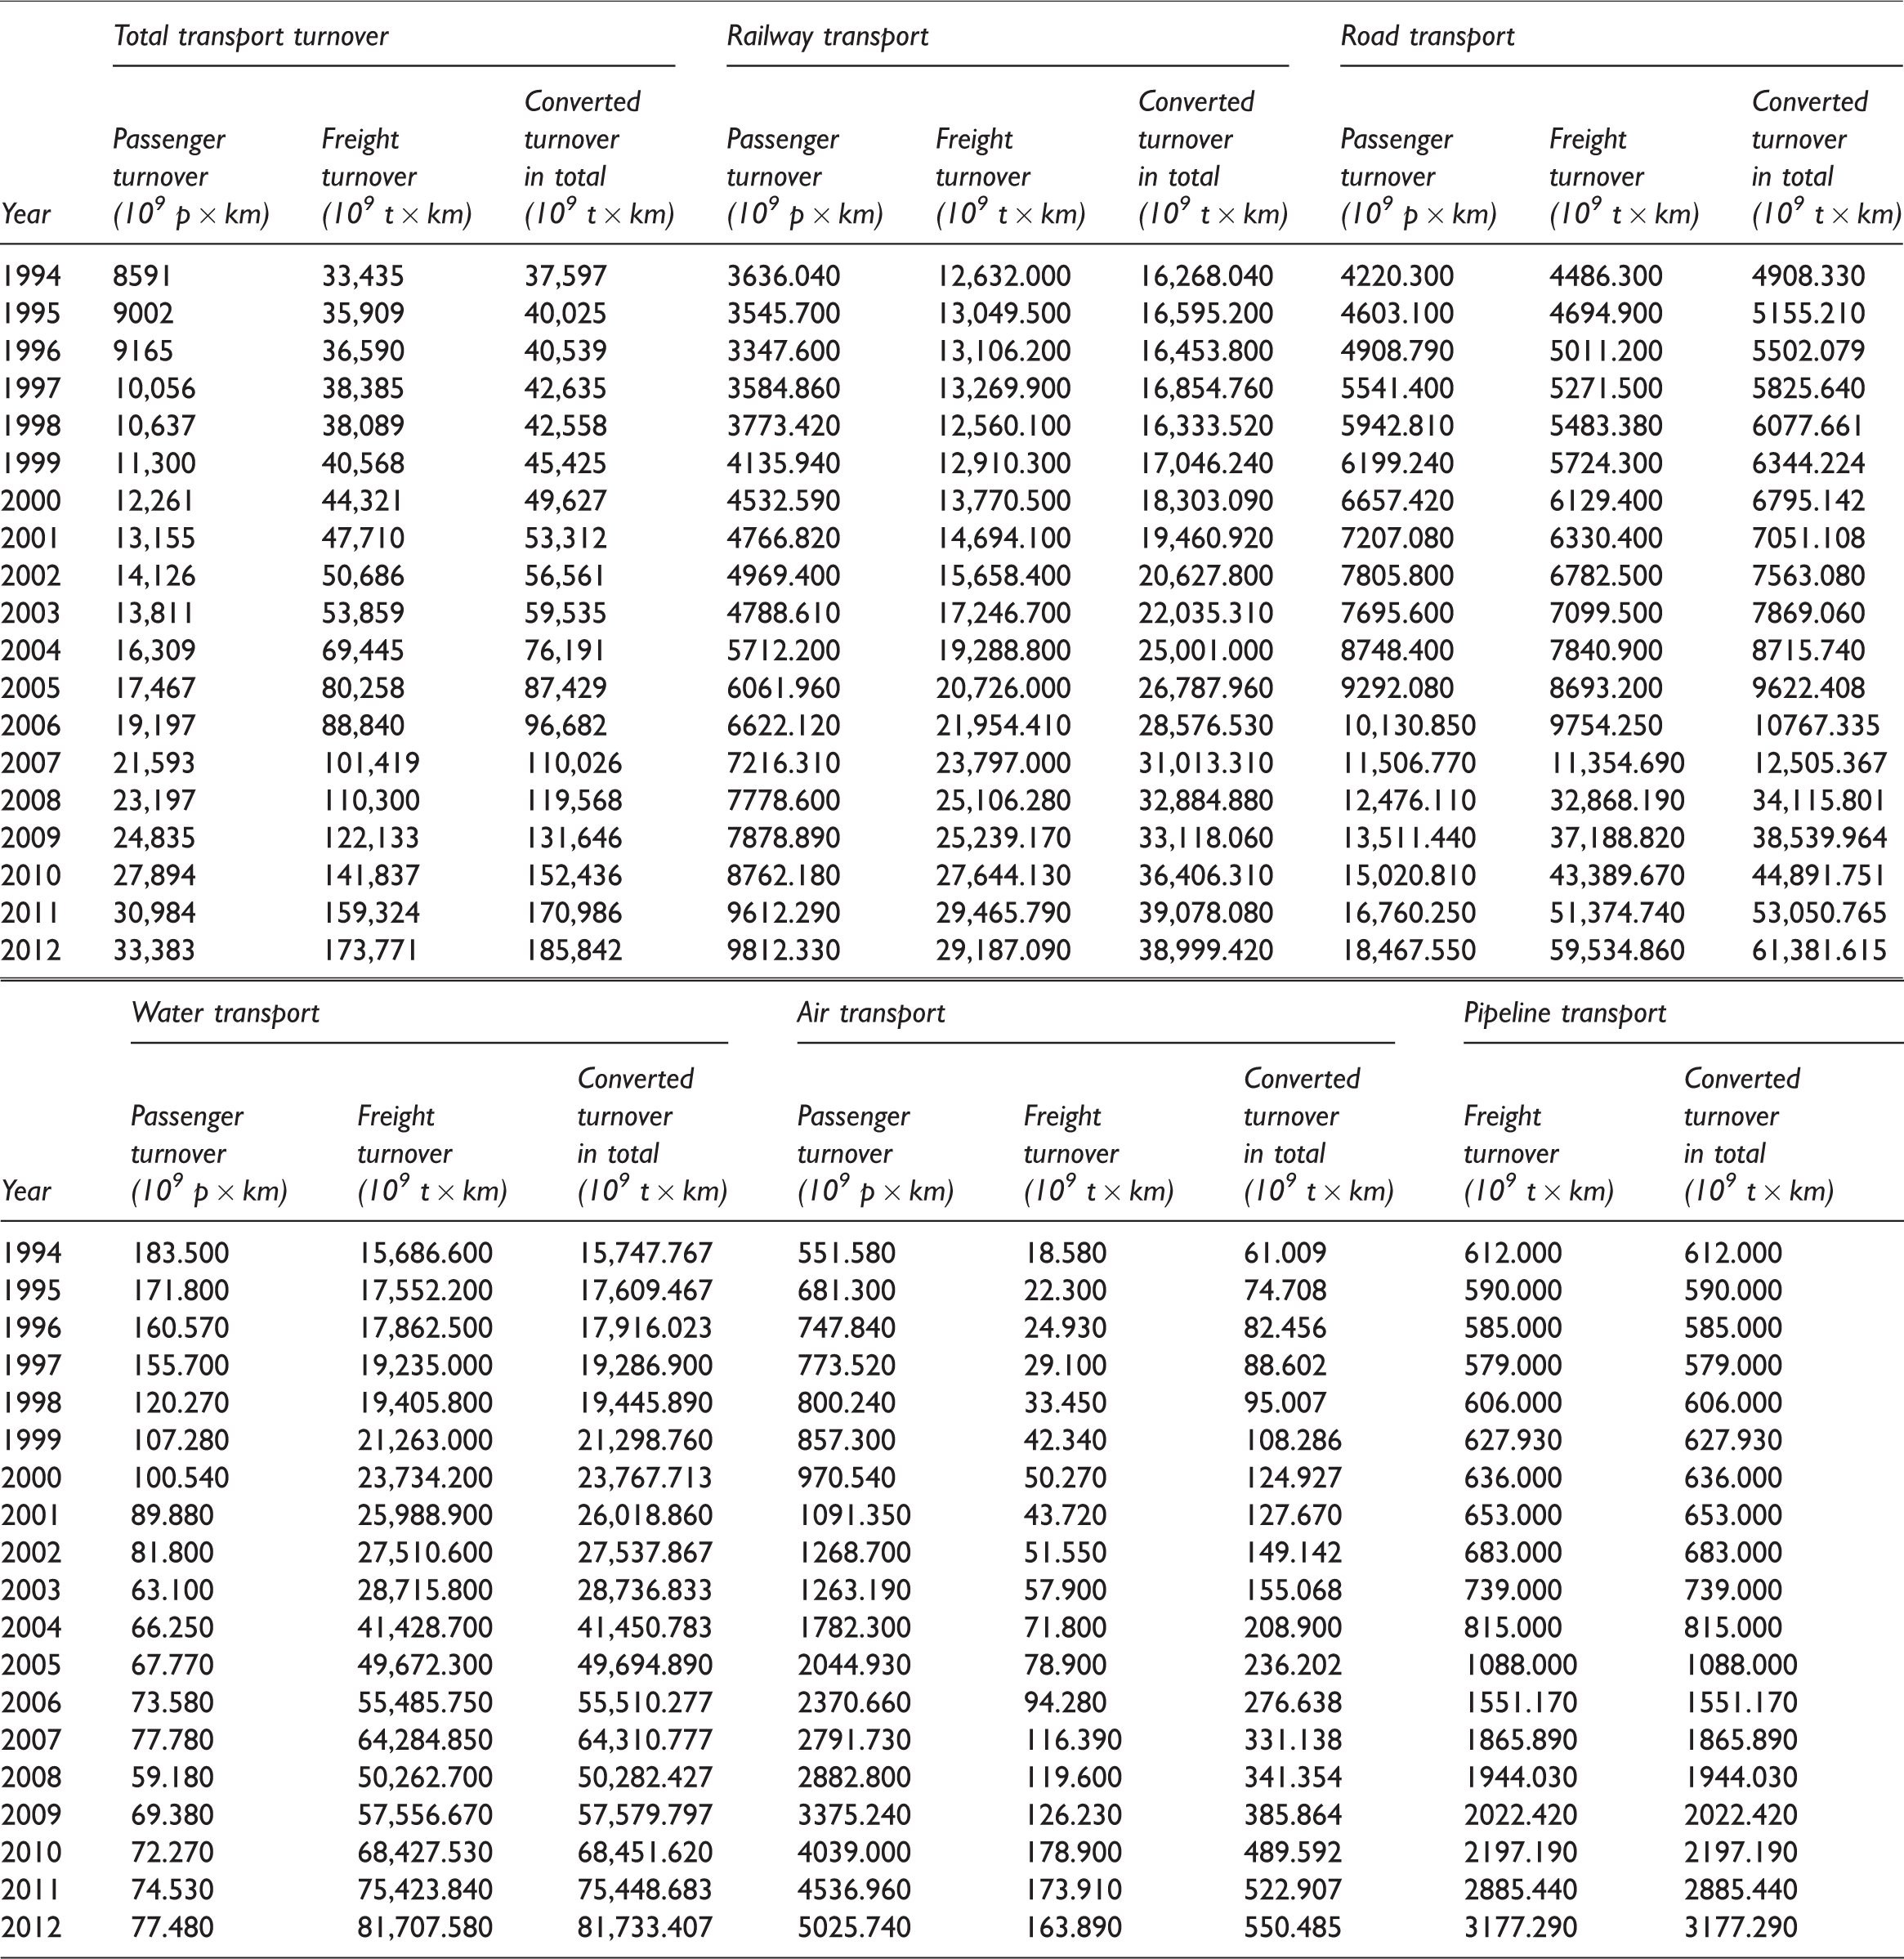
Source: The Yearbooks of China Transportation and Communications.38
CO2 emissions data
Generally, CO2 emissions from the transport sector can be calculated by the distance-based method or the fuel-based method.24 Using the distance-based method, CO2 emissions are equal to distance or travel activity data multiplied by emission intensity. The transport system can be considered as a whole (“the aggregate approach”) or be split into individual sub-modes (“the disaggregated approach”). While using the fuel-based method, CO2 emissions are estimated either by considering the components of the transport system that affect CO2 emissions (“the bottom-up approach”),39 or based on the total amount of fuel consumption or fuel sales (“the top-down approach”). Due to the limitation of available data, “the top-down approach” is more widely used in China, in which fuel consumption is multiplied by a CO2 emission factor for each fuel type, respectively, and then is summed up to obtain the overall CO2 emissions.24,40 In this study, the “top-down approach” is selected to calculate CO2 emissions from the Chinese transport sector. The CO2 emissions of a fuel type in year t are obtained by multiplying the fuel consumption of that fuel type and its corresponding emission factor. Next, the CO2 emissions from individual fuel types are added to obtain the total CO2 emissions in year t, as shown in equation (11):

Emission factors of major fuel types.41
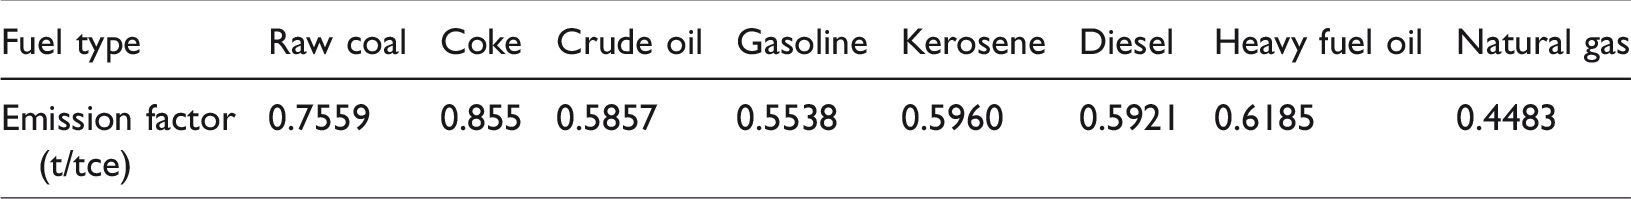
The energy consumption data by fuel type in the Chinese transport sector were collected from the China Energy Statistical Yearbooks (1995–2013). For the purpose of comparative analysis, the consumption of a fuel type needs to be converted into the equivalent amount of standard coal by its corresponding conversion coefficient. The conversion coefficients are summarized in Table 5. Finally, based on the collected energy data and emission factors, the CO2 emissions by fuel type from China’s transport sector from, 1994 to, 2012 can be calculated, as summarized in Table 6.
Fuel conversion coefficients to standard coal.41

Note: 1 tce = 29.3 GJ.
CO2 emissions by fuel type in China’s transport sector (1994–2012).
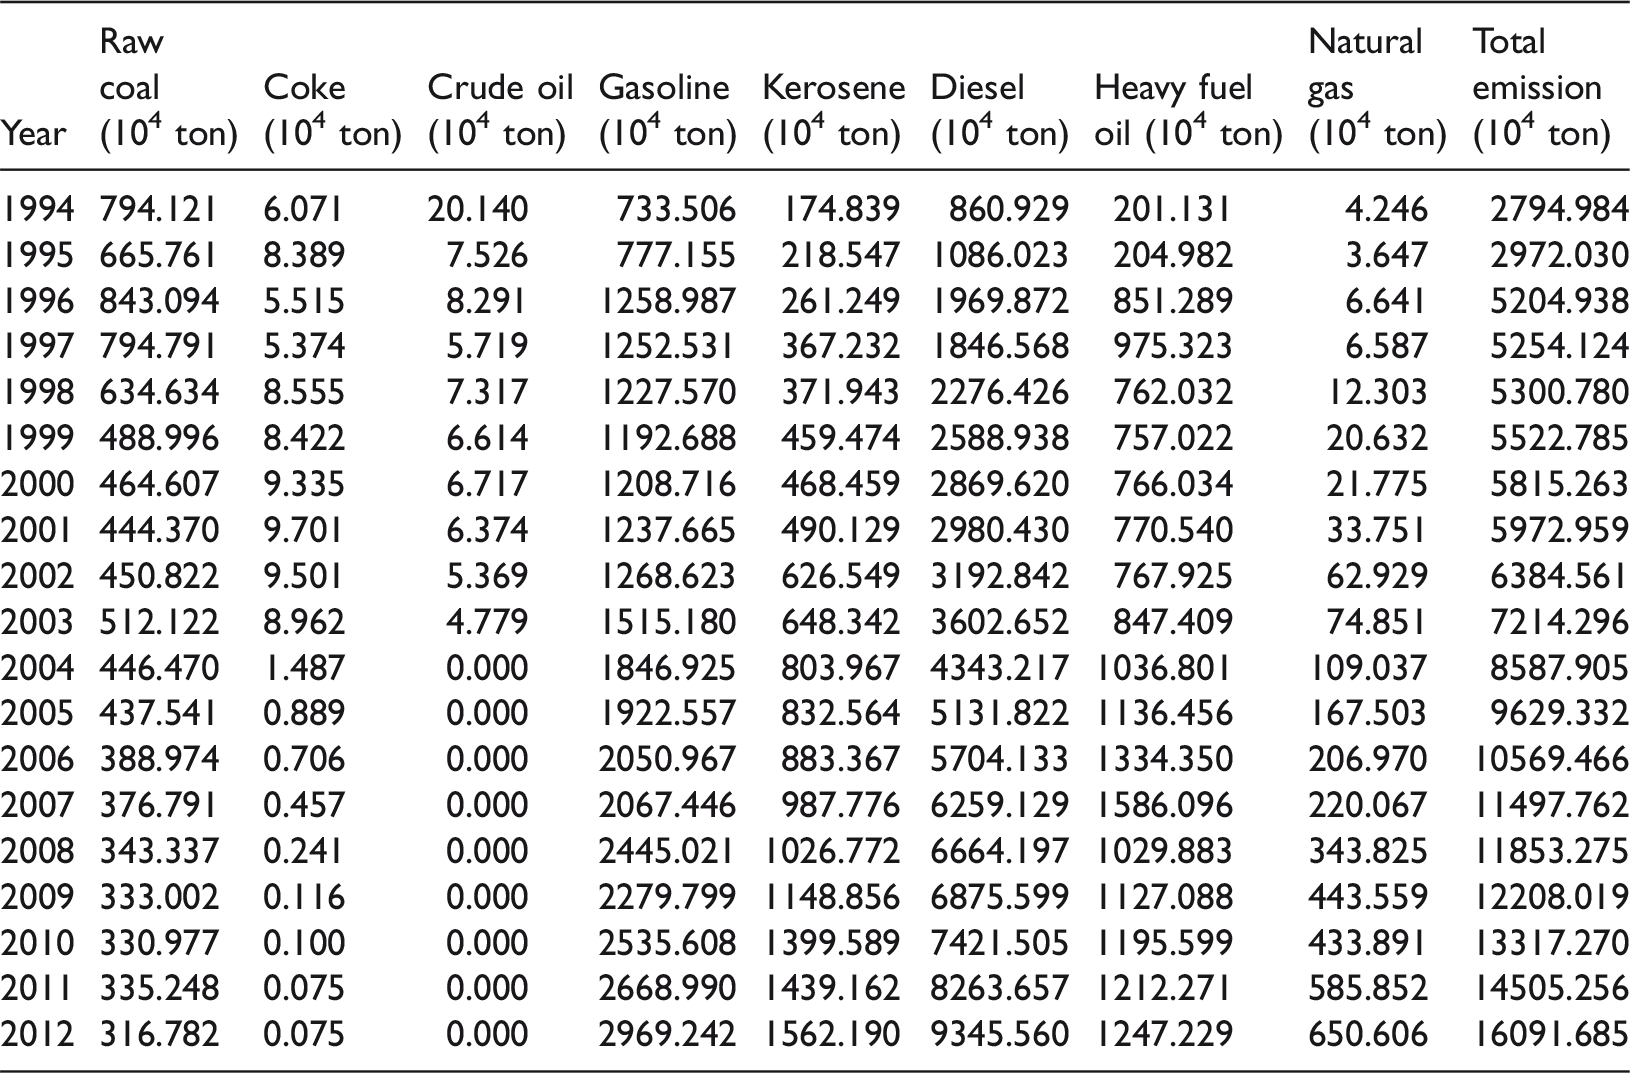
Note: The data of CO2 emissions were calculated by multiplying the fuel consumption data by the corresponding emission factor in Table 4.
Decoupling analyses
In this section, decoupling analyses are performed at two levels for the Chinese transport sector in the given study period (1994–2012). Firstly, the decoupling relationships between transport turnover and CO2 emissions are investigated at the aggregate level. Secondly, at the disaggregated level, the decoupling relationships between transport turnover and each fuel type are studied herein. The policy implications underneath the identified decoupling relationships are then revealed on a fuel-by-fuel basis in the next section.
The aggregate-level decoupling analysis
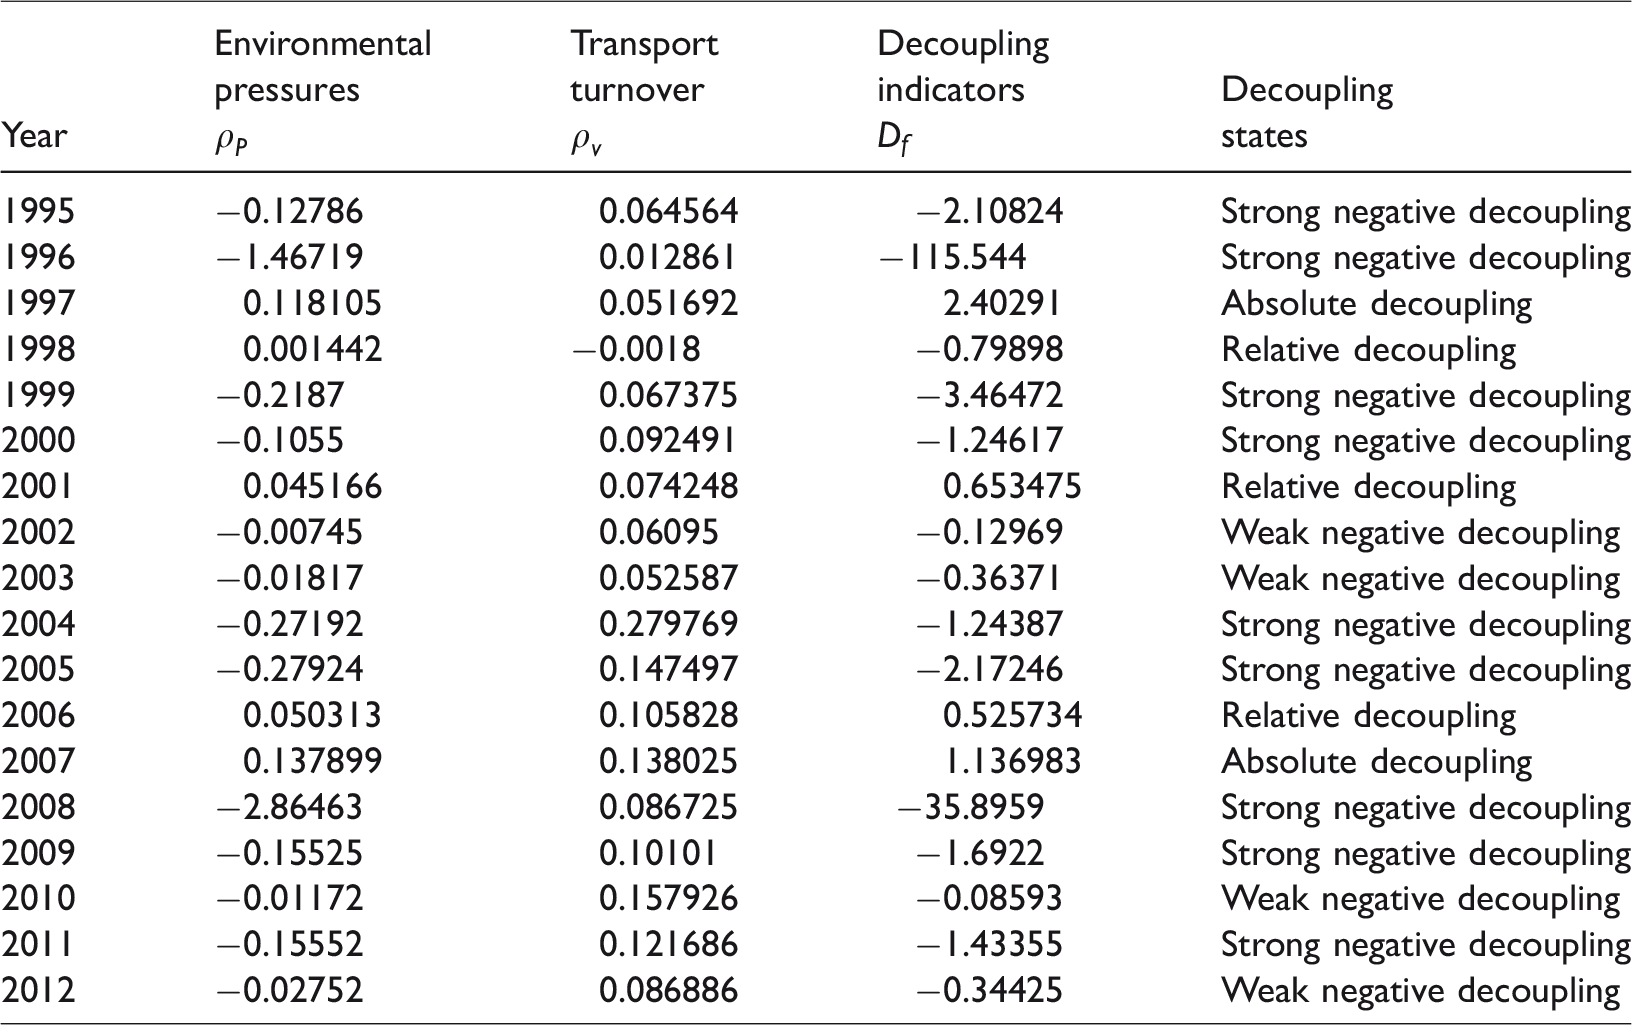
By using the methodology in Methodology ection, the changing rates of transport turnover and environmental pressure (ρv and ρp) are calculated for each year of the study period. Next, recall equation (10) to calculate the decoupling indicator, the decoupling state of each study year can then be determined correspondingly, as summarized in Table 7. The decoupling states are also depicted in Figure 4 for an in-depth understanding. As can be seen from Table 7 and Figure 4, in China, the transport turnover has increased throughout the study period except 1998, while the years in which CO2 emissions decreased only account for 27.8% of the study years. For this reason, only two years are in the absolute decoupling state: 1997 and 2007, about a 10th of the study years. On the other hand, the years in the negative decoupling state are half of the total period, including 1995, 1996, 1999, 2000, 2004, 2005, 2008, 2009, and 2011. If considering the years in the weak decoupling state (2002, 2003, 2010, and 2012), negative decoupling or non-decoupling years account for 72.2% of the study period. This indicates that China’s transport sector is far from reaching the decoupling state between CO2 emissions and transport turnover during the study period.
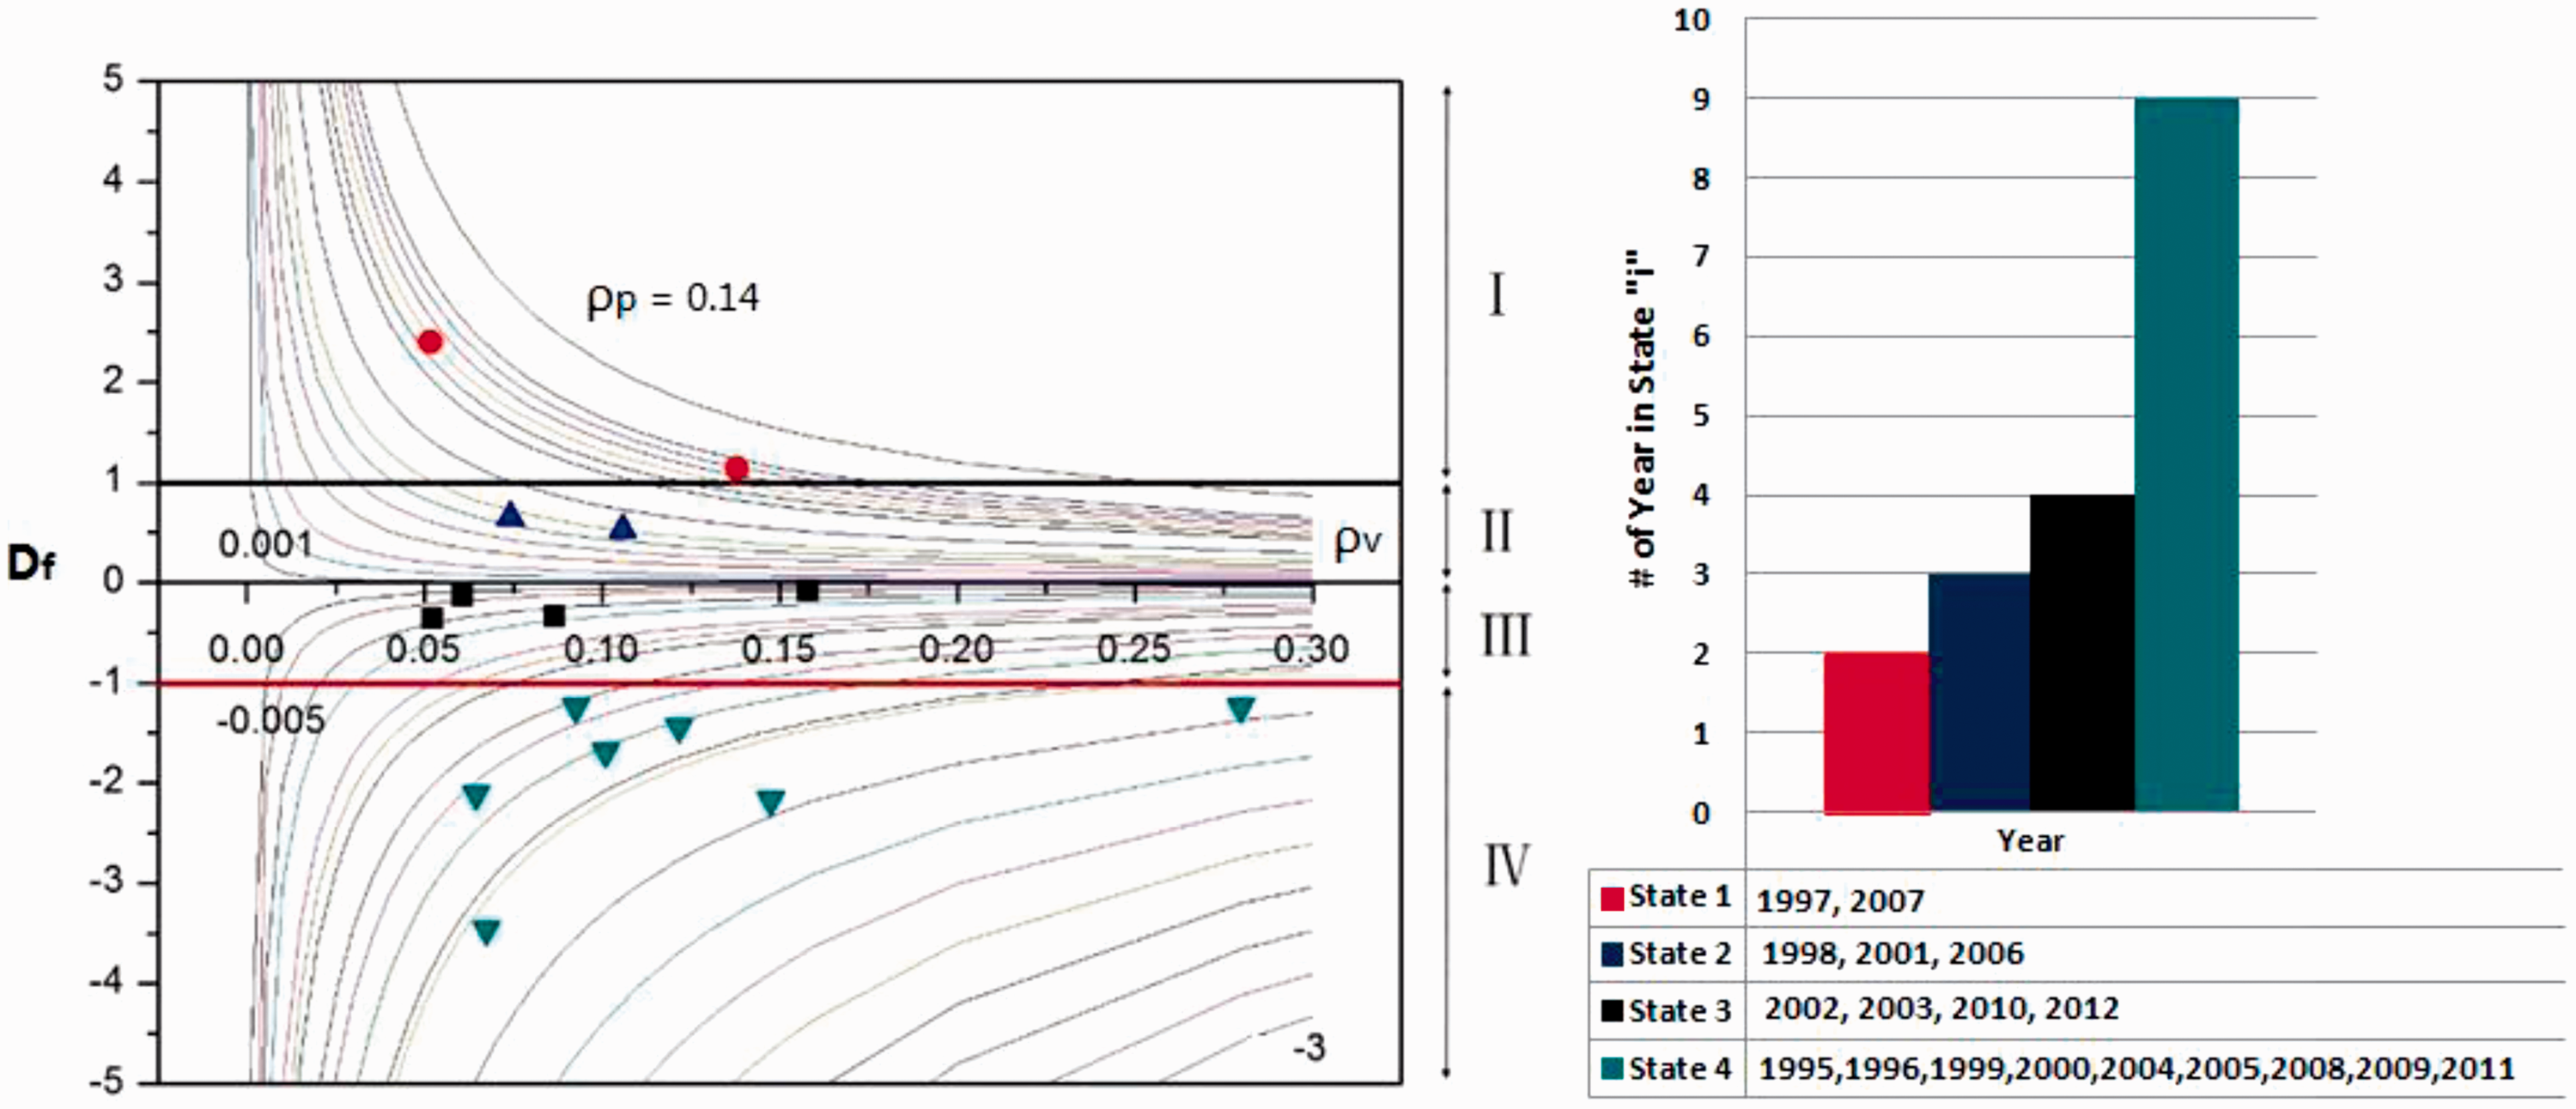
Decoupling curves for the Chinese transport sector from 1994 to 2012 (overall transport turnover vs. CO2 emissions). Note: State 1: absolute decoupling; state 2: relative decoupling; state 3: weak negative decoupling; and state 4: strong negative decoupling.
Decoupling states for the Chinese transport sector from 1995 to 2012 (overall transport turnover volume vs. CO2 emissions).
Based on the above analysis results, at the aggregate level, the Chinese transport sector is far from reaching the decoupling state. Negative decoupling or non-decoupling years account for 72.2% of the study period. Only two years are in the absolute decoupling state: 1997 and 2007, which means that the growth rate of carbon emission is slower than the growth rate of transport outputs. This is mainly attributed to the economic downturn in the 1997 Asian financial crisis and the 2007–2008 global recession. Noted that the Chinese government learned a great deal from the 1997 crisis and substantially strengthened its financial system and built up high levels of international reserves. A US$586 billion stimulus package was adopted by the Chinese government as an attempt to minimize the impact of the 2007–2008 global financial crisis. In addition, China has been experiencing accelerated urbanization and industrialization, which led to booming of transport industry. In this background, more energy was consumed and more carbon emissions were produced, which makes negative decoupling or non-decoupling states appear in most years of the study period.
The disaggregated-level decoupling analysis
In this section, the decoupling states of CO2 emissions are investigated for eight major energy fuel types in the Chinese transport sector. This in turn allows a deeper understanding of decoupling effects to make more targeted and effective decoupling policies. First, the split trend of CO2 emissions by fuel type during the study period is investigated. Next, the levels of decoupling effects are evaluated for each fuel according to the predefined decoupling factors (Df) and states. More targeted and effective policies are proposed on a fuel-by-fuel basis in the next section.
The split trends of CO2 emissions by fuel type
Figure 5 shows the CO2 emissions split for eight primary energy fuels in the Chinese transport sector during the study period. It can be seen that CO2 emissions were coal dominated in the 1990s, but the share of coal has clearly experienced a downward tendency from 33.35% in, 1992 to only 2.03% in 2002. The researchers believe it is closely associated with technological advancements in the railway sector, in which steam locomotives have been replaced by electric and diesel locomotives. The share change of diesel shows that China’s transport sector is diesel dominant in recent years. This conclusion is reasonable because diesel has been used widely in multiple transport modes in China, especially in road fleet transport. The shares of gasoline and kerosene have been relatively stable in the past two decades. The share of heavy fuel oil increased first to the peak value of 14.87% in, 1997 before decreasing to 7.50%; this pattern is consistent with the decline of water transport. In contrast, the share of natural gas has dramatically increased by almost 25-fold over the past two decades, from 0.23% in, 1994 to 5.16% in 2012.
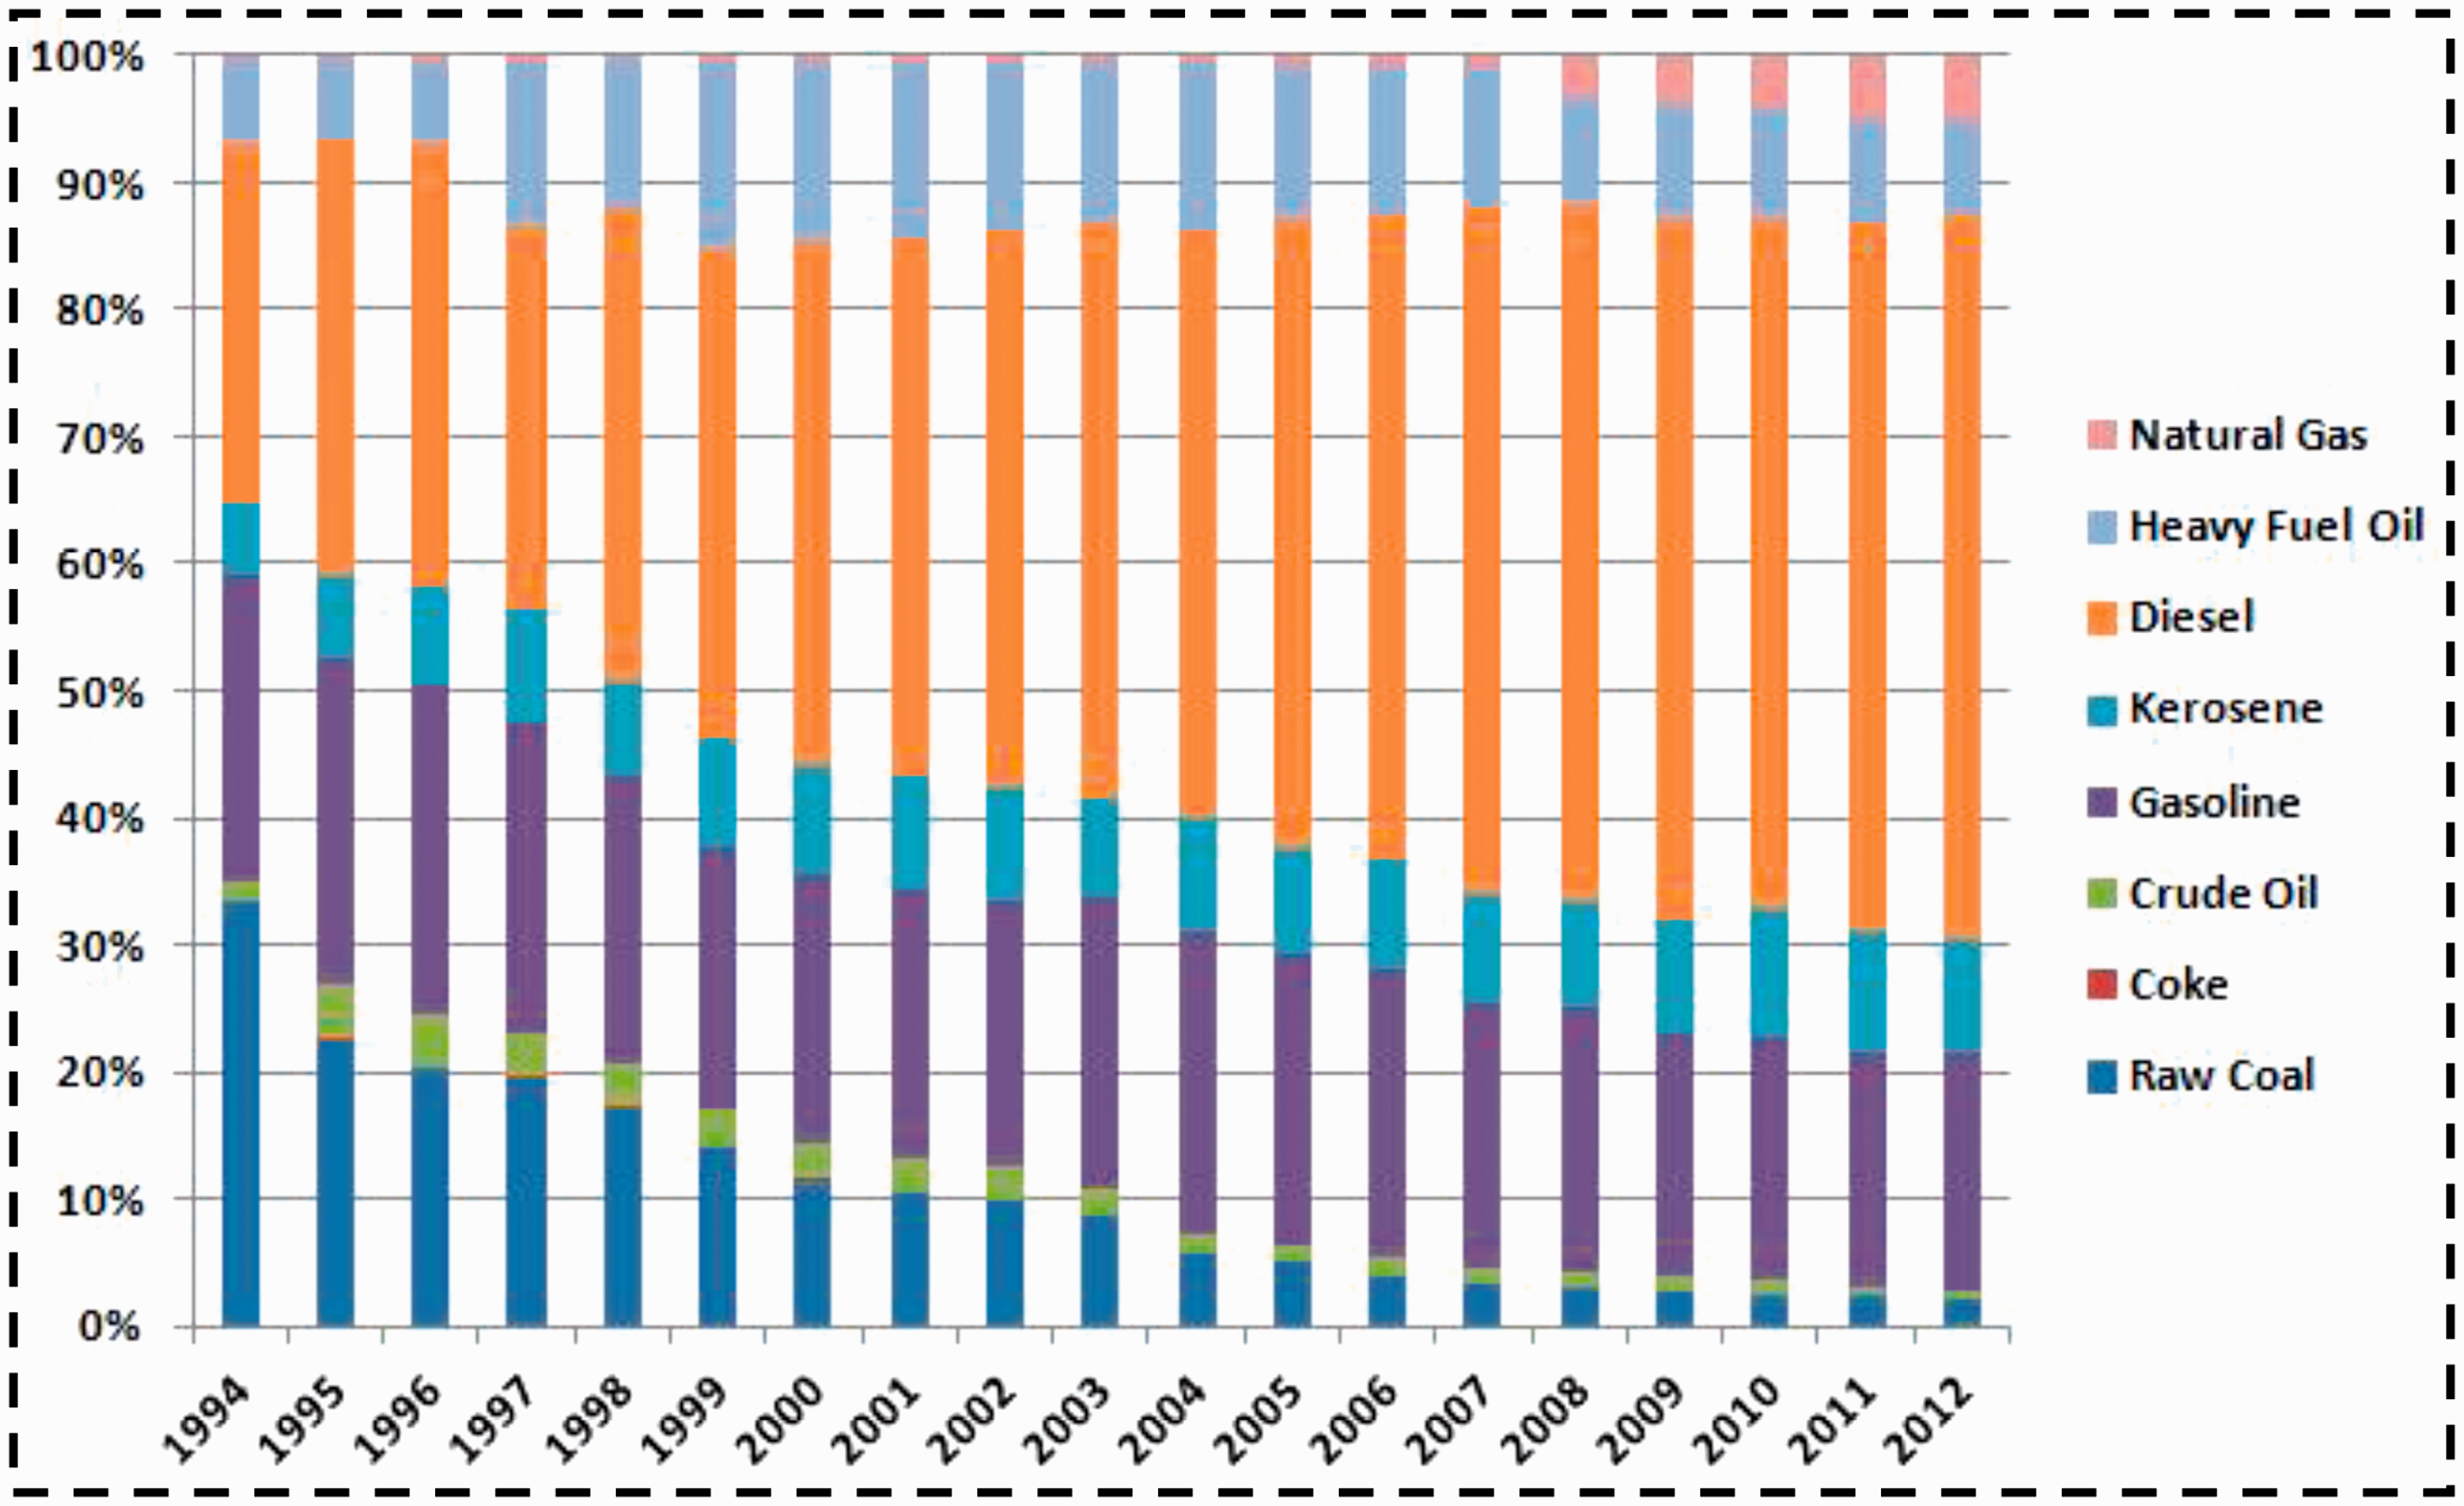
CO2 emissions split by fuel type in China’s transport sector (1994–2012).
Decoupling states by energy fuel type
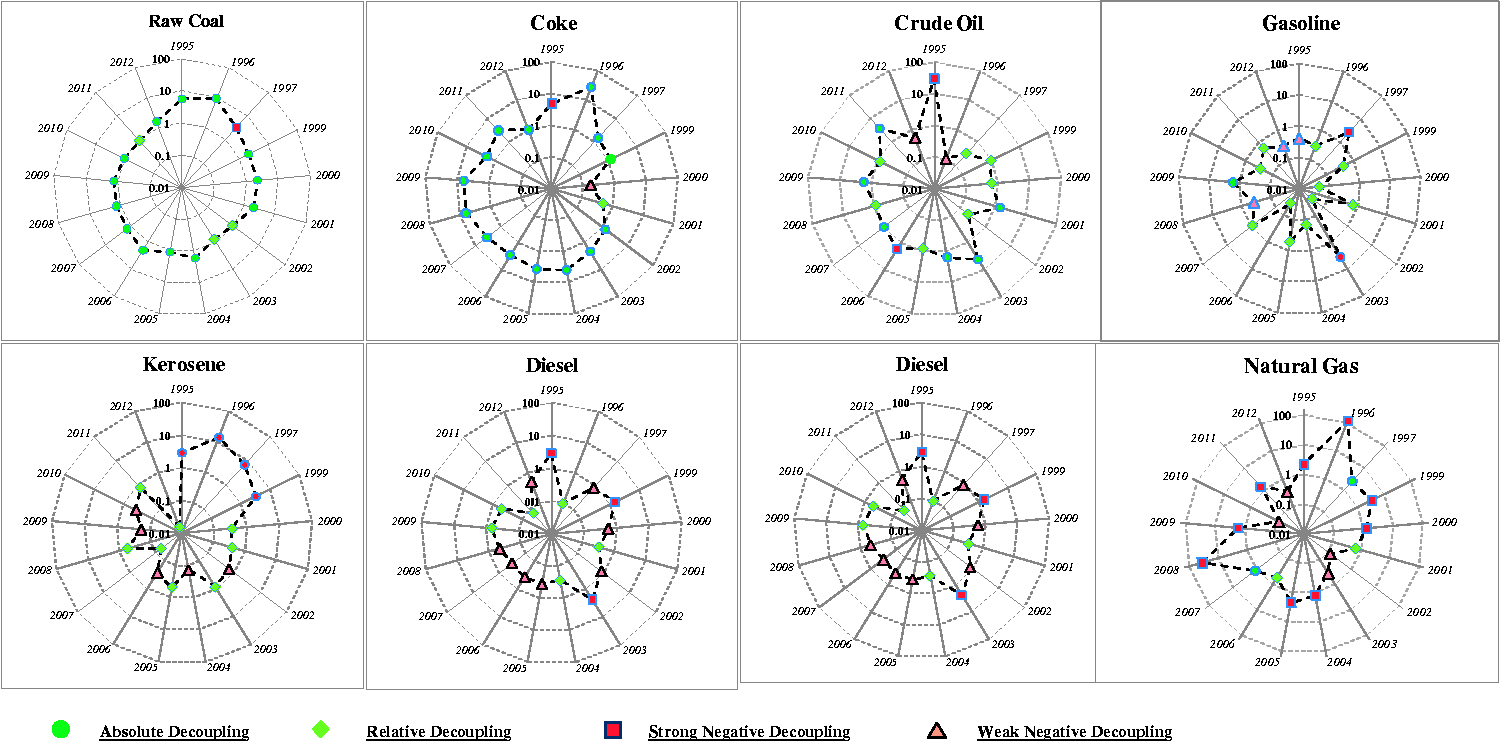
By following the same procedures with the aggregate analysis, the decoupling factors for each fuel type in each year are calculated and summarized in Table 8. Figures 6 and 7 also depicts these decoupling relationships for the purpose of illustration. Based on the analysis, CO2 emissions from raw coal and coke were decoupled from transport turnover growth, mainly in the absolute decoupling state. CO2 emissions from crude oil, gasoline, and heavy fuel oil were generally decoupled from transport development, mainly in the relative decoupling state. However, CO2 emissions from kerosene and diesel were non-decoupled from transport turnover growth, mostly in either the weak or the strong negative decoupling state. Natural gas, as a type of new clean energy, has seen increasing use in the Chinese transport sector. Its decoupling states were in a loop state of “strong negative decoupling–relative decoupling–weak negative decoupling–strong negative decoupling.”
The decoupling states by fuel type for the Chinese transport sector from 1994 to 2012.
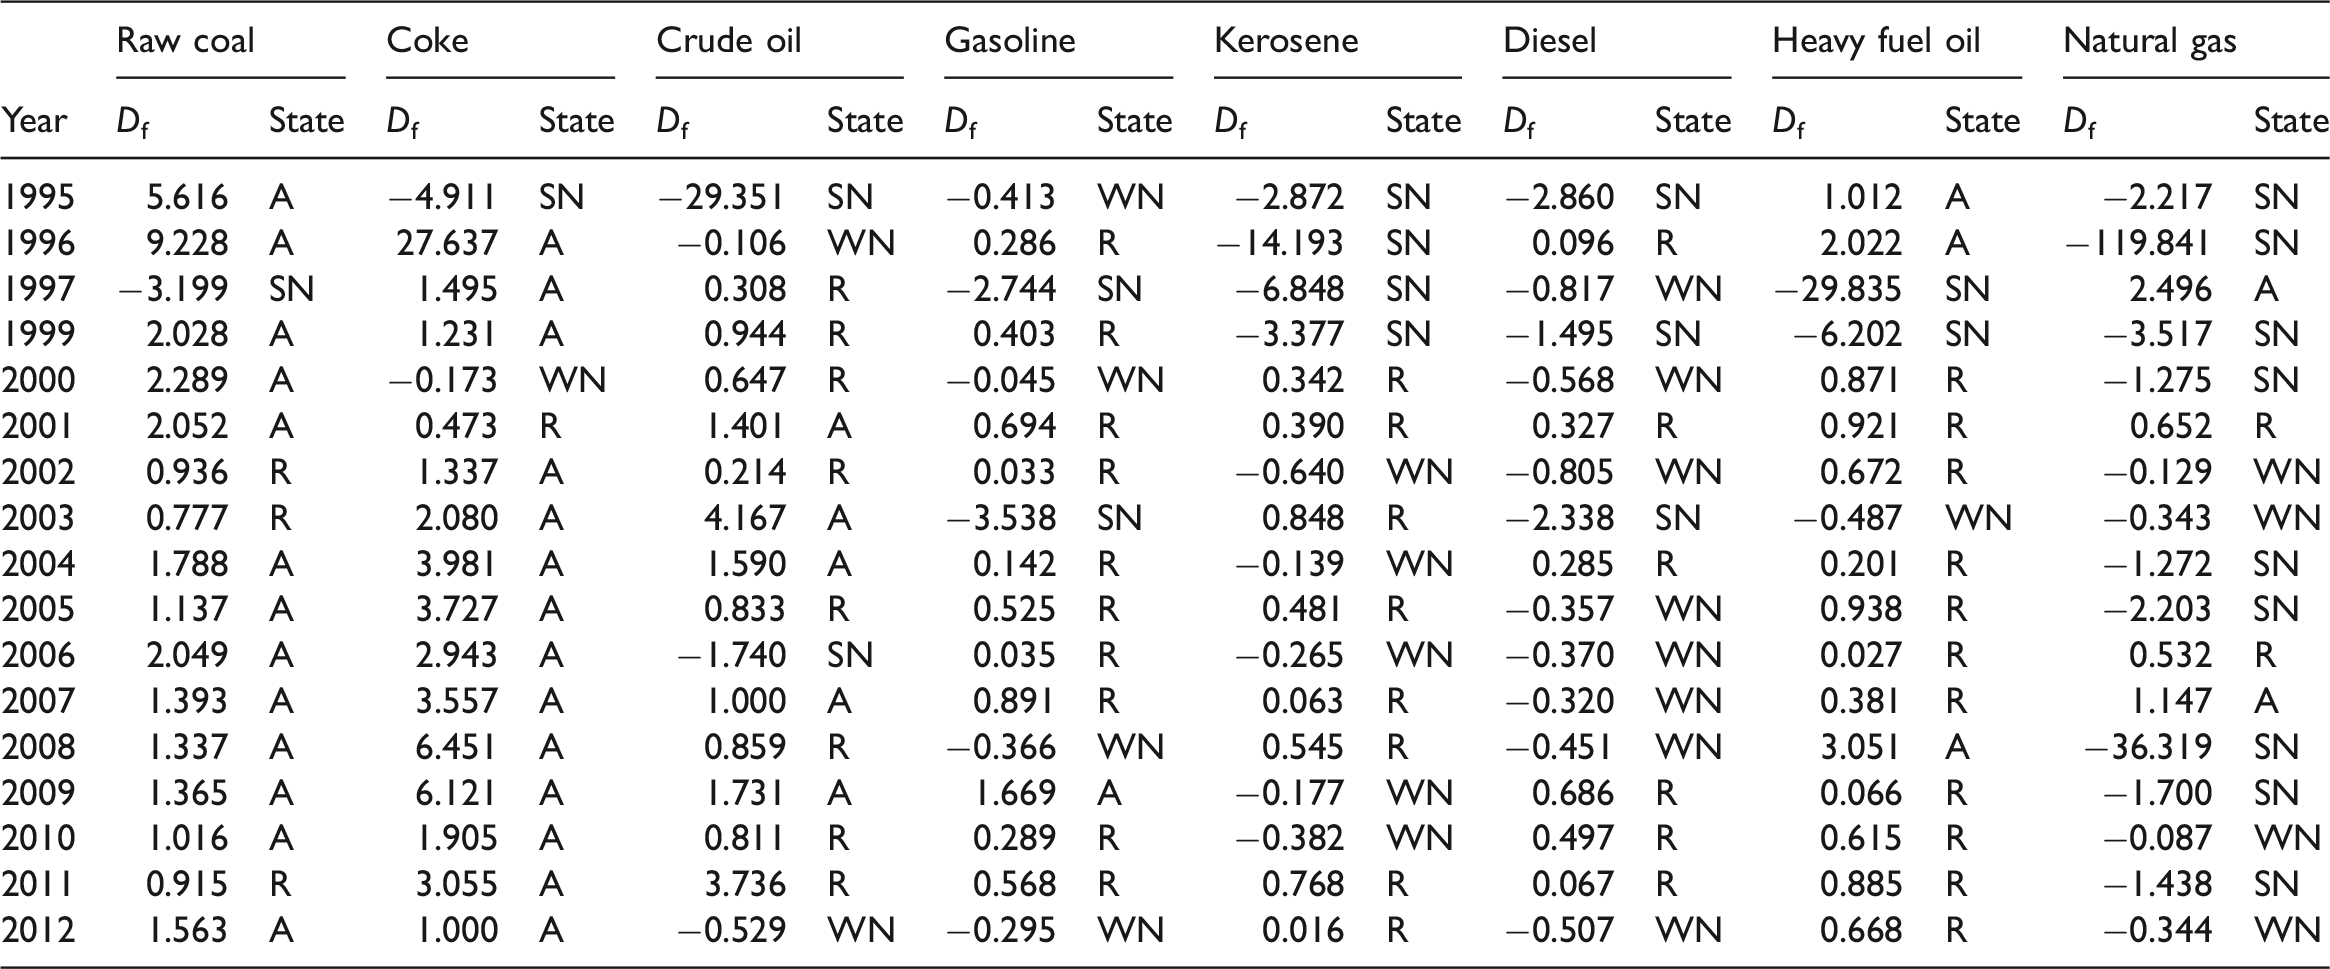
A: absolute decoupling; R: relative decoupling; SN: strong negative decoupling; WN: weak negative decoupling.
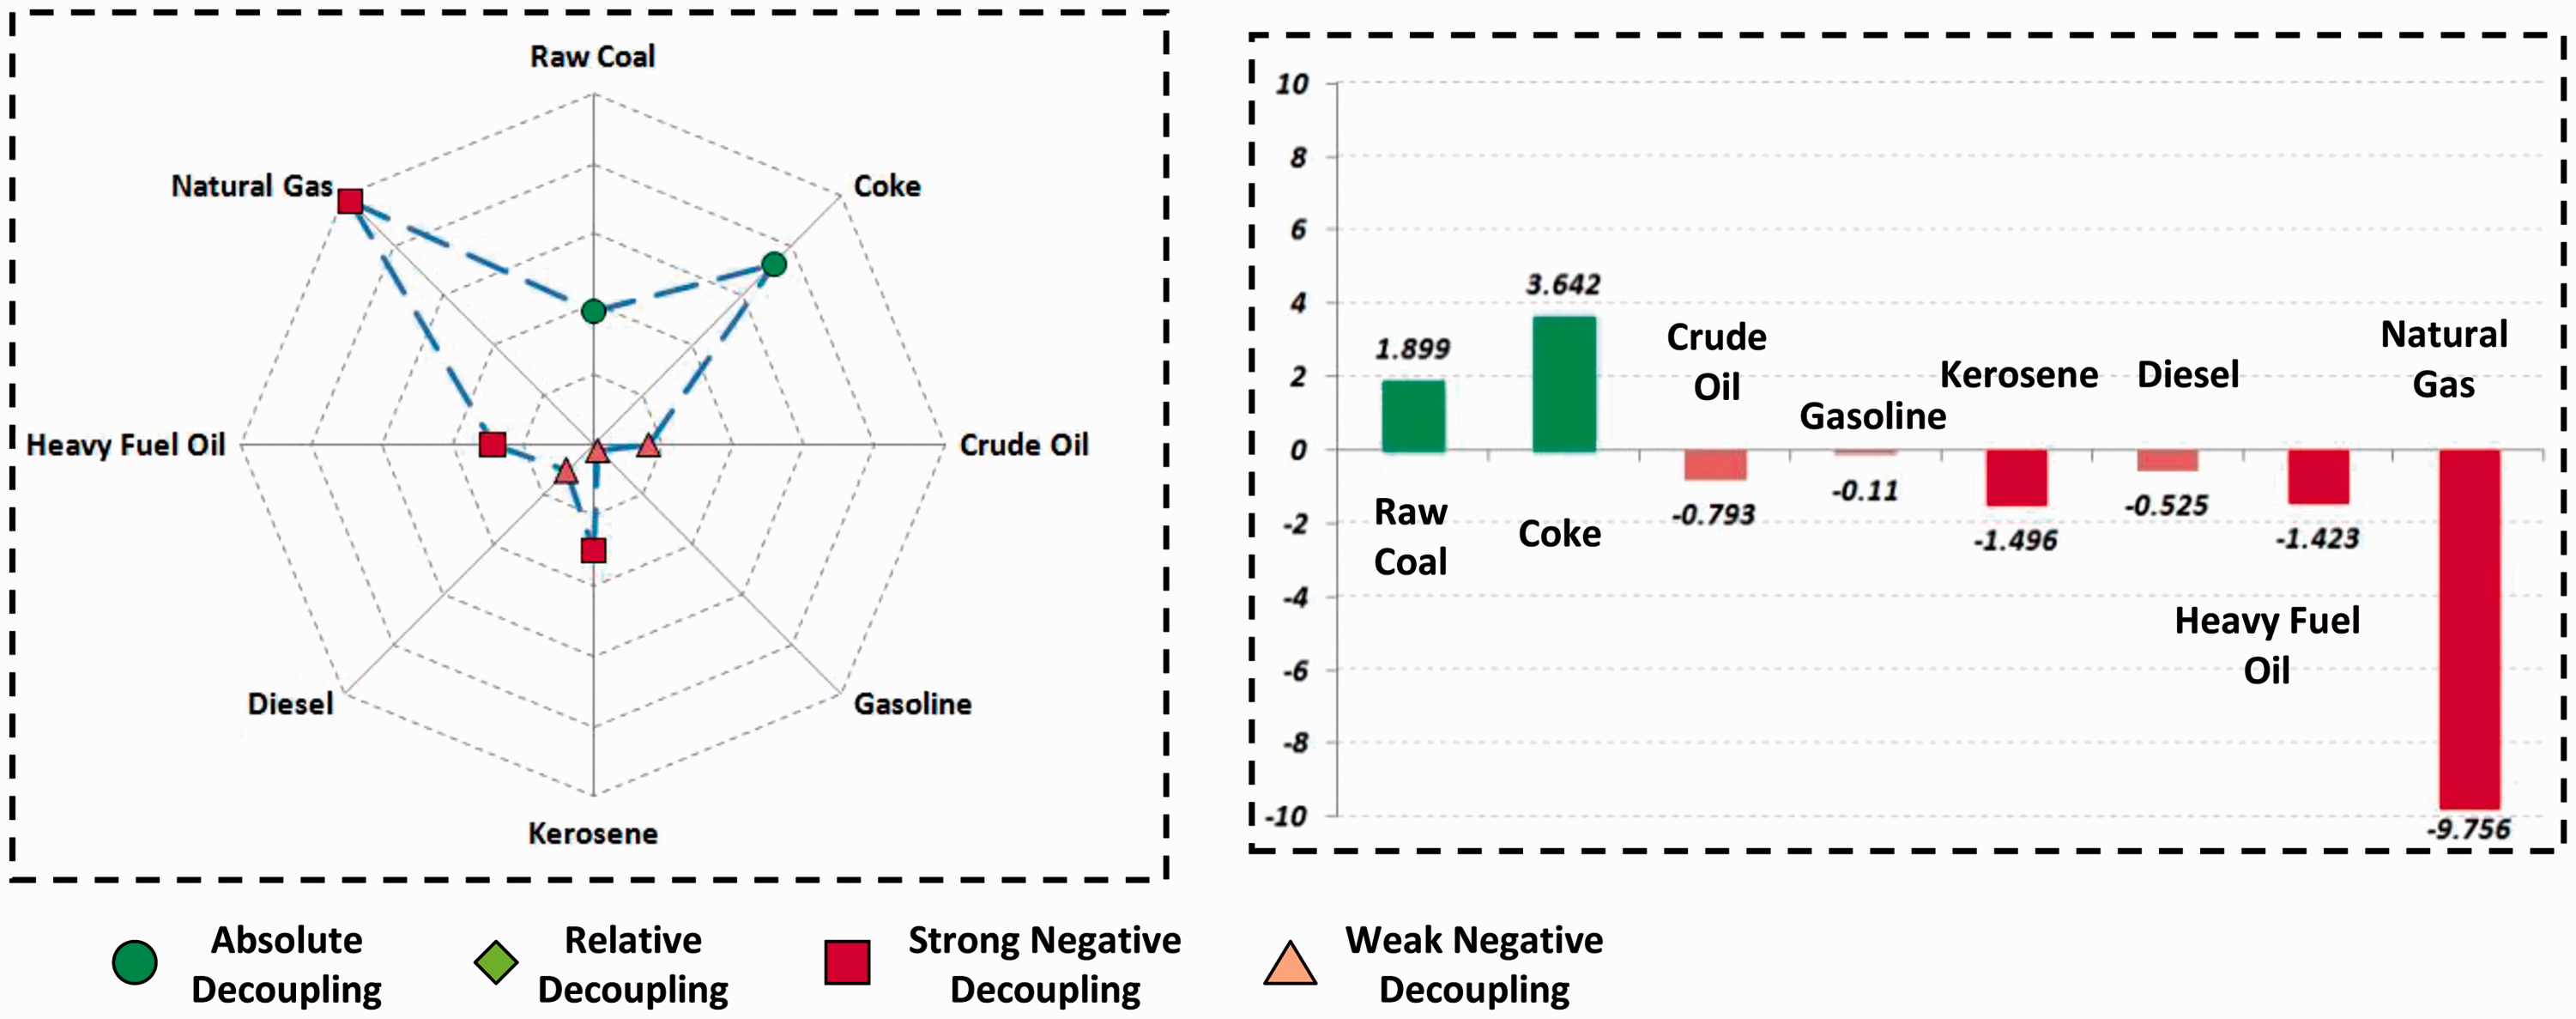
The decoupling states by fuel type for the Chinese transport sector from 1994 to 2012: Number of years in each state.
The decoupling states by fuel type for the Chinese transport sector from 1994 to 2012: Detailed decoupling factors.
At the disaggregated level, only CO2 emissions from raw coal and coke were decoupled from the growth of transport turnover, mainly in the absolute decoupling state. It can be seen that CO2 emissions were coal dominated in the 1990s, but the share of coal has clearly experienced a downward tendency from 33.35% in, 1992 to only 2.03% in 2002. The researchers believe it is closely associated with technological advancements in the railway sector, in which steam locomotives have been replaced by electric and diesel locomotives. Due to the declining proportion of energy consumption and the continuous improvement of electrification, the absolute decoupling state appears for these two types of fuels.
Moreover, the overall decoupling level for each fuel type can be simply described using the average value of decoupling factors of all study years, as illustrated in Figure 8.
The overall decoupling states by fuel type for the Chinese transport sector (1994–2012).
Policy implications
According to the above discussions, it is reasonable to select the following four fuels as the major study objects: coal (the fuel most commonly used in China), gasoline and diesel (the dominant energy sources of CO2 emissions), and natural gas (the strongest negative decoupling fuel). The energy policies targeted at mitigating CO2 emissions from these four fuels are proposed herein. Other fuels should also be benefited from these or similar energy policies. At the end, we briefly discussed China’s Nationally Determined Contribution (NDC) and its effects on our policy recommendations, focusing on the transport sector only. Noted that on 3 September 2016, China ratified the Paris Agreement and it has policies to reach its NDC goals.
Coal
During the study period, the share of coal in China’s energy consumption declined continuously, and hence its CO2 emissions were absolutely decoupled from the growth of transport turnover. However, it is still safe to say that China is and will continue to be a coal-power economy, since coal in China can be characterized as a cheap and abundant source of energy. In 2012, China reported over 3 million tons of coal consumption in the transport sector alone.42 In this regard, China faces the challenges of reducing and decoupling coal-fired emissions from transport development that could dampen future economic growth. The following proposed measures seek to respond to such challenges:
Most of the coal resources are located in inland Northern provinces in China, e.g., Shanxi, Shaanxi, and Inner Mongolia, which are far away from coastal demand centers, e.g., eastern coastal provinces. Therefore, transporting coal across the county requires a large share of domestic transport capacity. To cope with the difficulties of uneven distribution of coal production and consumption, the policy of increasing the use of coal by wire, whereby energy from coal is extracted by combustion at the mine-to-mouth thermal power plants and then delivered long-distance to demand centers, presents potential for reducing coal transport demands. However, this long-term potential benefit may be offset by the short-term significant current electricity grid construction cost for the construction of power facilities.42 In this regard, this attractive policy needs to consider the trade-offs between long-term and imminent benefits. Another promising policy is to improve coal’s energy efficiency by coal washing. Currently, Chinese thermal coal has a much lower calorific value, about 5000–5500 kcal/ton, than that of thermal coal imported from other countries, e.g., Australia, with a calorific value of 6000 to 6500 kcal/ton. By promoting the coal-washing policy more extensively, the energy efficiency of coal could be increased by more than 20% and thus could reduce total coal consumption and transportation pressure. However, the high water consumption for coal washing, about 4 tons of water per ton of raw coal, has constrained this policy implementation, especially in the water-deficit regions of China. In this regard, implementing this policy needs to consider the uneven water distribution of local regions in China.
Gasoline and diesel
In the rapidly evolving context of urbanization, Chinese cities have been undergoing fundamental changes in terms of simultaneous demographic, technological, and socioeconomic transition, implying a significant expansion in demand for urban infrastructure and transport. In this regard, the transport energy in China is dominated by gasoline and diesel, accounting for about three-fourths of the total energy consumption in 2012. However, the previous analyses indicate that CO2 emissions from gasoline and diesel are still in the weak negative decoupling state overall, which underlines the necessity of enhancing energy policies to address pressing environmental challenges from gasoline and diesel. The promising policies can include:
Addressing the decoupling issues in the transport sector requires the interplay between socioeconomic development, urban infrastructure, and the environment. An integrated approach that combines spatial, transport and urban planning, land market governance, and environmental policies is particularly compelling.43 The Chinese government must be aware that various land use factors such as density, regional accessibility, and roadway connectivity affect travel behavior, including per capita vehicle travel, modal split, and non-motorized travel. Therefore, relevant transport and urban planning tools can be designed to discourage unnecessary transportation trips and hence reduce the CO2 emissions from gasoline and diesel. Given the experiences in developed countries, improvement in public transport services and lower commuting costs (including time value) of public transport effectively reduces the use of private cars and subsequently fuel consumption.44 Therefore, the comprehensive policy packages integrating high-quality services of public transport consistency with sustainable urban development strategies have to be put in place. It is necessary to convince car users to make a modal shift in the urban environment.43 Public and fiscal policies are needed to restrict excessive car use in China’s metropolitan areas. Experiences such as those learned from Beijing and Shanghai are a necessity, including: high purchase tax and license registration fees (vehicle quota system); road use restrictions; parking fees and road-pricing systems; and incentives for purchasing and using more energy-efficient and carbon-saving vehicles. Diesel engines, primarily on-road heavy-duty vehicles and international marine vessels, will increase the CO2 emissions rapidly in regions where controls lag. Practices in OECD nations could provide lessons for China to address diesel emissions. A diesel vehicle emissions reduction program should be enacted in three areas: new vehicles, fuels, and the in-use fleet. This program could include several strategies, including new vehicle emissions and fuel quality standards, prevention of vehicle overloading, fiscal policies to encourage higher quality fuel supply, and discouraging the use of higher emitting vehicles.45
Natural gas
Natural gas, as a type of relatively clean energy compared to other fossil energies, has witnessed an increasing use in the Chinese transport sector. It has been anticipated that decarbonization is beginning with the replacement of coal and oil with natural gas. This is because natural gas-fired power plants emit 57% less CO2 per kilowatt-hour (kWh) than coal-fired plants, and are on average 20% more efficient at converting fuel energy to electricity than coal plants.46 Especially compared to coal, natural gas generates negligible amounts of particulates, sulfur, and mercury, which particularly benefits China’s eroding air quality. The 13th Five-Year Plan (2016–2020) of the Chinese government calls for the replacement of coal in non-power sectors either with natural gas and/or electricity. As a result, natural gas is China’s fastest growing major fuel, with demand quadrupling in the past decade. it is now about 6–7% of China’s energy demand, doubling the market share in 2007, and China seeks natural gas to be 10% of energy by, 2020.47
However, according to our analysis, the decoupling state of natural gas was in a loop state of “strong negative decoupling–relative decoupling–weak negative decoupling–strong negative decoupling” during the study period. If simply considering the average decoupling indices for all study years, natural gas presented the strongest negative decoupling state among eight fuel types. The authors hold that the following reasons may explain this phenomenon:
Natural gas resources in China are unevenly distributed and often remote from demand centers. Transporting natural gas to demand centers would generate a large amount of carbon emissions. Constrained by geological complexity, shortage of water, land access, and the limitations of infrastructure, the production of natural gas consumes more resources and hence generates more greenhouse emissions. The output of natural gas is monopolized by some Chinese state-owned giants. Production wise, they are not nimble and waste tons of resources without any innovation.
Although this may be contradictory to the widely accepted fact that increased use of natural gas reduced CO2 emissions in recent years. We, along with other researchers, found that without strong limits on CO2 emissions or policies that explicitly encourage renewable electricity, abundant natural gas may actually slow the process of decarbonization, primarily by delaying deployment of renewable energy technologies (e.g., the wind and solar energy that can easily scale up the production in China).48 In this regard, China’s current policies of promoting natural gas should be examined critically in the context of a national “cap to trade” scheme that reduce natural gas consumption while enabling China to achieve its climate goals by favoring the deployment of lower-carbon renewable energy sources.
The discussion on China’s NDC goals
As the world’s largest emitter, China’s NDC puts forward a new goal on its carbon emission for 2030: reducing CO2 emissions per unit of GDP (known as carbon intensity) by 60–65% below, 2005 levels. This new carbon intensity target builds on China’s existing target to reduce intensity 40–45% by 2020, and it is also roughly consistent with scenarios showing China’s CO2 emissions peaking in 2030. To implement this NDC, China needs to address emissions from its transport sector, which is gaining in importance as China moves to bring industrial emissions under control. In this context, any policies or measures to decouple carbon emissions from the growth of its transport sector are very significant for the implementation of China’s NDC.
As discussed previously, the electrification in transport sector by low-carbon electricity (e.g., the solar and wind power) would greatly reduce the carbon intensity and hence decouple carbon emissions from transport outputs. China also has a huge potential of transport electrification. It is estimated that China will deploy 800–1000 GW in nonfossil capacity, close to the United States total current electricity capacity.3
It should be also noted that our study is focusing on the decoupling policies in the transport sector, while the goals of China’s NDC are much wider and the policies of its implementation evolve many other economic sectors. The discussion of any policies in other sectors may be beyond the scope of our study.
Conclusions
China faces rapid economic development that drives ever-increasing energy use and consequently increases CO2 emissions. Sustaining rapid economic and urban growth while minimizing the detriment to the environment is a dilemma for the Chinese government. Unlike existing studies, this paper focuses on analyzing the decoupling states between CO2 emissions and the growth of China’s transport sector from, 1994 to, 2012 at two levels. The major findings and policy implications are summarized as follows:
At the aggregate level, the Chinese transport sector has been far from reaching the decoupling state between CO2 emissions and the development of transport turnover during the study period. Negative decoupling or non-decoupling years accounted for 72.2% of the total study years. Based on the decomposed decoupling analyses by eight primary fuels, the decoupling effect of each fuel during the study period can be described as follows: raw coal and coke are in the absolute decoupling state; crude oil, gasoline and diesel are in the weak negative state; and the other three fuel types, kerosene, heavy fuel oil, and natural gas, are in the strong negative decoupling state. Policy implications underneath the identified decoupling effects are revealed on a fuel-by-fuel basis. Noted that the suggested energy policies need to evaluate the trade-offs between immediate economic costs and long-term environmental benefits.
In summary, addressing the environmental, economic, and social challenges systematically should be the direction taken in the future by the researchers for building a more sustainable transport sector in China.
Footnotes
Acknowledgements
The authors would like to thank all those involved for support and advice on this study.
Declaration of conflicting interests
The author(s) declared no potential conflicts of interest with respect to the research, authorship, and/or publication of this article.
Funding
The author(s) disclosed receipt of the following financial support for the research, authorship, and/or publication of this article: This research was supported by the Natural Science Foundation of China (Project No.: 51278057).