
Abstract
In summer season, temperature of solar panels increases thereby decreases the working efficiencies of the solar cells by a larger factor, sometime even up to 3–4%. The present research paper reports a carbon-based porous thermal cooling layer, which acts as a heat dissipating agent beneath the poly-crystalline silicon solar cell. The thermal cooling layer has highly porous structure with average interpore and intrapore size to be 6 µm–0.6 µm and 11.5 Å, respectively, which enhances the surface area (798.35 m2/g) and generates numbers of air channels within the sheet for higher heat dissipation. Thermal cooling layer’s thickness-dependent studies confirm that an optimum thickness of 14 mm shows the highest cooling efficiency. The thermal cooling layer beneath the solar cell decreases the working temperature of the cell up to 18.5°C. The open-circuit voltage recorded for the solar cell (with optimized thickness of thermal cooling layer beneath the cell) increases to 0.56 V from 0.52 V (device without thermal cooling layer) at real time condition, which leads to increase the working efficiency of the cell by 9.6%. The theoretically calculated and experimentally measured efficiency of the solar cell at various temperatures are compared and shows good agreement between experimental data and theory. This investigation reveals that the used thermal cooling layer can significantly improve the device working efficiency in a simple and cost-effective manner.
Keywords
Introduction
Solar cells directly convert the solar radiation into electricity and become one of the most popular renewable energy products, therefore, globally advocated in household and commercial appliances. The solar cells absorb most of the incident solar irradiance but only 13–20% of that is converted into electricity. 1 The remaining irradiance converts into heat due to various factors such as absorption of sunlight by the photovoltaic (PV) module in regions which are not covered by solar cells, absorption of low energy (infrared) photons, the packing density of the solar cells, etc. 2 This increases the temperature of the cells during their operation. Solar cells give maximum output efficiency during the peak of the sun, but at the same time, the temperature of the cell increases significantly. This increase in temperature enhances the photo-generation rate leading to increase in reverse saturation current, thereby decreasing the cell voltage by about 2.2 mV/°C rise in temperature of the device. 3 It is well understood that open-circuit voltage (Voc) decreases with increase in solar cell temperature (T), whereas short-circuit current (Isc) slightly increases with increasing temperature;4–11 hence, both fill factor (FF) and cell efficiency (η) decreases (mainly due to decrease in Voc) with increase in the working cell temperature. For silicon solar cells, the efficiency decreases by 0.45–0.5% for every degree rise in temperature.12–14 Therefore, it is advantageous to apply artificial cooling to PV solar cells for the improvement in output power to obtain the best working efficiency of the devices even in extreme summer. 15 Various methods, such as hybrid PV/thermal, 16 micro channel, 17 thermo-electric, 18 cooling using heat pipe, 19 ground coupled central panel (GC-CPCS), 20 ground-coupled heat exchanger, 21 mist water, 22 PV panel cooling using phase change material (PCM) 23 etc. have been explored for the cooling of solar panels. Although these systems reduce the temperature of PV panels from 5°C to even 10°C but they are not much viable as the system becomes bulky, complex, and expensive and requires more electrical power. The reported cooling methods are based on various cooling mechanisms such as, forced convection by air in which heat transfer between the solar cell boundaries and moving air takes place through the combination of conduction and convection.24–26 Other mechanisms include forced convection by water/fluid in which water/fluid is made to run through the rear of the panels, which absorb the heat and cool down the panel. 22 Heat pipes are also used to cool down the solar cells in which heat transfer takes place from source to sink by means of evaporation and condensation of a fluid in a sealed system. 21 All the above-mentioned mechanisms are based on active cooling in which external mass transport occurs due to the action of applied force/energy. Metallic sheets or metallic fins attached to the rear surface of the panels are also used to cool down the solar panel by active and passive cooling mechanisms due to conduction and convection.24,25 Generally, in metallic heat sink, surface area is enhanced by making a fin structure which increases the convection rate and the heat dissipation rate in comparison to metal sheet, thereby cooling down the solar panel much faster than the respective metal sheet. Recently, researchers have reported passive cooling techniques to decrease the working temperature of silicon solar cells by using metallic fins with natural air convection.25,27–28 This technique also increased the complexity of the system and system became bulky and costly. Hence, a low cost, stable, efficient, thermal cooling system is required for the cooling of solar cell/panel which can reduce the increased temperature due to solar radiation and thereby increase the efficiency of solar cells.
In 2014, Fan’s group developed an effective radiative cooling technique with an ultrathin material that radiated IR heat directly back toward space without warming the atmosphere 29 and suggested that the finding could be applied to improve the efficiency of solar cells. 30 The team developed a transparent thermal material based on silica photonic crystal and reported that for a typical crystalline solar cell with an efficiency of 20%, cooling by 23°F improves its absolute cell efficiency by over 1%. Although the technique improves the efficiency of the solar cell considerably, it leads to increase in the cost of the system. Also, the large-scale production will be a problem for practical application in solar panels. In order to understand the thermal management application, Nidia et al. has reported high thermal conducting carbon foam-based heat sinks. The group reported this heat sink to be better than those of conventional heat sinks for cooling purpose. 31
Herein, we have used a highly porous carbon-based thermal cooling layer (TCL), which is simple, low cost and easy to fabricate. 32 The carbon-based porous TCL was inserted beneath the solar cell, which acts as heat dissipating agent in between the solar cell and ambient. Therefore, it can decrease the working temperature of the cell which leads to increase the working efficiency of the device. TCL’s thickness-dependent studies were carried out to optimize the thickness of the layer to obtain the best possible working efficiency of the solar cells, even in extreme summer condition along with supporting measurements.
Experimental details
Procurement of the porous carbon material and sheet
The porous carbon discs were purchased from Hindustan Unilever Limited, India. The procured discs were sliced in appropriate dimensions (3.2 × 3 cm2) and used as heat dissipating layer beneath the solar cell. The porosity and pore dimensions were investigated by scanning electron microscopy (SEM) and Brunauer–Emmett–Teller (BET) measurements in detail before the use of porous sheet as heat dissipating layer.
Characterization of the TCL
SEM and energy dispersive X-ray (EDX) analyses were performed to study the surface morphology and elemental analysis of the carbon-based porous TCL. The morphology of TCL was recorded using SEM (Zeiss EVO-18), equipped with tungsten filament (electron gun) with a working range from 1 to 30 kV and 1 to 3 A. The working distance of the samples was 8.5 mm and the image was recorded at various (low to high) magnifications to analyze the surface morphology. The elemental analysis (EDX) of the TCL was done by using Oxford Instruments' X-max attached with SEM (Zeiss EVO-18). In-depth pore analysis such as pore size, pore volume, and surface area of the TCL were done by using BET (Quantachrome Instruments version 3.01) analysis. During the experiment, the Nitrogen (N2) adsorption was carried out at temperature 77.5°K with liquid density of 0.808 cc/g. The inlet cross-sectional area and out gas temperature were 16.200 Å2 and 90°C, respectively. The thermal conductivity of TCL was measured by using Linseis instrument THB-100 Transient Hot Bridge thermal conductivity meter. The thermal conductivity of the TCL was measured by placing sensor (THB6N) between two samples having parallel plane surfaces which ensure a good contact between the sensor and our samples slabs. The thermal profile of TCL was recorded by using thermal imager (TESTO 875–1i) with the constant irradiation of 1450 W/m2 under laboratory conditions. For electrical evaluation, the I–V characteristics of the devices (without and with TCL) at standard and real time conditions were recorded by 2400-Keithley Electrometer.
Experimental setup and device fabrication
To investigate the effect of cooling layer on solar cell, an experimental setup as shown in Figure 1 has been designed and developed indigenously. The setup consists of poly-crystalline silicon (pc-Si) solar cell, halogen lamp, and digital K-type thermocouple with computer interface. Figure 1(a) and (b) shows the experimental setup for controlled device (without TCL) and the device with variable thickness of TCL beneath the pc-Si solar cell, respectively. The large area (156.25 cm2) pc-Si solar cell with efficiency of 17% at 25°C (under standard conditions-AM1.5 spectra and incident irradiance of 1000 W/m2) was provided from IndoSolar Pvt. Ltd India and cut into pieces of small area (9.6 cm2) for carrying out the experiments in laboratory conditions.
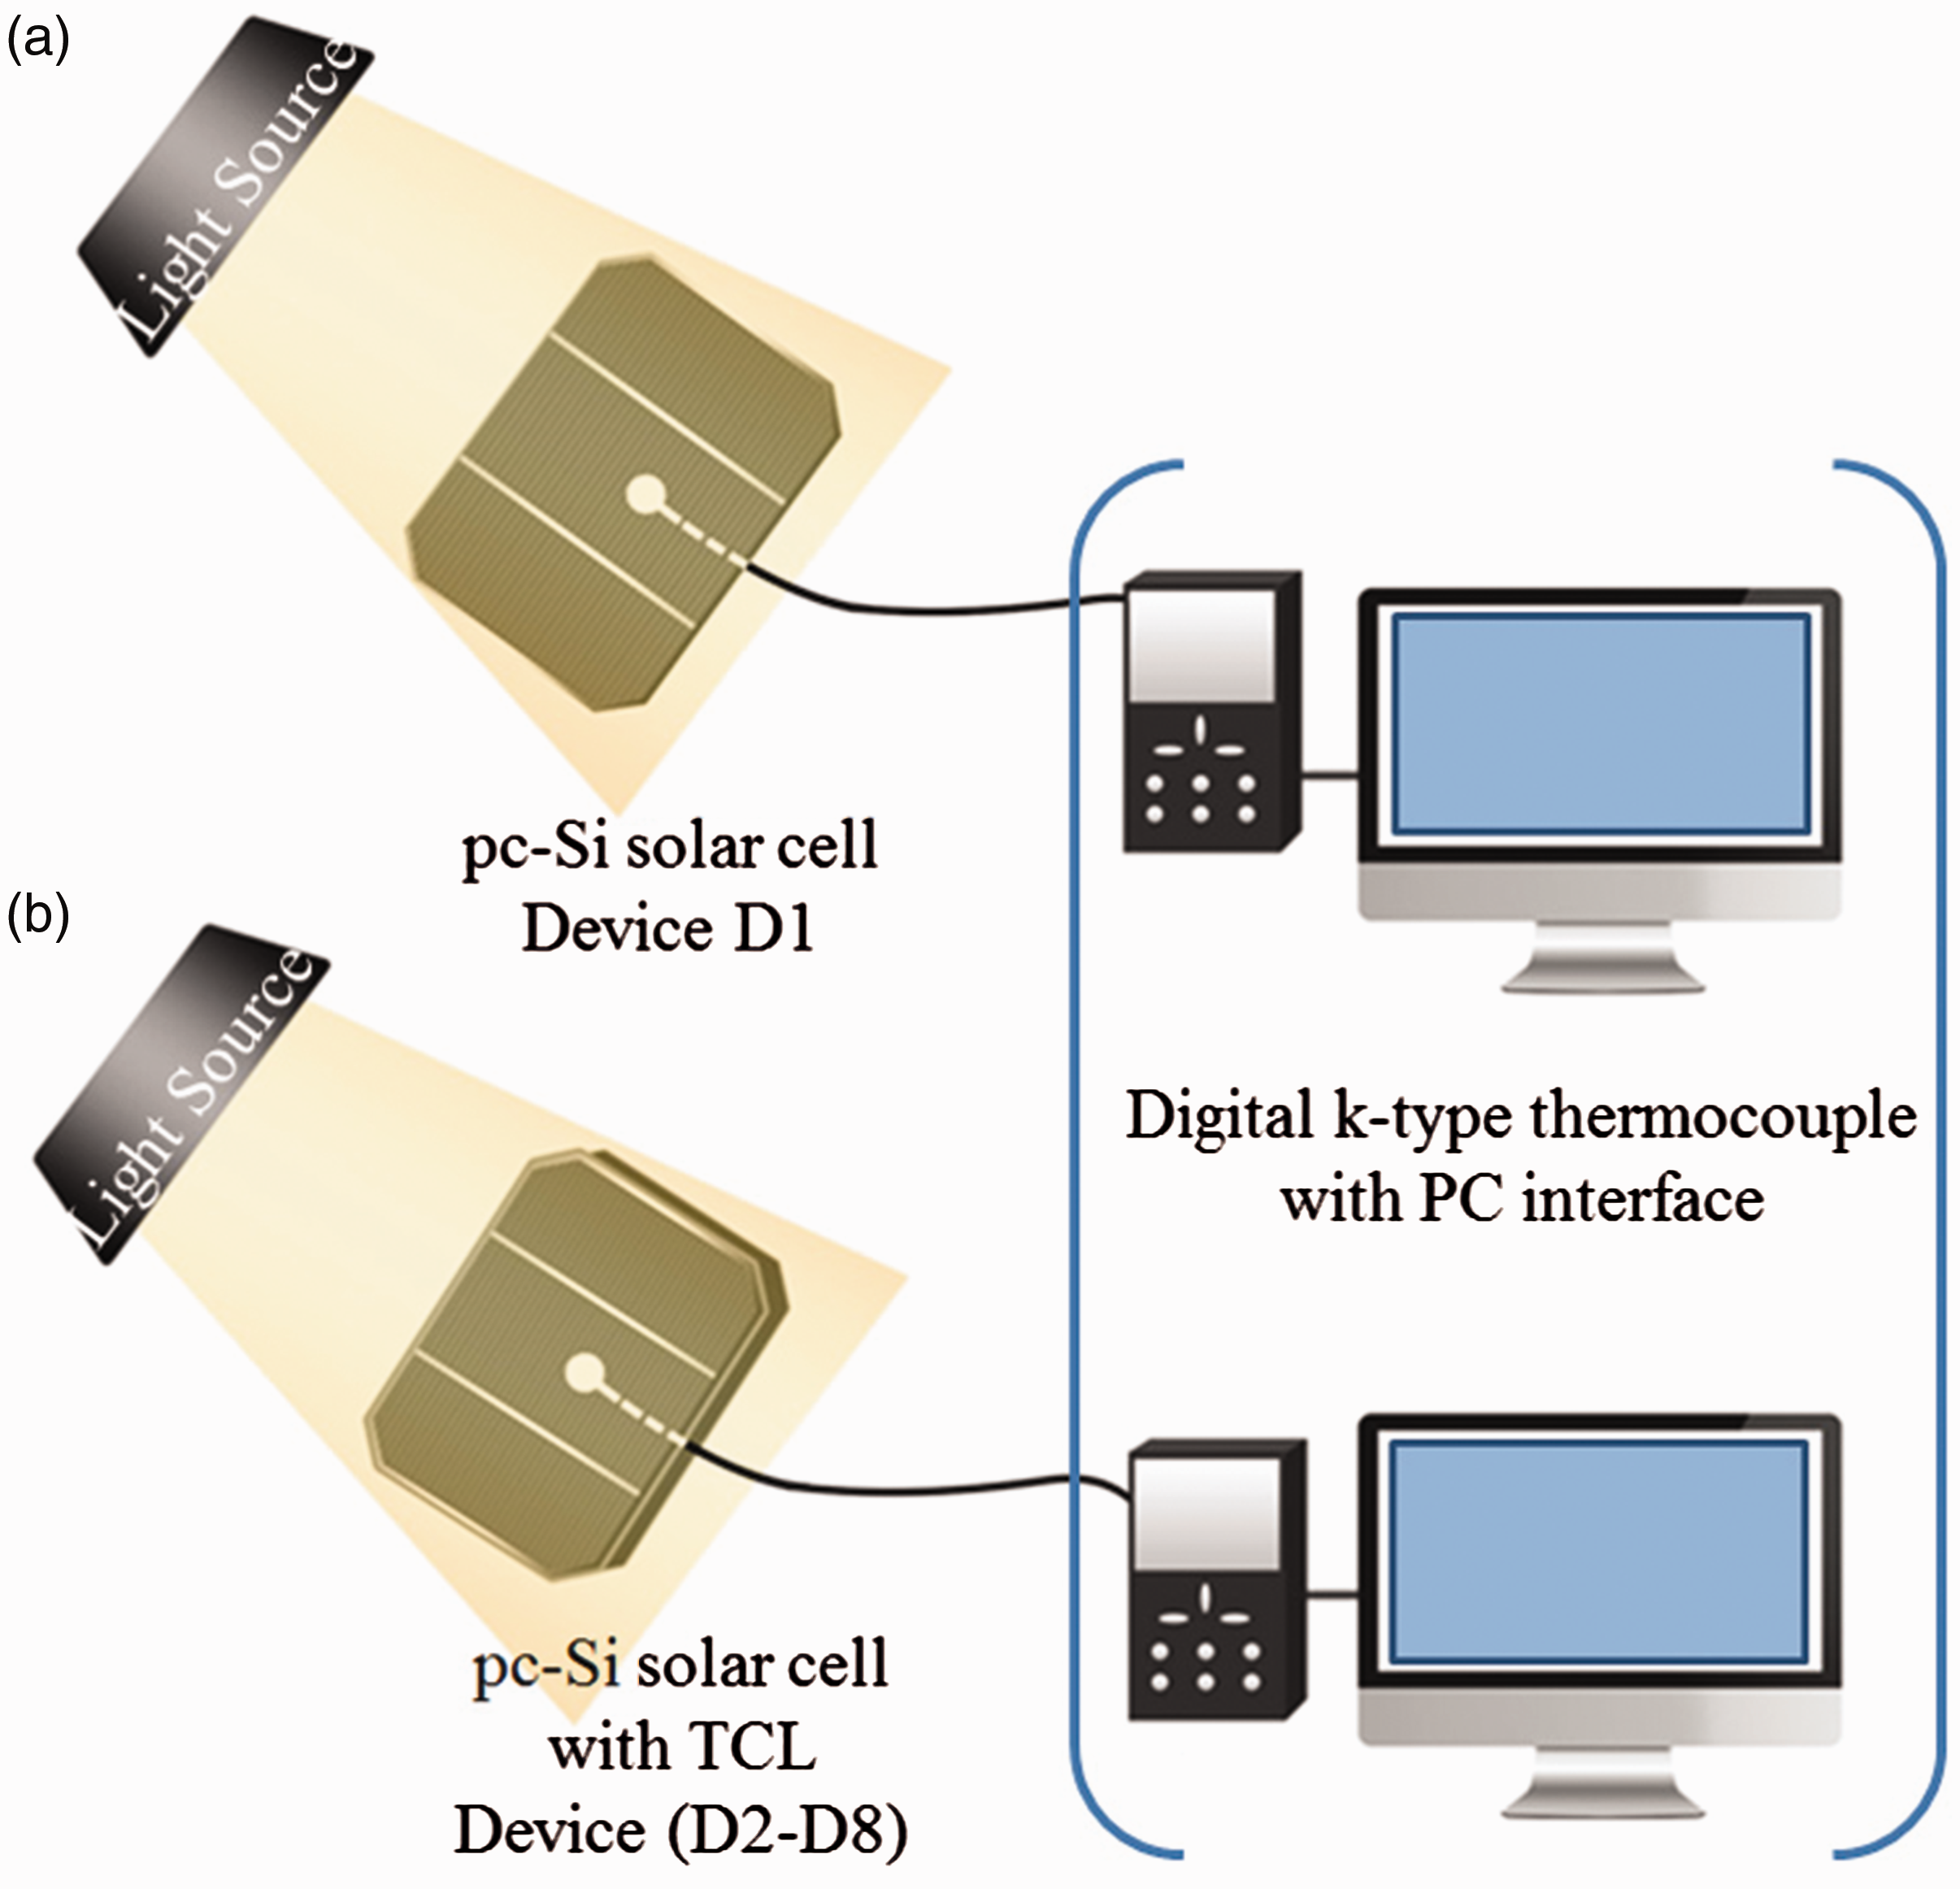
Schematic diagram of the designed experimental setup having (a) solar cell without TCL and (b) with variable thickness of TCL. TCL: thermal cooling layer.
We have fabricated eight devices with different thickness of TCL, beneath the pc-Si solar cell. For comparison, Device 1 (D1) is the control device, i.e., the device without TCL. The devices having the TCL are from D2 to D8 with 4, 8, 10, 14, 18, 22, and 26 mm thick cooling layer, respectively, beneath the pc-Si solar cell. The saturation/highest working temperature of solar cell under solar irradiance depends upon the geographical location (like, snow, and desert areas) as well as seasonal (winter and summer) conditions. Generally, in desert areas or in extreme summer of many countries, the surrounding temperature is around 55°C and the rate of heat dissipation decreases in comparison to winter or snow area. This leads to high and low saturation temperature of the solar cell in hot and cold conditions, respectively. Hence, the experiments were carried out at various intensities to generate the extreme summer condition in laboratory and all the experiments were performed under controlled laboratory conditions.
Results and discussions
Selection of the material
It is reported that metal sheets are good conductors of heat and electricity and aluminum sinks are used for cooling various electronic devices.33–35 Since the metallic fins are also used to cool down the solar PV systems by the phenomena of natural air convection,24,25 therefore an experimental study is carried out for comparing the cooling efficiency of our carbon-based porous TCL with conventional metallic fins materials (such as, copper, aluminum, etc.). In order to investigate the cooling rate of the carbon-based porous layer in relation to aluminum, copper, and mild steel, sheets of each material (14 mm thick) were heated to 90°C and then cooled down to 31°C (ambient temperature). The temperature vs. time curves of TCL, aluminum, copper, and mild steel sheets are depicted in Figure 2.

The temperature vs. time curves of cooling layer (curve A), aluminum (curve B), copper (curve C), and mild steel sheets (curve D).
The observations indicate that carbon-based porous sheet cool down with much faster rate than aluminum, copper, and mild steel sheets. The cooling rate decreased in the order of carbon-based porous sheet > aluminum sheet > copper sheet > mild steel sheet. The carbon-based porous sheet takes 8.25 min to cool down from 90°C to 31°C, while on the other hand, aluminum, copper, and mild steel sheets take 21.5, 33, and 44 min, respectively. After 10 min of commencement of the cooling, the temperatures of the porous carbon, aluminum, copper, and mild steel sheets were 29, 36, 39, and 50°C, respectively.
Surface and elemental analysis
The SEM and EDX analysis of the TCL were performed to determine the surface and elemental composition of the porous carbon and are shown in Figure 3. The SEM image (Figure 3(a)) of the layer shows sponge like surface and at higher magnification (S1(a) and (b), online supporting information) pores are visible with average pore size ranging from 0.6 to 6 µm. In EDX analysis, the selected portion of the image is shown in Figure 3(b) and the generated spectrum is depicted in Figure 3(c). The material contains 96.16% carbon, 3.39% oxygen and traces of sulfur, chlorine, and potassium. Hence, SEM and EDX analysis confirm that the material contains carbon and possesses micron-size pores.

(a and b) Scanning electron microscope images of TCL at different scale. (c) The elemental spectrum generated from the selected SEM image (shown in image (b)); inset: elements with weight and element % in form of table.
BET surface area analysis
The in-depth porosity study of TCL such as, pore size, pore volume, and surface area were done by BET surface area analysis. Figure 4(a) shows the recorded nitrogen adsorption–desorption isotherms and provide qualitative information on the adsorption mechanism and porous structure of the TCL. These isotherms (Figure 4(a)) are of type I, in accordance with the IUPA classification, which means this adsorption behavior exhibits a microporous structure of the TCL. 36 The surface area of TCL is found to be 798.35 m2/g in the BET measurement. Figure 4(b) shows the half pore width vs. differential pore volume and cumulative pore volume respectively and confirms maximum pore volume for half pore width of 10.1 Å. The average half pore width and pore volume of the TCL are calculated by using DFT method and found to be 11.5 Å and 0.402 cc/g, respectively.
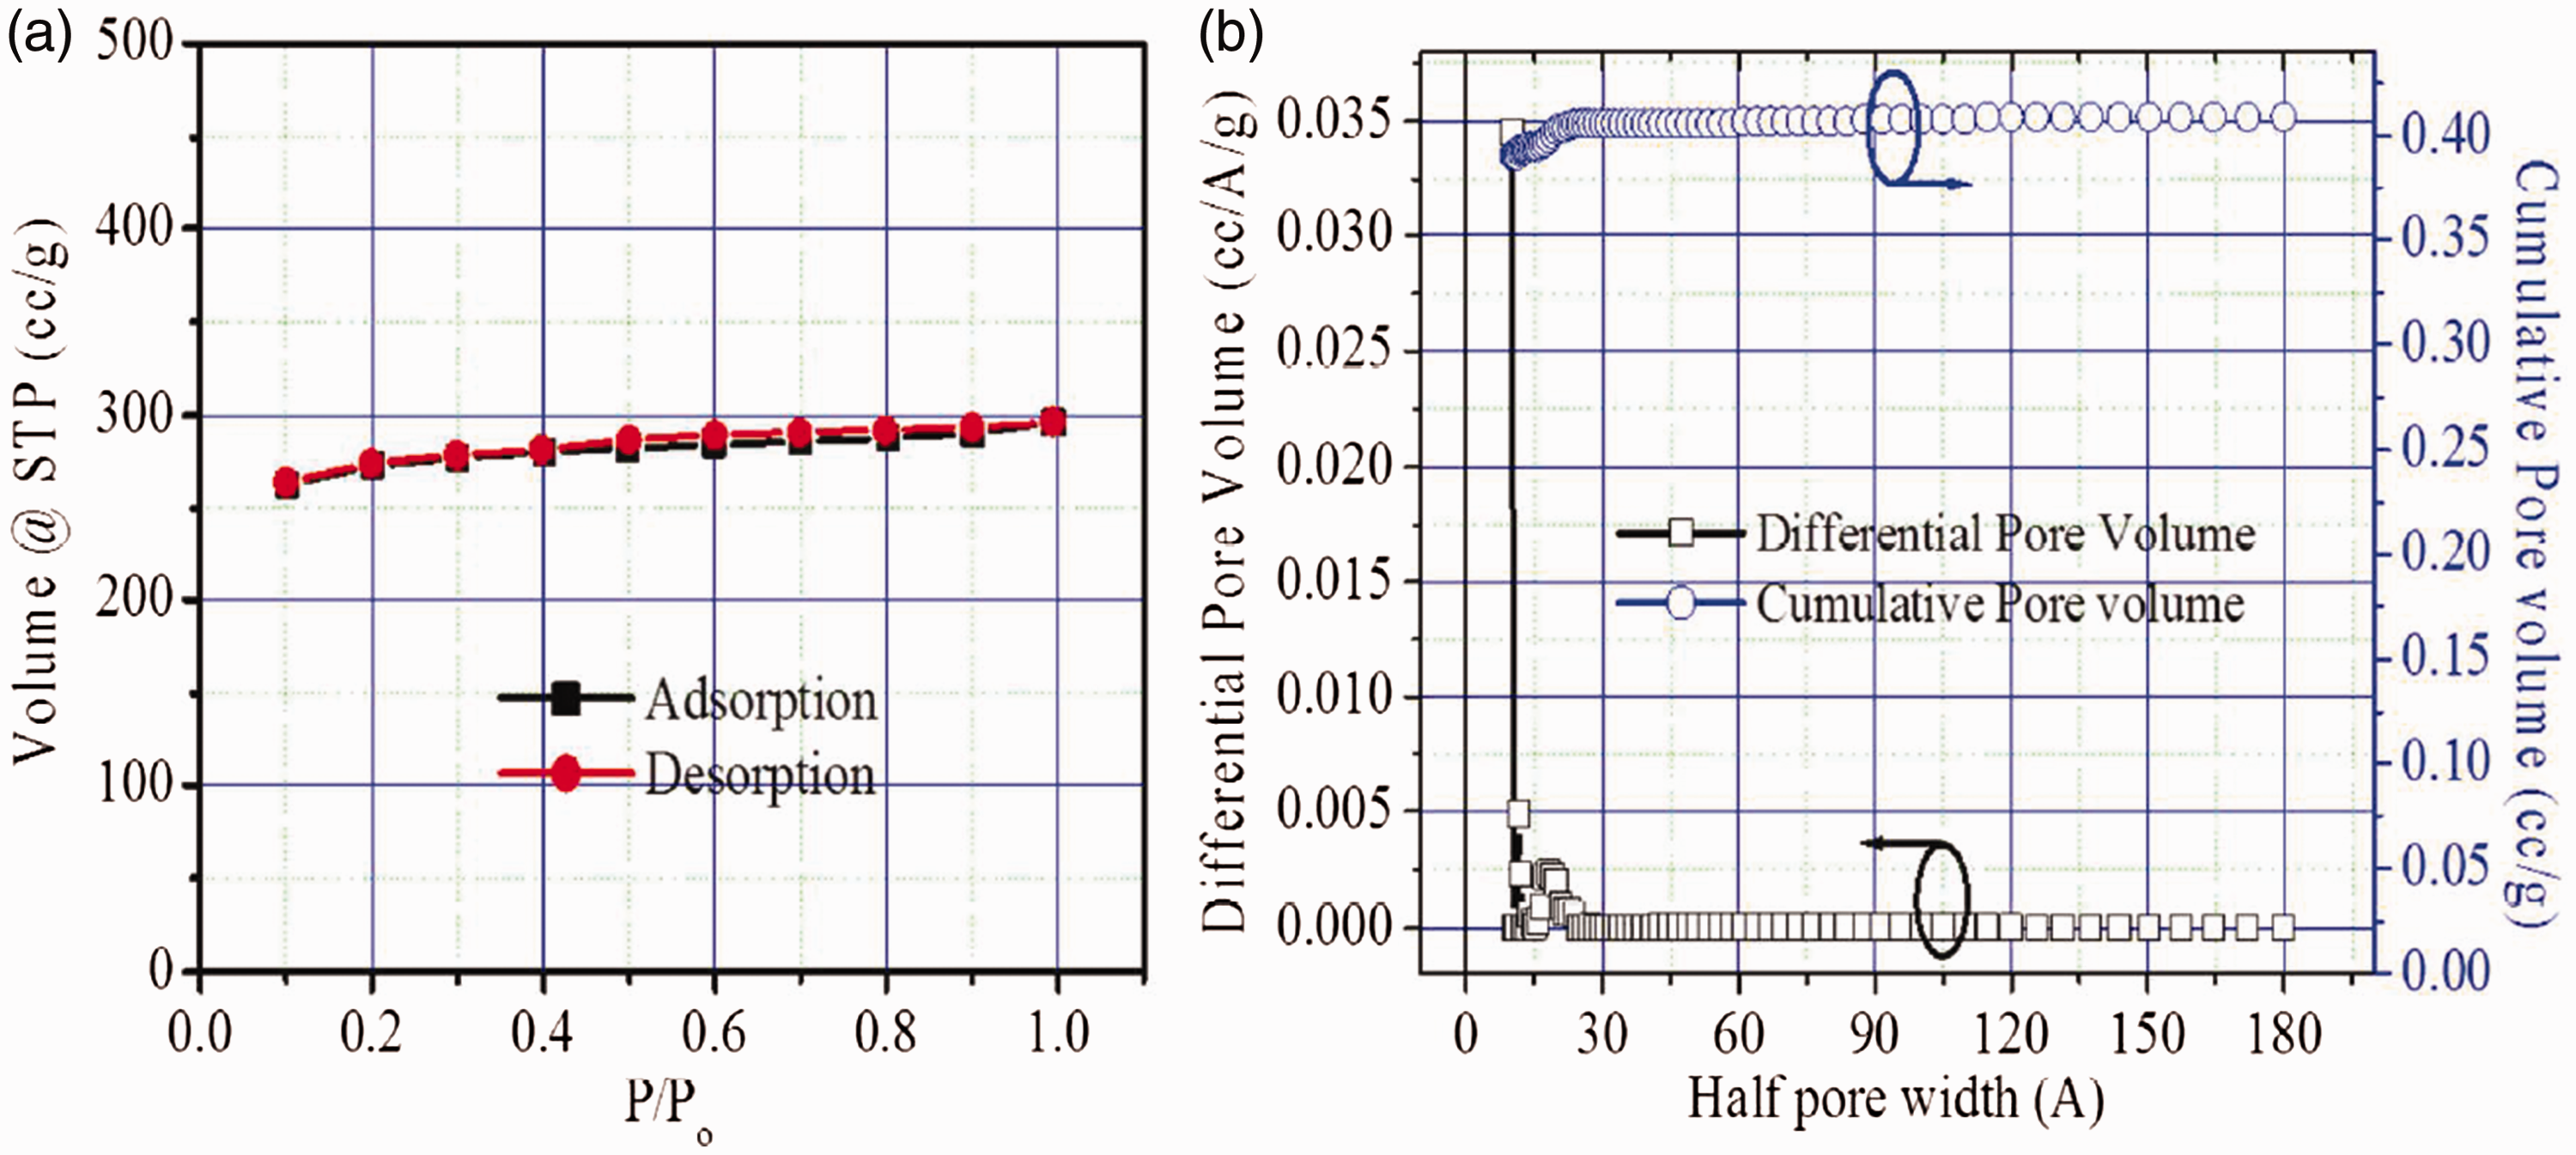
(a) Nitrogen adsorption–desorption curves of TCL; (b) pore volume and pore size distribution of TCL by DFT method.
Thermal conductivity measurement of TCL
In order to understand heat transfer characteristic of used TCL, the thermalconductivity of the TCL becomes important parameter. The thermal conductivity of used TCL sample was recorded by Linseis instrument THB-100 Transient Hot Bridge thermal conductivity meter and found to be 0.173 W/mK at room temperature. The density of the used sample is calculated and found to be 0.533 g/cc. The measured parameter suggests that TCL possess low thermal conductivity because of highly porous nature of the material.
Study of cooling effect of TCL integrated with solar cell
In order to investigate the cooling effect of TCL on pc-Si solar cell, uniform layers of TCL (with varying thickness from 4 mm to 26 mm) have been inserted beneath the pc-Si solar cell. The solar cells were continuously exposed for more than 1 h duration with constant illumination intensity (1450 W/m2) for all devices. The saturation in temperature of the cell for all the devices (D1–D8) were attained within 10–15 min, thereafter the temperature remained constant. Figure 5 shows the time-dependent operating temperature of solar cell without and with TCL (different thicknesses) at constant illumination. The saturation temperature of the controlled device (without cooling layer, D1) reaches 88°C, whereas the saturation temperature of 69.5°C was recorded for the device (D5) with optimized thickness of 14 mm TCL beneath the solar cell. The results clearly indicate that cooling effect of TCL increases upon increasing the layer thickness from 4 mm to 14 mm, resulting in decrease in saturation temperature of the device from 80.6°C to its lowest value of 69.5°C. Further increase in TCL thickness from 14 mm to 26 mm, increases the saturation temperature of the cell from 69.5°C to 83.6°C, thereby decreasing the cooling efficiency of the layer. At a thickness of 26 mm, the saturation temperature reaches close to the value obtained for D1 and confirms negligible cooling effect of TCL on solar cell. The thickness vs. temperature curves of various devices at constant time are depicted in Figure 6(a) and confirm saturation temperature behavior of all the devices (D1–D8).
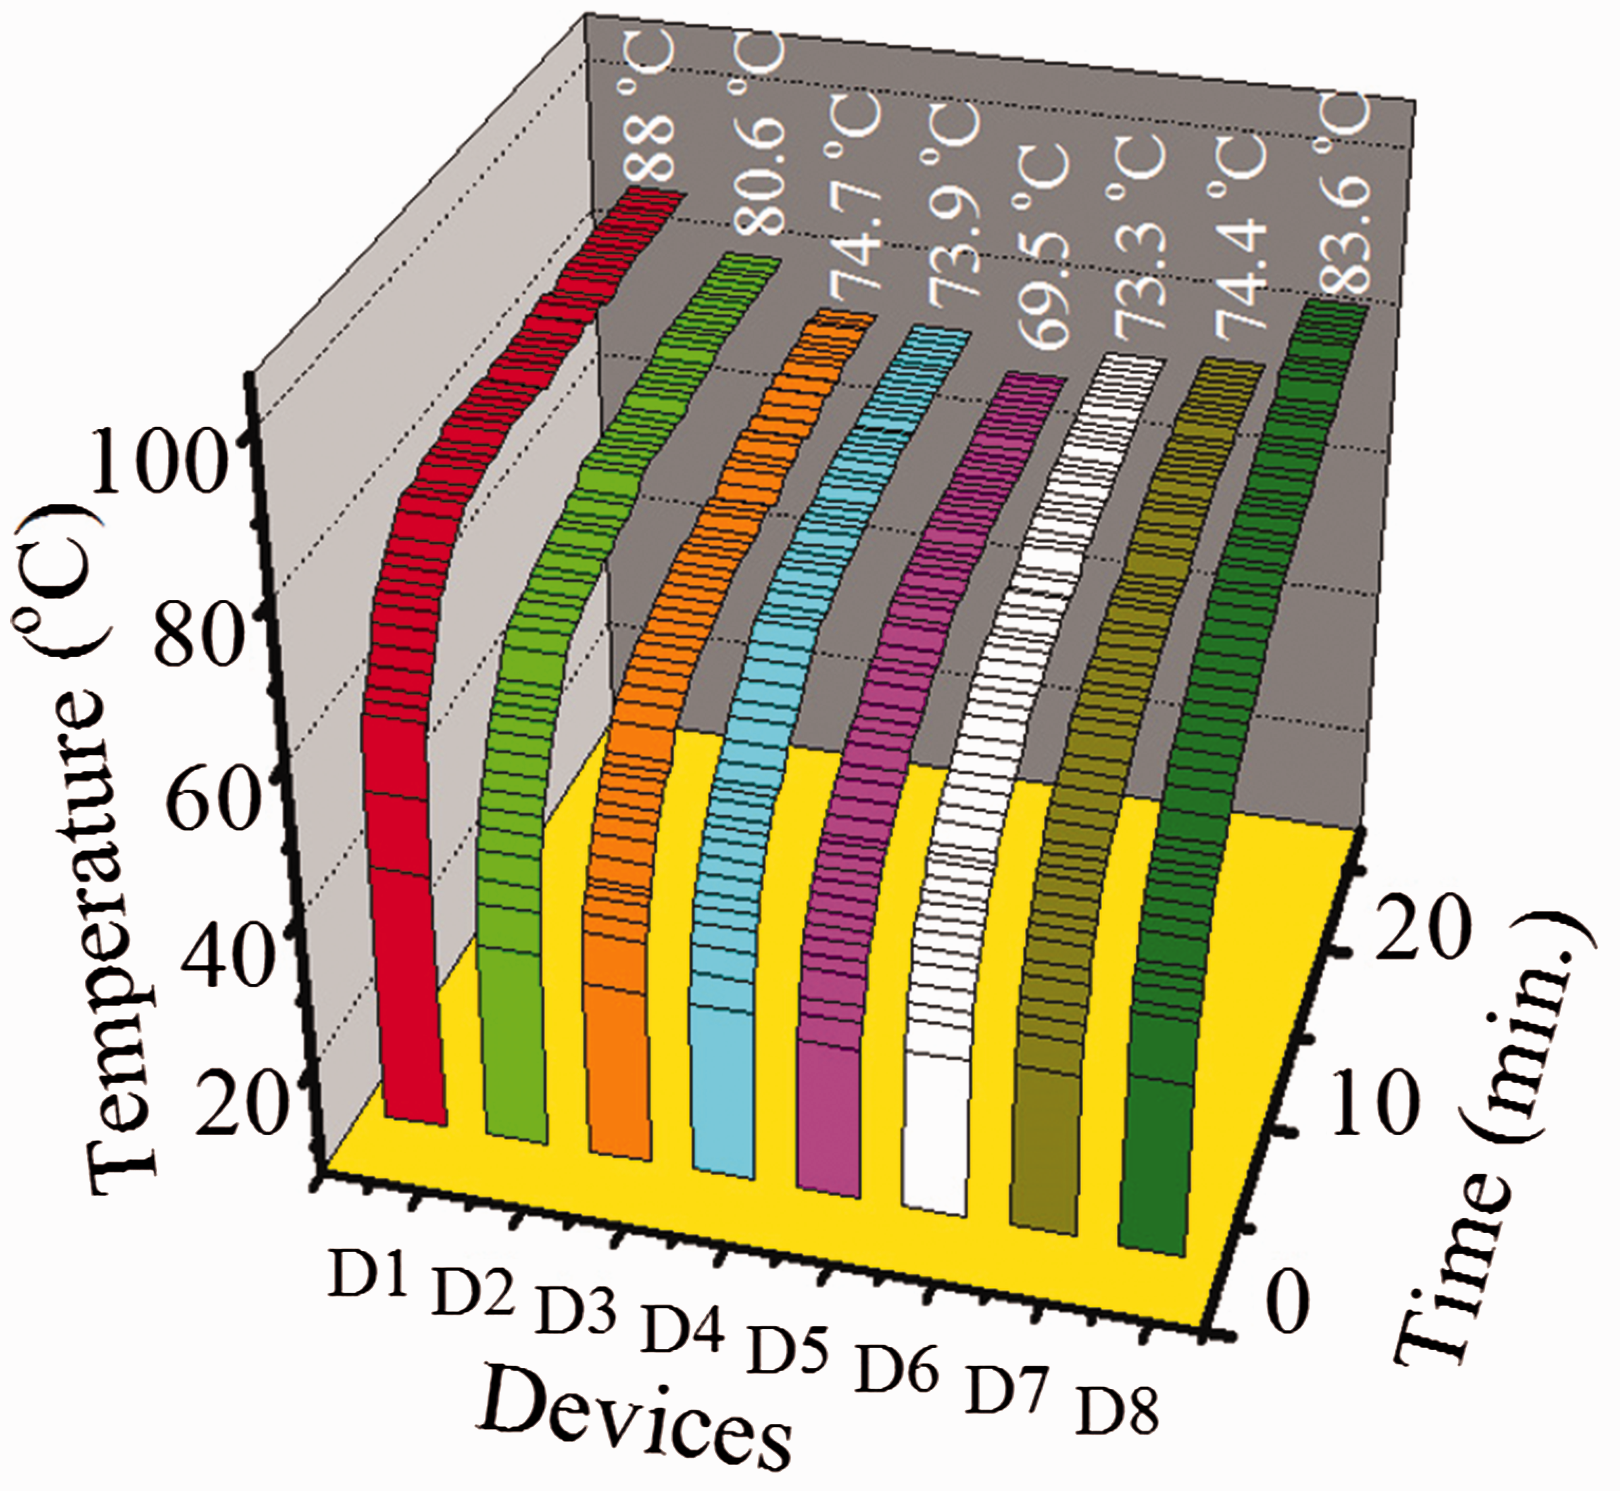
Time vs. temperature curves of all the devices without and with variable thickness of TCL beneath the cells; D1–D8 are the devices with different thickness of TCL: D1 (without TCL), D2 (4 mm), D3 (8 mm), D4 (10 mm), D5 (14 mm), D6 (18 mm), D7 (22 mm), and D8 (26 mm).
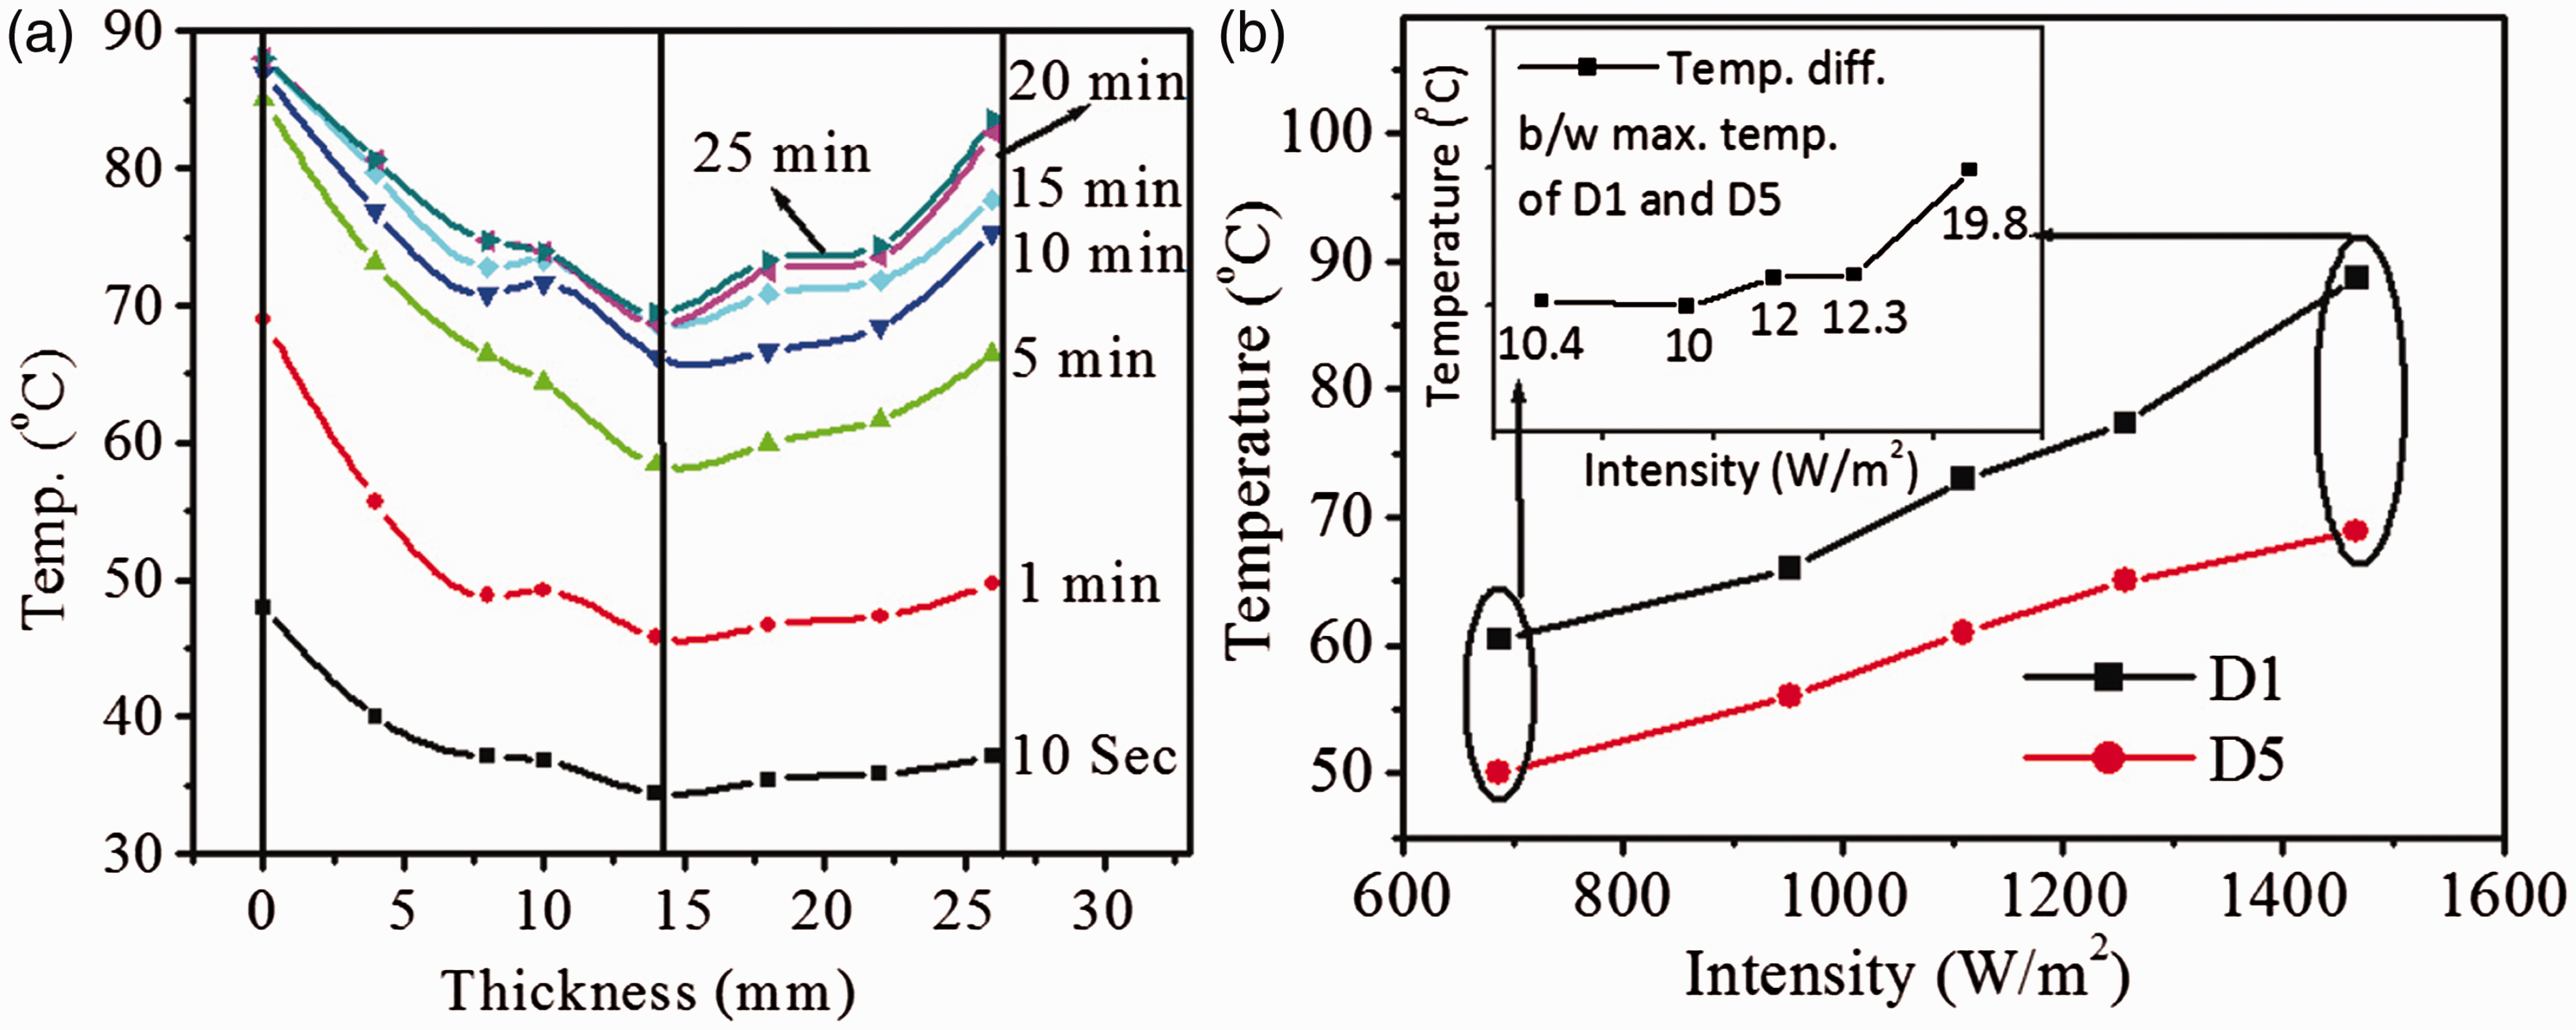
(a) Cooling layer thickness vs. temperature curves of various devices at constant time; (b) saturation temperature of D1 and D5 at various intensity; inset: temperature difference between the maximum temperature of D1 and D5.
Saturation temperatures of all the devices along with temperature difference arising due to cooling effect of TCL at 1450 W/m2 are summarized in Table 1. It is reported that the cell efficiency of pc-Si solar cell drops by about 0.5% per degree increase in temperature from 25°C onward. 6 Based on this fact, the efficiency of the solar cell was theoretically calculated as power conversion efficiency (PCE) for all the devices and the results are summarized in Table 1 along with variable saturation temperature. Hence, upon increasing the TCL thickness up to a certain value (14 mm), saturation temperature of the device decreases. On further increase in TCL thickness, increase in saturation temperature shows that an optimized TCL thickness is required to obtain the maximum cooling efficiency of the layer for field applications of Si solar cell. Time-dependent temperature curves of the devices with TCL beneath the solar cells along with controlled device are shown in Figures S2 to S8 (online supporting information). These graphs clearly show that the maximum difference in temperature (i.e., 18.5°C) is seen in online Figure S5, which is time vs. temperature curves of controlled device (D1) and device having 14 mm thick TCL beneath the solar cell (D5).
Saturation temperature and temperature difference of the devices (D1–D8) with variable thickness of cooling layer beneath the cell.
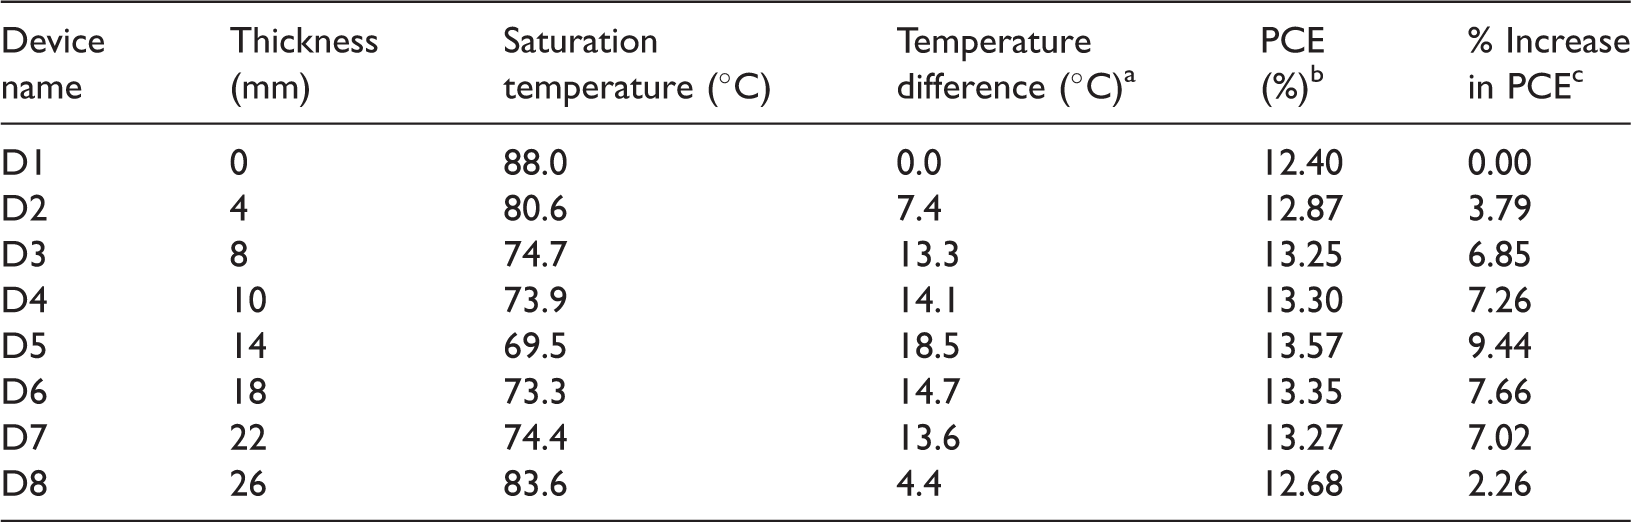
Note: Theoretically calculated PCE of the devices (D1–D8) at their saturation temperature and % increase in PCE with respect to D1.
PCE: power conversion efficiency.
aTemperature difference between the maximum temperature of controlled device and device with thermal cooling layer (variable thickness).
bPCE calculated theoretically at saturation temperature for a cell having 17% room temperature efficiency.
c% Increase in PCE of the devices w.r.t. D1.
We know that during day timing intensity of solar light does not remains constant. Therefore, we have investigated cooling efficiency of our optimized TCL beneath solar cell under variable intensity of light. The intensity (from 700 to 1450 W/m2)-dependent saturation temperature of D1 and D5 are depicted in Figure 6(b). The difference between the saturation temperature of the devices (D1 and D5) is increasing with increase in intensity. The inset of Figure 6(b) represents the difference in the working temperature of the device, which occurs due to the cooling effect of our TCL beneath the solar cell. Under laboratory conditions, we require the light intensity of 1450 W/m2 to mimic the real-time extreme hot summer temperature of solar panel.
Thermal profile of TCL
The thermal imaging of the TCL has been performed to have a better overview of the heat flow or the temperature gradient throughout the boundary of TCL beneath solar cell. The thermal image and temperature profiles with different views at steady state condition for optimized TCL beneath solar cell are shown in Figure 7. During real time experiment, it is clearly seen from Figure 7(a) (top view) that the temperature of solar cell is constant throughout its surface, i.e., 69°C. Further, Figure 7(b) and (c) shows temperature gradient across side wall and bottom view of optimized TCL integrated with solar cell. The side view of TCL clearly shows temperature gradient of 55°C to 36°C from upper to lower edge across the vertical line. Figure 7(c) shows that temperature of TCL decreases (40°C to 36°C) from center to edge of TCL at the bottom area along with temperature profile shown in inset graph.
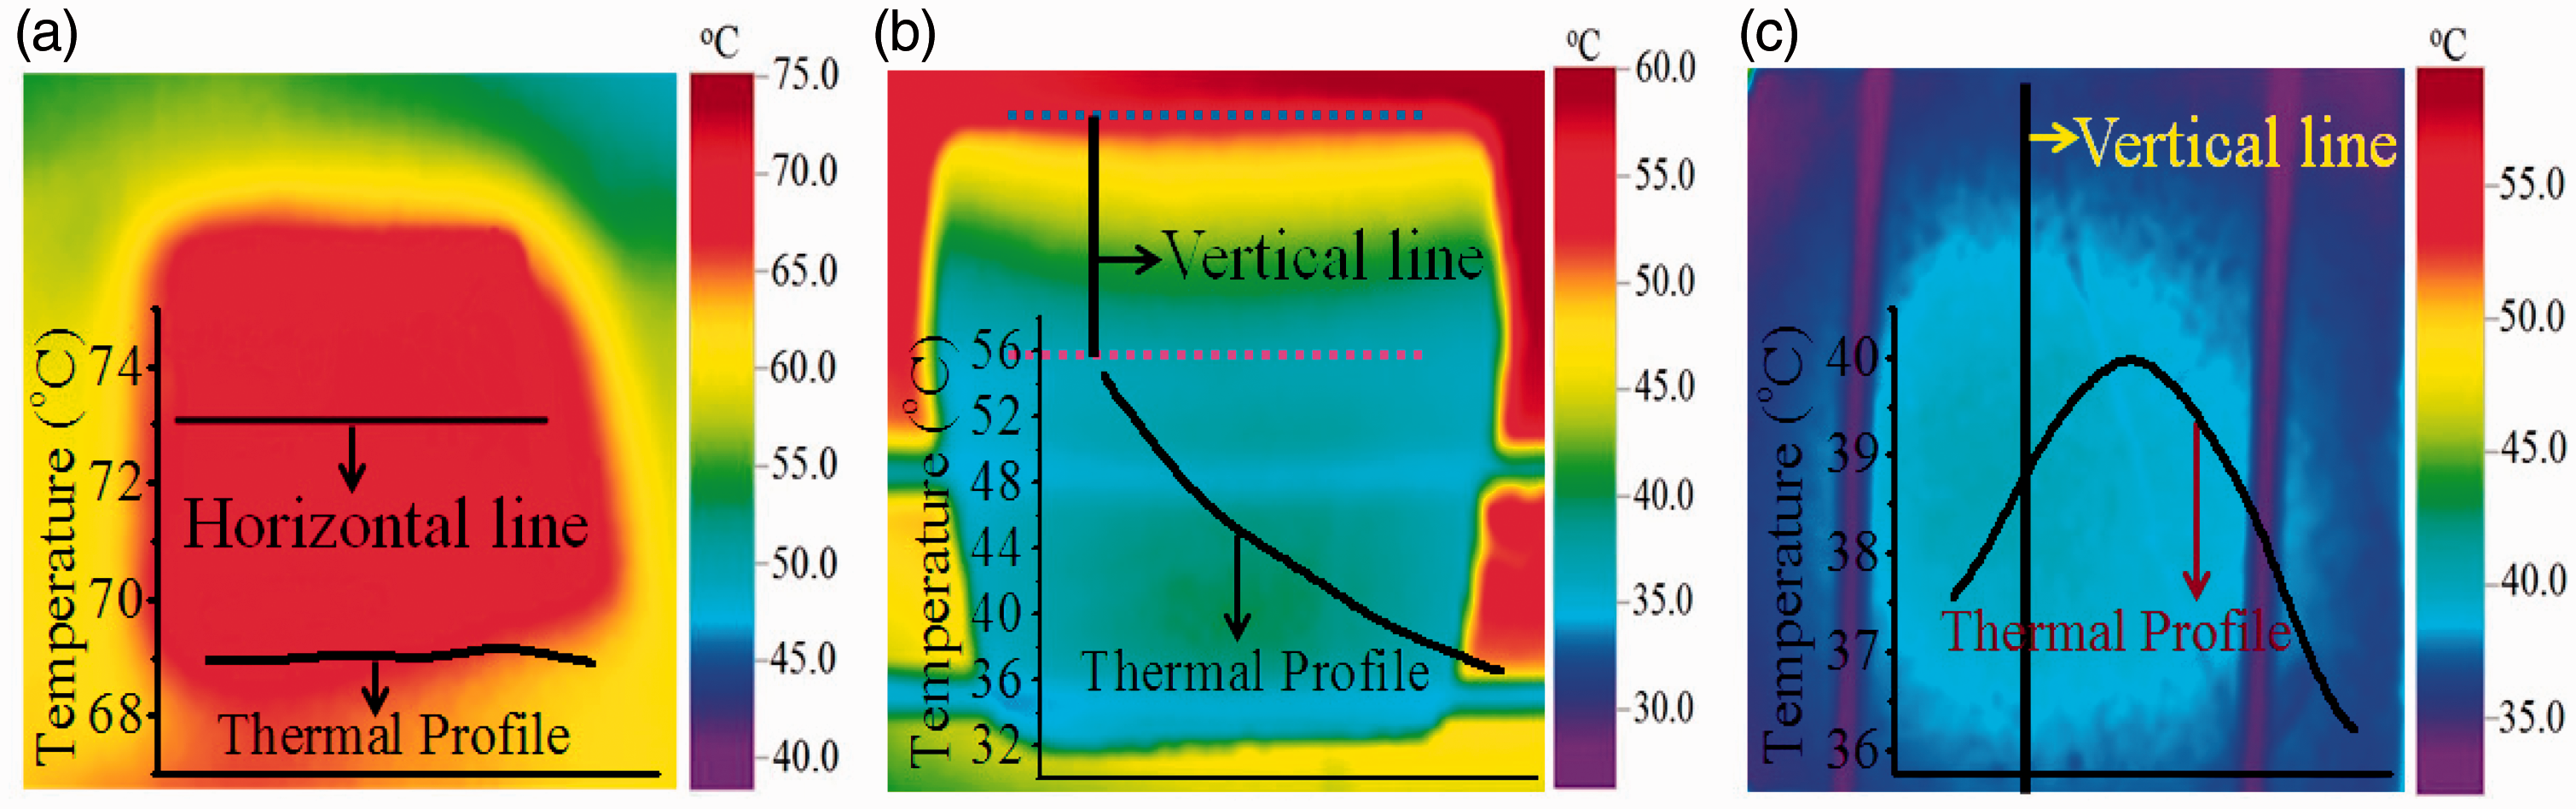
(a) Top view of thermal image of the TCL beneath solar cell; (b) side view of the TCL; (c) bottom view of TCL, with their thermal profile.
Heat transfer mechanism of TCL
As discussed, in this study, we have used highly porous carbon-based sheet beneath the solar cell, which has high absorption due to the black body effect; therefore, it increases the heat absorption from the solar cell much faster than other cooling materials, such as, aluminum, copper, mild steel, etc.37–39 This TCL has highly porous structure with average interpore and intrapore size to be 6 μm to 0.6 μm and 11.5 Å, respectively (Figures 3 and 4). This enhances the surface area (798.35 m2/g) and so generates numbers of air channels within the sheet for higher heat dissipation. Thus, investigated TCL is a porous layer in which heat dissipation is convection limited and overall thermal cooling performance of this TCL is mostly attributed to larger surface area of this porous carbon layer at steady state. The heat and mass transfer by natural convection in this porous medium occur due to the combine effect of temperature and air concentration gradients at the boundaries of TCL.37,38 In our experimental condition, the pc-Si solar cell is acting as heat source and transferring heat to the TCL from top to bottom. The thermal imaging (Figure 7(c)) of the back side of TCL confirms stream line motion of air stream within TCL at steady state. 37
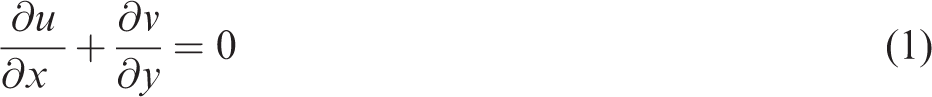
According to the Darcy model, at steady state, the air stream motion in porous medium can be explained by following equations
38
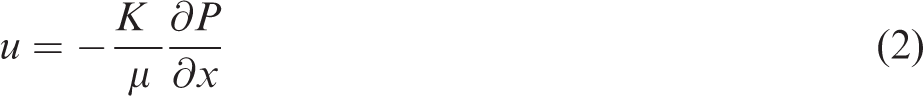

The appreciably higher temperature and concentration gradient of side faces of TCL generate sufficient pressure in x-direction and cause inward horizontal velocity (u) to the air stream moving in the porous medium (equation (2)). The upward velocity (v) of air stream additionally depends on air density and gravitational force (equation (3)) and so it is dominant over horizontal velocity (u) of air stream (equation (2)). The micro-size pores are acting as micro-channel for air stream motion and the velocity of the air stream depends on air density and gravitation force. Within these channels, there are large number of nano-size pores, which are able to increase surface area of this TCL enormously and so convection flow rate. At the boundary of TCL medium, there is significant change in temperature and concentration due to which appreciable upward pressure (causing buoyancy force) starts to exert on air stream. The air stream layers movement in porous region of TCL has inherent viscosity of the porous medium which opposes this motion. Therefore, a reaction force in the form of pressure drag starts to act within the porous medium for maintaining steady state of heat dissipation.
38
The magnitude of pressure causing buoyancy effect for displaced volume of air of magnitude ‘V’ can be given by

The air density, gravitational effects, and pressure forces are increasing with increasing thickness of TCL. When thickness of TCL is less than 14 mm (critical thickness), the higher temperature at bottom of TCL generates low air density causing lower buoyancy force. So this buoyancy force is not sufficient to dissipate heat in TCL efficiently. As we increase thickness of TCL up to critical thickness (14 mm thick TCL), the bottom surface temperature of TCL is decreasing which is increasing air density and so buoyancy force. The generated buoyancy force is able to dissipate maximum heat at critical thickness and therefore resulting into higher thermal cooling of solar cell due to increased convection flow rate. Thus, higher convection rate leads to higher velocity of air stream and resulting into higher thermal cooling effect with increase of thickness of TCL. On increasing thickness of TCL beyond critical thickness, the buoyancy force generated at the boundary layer (bottom face of TCL) is not enough to provide sufficient upward velocity of air stream in the porous medium. Now, this air stream motion has suffered higher thermal resistance from the porous medium due to appreciable increase in air stream path with increase of TCL thickness. This longer air stream passage along with insignificant upward velocity of air stream leads to increase amount of heat trap within the TCL and results into poor heat dissipation characteristic of the layer with increase of TCL thickness. Therefore, poor thermal cooling of solar cell is observed with the increase of TCL thickness beyond critical thickness (14 mm) and reached to almost no thermal cooling effect on pc-Si solar cell for 26 mm thick TCL medium.
Electrical evaluation of solar cell characteristics
In order to investigate the effect of our cooling layer on the working efficiency of the solar cell, solar cell I–V measurements were taken under standard conditions (AM1.5 and 1000 W/m2). The I–V characteristics at 1000 W/m2, without cooling layer (D1 at 69°C), and with TCL (D5 at 59°C) are depicted in Figure 8(a). Similarly, the I–V characteristics, without TCL (D1 at 88°C), and with TCL (D5 at 69.5°C) at 1450 W/m2 are presented in Figure 8(b). The temperature-dependent cell parameters, i.e., Voc, Isc, FF, and η, at various temperatures are summarized in Table 2.
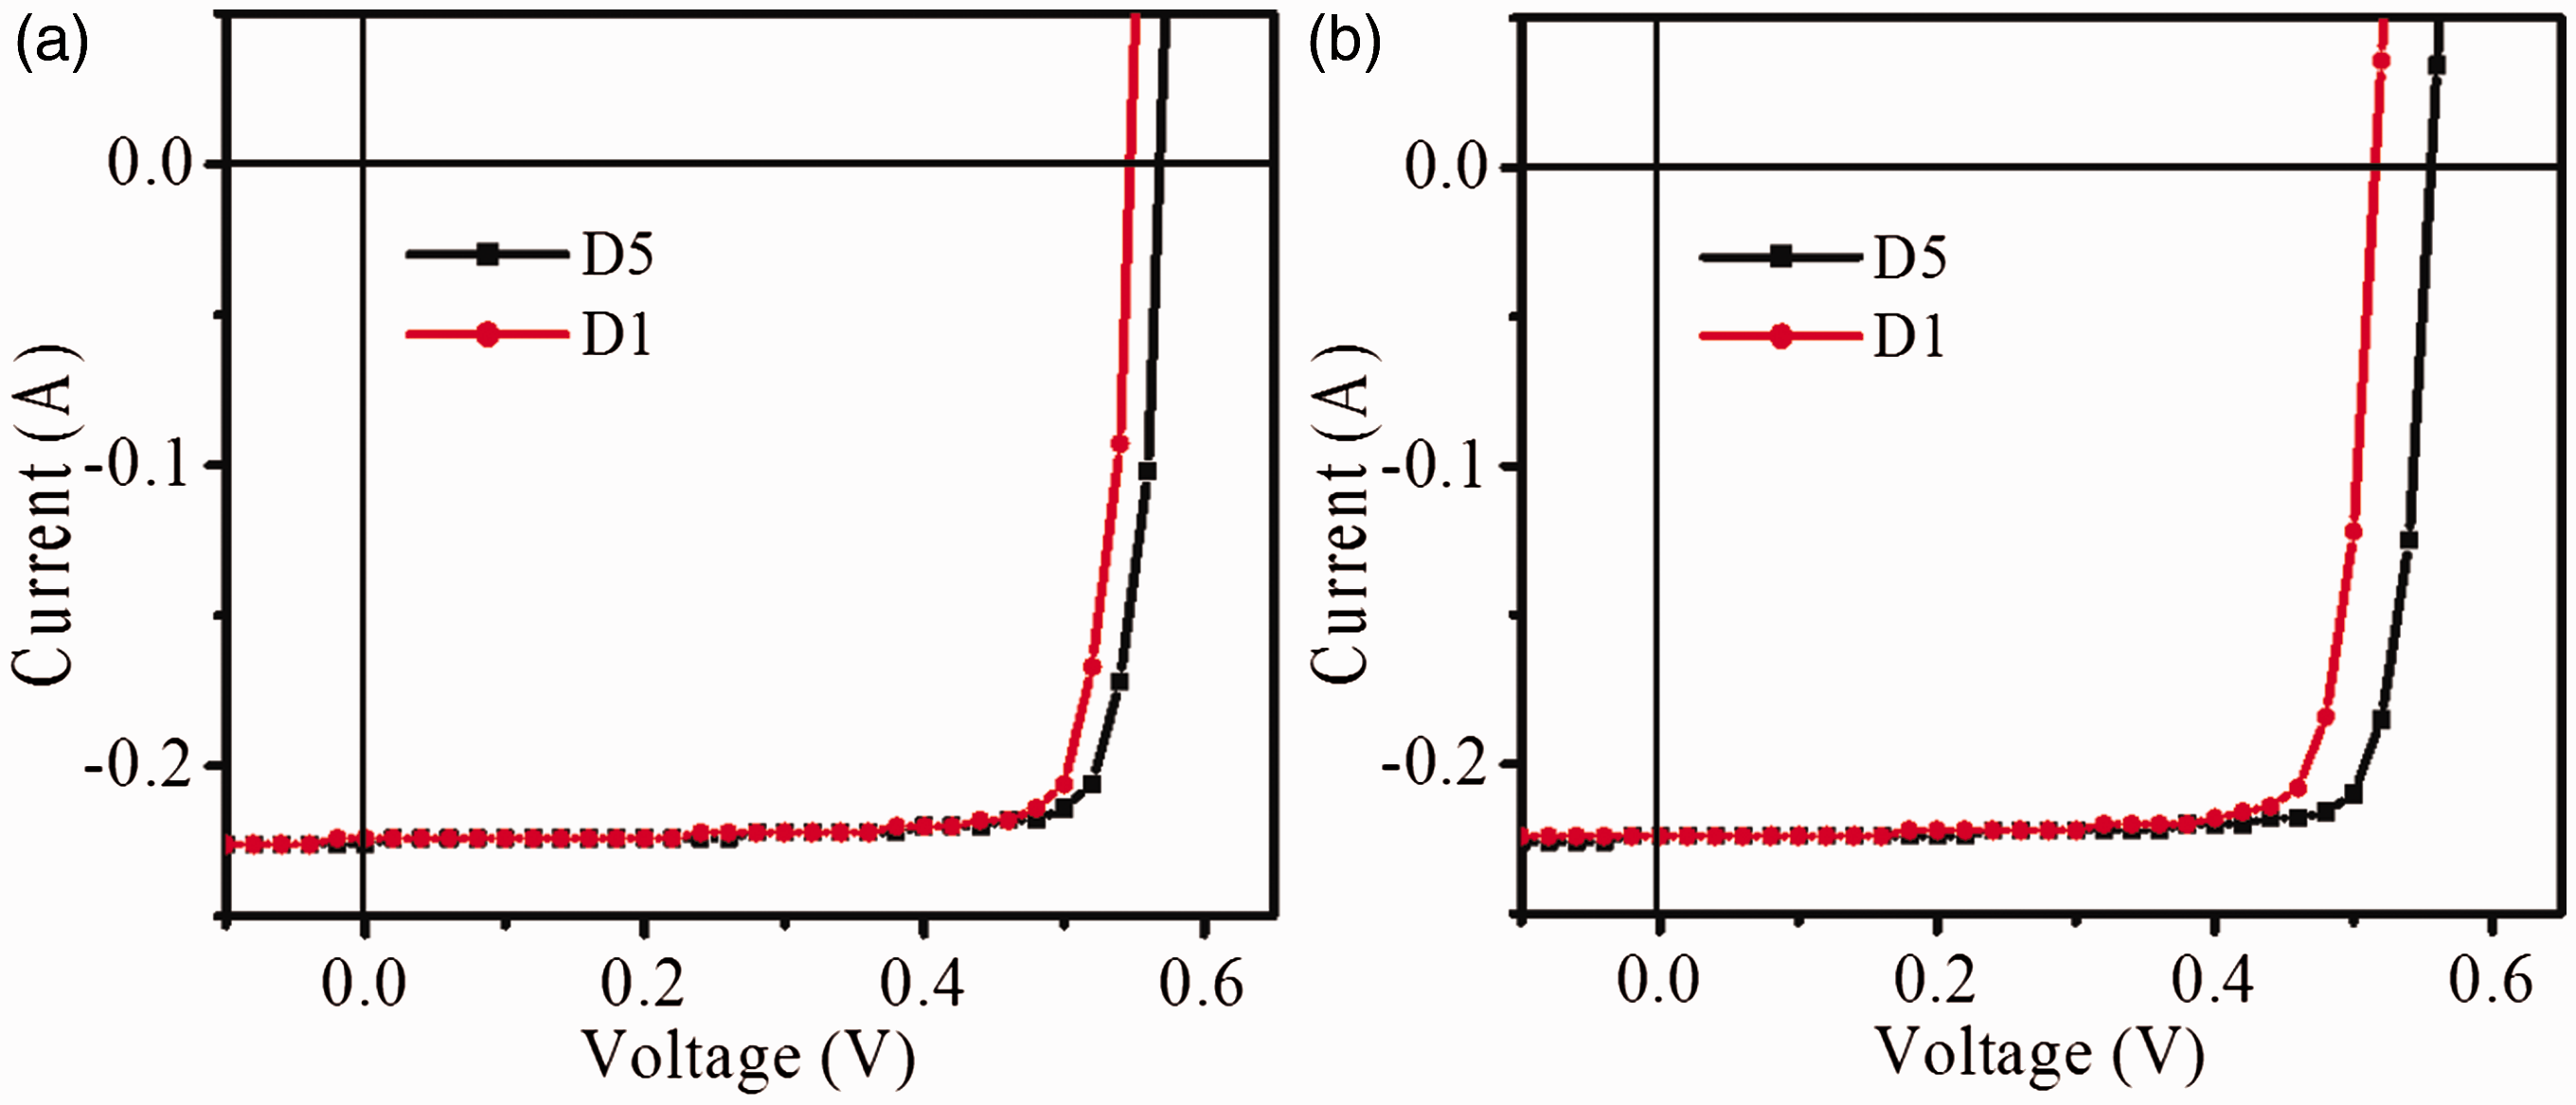
I–V characteristics of solar cell devices D1 (without TCL) and D5 (with 14 mm TCL): (a) at 1000 W/m2 irradiance and (b) at 1450 W/m2 irradiance.
Solar cell parameters of D1 (without TCL) and D5 (with 14 mm TCL) at 1000 W/m2 and 1450 W/m2 irradiance.

FF: fill factor; Voc: open-circuit voltage; Isc: short-circuit current.
Figure 8 and Table 2 depict the Voc increase from 0.56 V to 0.58 V for the device due to cooling effect of TCL with optimized thickness at 1000 W/m2 irradiance. On the other hand, the Voc of our device increase from 0.52 V to 0.56 V from D1 to D5, respectively at 1450 W/m2 irradiance. The PCE of our studied cell was 10.7% for D1 (without TCL), where the saturation temperature of the cell reaches 69°C at 1000 W/m2 irradiance. In D5 (with 14 mm TCL beneath the cell), the PCE of the cell increases to 11.18% at same irradiance, which is 4.5% higher than D1. This increase in PCE is attributed to the decrease in saturation temperature (59°C) of the solar cell with optimized TCL beneath the cell. Similarly, at 1450 W/m2 irradiance, the PCE increases from 9.96% (D1) to 10.92% (D5) which is 9.6% higher than the controlled device (D1) demonstrating the efficient cooling effect of our used TCL. The % change in efficiency of the devices (D2–D8) with respect to the standard device (D1) were also calculated theoretically and depicted in Figure 9 and are also summarized in Table 1. It is evidenced from Figure 9 and Table 1 that, the device having 14 mm thick TCL beneath the solar cell shows the least working temperature, therefore highest PCE (10.92%) which is ∼10% higher than the standard device (D1). Inset of Figure 9 shows the % change in the working efficiency of D1 (standard without TCL) and D5 (with 14 mm TCL) with respect to time at constant illumination of 1450 W/m2. The relatively lower efficiency of solar cell of area 9.6 cm2 with respect to large area (156.25 cm2) Si solar cell can be attributed to increased recombination centers, relatively higher shadow loss, contact resistance, etc.
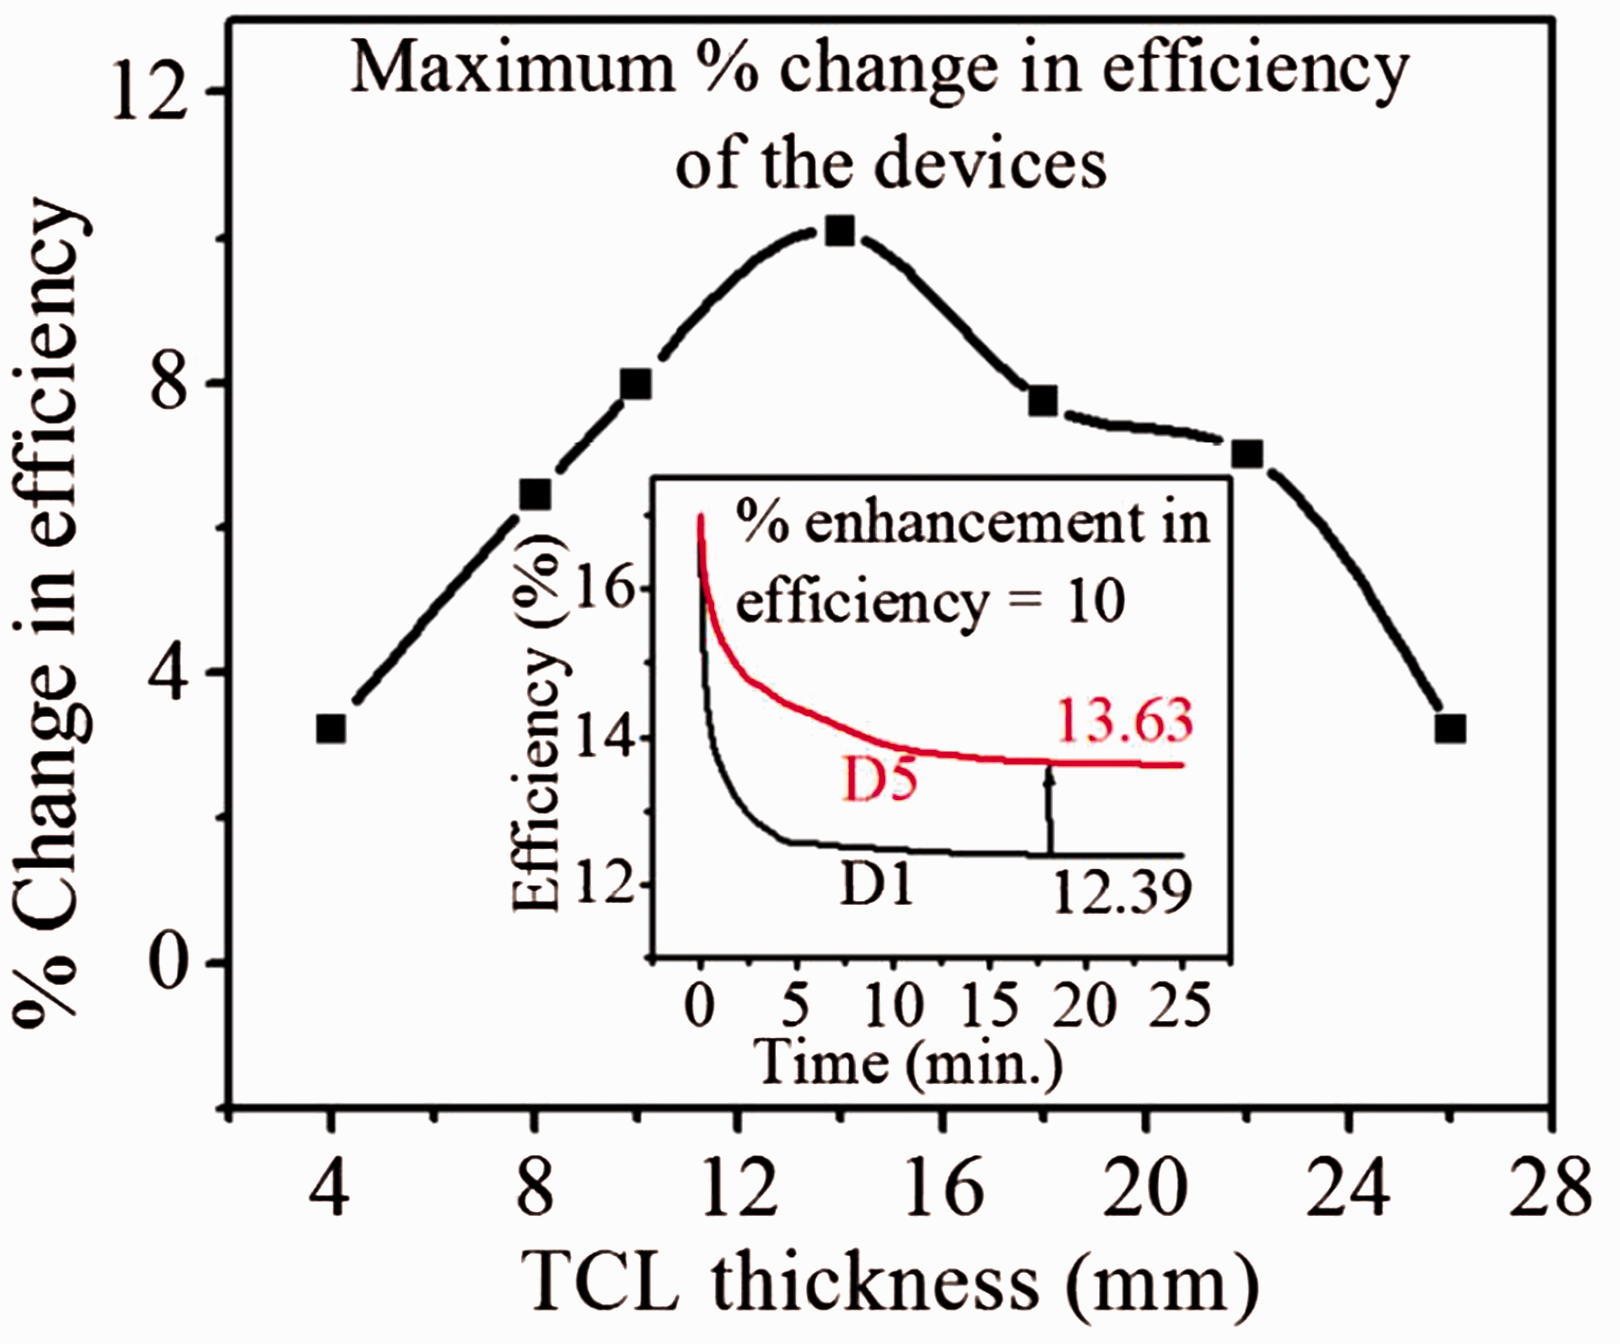
% Change in the working efficiency of the devices having variable thickness of TCL beneath the cell; inset: time vs. efficiency curve of controlled (D1) and best device (D5).
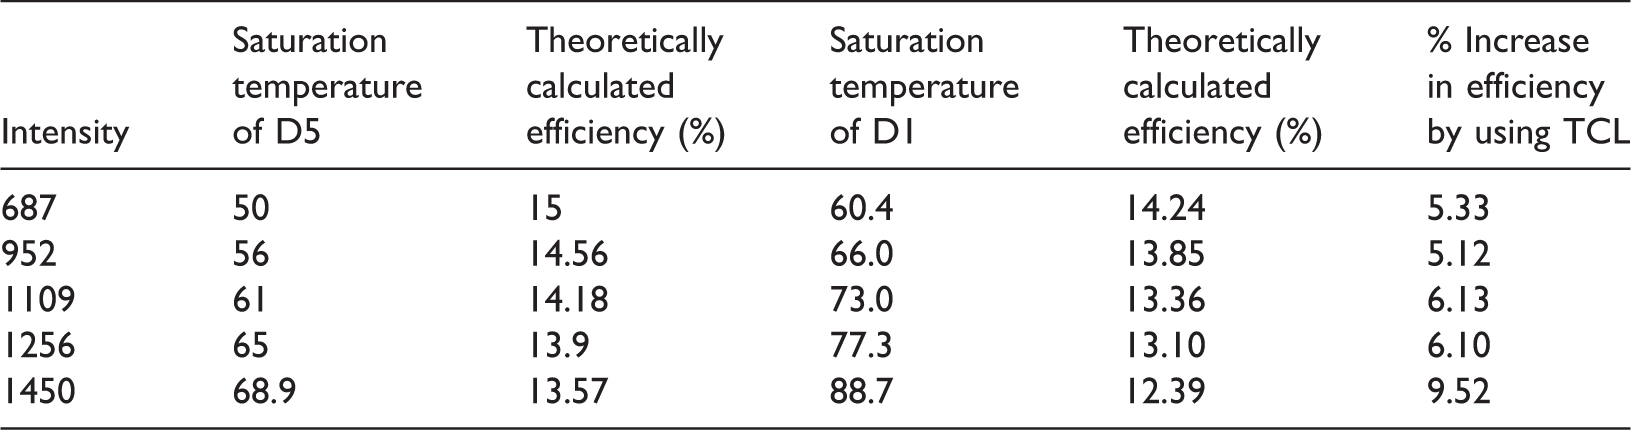
Similarly, the intensity-dependent theoretical efficiencies of D1 and D5 are also calculated for the elevated temperatures above 25°C. The saturation temperature, calculated efficiency at that temperature of D1 and D5, and % increase in efficiency by inserting the TCL beneath the solar cell are summarized in Table 3. From these calculations, we have predicted the cooling efficiency of our TCL in between 5 and 10%. The intensity-dependent % increase in theoretical PCE of the device having TCL beneath the cell with respect to the device without TCL is depicted in Figure 10. The graph demonstrates that upon increasing the intensity, the % change in PCE also increases. This is due to increase in saturation temperature difference with elevated intensity as shown in the inset of Figure 6(b). The % change in experimentally calculated efficiencies for D1 and D5 (summarized in Table 2) at standard and real-time conditions are also calculated and found to be 4.5% and 9.6%, respectively and are also shown in Figure 10. The % change in theoretical and experimental PCE shows good agreement demonstrate the potential of TCL for cooling application on solar cell and other electronic devices where output efficiency is affected by the working temperature of the devices.
Illumination intensity-dependent saturation temperature of D5 (solar cell with 14 mm thick TCL) and D1 (solar cell without TCL) and the efficiencies calculated theoretically for the saturation temperature.
TCL: thermal cooling layer.

Intensity-dependent % increase in the working efficiency (theoretically calculated from the saturation temperature of D1 and D5) of the device. Experimentally calculated values of efficiency at standard and real time conditions are shown in the form of dots to compare with theoretical value.
Conclusions
Highly porous carbon-based simple low cost, and easy to fabricate TCL has been used and its heat dissipating characteristics beneath the solar cells are studied. The layer shows much higher cooling efficiency than the metal sheets. The presented layer has the quality to reduce the working temperature of solar cells during summer, and makes solar cell to work on its higher efficiency even in extreme summers, which may be attributed to higher convection rate due to its highly porous structure. The increased Voc (0.56 V from 0.52 V) in the measured I–V characteristics of our device with optimized thickness (14 mm) of TCL demonstrate the cooling effect of TCL in the working efficiency enhancement of solar cell device, which is in good agreement with the theoretically calculated efficiencies. This carbon-based porous layer can be extended to other electronic devices to reduce their working temperature or to increase their efficiencies. Hence, the developed technique can significantly improve the device working efficiency in simple and cost-effective manner.
Footnotes
Declaration of conflicting interests
The author(s) declared no potential conflicts of interest with respect to the research, authorship, and/or publication of this article.
Funding
The author(s) received no financial support for the research, authorship, and/or publication of this article.