
Abstract
The main aim of this work is to reduce electricity consumption for consumers with an emphasis on the residential sector in periods of increased demand. Efforts are focused on creating a methodology in order to statistically analyse energy demand data and come up with forecasting methodology/pattern that will allow end-users to organize their consumption. This research presents an evaluation of potential Demand Response programmes in Greek households, in a real-time pricing market model through the use of a forecasting methodology. Long-term Demand Side Management programs or Demand Response strategies allow end-users to control their consumption based on the bidirectional communication with the system operator, improving not only the efficiency of the system but more importantly, the residential sector-associated costs from the end-users’ side. The demand load data were analysed and categorised in order to form profiles and better understand the consumption patterns. Different methods were tested in order to come up with the optimal result. The Auto Regressive Integrated Moving Average modelling methodology was selected in order to ensure forecasts production on load demand with the maximum accuracy.
Keywords
Introduction
Energy demand and electricity markets
In most electricity markets, end-users charged either to fixed retail prices or on a time-of-use (ToU) rates based on of their electricity demand. Resent increases in electricity prices provide the chance to end-users to have a discount on their electricity bills by using energy in periods with lower demand and reducing electricity consumption when there are high energy prices. At the same time, Renewable energy sources (RES) integration can be maximized, overall electricity generation costs can be reduced – which in the short term can be seen in the marginal price development – which could also lead in reduced greenhouse gas emissions. 1
Demand cannot be controlled and varies with season, day and time. Peak demand periods exist when demand surpasses electricity production. Within this period, grid instability issues can be developed, system faults and in several cases even blackouts, all hard to be handled for the system operator or the independent power producer. Various Demand Response (DR) strategies have been developed to differentiate electricity usage at peak times. 2
Electricity market is highly affected by weather fluctuations, since loads are correlated to air temperature levels. A number of studies have been made investigating the influence of ambient air temperature on electrical energy consumption. However, other relative variables, such as solar irradiation, wind speed, humidity, clearness index, cloudiness, rainfall or even economic parameters such as income, energy prices, gross domestic product (GDP), variables used in cases by other researchers aiming at excessive statistical analyses focused on electricity demand. The application of DSM techniques is responsible for altering the electricity exchange market environment. The use of load control on a regular basis requires the ability of control appliances to reschedule operation or the ability to avoid interruptions by using storage, in some form. Therefore, DSM strategies can redistribute the load; however, this is not equal to total energy reduction. 3
In order for DR to be successful and considered as a trusted resource, an accurate measurement and verification methodology must be established. Most DR programs today use a common methodology based on the most recent or even long-term historical data in order to predict the customer's load. An adjustment factor is embodied in baseline methodologies, based on the end-user’s measurements during the day of a DR case to capture the conditions that influence a customer's demand such as the weather. In order to determine which of those methodologies produces the most accurate results and reduces systematic errors, a large number of studies have been conducted.4,5 The best baseline methodology is determined by the type of customers that are inducted in the program. End-users with demand that highly interacts with the outdoor temperature can be precisely determined using a common methodology that is based on temperature. 6 There are other customers that have stable electric demand, and their demand can be estimated using a simple averaging methodology.
DR programs can be either directly managed by utilities or by aggregator/independent SMEs or individual consultants. Only a decade ago, utilities have administered end-users DR (if any) or load programs directly with their customers. In the most recent years, new administration models were put into force allowed to merge DR programmes to participate in the operator’s energy mix. Utilities are increasingly subcontracting aggregators or specialized SMEs for offering DR options to residential consumers. This type of market participants that represent DR resources in the market place was firstly introduced in the market in the early 2000 by system operators in the US (PJM, independent system operator (ISO) New England and the New York Independent System Operator).
In another research, 7 the development of DR program assisting end-users to proactively manage AC peak electricity loads was developed. Similar studies were also found in the literature focused on autonomous buildings and isolated grids.8,9
Based on the assumption that end-users are unwilling or unable to alter their electricity consumer behaviour, operation and management supply side draws more attention than the demand, in most traditional power systems. As a result, there are higher generation expenses for the operator coming from the operation of expensive conventional plants committed to contribute only at peak times (demand is usually met by lower cost base load units, during off-peak periods). Since, wholesale prices are fluctuating within the same day, it does not need to stress further the importance of improving the connection between generation and demand.
DR programs
Possible benefits from DR programs can fall under four categories: end-users, electricity market, reliability, market performance.
The end-users can expect savings in their bills, in practice, only if they constrain their consumption when they are told so (e.g. peak periods). In some occasions, end-users may have savings even if they follow the same consumption behaviour, but in these cases, their average demand during high price peak periods is often lower than their class average. 10 Additionally, some end-users might increase their total electricity consumption without having to pay more if they operate more off peak.
As far as the electricity market DR programs, they could provide an overall electricity price reduction due to the fact, the infrastructure is been utilised in a more effective way (avoiding expensive conventional units). All in all, since DR programs are able to optimize operations based on the bidirectional relation between supply and demand, there is an avoidance of distribution and transmission infrastructure costs, regarding maintenance or services, something which can be reflected in the electricity prices of for all the end-users. 11
The reliability benefits affect all market participants. In fact, by offering a comprehensive DR program, end-users have the chance to assist the system operator lessen the number of blackouts in smart grids. 12
DR programs offer the end-users more market options even when real competition in not present in the retail market. Consequently, the electricity market performance benefits. 13 End-users are able to manage their loads since they have the opportunity to affect real-time the market through the DR programs. 14 Another major improvement that DR programs offer is to minimise the reduction of price volatility in the spot market restricting the large enterprises and schemes to manipulate the market. 15
A reference regarding DR programs affection on environmental parameters has to be done. According to the US Department of Energy, 16 these programs can provide better land utilisation as a result of avoidance of unneeded new electricity plants. Furthermore, the reduction of natural resources consumption will lead, on the long-term to improvements on air and water quality.
End-users such as residential consumers and SMEs purchase electricity from a retailer in the majority of electricity markets. These end-users are usually billed either based on fixed retail prices or on a ToU-based rates. There are customers receive higher bills during peak times than during off-peak period. Therefore, at times, there are no real incentives for end-users to act according different offered electricity prices. 17
In order for the ISO to be able to include directly customers to participate in the grid operation, advanced metering infrastructure (AMI) combined with some standard communication protocols is considered essential. 18 Smart metering systems today consist of real-time internal data acquisition system and efficient transmission of the information through networks via various wireless communication protocols.19,20 According to the information, above ISOs have the opportunity to encourage end-users to manage their consumption according to the grid condition.
If we want to categorize the various DR Programs (DRPs), we consider DRPs that are price-based Demand Response Programs (PBDRPs) and incentive-based Demand Response Programs (IBDRPs).These programs are put in practice by many ISOs.1,21–23 In the case of the DRPs, the electricity price – which is fluctuating – is broadcasted to the customers by the utility. The information about the price provided to the customers helps regulating their consumption. 24 Various steps and methodologies for implementing different price-based programs are described by Mathieu et al., 25 while Ozturk et al. 26 investigate the effects of DR in load prediction and the price uncertainty.
A research conducted by Zhou et al. 27 demonstrated that under a stable operation of a micro-grid, a battery energy storage system can be sized depending on the via DR programs participation. Binary Particle Swarm Optimization and linear programming algorithms are methods that are used by Pedrasa et al. 28 and Conejo et al. 29 in order to decrease the frequency of load cutbacks required for a system.
On the contrary, Incentive-Based Programs (IBPs) through incentives persuade customers to take part in an effort decreasing their load. ISOs have the challenging task to collect money for incentive that has to be shared among the participants of IBP as far as implementing it. IBPs are divided into subcategories: Voluntary programs, Mandatory Programs and Market Clearing Programs.
In the case of Voluntary Incentive Programs, there is no penalty on the non-participating customers but the ones that participate are getting rewarded. Incentive price is designed based on analytical hierarchy process (AHP), considering the different types of end-users. Abdollahi et al. 22 state that IBPs have to be designed on the basis of the cost minimization unit commitment. There are cases where the generating units might be unwilling to take part in DR Programs, as a result of the reduced profit of the generating unit despite the decreased production cost during DR events.
End-users that participate in mandatory programs are obligated to respond to the ISOs request for managing their load consumption otherwise they face penalty. 30 Aalami in his research also proposes a load economic model that simulates end-users behaviour based on electricity price, elasticity of the demand and also on the value of incentives and penalties. According to Mathieu et al., 25 Market Clearing Programs are buyback programs, according to which, the end-users’ bids are being accepted only when the price per bid is smaller than the market clearing price. In this category, there is a new type of incentive program the coupon incentive program, where the price of coupon is the difference between the wholesale price and the flat retail rate. Only when the expected real-time wholesale price is greater than the flat retail rate, the price coupon is formed. 23
According to a previous research, 31 ToU is among the most common demand side management options. End-users are charged differently based on the time of the day they consume.
Another interesting alternative approach has been presented by Valencia-Salazar et al. 32 On their research, they present the potential of end-users to participate in short-term markets. In order to create competitive bids, an available methodology to analyse monthly energy consumptions is used. The customers take part in the markets in order to purchase their usual electricity consumption can in addition offer demand reductions in the short-term markets. In short, this means that the end-users can benefit, saving costs, from being active in daily and short-term markets. However, such a system cannot be applied in Greece, because the results taken from the research are masked and real costs cannot be revealed since in the Spanish balancing market, the real costs of the balancing process are not in line associated with the customers’ costs.
There is a gap in knowledge, though, concerning issues with the evening peaks, a period of high importance in the electricity consumption in Greek electricity market. The fact that this research emphasizes on a small station level is something that must also be taken into consideration.
This present study aims to develop DR programs available to commercial, industrial and residential end-users. For instance, when end-users participating in Peak Shaving Programs can be compensated for reducing their consumption at peak hours (e.g. for 2 h), meaning that by selecting the appropriate thermostats and following the information received regarding load and price forecasting, on a hot summer day, based on each customer’s past schedule and settings, they will allow ‘pre-cooling’ their apartment before the peak demand. Through direct customer participation in the program, the demand for electricity is firstly monitored and reduced when there is need for the system.
Methodology
The methodology followed was based in an analysis of an independent grid as a case study. The study was focused on identifying the demand of an area chosen based on neural networks and time series analysis models (Auto Regressive Integrated Moving Average (ARIMA) model) aiming at achieving accurate forecasts for the next 24 h. Based on this methodology, a price forecast (€/kWh) shall be developed, aimed to reach to the customer offered by one of these DR programmes. The DR programmes shall take into account different profiles (e.g. official holidays, weekends, normal working days etc.). For the development of these programmes, different seasons (summer, spring/autumn, winter) and use of the residence (e.g. country house) or industrial usage etc. shall also be taken into account.
It is expected these programmes will be widely offered in the market as soon as the ToU usage is implemented. The flat rate price is awaited to be increased in Greece, with the electricity market liberalization and the massive integration of Renewable Energy Sources as well, and therefore, the ToU bills shall offer an alternative to the end-users. It is important to state that the whole research will have as a major target to provide a methodology to the consumers in order to manage and consequently reduce their electricity loads.
The Greek Island case study
For this research, a small typical island was chosen, located in the Aegean Sea. This island has an approximate population of 2000. During winter time, a standard number of residents live in the island. During summer, the number of residents rises due to tourism. The number of tourists living in the island during the summer is the main cause of the significant difference between the electricity demand during winter and summer.
The data in this research come from PPC's database and contain the hourly electricity consumption of the islands' residents for the entire year (8760 h) of 2011. 33 The first measurement is in 1 January 2011 at 00:00 and the final measurement in 31 December 2011 23:00. During that year, the maximum load was 2900 kW (16 August 2011) and the minimum load was 260 kW (22 May 2011).
In order to better understand and organize the data, the electricity average load of each month was calculated and displayed in Table 1.
Electricity average load demand for each month.
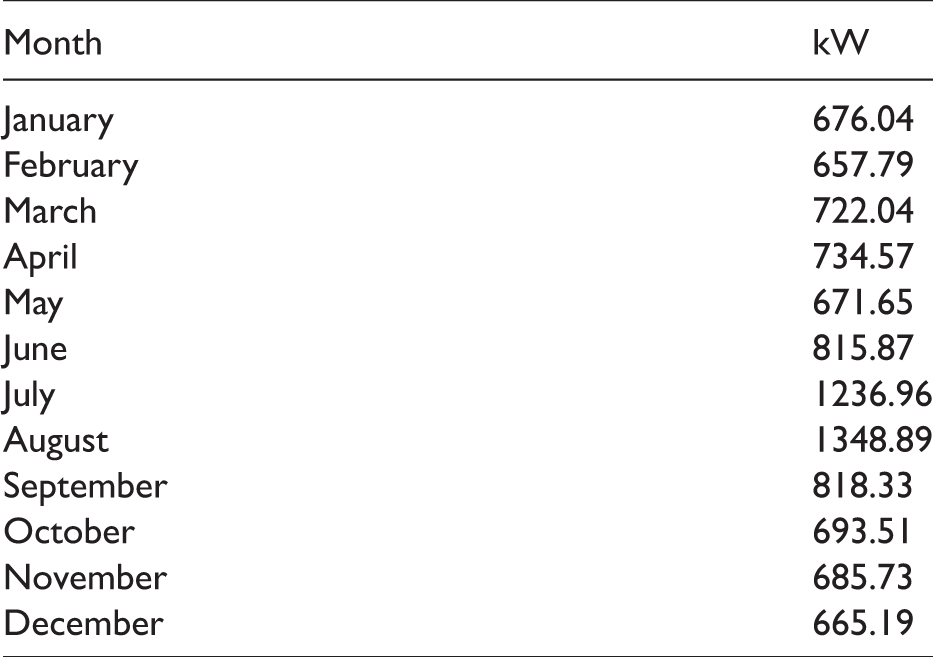
In August, the load demand reaches approx. 1350 kW, which is almost double than the average monthly load demand that the island consumes during the rest of the year. In this research, the methodology that we used in order to create the monthly demand load profiles was based on the calculation of the average price of each hour separately for every month. According to this process, 12 profiles were created one for each month of the year. These 12 profiles were grouped into four categories considering the peak demand that occurs twice during a day and the timescale.
The four categories that were chosen are:
Early autumn profile/Late winter (February, March, September and October) Spring/Early summer profile (April, May and June) Summer profile (July and August) Winter profile (November, December and January)
The four groups that the demand load profiles were categorized are illustrated in Figure 1.
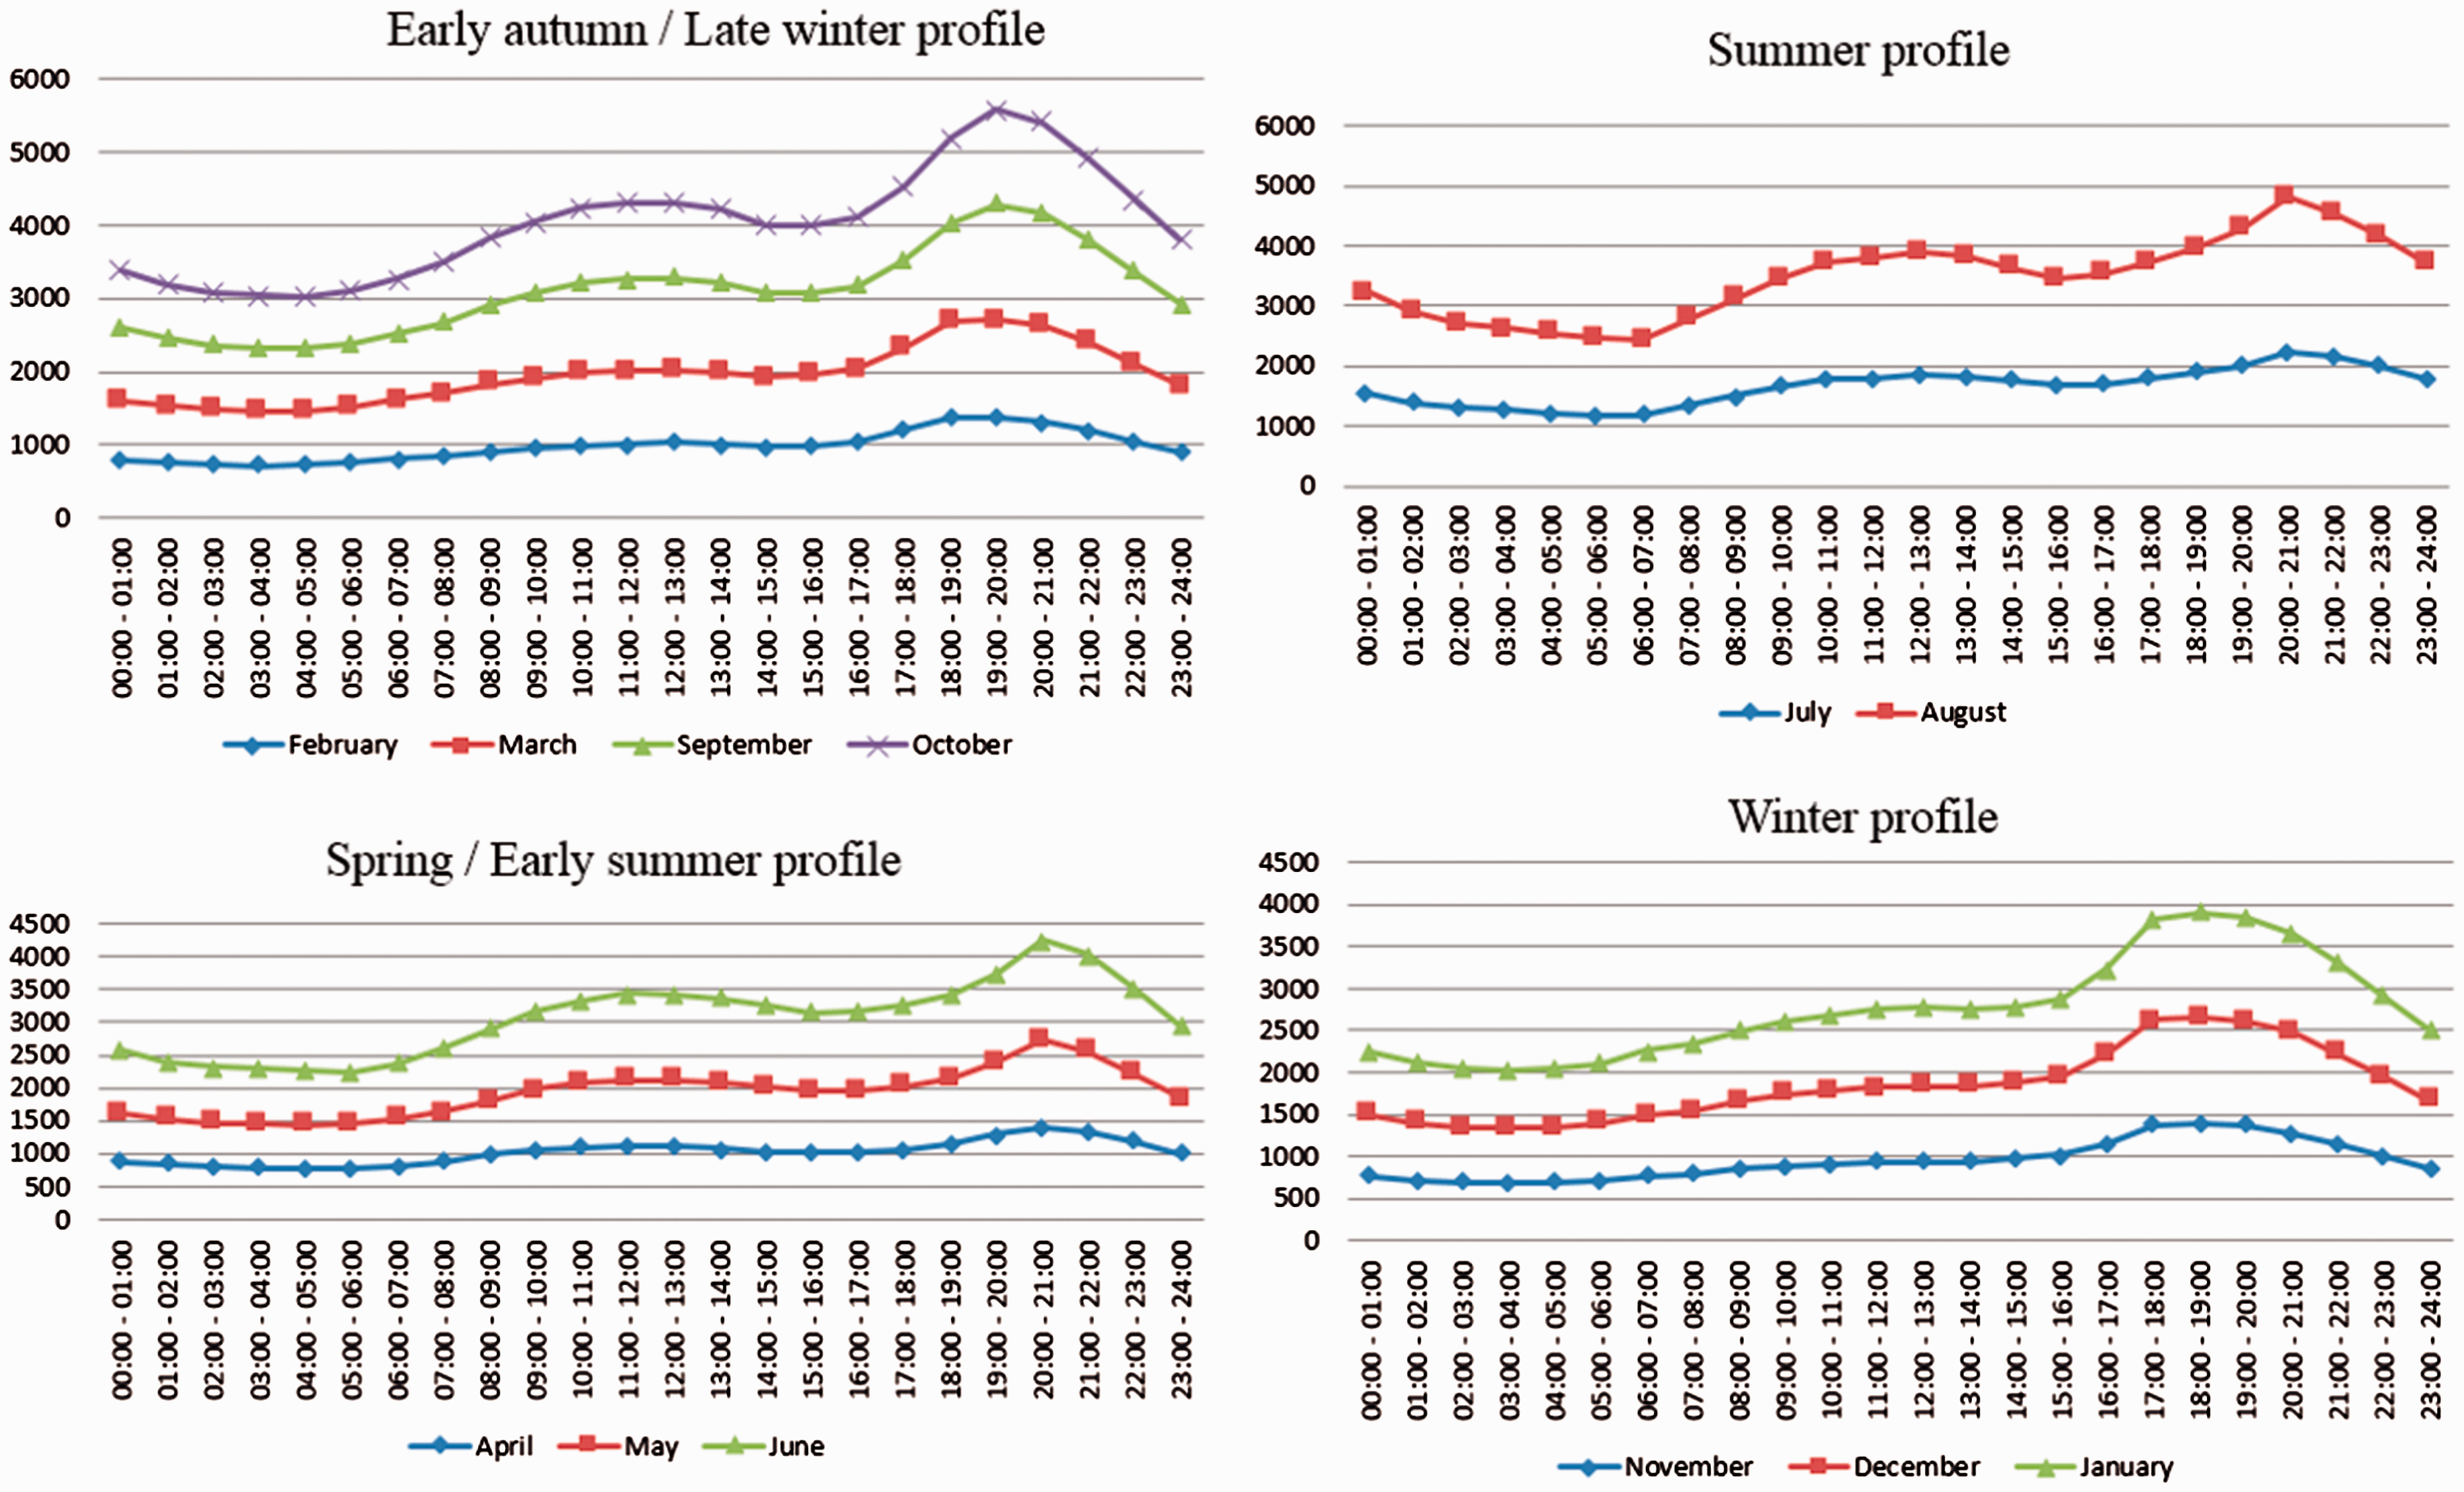
Seasonal demand load profiles in the Greek Island.
Techniques used for the analysis
Neural Networks, ARIMA and Regression models are being utilized comparatively in order to assess the prediction accuracy performance for the problem. After several trial and error efforts, it was proven that the Neural Network model selected (recurrent neural network) was not delivering so impressively more accurate results on the short term compared to the ARIMA model. Given both modelling techniques are providing similar results in terms of performance and under the reality that Neural Network models are much more expensive to produce and maintain, we decided to focus more on the ARIMA models and a combination of their implementation. An advantage of the ARIMA family of prediction models is that they provide a clear interpretability of the exact influence of each predictor variable to the overall prediction result. This interpretation capability is not the case with the much more mathematically complex Neural Network given the numerous non-linear transformations they perform to the predictor variables. 34
ARIMA models are a family of models widely used for analysing time series. The acronym ARIMA stands for Auto Regressive Integrated Moving Average. ‘Auto regressive’ terms are defined as lags of the stationarised series in the forecasting equation, ‘moving average’ terms are defined as lags of the forecast errors, and a time series that needs to be differentiated in order to be converted to stationary is called ‘integrated’ version of a stationary series. 35 This modelling approach is mathematically very simple to implement in any statistical programming language, very cheap in terms of computational resources and relatively easy to update and maintain. With that in mind, we can create a program easily connected to any front-end application, with a sole purpose of providing consumption predictions.
R programming language was used (R studio IDE), in order to design the forecasting model. R is a statistical programming language, focused on graphics and statistical analysis, and therefore is extensively used from statisticians for data mining and statistical analysis. In Figure 2, there is an image of the R studio IDE in which the forecasting model (ARIMA) was developed. The reason we selected R over other statistical and machine learning programming languages is that is free, open source and has a vast community of statisticians and machine learning engineers supporting it. Moreover, the time series packages of R provide us with all the functionalities we need for our study.
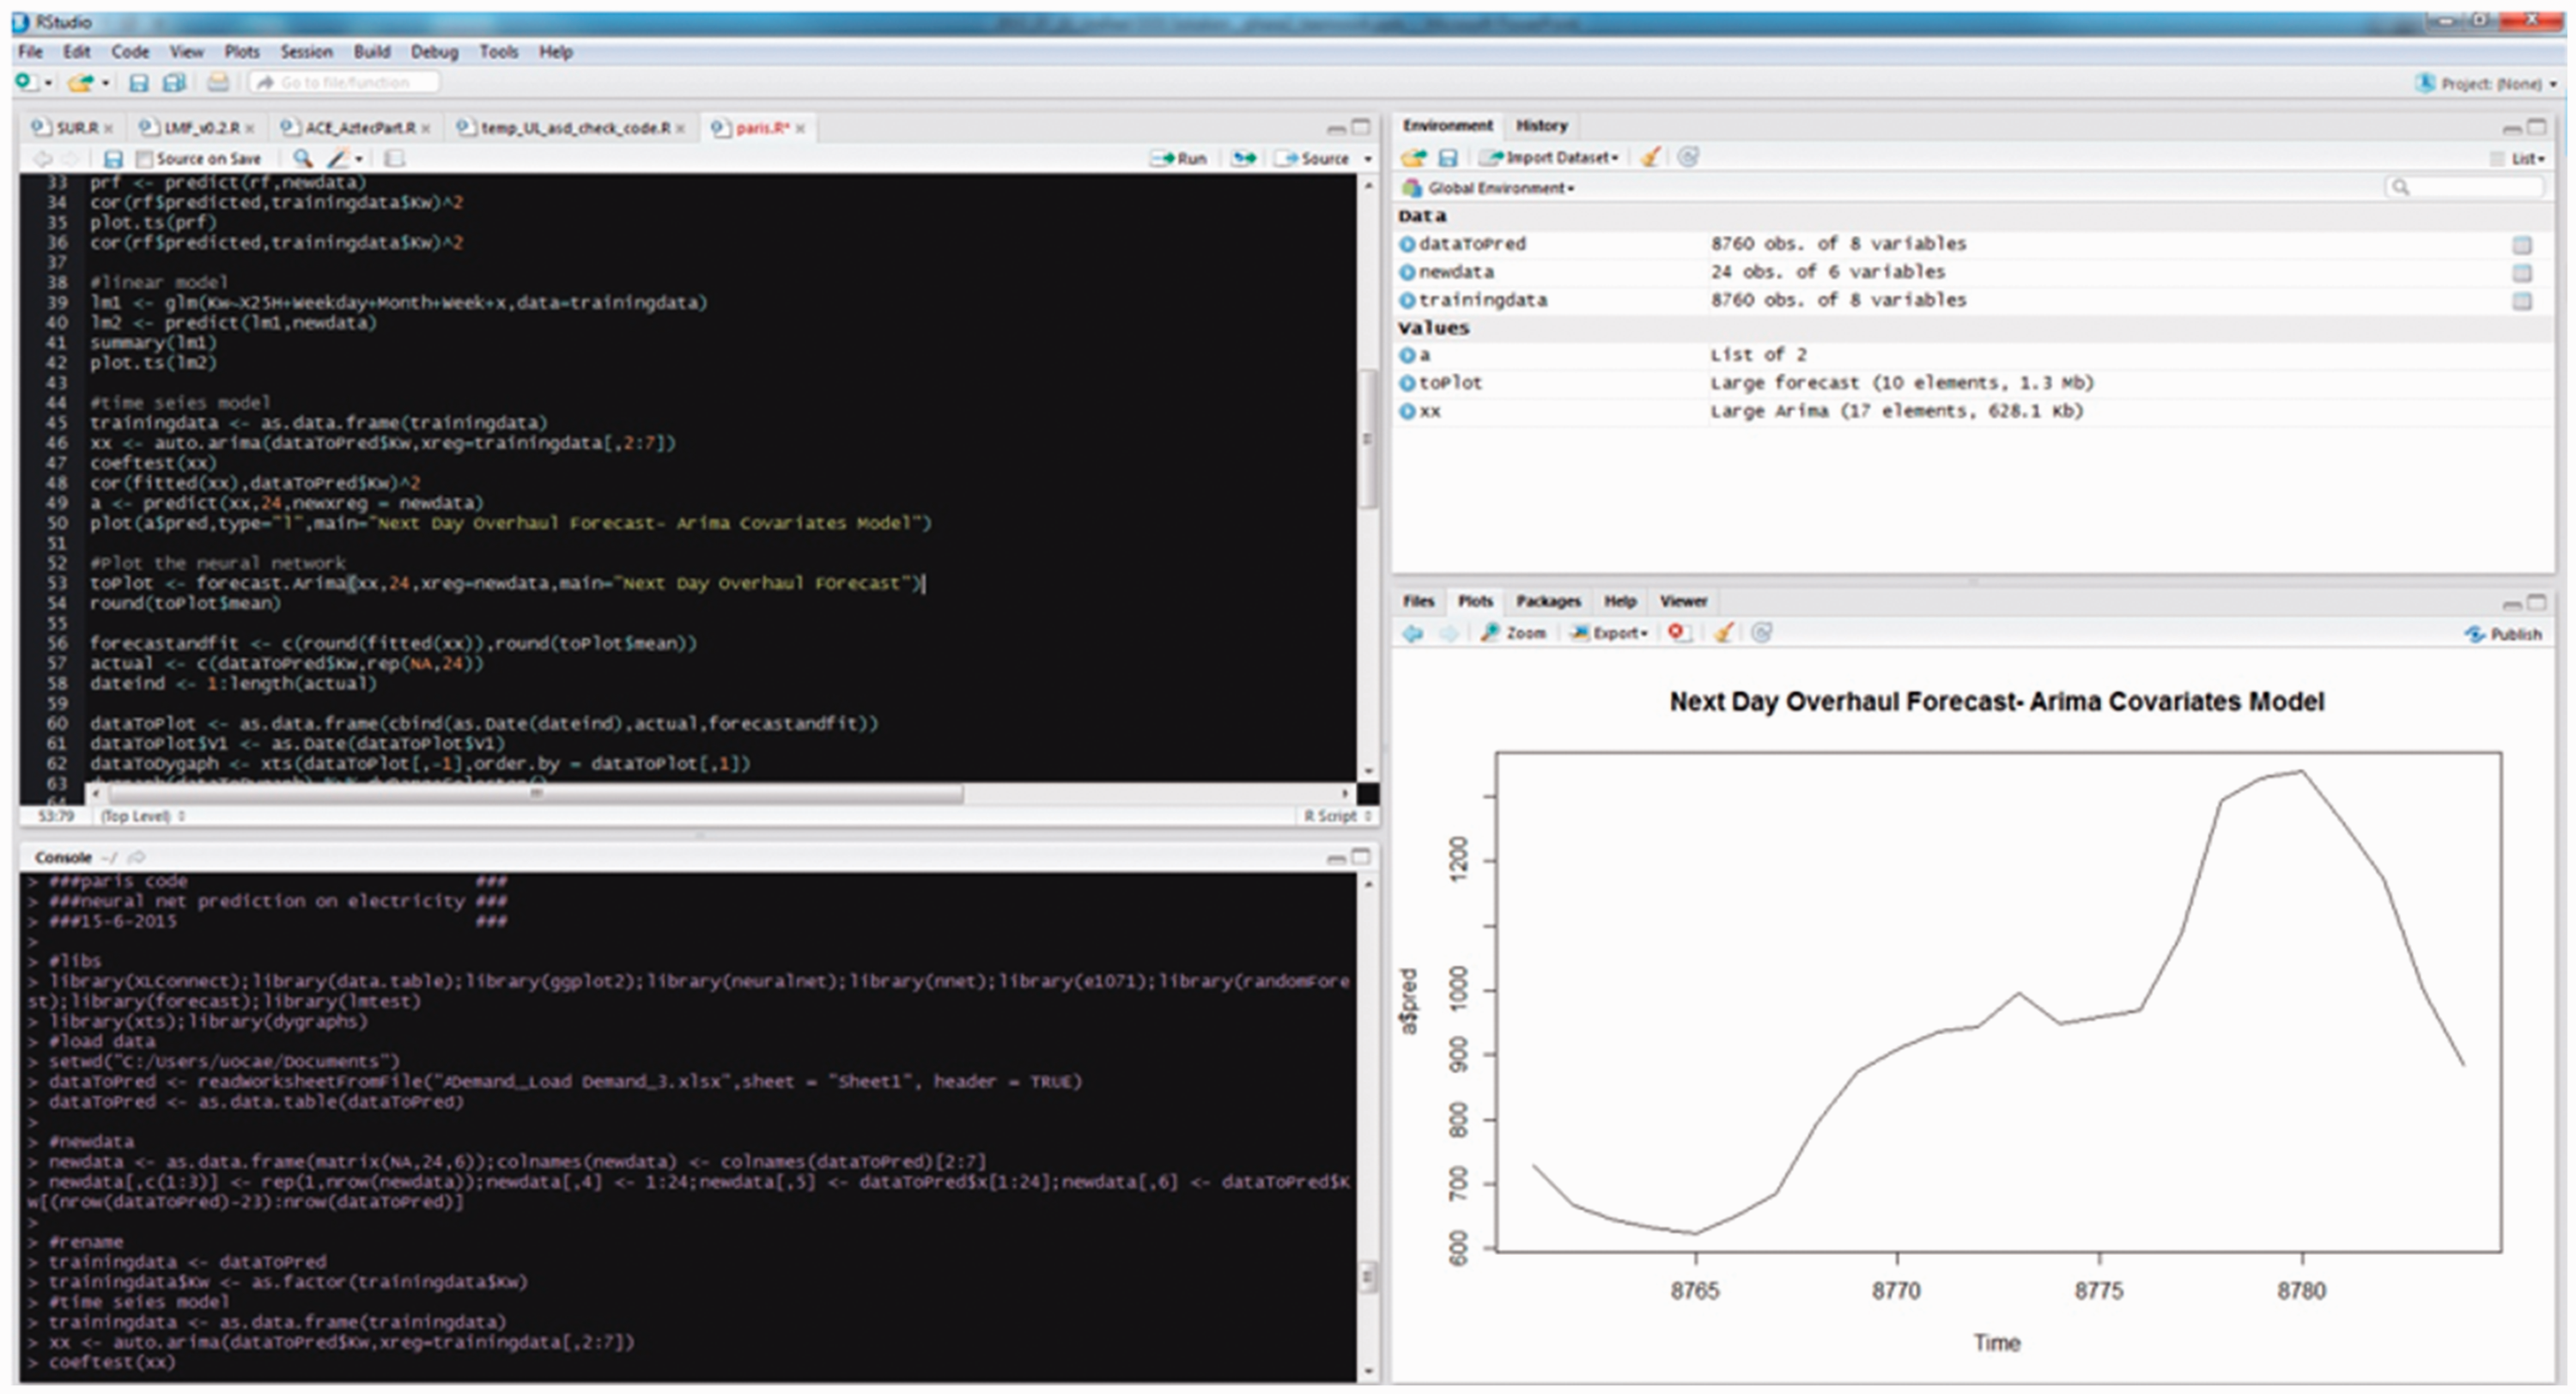
R studio program, design of the ARIMA model.
Results and discussion
Price unification and modelling
The existing pricing system in Greece is a geographically unified price system. This kind of system that is established from the national energy policy, focusing on improving the quality of services in the Aegean Islands. The electricity consumption in islands is rather costly and definitely much higher than the electricity cost in the mainland.36,37 This extra cost is not transferred to the customers due to the existing unified pricing policy, thus it is obvious that this unified pricing works as indirect subsidy for the island end-users, depending on the demand each time (Figure 3).
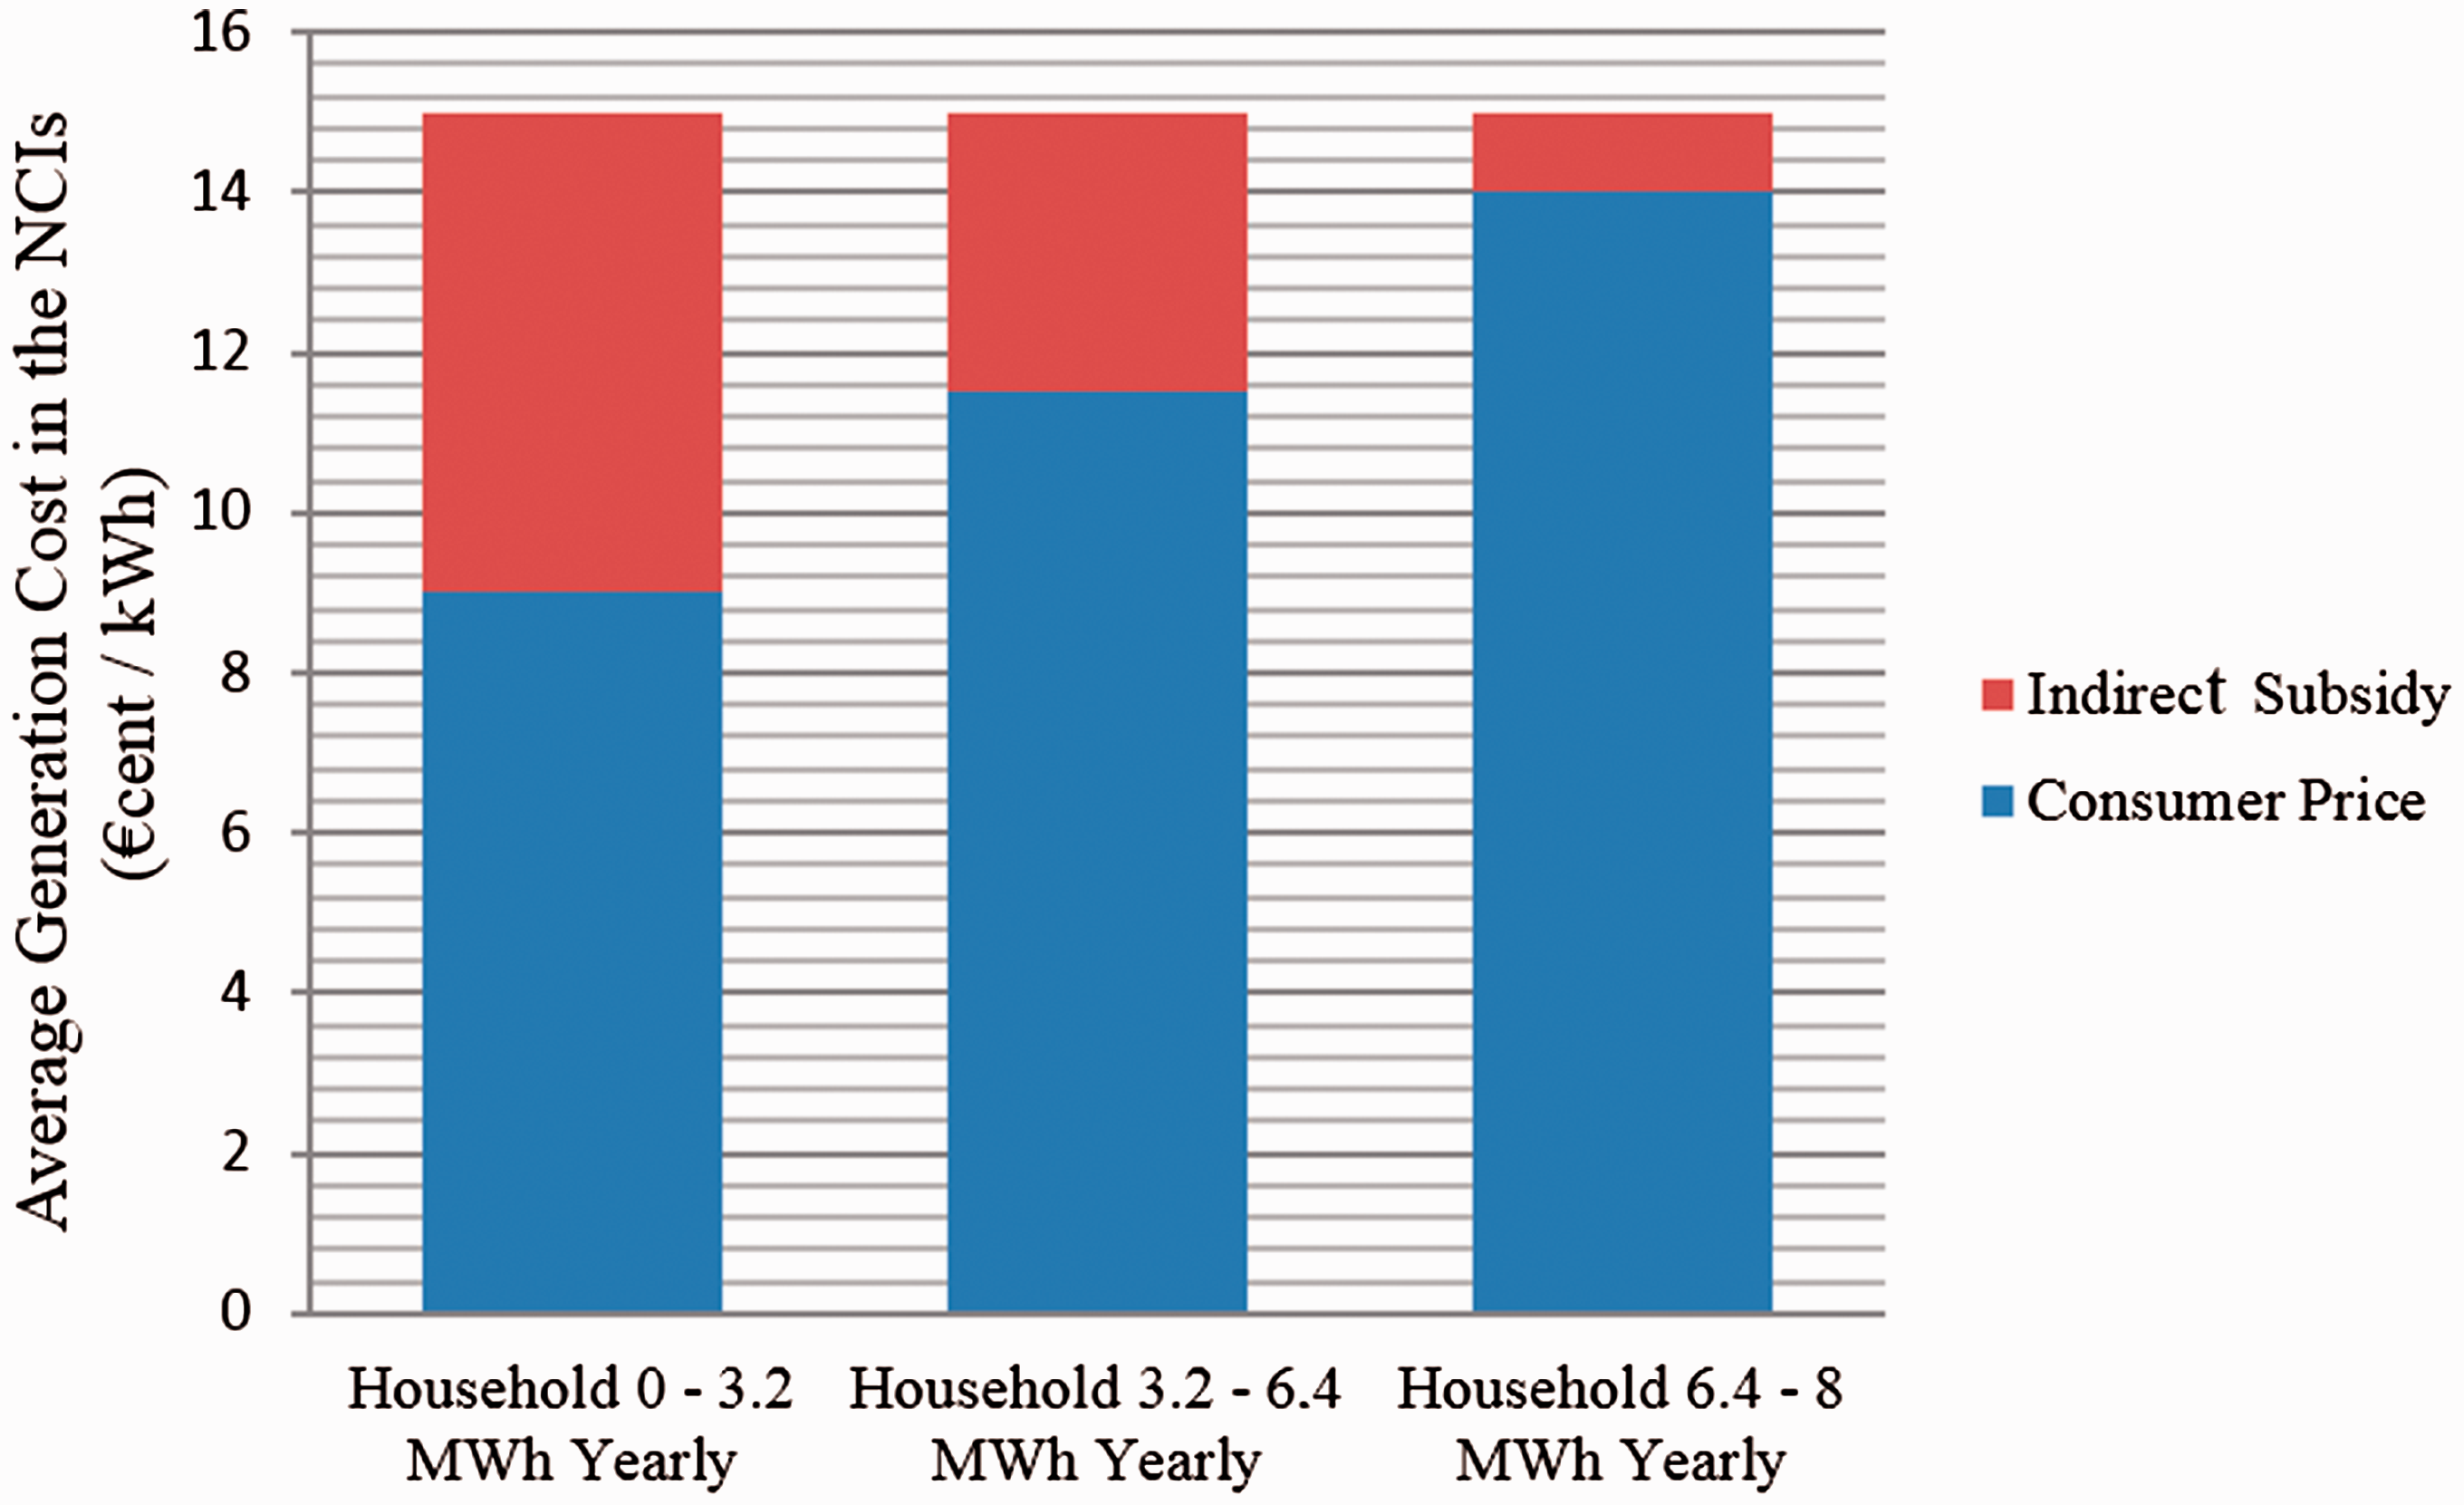
Distribution of electricity demand costs in households. The indirect subsidy arises as a result of the unified price system. 35
Regarding the negative side of unified price systems, it offers very few incentives for cost-efficient electricity production and does not help improving of the island electricity generation facilities. The extra costs are being covered by the PPC, raising, in that way, the national electricity prices.
In order to avoid larger cost is electricity generation appropriate planning has to be made. This planning could include development of better distribution systems or in our case the implementation of DR programs. Through DR programs, end-users could organize their electricity consumption and achieve the necessary load shifting and eventually by using a feed-in-premium system lead to lower electricity prices.
The steps, based on the available data, were followed in order to come up with a model and use it for an accurate forecast. The available data were: the hourly load demand for the year 2011, the demand in kW, the hour, the day, the week and the month. The steps that were followed in order to create the model were:
Clean up the data in order to examine if there are any missing values or extreme observations and perform quality testing. Perform visual data examination, on a daily level and on an annual level, if there is a cycling behaviour. Data account for structural behaviour therefore ARIMA time series modelling methodology was selected over other statistical and machine learning techniques. There was no reason to choose another model which is more complicated such as Random Forest or Neural Networks, which is more difficult to construct, describe and maintain. The seasonality of our data led this research to choose the ARIMA model. Having external variables led to utilize regression modelling to incorporate in the ARIMA model, day – month – hour info as external variables (ARIMA – Regression). Optimal forecasting model selection based on global measures of fit (R2 – Error metrics – AIC – SBC) and statistical inference assumption. In order to come up with better results, seasonality was manually constructed. ARIMA checks back significant correlations with past observations. The ARIMA model that selected was ARIMA (2,1,3).
The model developed can provide forecasts for up to 24 h on the next day in high accuracy, but the best precision achieved was in forecasts which were up to 4 h ahead.
In Figure 4, the actual and the forecasted Demand Load of the island for a time period of 10 days is presented, as it was calculated from the ARIMA model that was developed.
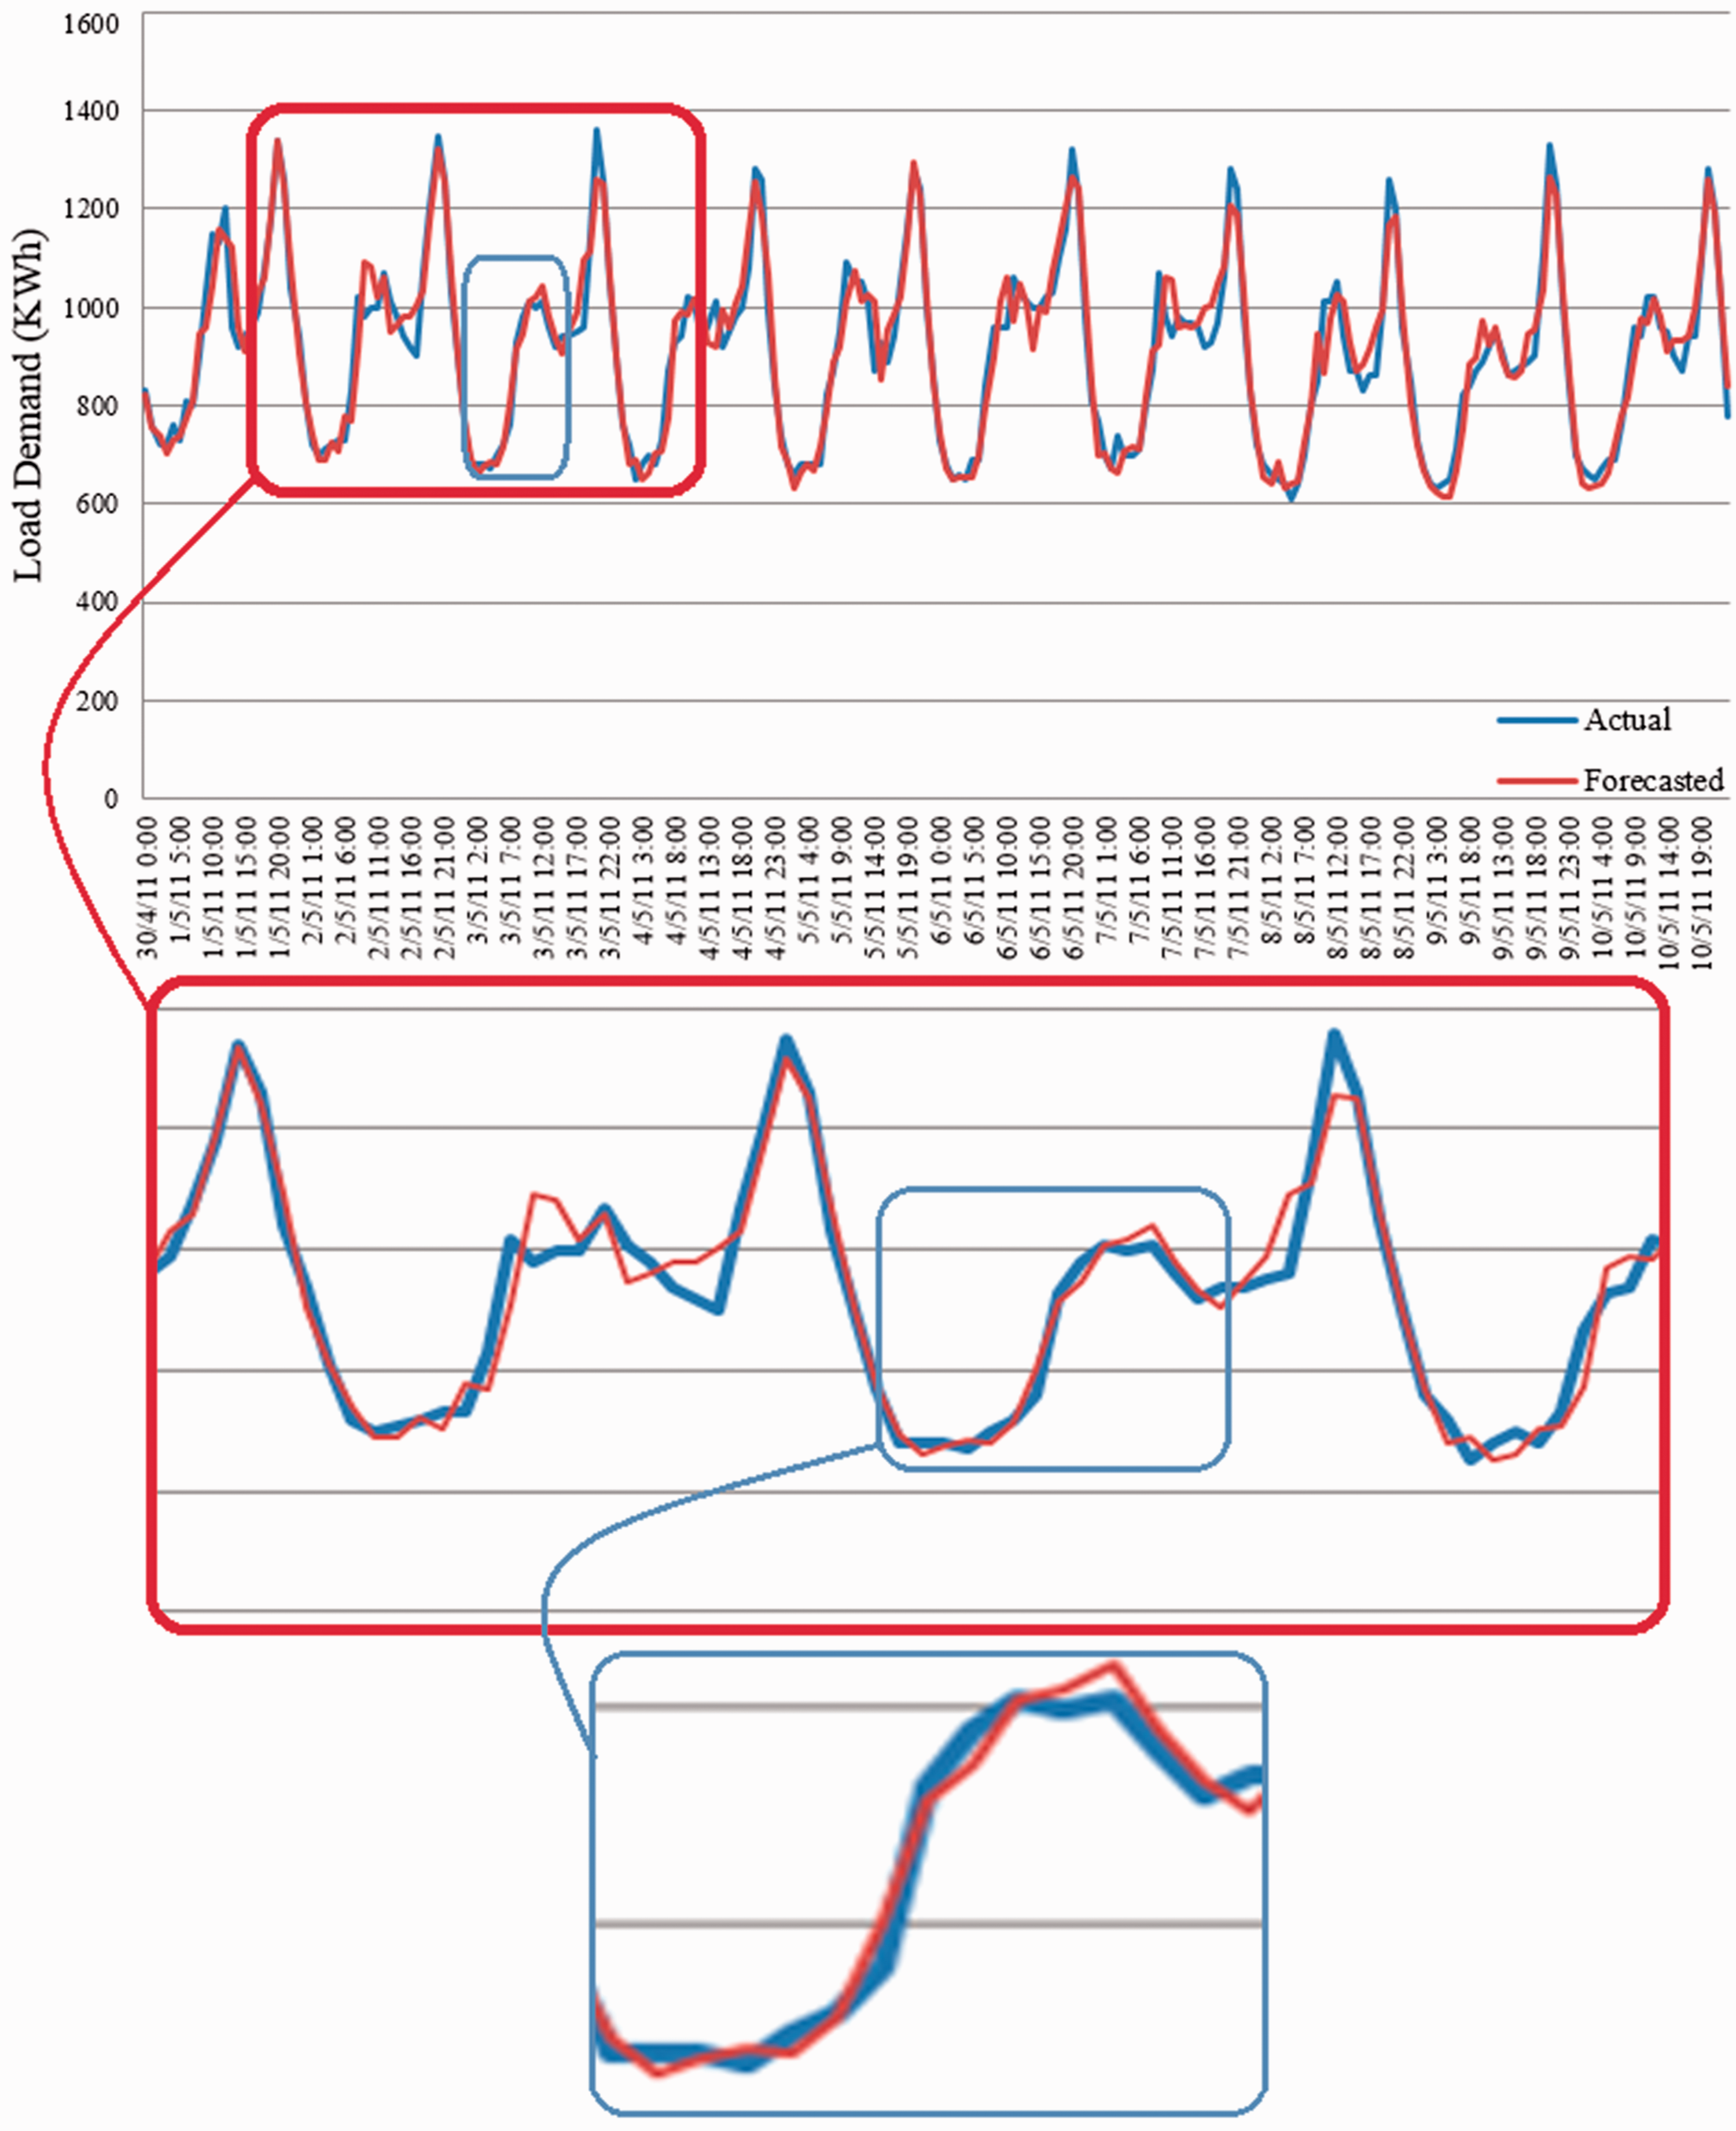
Presentation of the calculated forecast of the ARIMA model in correlation with real Demand Load.
In Figure 5, the 24-h ahead forecast of the island is presented. As mentioned, the most accurate forecast is for the first 4 h, which does not mean that the rest of the forecast is not accurate. It simply indicates that after the first 4 h, the percentage of error in the prediction is higher.

24-h forecast.
Table 2 contains a comparison of the actual and forecasted load of a typical day that was the result of the ARIMA model.
Actual and forecasted load of a typical day.

Profiling – program selection
The programs that are proposed are based on the end-users’ price responsiveness. ‘Price-response’ programs such as dynamic pricing (e.g. critical pricing and real-time pricing (RTP)) have in the focus of many initiatives for end-users. There is an extensive theoretical support for exposing end-users to electricity load and prices that mirror the conditions of the real market. Over the years, RTP programs have gathered great attention and focus.
The programs described below use the average load demand of the profiles that have been constructed. The main goal is to shift the high loads from peak periods to periods where the load is low. In order to achieve the load shifting, we have to offer to the end-user a forecast of the day ahead demand load. This was done with the ARIMA model that was designed and already described. A 24-h day ahead profile could be delivered to the end-users in order to actively manage their electricity consumption via this profile. Furthermore, the model could provide short-term predictions (4–5 h ahead) throughout the day, in order to eliminate the possibility of sudden outages or a sudden rise of the load consumption because of external parameters.
In this case study, the average load of the four profiles that were designed was used as a consumption pattern. In order to make the load shifting, we have to make an assumption on how the price of electricity is going to be configured in the Target Model market that will be implemented and followed in the Greek market. Based on international companies concepts, such as Ameren Illinois, Edison Southern California, ComEd, we were able to compare the fixed electricity rate that was offered and the price that was formed according to the actual market price through the RTP programs (and via coupling from switching models). 38
The assumptions that were made about the price probably carry a percentage of error but this does not affect the result of the program that we want to offer. The general rule that was followed in order to design properly the following programs is that the electricity is offered in high prices in periods with increased demand and the price is low when the electricity load demand is low. The programs in Figure 6 represent time periods of the year. The programs that are presented are divided into four categories according to the consumption profiles that were introduced in Figure 1.
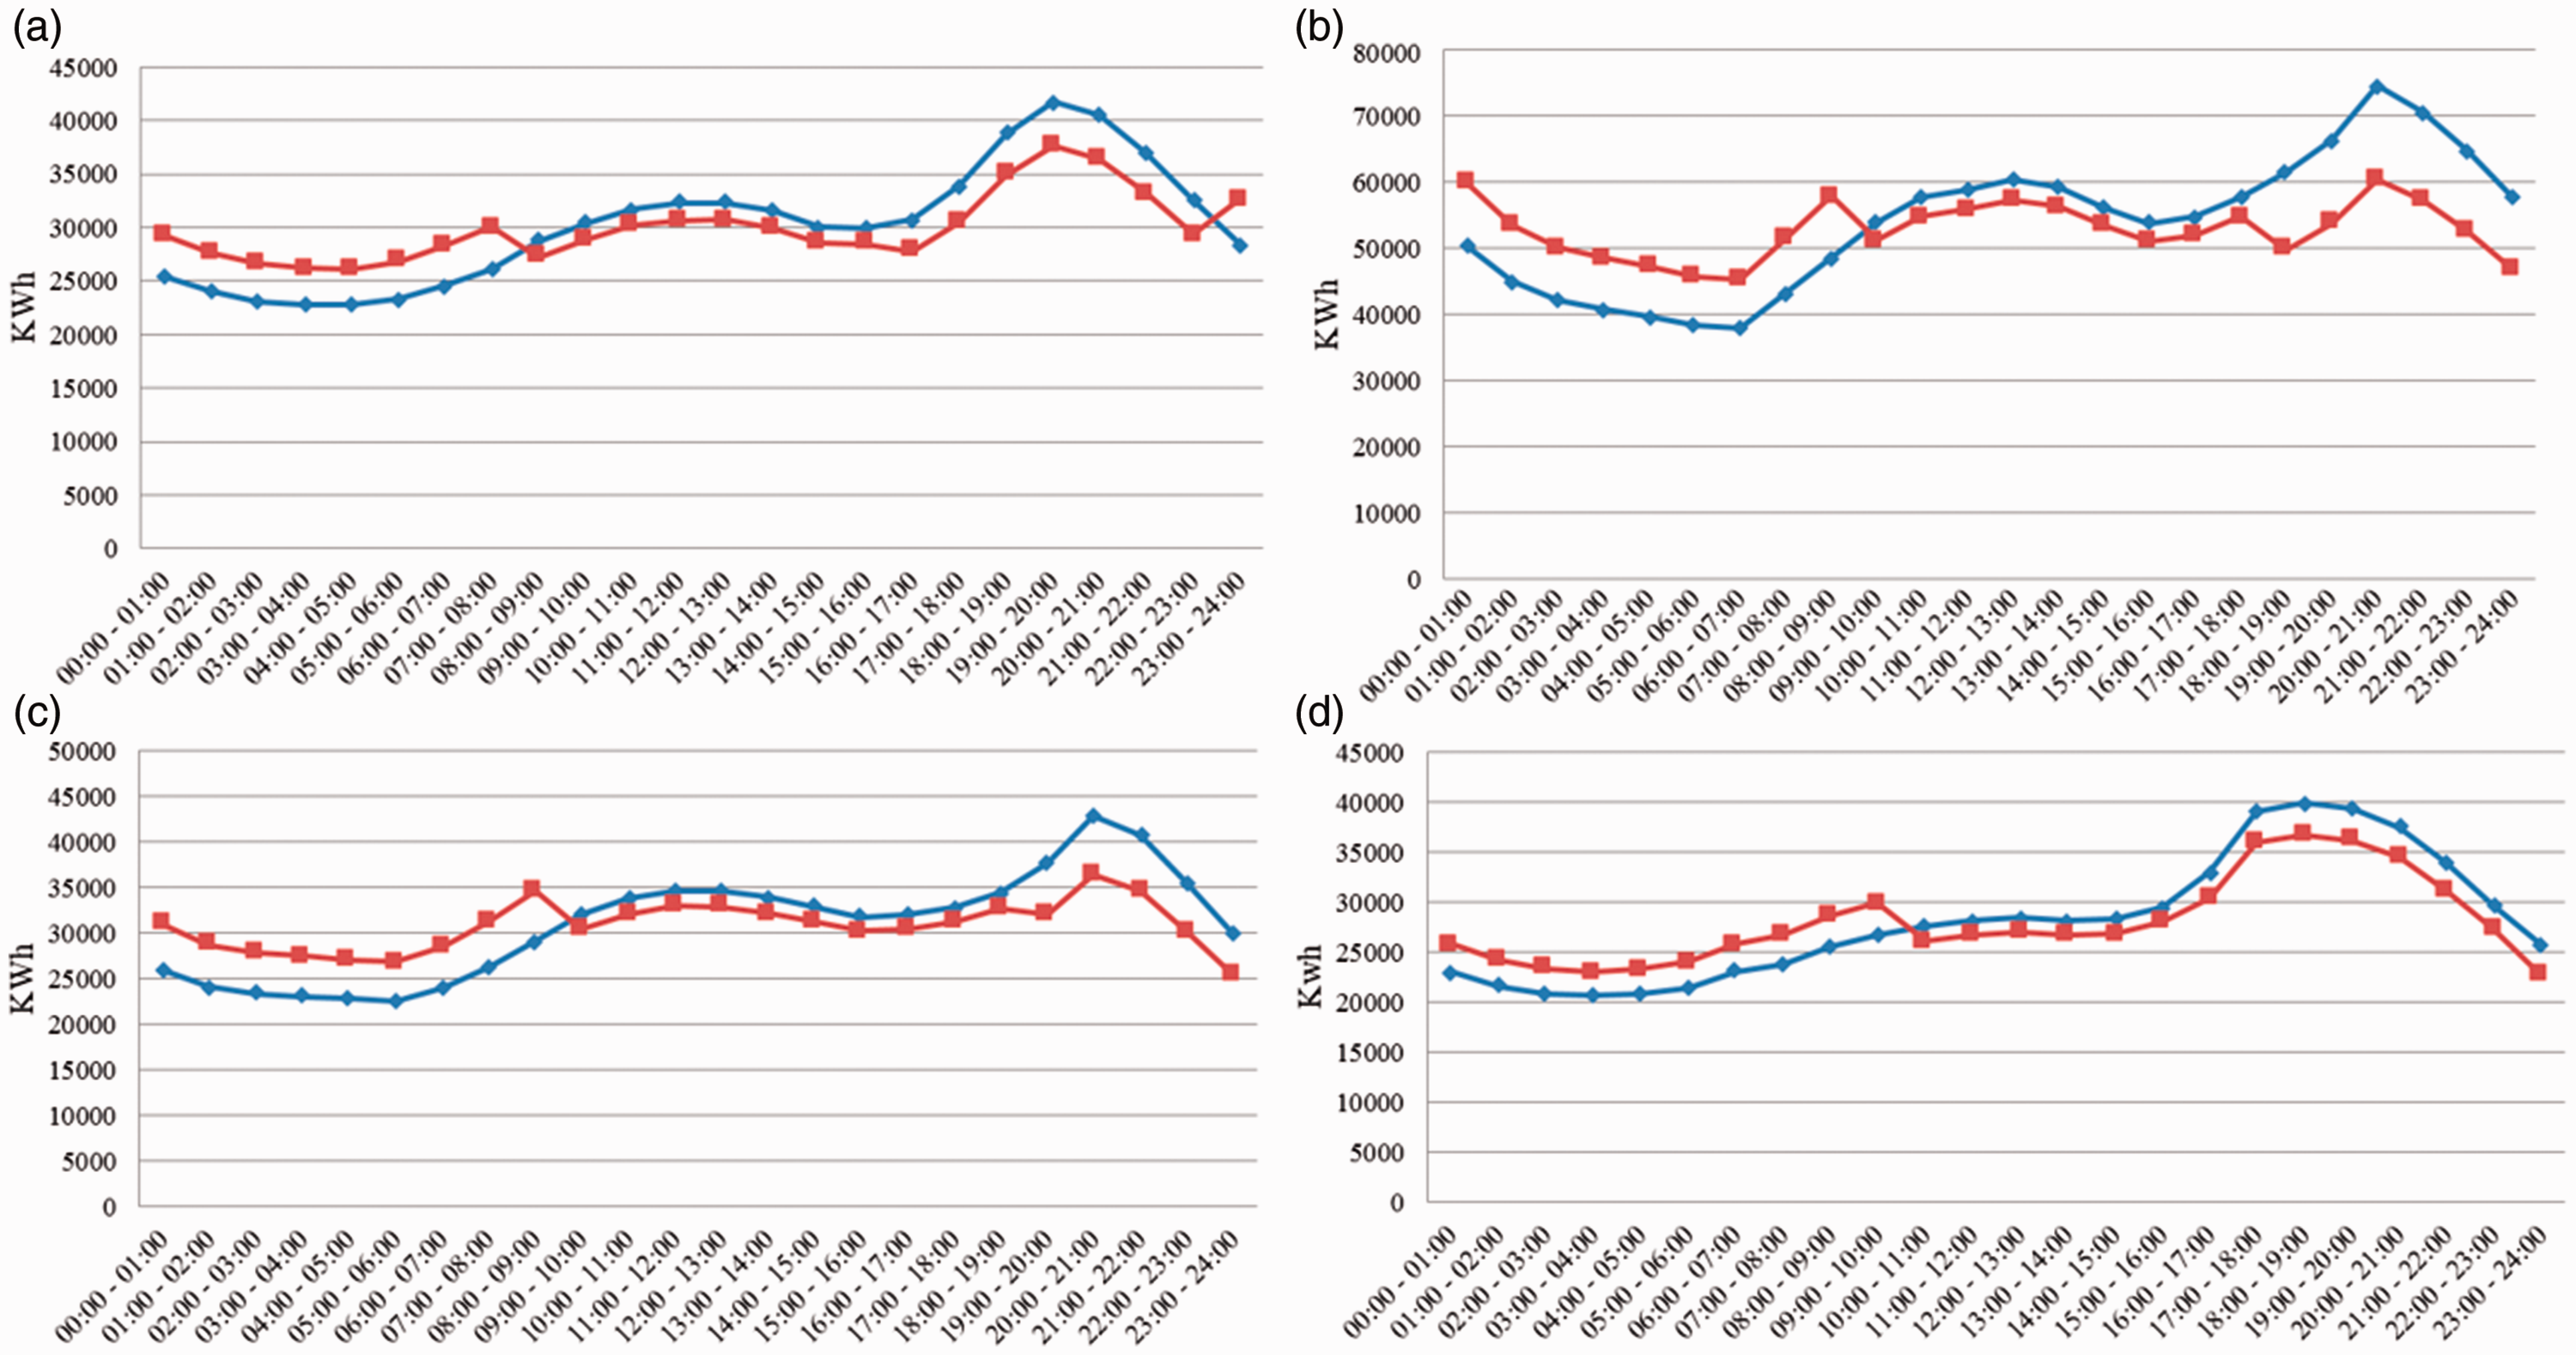
Average seasonal profiles under various programmes.
Late winter/Early autumn program
The Late winter/Early autumn program is designed for four months: February, March, September and October. These four months represent a time of the year that the weather conditions vary significantly from day to day. This fact causes fluctuations in the average profile. There is a large peak in the load demand from early evening until the night (16:00–23:00). During midday hours, there is a smaller peak in the electricity load (08:00–16:00), and during night until early in the morning (23:00–08:00), the load demand remains at low levels (Figure 6(a)).
This program proposes a load shifting that aims to increase the demand load in the late night were there is no peak, shifting the consumption from the two peaks that occur during the day and evening. The main goal is to decrease the evening electricity peak which is larger than the peak that there is during midday.
In Figure 6(a), there is a presentation of the Late winter/Early autumn profile without the implementation of the RTP (blue line), and after implementation of the RTP program (red line)
Spring/Early summer program
This program is designed for three months: April, May and June. These three months represent a period that the temperatures are higher than the periods already described in Late winter/Early autumn program. Furthermore, the day time of this period is greater than the winter periods, and as a result, some shifts on electricity loads to later hours in the evening are observed. The load demand during the night period and the early morning period (00:00–09:00) is low, comparing to the periods that are described, but higher in general. Following this period of the day, there is a significant increase, a small peak in the midday (09:00–19:00). The midday peak follows a night peak, which is considerably larger and lasts until midnight (19:00–00:00) (Figure 6(b)).
The reduction of the night peak is the main target of this program, following that the reduction of the midday peak comes as a secondary target. The load shifting that we tend to achieve is significant in the night, considering the peak load in the demand during this period. The load demand in the late night and early morning remains at low levels. As a result this is the main area where the loads should be shifted from the midday and night, respectively.
In Figure 6(b), there is a presentation of the spring/early summer profile without the implementation of the RTP (blue line) and after implementation of the RTP program (red line).
Summer program
The Summer program is designed for two months: July and August. These two months represent the hottest period of the year, where also the day length is larger than any other period. The load demand is similar to the average spring/early summer profile but the demand load for this period is significant higher. During the night period and early morning (00:00–09:00), the average load is low compared to the rest of the day. After this time, there is a small peak in the load demand which lasts till the evening (09:00–18:00) and after this time, the largest peak of the day follows which lasts until midnight (18:00–00:00) (Figure 6(c)).
The general shape of the graph is similar to the previous ones, with the difference that now the two peaks that occur throughout the 24 h are much larger. Our main concern with this program is to shift a large amount of the electricity consumption from the night peak which is the larger peak to a time of the day that the consumption is lower, in our case late night period. The fact that the load demand reaches so high limits makes it necessary to shift it into another time period. The shift of the midday peak is a secondary target since it is significantly lower than the night peak.
In Figure 6(c), there is a presentation of the summer profile without the implementation of the RTP (blue line), and after implementation of the RTP program (red line).
Winter program
This program is designed for three months: November, December and January. These three months represent the coldest period of a year in Greece. The load demand during the night period and the early morning (00:00–09:00) is considerably low. On the other hand, there is a significant increase in the load demand during the early evening period until the night period (16:00–23:00). During the day time (09:00–16:00), the load demand does not have any significant changes; is rather steady (Figure 6(d)).
In the program proposed, there is going to be a reduction in the load demand from the night peak and a shift of the consumption in periods with lower consumption aiming for the most part the late night period. The load shifting that tends to be achieved is not large, because of the ‘small’ peak load in the demand, during the night. During this time of the year, the consumption is not very large, and as a result, load shifting in practise is not needed. Accordingly, during the day time, the consumption is not very large, but there is a need for some reduction in the demand.
In Figure 6(d), there is a presentation of the winter profile without the implementation of the RTP (blue line) and after implementation of the RTP program (red line).
Constraints and discussion
The forecasting potential, the accuracy of a model and as a result, an RTP program are always limited by the suitability and quality of the available input data and the ‘environment’ that are implemented to. In developing a forecasting model in order to produce accurate predictions, the chosen modelling approach has some, worth to mention, weaknesses. These primarily relate to the quantity, quality and type of data that were used in the model. Furthermore, the program design for the RTP implementation is based on pure theoretical data and international literature, since a real-time driven ToU pricing described in the research does not yet exist in the autonomous Greek Islands.
Regarding the ARIMA model, providing one-year data does not give the opportunity to make more accurate predictions. In any case, the tool developed provides high level of accuracy but the use of larger database would definitely provide more accurate results.
In addition, the lack of smart metering usage in general, affects the data analysis. The source of the data was PPC which is the largest provider for electricity in Greece and could be considered as an accurate source; however, the data that smart meters would contain more detailed information as far as the hourly load consumption of the end-users and the distribution of the consumption between the house appliances. In addition, the usage of smart meters would have an impact in the systems’ approach 39 and in the design and implementation of the RTP programs that were described in the previous chapter.
The ARIMA model that was designed is based on historical data in order to produce a forecast. The model was designed in order to give the opportunity to add more data as external variables. In the case examined, the only available data were the load demand, the hour, the day, the month and the week. In future data such as the temperature, the weather and even the pricing could contribute to the model to make predictions with higher accuracy. The data that were provided to the model have a structural behaviour. By importing more information in the model, it is possible for the data to start to have a random behaviour which will increase the error in the forecast.
Conclusion
In this work, a small island in the Aegean Sea was chosen. The results of the study were the development and design of the ARIMA forecasting model, and its use to design RTP programs. The model that was designed provided accurate forecasts for up to 24 h on the day ahead. The accuracy of the prediction is high but the model achieves even higher accuracy when producing short-term forecasts of up to 4 h ahead. With its use, the forecasting model end-users could have a reliable prediction of the load demand, and by selecting an RTP program, could actively reduce their load in periods of increased demand and consequently their electricity consumption during the year and electricity bills. Four seasonal-related programs were developed. The main target of these programs was to shift or reduce the demand load from periods of increased demand (peak periods) in periods where the demand is lower. The implementation via the DR programs in the Greek electricity market is something that has not yet drawn much attention due to the current structure of the market. However, since Greece is in a turmoil for more than eight years, experiencing the effects of the economic crisis, such alternatives as the DR programs, which could save resources for end-users, could be one useful solution.
Footnotes
Declaration of conflicting interests
The author(s) declared no potential conflicts of interest with respect to the research, authorship and/or publication of this article.
Funding
The author(s) received no financial support for the research, authorship and/or publication of this article.