
Abstract
India is one of the leading nations in the world for the development and utilization of wind energy. The country’s wind power potential at 100 m above ground level is 302 GW. The Indian wind industry is on track to achieve the government’s 60 GW wind capacity target ahead of the 2022 deadline as it has already crossed 34 GW. Wind energy sector contributes to the country by generating employment, reducing the adverse effects of greenhouse gases and increasing the size of gross domestic product. To date, the Indian wind sector has developed by private sector investment. The government, on its part, supporting the wind industry in the country via a range of financial incentives and innovative schemes. That ensures scaling up of wind energy to reach the national energy demand in a socially, economically and ecologically sustainable manner. Attempts have been made in this review to frame a clear picture of the current status of India in the onshore and offshore sectors. Various guidelines for the development of wind power projects, policies and programmes by the ministry and its growing concern for the country’s energy security are discussed. This paper also highlights the importance of wind energy tariff and also explores the cost and economics of wind energy production. Current wind energy-related research studies are summarized. Concerns that are adhered in developing wind energy power plants including social, environmental and techno-economic impacts are addressed.
Introduction
Accelerated industrialization and copious consumption of fossil fuels have negatively affected our environment and become the main contributor to global warming. The unsustainable climate is a matter of attention as it has threatened the survival of living humans, animals and plants. Growing population has expanded the need for energy, which eventually put pressure on natural resources and created a standard change from resource generation to exploitation. The Indian market has undergone unparalleled economic growth over the last decade. 1 Fossil fuels are inadequate resources of energy and decreasing at a hastened rate, and near future, it will be a resource of the past. The highest percentage of energy generation depends on fossil fuels, and therefore we are driving fast towards an arena of the energy crisis. The paradigm shift towards renewable energy technology (RET) is the significant innovation of the decade. The thrust on renewable energy-based power generation will not only be environmentally friendly but will also ensure the energy security and energy access.
India aims to install 175 GW renewable power capacity by financial year (FY) 2022 (1st April to 31st March as the defined FY for India). Of the 175 GW renewable energy capacity, the target of 100 GW is to come from solar, 60 GW from wind, 5 GW from small hydro and 10 GW from biomass. As on FY2017–2018, the cumulative wind installed capacity is 34 GW. India’s fast-rising energy demand and growing concern about economic and environmental consequences call for effective and thorough energy governance. As per International Energy Agency (IEA), approximately 0.24 billion residents in India lacked access to electricity in FY2016–2017. As of now, the country relies on coal for about two-thirds of its power generation. The Indian government is working to boost electrification through renewable energy sources. The Power ministry’s power supply position report to the nation for FY2017–2018, the energy requirement was 12,12,134 MU, and availability was 12,03,567 MU, and deficits of 8567 MU (0.7%). Peak demand was 164,066 megawatts (MW), peak met was 160,752 MW and deficits of 3314 MW (2%). 2 The Center for Wind Energy Technology (CWET) first estimated the onshore wind energy potential in India at around 45 GW and was increased to 49.10 GW at a 50-m above ground level (AGL), and 102.8 GW at 80-m AGL. 3 Despite the definite increase in wind power capacity in the country, only a portion of the country’s wind potential has tapped. As per the assessment of National Institute of Wind Energy (NIWE) formerly CWET, the potential for onshore wind at 100 m AGL is more than 302 GW. The maximum wind potential in India centred in the coastal states such as Gujarat, Andhra Pradesh, Tamil Nadu, Maharashtra, Rajasthan and Karnataka. Kashmir, which is an exception from coastal areas because of high altitude, high wind velocity and high wind density.
There are two configurations of wind turbines used in India; vertical axis and horizontal axis. The horizontal axis turbine has seen technological and economic growth and used in commercial turbines on a large scale, and the vertical axis turbines are still in the demonstration phase. The simulation results of vertical axis turbine farms show that they perform well for a wide range of incoming wind directions if they are placed near to each other. 4 The R&D projects of the Ministry of New and Renewable Energy (MNRE) on the vertical axis wind turbine (VAWT) is to design and to develop a 1 kW hybrid VAWT system for low-wind speed regimes. Iysert Energy Research Private Limited (approved channel partner company of MNRE) located in Rajasthan have manufactured portable VAWT of 300 W, 1 kW, 3 kW, 5 kW and 10 kW. 5 In the beginning, horizontal axis turbine wind farms installed in the coastal areas of Tamil Nadu, Gujarat, Maharashtra and Orissa, which now increased to more than nine states of India. 6 The Institute for Energy Economics and financial analysis (IEEFA) anticipates that by 2027, Tamil Nadu can increase the capacity of wind power to 15 GW. 7 Interestingly, with a share of 24%, Tamil Nadu emerged as the highest installed capacity of grid-connected renewable energy in the country. 8 In FY2016–2017 India ranks fourth in the world wind power market with 32 GW after China (188 GW), USA (89 GW) and Germany (56 GW). As on FY2017–2018, India has 34 GW installed capacity and a global share of 5.9% at the end of 2016 and 6.1% at the end of 2017. 9 Power generation from wind continued to improve significantly given sufficient monsoon winds and a sharp jump in installed capacity. The electricity generation for FY2016–2017 was 46004.34 MU and for FY2017–2018 was 52658.33 MU shows the sharp increase in generation utilizing the renewable sources.
The Indian wind power companies compete on a global level for energy market shares, and, along with technology development, focus on an equal commitment to building a strong customer base. 10 Wind energy in India, unlike all other forms of energy, is run mostly by private companies. In FY 2017–2018 cumulative wind installations in India was 34.046 GW, out of which 11.922 GW is from Suzlon Energy Limited, and rest 22.124 GW was from other original equipment manufacturers (OEMs). Suzlon exports its turbine to the USA and several countries abroad, and it has its R&D units in the Netherlands, Denmark and Germany to prove its market presence. 11 . According to the global wind statistics report 2017, global installed wind power capacity is 539.581 GW and projected to increase by more than 1500 GW by the year 2020. 12
Incorporation of new regulations and requirement of accelerated growth of the wind power sector, MNRE issued comprehensive guidelines for developing wind power projects in the country in consultation with various stakeholders. The various policies such as support from the government, quota-based incentives, fiscal incentives, funds for investment etc., can improve the production of power and the economy of India. 13 Repowering policy is given in 2016 to promote optimum utilization of wind energy resources by creating a facilitative framework. Repowering refers to replacing ageing wind turbines with more powerful and modern units to raise electricity generation levels at the refurbished wind sites. The process involves replacing old machines with fewer, more abundant and taller modern units which are quieter, more reliable and can produce more electricity. Wind energy policies are very investor friendly and offer attractive tariff and regulation that provides healthy growth in this sector. MNRE conducted an auction for 500 MW and the lowest tariff quoted at INR 2.43 (0.03327 USD) per unit by Spring Energy and K P Energy which is all time low per unit cost [1 INR = 0.01369 USD as of 6th November 2018]. Furthermore, Verdant Renewables, Betam Wind Energy and Powerica quoted tariff of INR 2.44 (0.0334 USD) per unit each while Renew Energy quoted a tariff of INR 2.45(0.03354 USD). At present State Electricity Regulatory Commissions (SERCs) have declared preferential feed-in tariffs (FITs) for the purchase of electricity generated from wind power projects. All the SERCs have adopted a ‘cost plus’ methodology to fix the FITs, which varies across the states depending upon the state’s resources, project cost and more importantly the tariff regulations of SERCs. 14
It was identified in the 2013 draft, that there is a significant amount of offshore wind power on the coast of Gujarat and Tamil Nadu (Kanyakumari). 15 In FY2015–2016 adopted a national offshore wind policy to study two projects: one in Gujarat and another in Tamil Nadu. With support from the EU and UK, the Indian government is surveying the offshore wind resource, starting environmental assessments in the most favourable locations, and developing a policy framework to guide and support projects and a local supply chain. India’s NIWE has called expressions of interest from suitable and qualified bidders for the construction of a 1 GW commercial offshore wind farm off the coast of Gujarat. The predetermined area includes around 400 km2 and is located some 23 km off the port at gulf of Khambhat. The Facilitating Offshore Wind in India (FOWIND) consortium deployed a LiDAR on the locality in November 2017 and marked Gujarat and Tamil Nadu as the two classified areas for the construction of offshore wind power. Installation of LiDAR off Tamil Nadu coast scheduled by the end of September 2018. Furthermore, at least 5 GW of offshore wind capacity proposed by FY2021–2022 and auction 10 GW of wind energy capacity each in FY2018–2019 and FY2019–2020 to achieve 60 GW of onshore and offshore capacity by FY2021–2022. 16
To reach the target comfortably, the country needs a robust policy framework to support the growth of offshore wind farms, unlike European countries. 17 MNRE declared a new national wind–solar hybrid policy that gives a framework for the development of large grid-connected wind–solar photovoltaics (PV) hybrid systems for effective utilization of transmission infrastructure. The policy aims at decreasing the variability in renewable power generation and achieving better grid stability. The hybrid systems are advantageous than either a solar or wind-based system as it improves system efficiency, power reliability and energy storage requirements. 18 Key stakeholders in wind energy development in India or world at large are (1) wind turbine manufacturers, (2) dealers and distributors, (3) wind project developers, (4) consultants and contractors, (5) electric utilities, (6) government agencies and (7) land owners. Wind energy is a capital-intensive technology since most of the expenditure done at the time of investment. The production cost determined by power produced, fixed costs (interests, land rent, insurance) and variable costs (maintenance, repair, miscellaneous). Therefore, it is not always possible to implement wind energy at a large scale because of the intermittent nature of wind and high investments. Also, the environmental impact of the wind turbine requires exhaustive investigations, which is at a nascent stage in India. Strongest winds have been the most favourable place for the wind turbine’s installation, and there are adverse impacts on wild and human life. Also, usage and development of wind energy have been facing resistance from society, the main concern being the noise from wind turbines. 19
In general India’s energy sector is facing several problems, such as misbalance between demand and supply, persistent energy shortages, a weak financial position of energy utilities, high-transmission and distribution losses and poor institutional infrastructure. 20 There is a significant gap between energy supply and demand in India. 21 Thus, all the efforts to bridge this gap, including the promotion of RETs, assumes special consideration. Amongst the RETs, wind energy technology (WET) holds a promising future. However, the implementation of WET faces several barriers acting in the field. Some of the significant challenges are transmission, regulatory, structural and efficiency. The MNRE wind power programme includes extensive wind resource assessment programme; R&D; implementation of demonstration projects to build awareness; development of infrastructural capability; the capacity to manufacture along with operation, installation and continuance, maintenance; the permanence of wind turbines and conducive policy formulation.
This study conducted with an intention to deliver the current status of wind energy in India. Aspects such as WET and institutional framework and policies are explained. Market structure of wind energy has been reported while highlighting some of the excellent practices of various wind-based energy companies. Also, the way forward towards better wind energy developed nation has been highlighted to project the global status of India. High-end subcategorization of the considered aspects such as estimated potential, installed capacity, generating capacity, tariffs and policies has been presented. Furthermore, cost and economics, health and environmental effects of wind turbines and challenges of wind energy development are addressed.
Wind power estimated potential in India
The country bestowed with an immense wind power potential, and constant attempts have been made to harness this potential. The most notable feature of the wind climatology in India is monsoon. Winds in India are regulated by the southwest summer monsoon, which starts in May–June when cold, and humid air flows towards the land and northeast winter monsoon which begins in October when cold, dry air moves towards the ocean. To estimate the wind potential, a study conducted to locate wind-rich sites in India through field estimations. The data collected from all parts of the country consolidated for the preparation of a national wind resource atlas. Also, wind resource relevant studies (onshore and offshore) using other methods like models and satellite data used for the exploitation of wind energy. For the study, multilevel instrumentation coupled with dedicated guyed masts of 20 m/25 m/30 m/50 m/120 m were used. Reliable and fully automated instruments that can provide the required output for the wind energy resource evaluation are being done at the field stations. Wind resource assessment unit in NIWE has monitored wind speed and direction at 794 sites. Four numbers of 120 m high masts with multilevel instruments were commissioned at four crucial wind farm areas to evaluate the wind shear as well as to act as reference stations such as (1) Akal/Jaisalmer–Rajasthan, (2) Lamba/Jamnagar–Gujarat, (3) Jagmin/Satara, Maharashtra, (4) Jogimatti/Chitradurga–Karnataka. 22 Using the wind atlas and in-situ measurements, the installable wind power potential is determined. For energy estimation, a fraction of 0.5% land availability has been considered for Andaman & Nicobar Islands, Himalayan states and Northeastern states. For the rest of the states, 2% was identified and considered. However, the potential would change as per the real land availability in each state.
Installable potential at 50 m level
Table 1 22 shows the potential at 50 m AGL from different states of India. The highest estimated state is Gujarat with 10.609 GW, and Karnataka with 8.591 GW and the lowest is Andaman and Nicobar with 0.002 GW.
Wind power potential in India at 50 m above ground level (AGL) (GW). 22
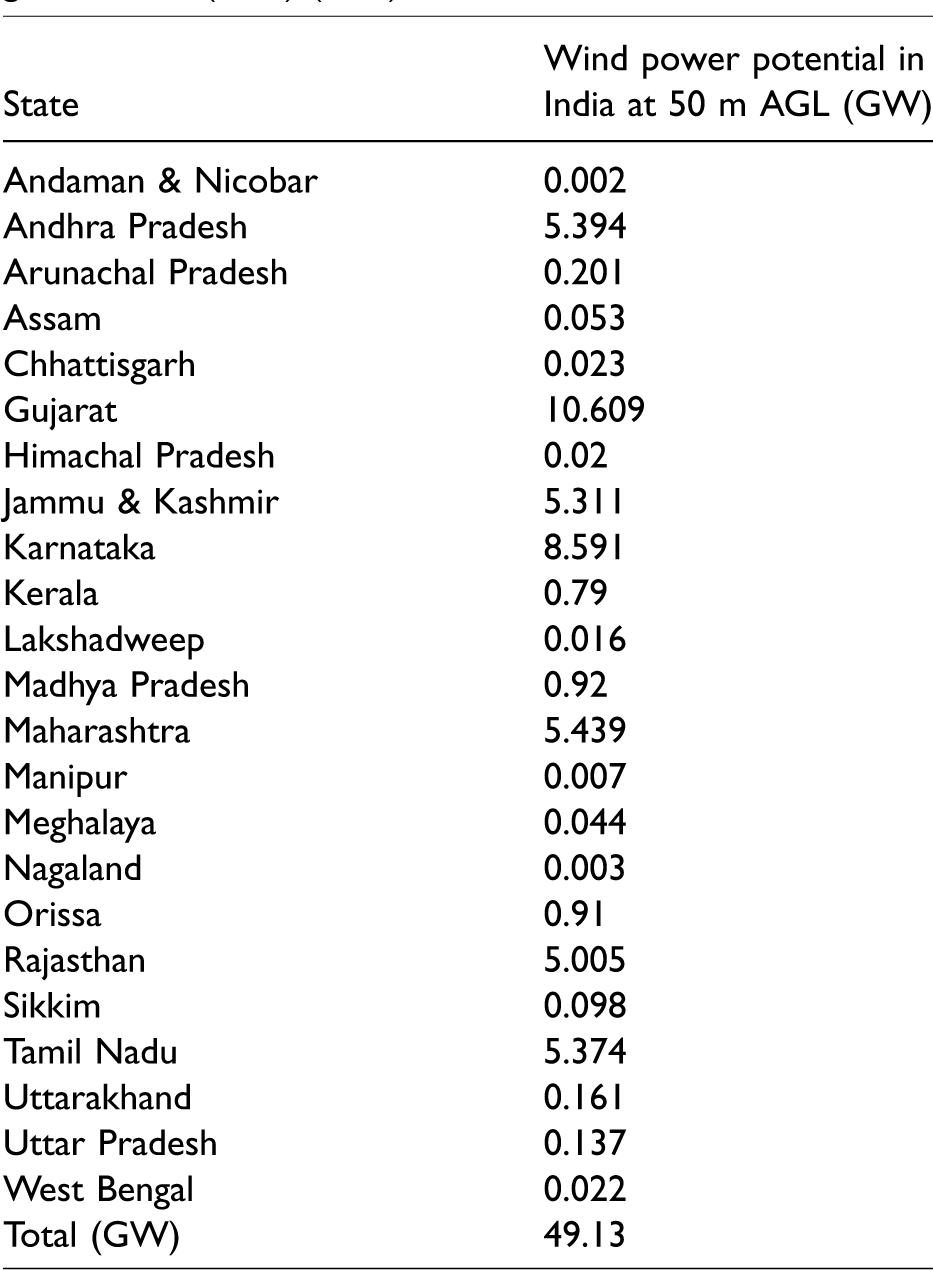
Figure 1 shows the wind power density map at 50 m AGL. From the map, the site-specific air density, wind shear, wind power density, annual energy yield and capacity factors at 50 m AGL can be studied. The map shows the sites that have the potential to install utility wind turbines to generate energy at the lowest cost per kilowatt–hour (kWh). 23

Map showing wind power density at 50 m AGL. 23
Figure 2 shows the state wise wind energy potential of India. The highest wind potential in India centered in the coastal states, except Kashmir with 11% of the distribution potential which is predominantly due to high altitude, increased wind velocity and high-density wind. Gujarat, with 21% wind energy potential, is the top producer, followed by Karnataka, Andhra Pradesh, Tamil Nadu, Rajasthan and Odisha have similar potential distribution. The rest of India represents a minimal potential of <2%, which is distributed through several states with only a few units of turbines. In conclusion, we can say that the primary focus should be on just the seven primary states and regulations should be drafted to attract investment that will generate an unusually high amount of wind power in the future.
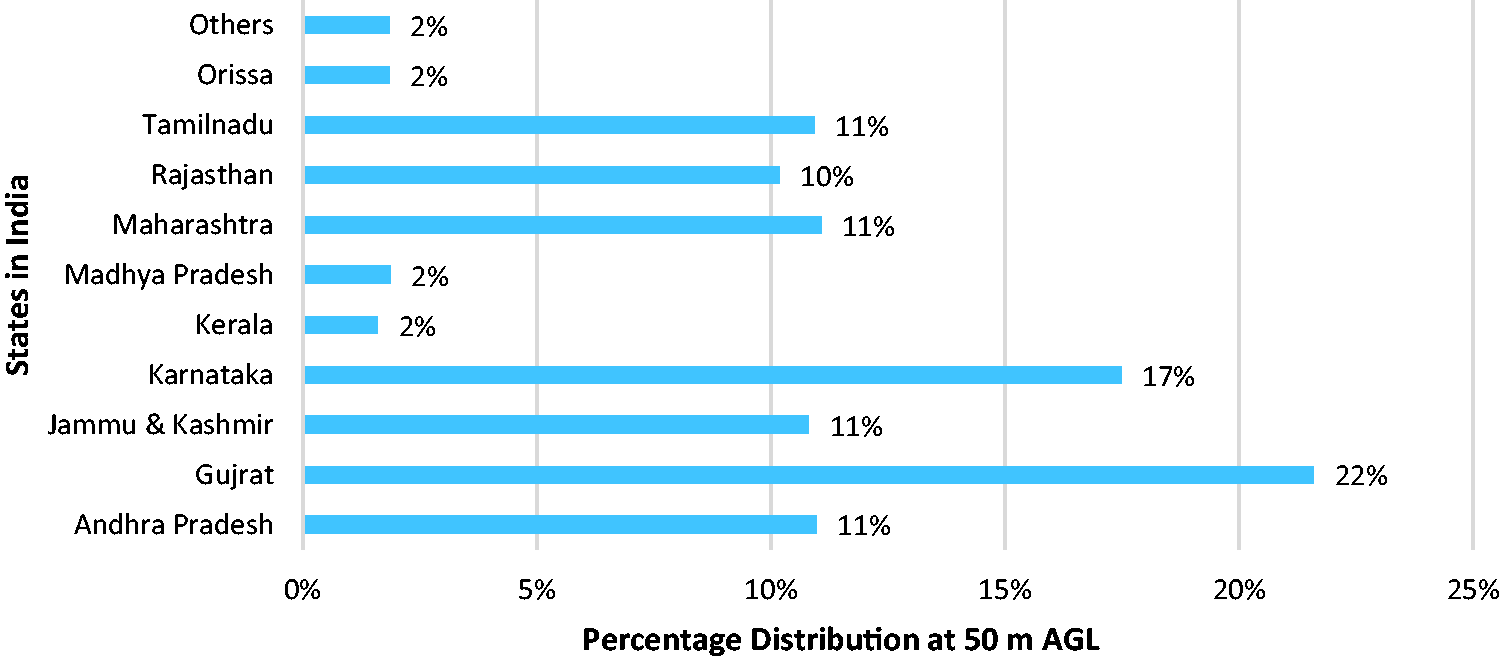
Percentage distribution of wind energy potential in different states at 50 m AGL. 23
Installable potential at 80 m level
The Karlsruhe Atmospheric Mesoscale Model (KAMM) using a large-scale climatology is employed to determine the installable potential of the country. The wind is simulated with the KAMM model using a large-scale climatology; wind atlas files are generated from the simulated winds. Produced mesoscale wind power density map of 80 m level was combined with the wind power density map produced with actual measurements (wherever data are accessible) and re-plotted the final wind power density maps by utilizing geographic information system (GIS) tool. Weightage is provided only for the topographical characteristics of the area. Following the total area of each wind power, density range is determined. Due to several reasons (habitat, forest, water bodies etc.), the complete land area covered by the isopleths cannot be anticipated to be ready for installing wind farms. As land availability evaluation was not a part of the project, the first land availability for wind farm construction is not evaluated for determining the installable potential. Eventually, the potential in the country at 80 m level with clearly stated assumptions is estimated as 102 GW. Wind power potential in India at 80 m AGL is provided in Table 2. The highest potential states are Gujarat (35.071 GW), Andhra Pradesh (14.497 GW), Tamil Nadu (14.152 GW) and Karnataka (13.593 GW). Figure 3 shows the wind power density map at 80 m AGL.24,25
Wind power potential in India at 80 m above ground level (AGL) (GW). 24
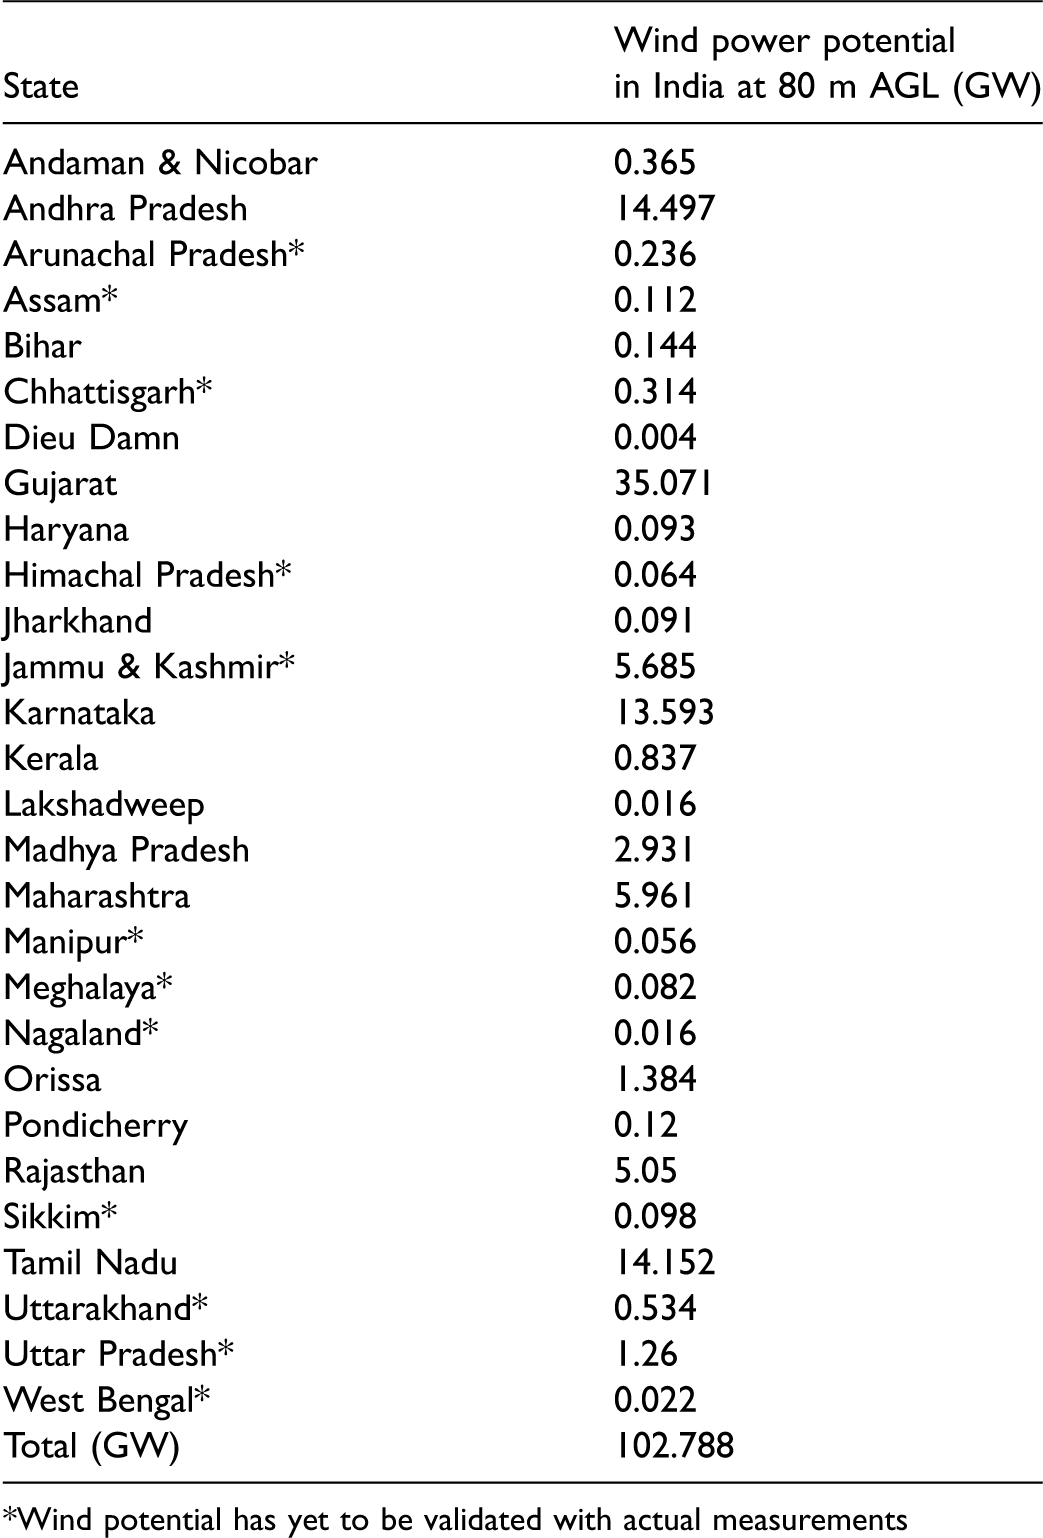
*Wind potential has yet to be validated with actual measurements

Map showing wind power density at 80 m AGL. 24
Figure 4 shows the distribution of wind energy potential in different states at 80 m AGL. Comparing with the 50 m AGL data, it is observed that Kashmir at 50 m and 80 m AGL shows the potential share of 11% and 6% respectively, which is an exception of the coastal areas as discussed earlier. Whereas, Gujarat at 50 m and 80 m AGL shows 21% potential and 34% leading the coastal states respectively.

Distribution of wind energy potential in different states at 80 m AGL. 24
Installable potential (GW) at 100 m level
NIWE has estimated the wind potential of the country and published wind atlas for 50 m, 80 m and 100 m hub heights with the resolution of 5 km in April 2010. The maps are based on mesoscale and micro-scale measurements. These findings were prepared in collaboration with the National Laboratory for Sustainable Energy (RISO-DTU) Denmark. NIWE has adopted advanced modelling methods and revisited this study as per the guidance and directives of MNRE, with realistic and practical assumptions and assessed the wind power potential at 100 m height as 302 GW, which is presented in Table 3.
Wind power potential in India at 100 m above ground level (AGL) (GW). 26

With the corroboration and the advanced meso–macro-coupled wind flow model NIWE carried out the potential estimation at a very large (10 times precise than 5 km) spatial resolution of 500 m. The results show that the highest potential states are Gujarat, Maharashtra, Andhra Pradesh and Telangana. Almost 1300 actual measurements spread all over India, which can be declared as first of its kind. Besides, the study has been performed with exact land availability estimation using NRSC 56 m resolution ‘Land use land cover’ (LULC) Data (AWiFS) 1:250 K scale and with consideration of 6 MW/km2. With proper buffer/set-off, the unfit characteristics of the land for wind agriculture were excluded from the wind potential map. Additionally, roads, railways, protected areas, airports etc., have also been dropped. The lands that were having slope more than 20 m and elevation more than 1500 m were not included in the map. The land characteristics were classified as wasteland (Rank I), cultivable land (Rank II) and forest land (Rank III). Considerable weight of 80% to Rank I, 30% to Rank II and 5% to Rank III has been considered for the estimation. The map has been produced in capacity utilization factor (%CUF) scale and % CUF more than 20% has been recognized for potential evaluation. 26 Figure 5 shows the wind power potential at 100 m AGL of India. The map clearly shows that Gujarat has the highest estimated wind potential followed by Karnataka, Maharashtra, Andhra Pradesh and Tamil Nadu.

Map showing wind power potential at 100 m AGL. 26
The Installed capacity of wind energy in India
Figure 6 shows the installed capacities of wind turbines in major windy states of India. As discussed earlier, seven states of the country, positioned at the southern–western coastal region, enriched with considerable wind potential, make up for over 99% of the total installed capacity. It is observed that Tamil Nadu with 8197 MW ranks first followed by Gujarat and Rajasthan. Currently, Telangana and Kerala joined this list, and the count increased to nine states. It is expected that Tamil Nadu will have 11,900 MW installed capacity, Gujarat 8800 MW at the end of FY2021–2022.
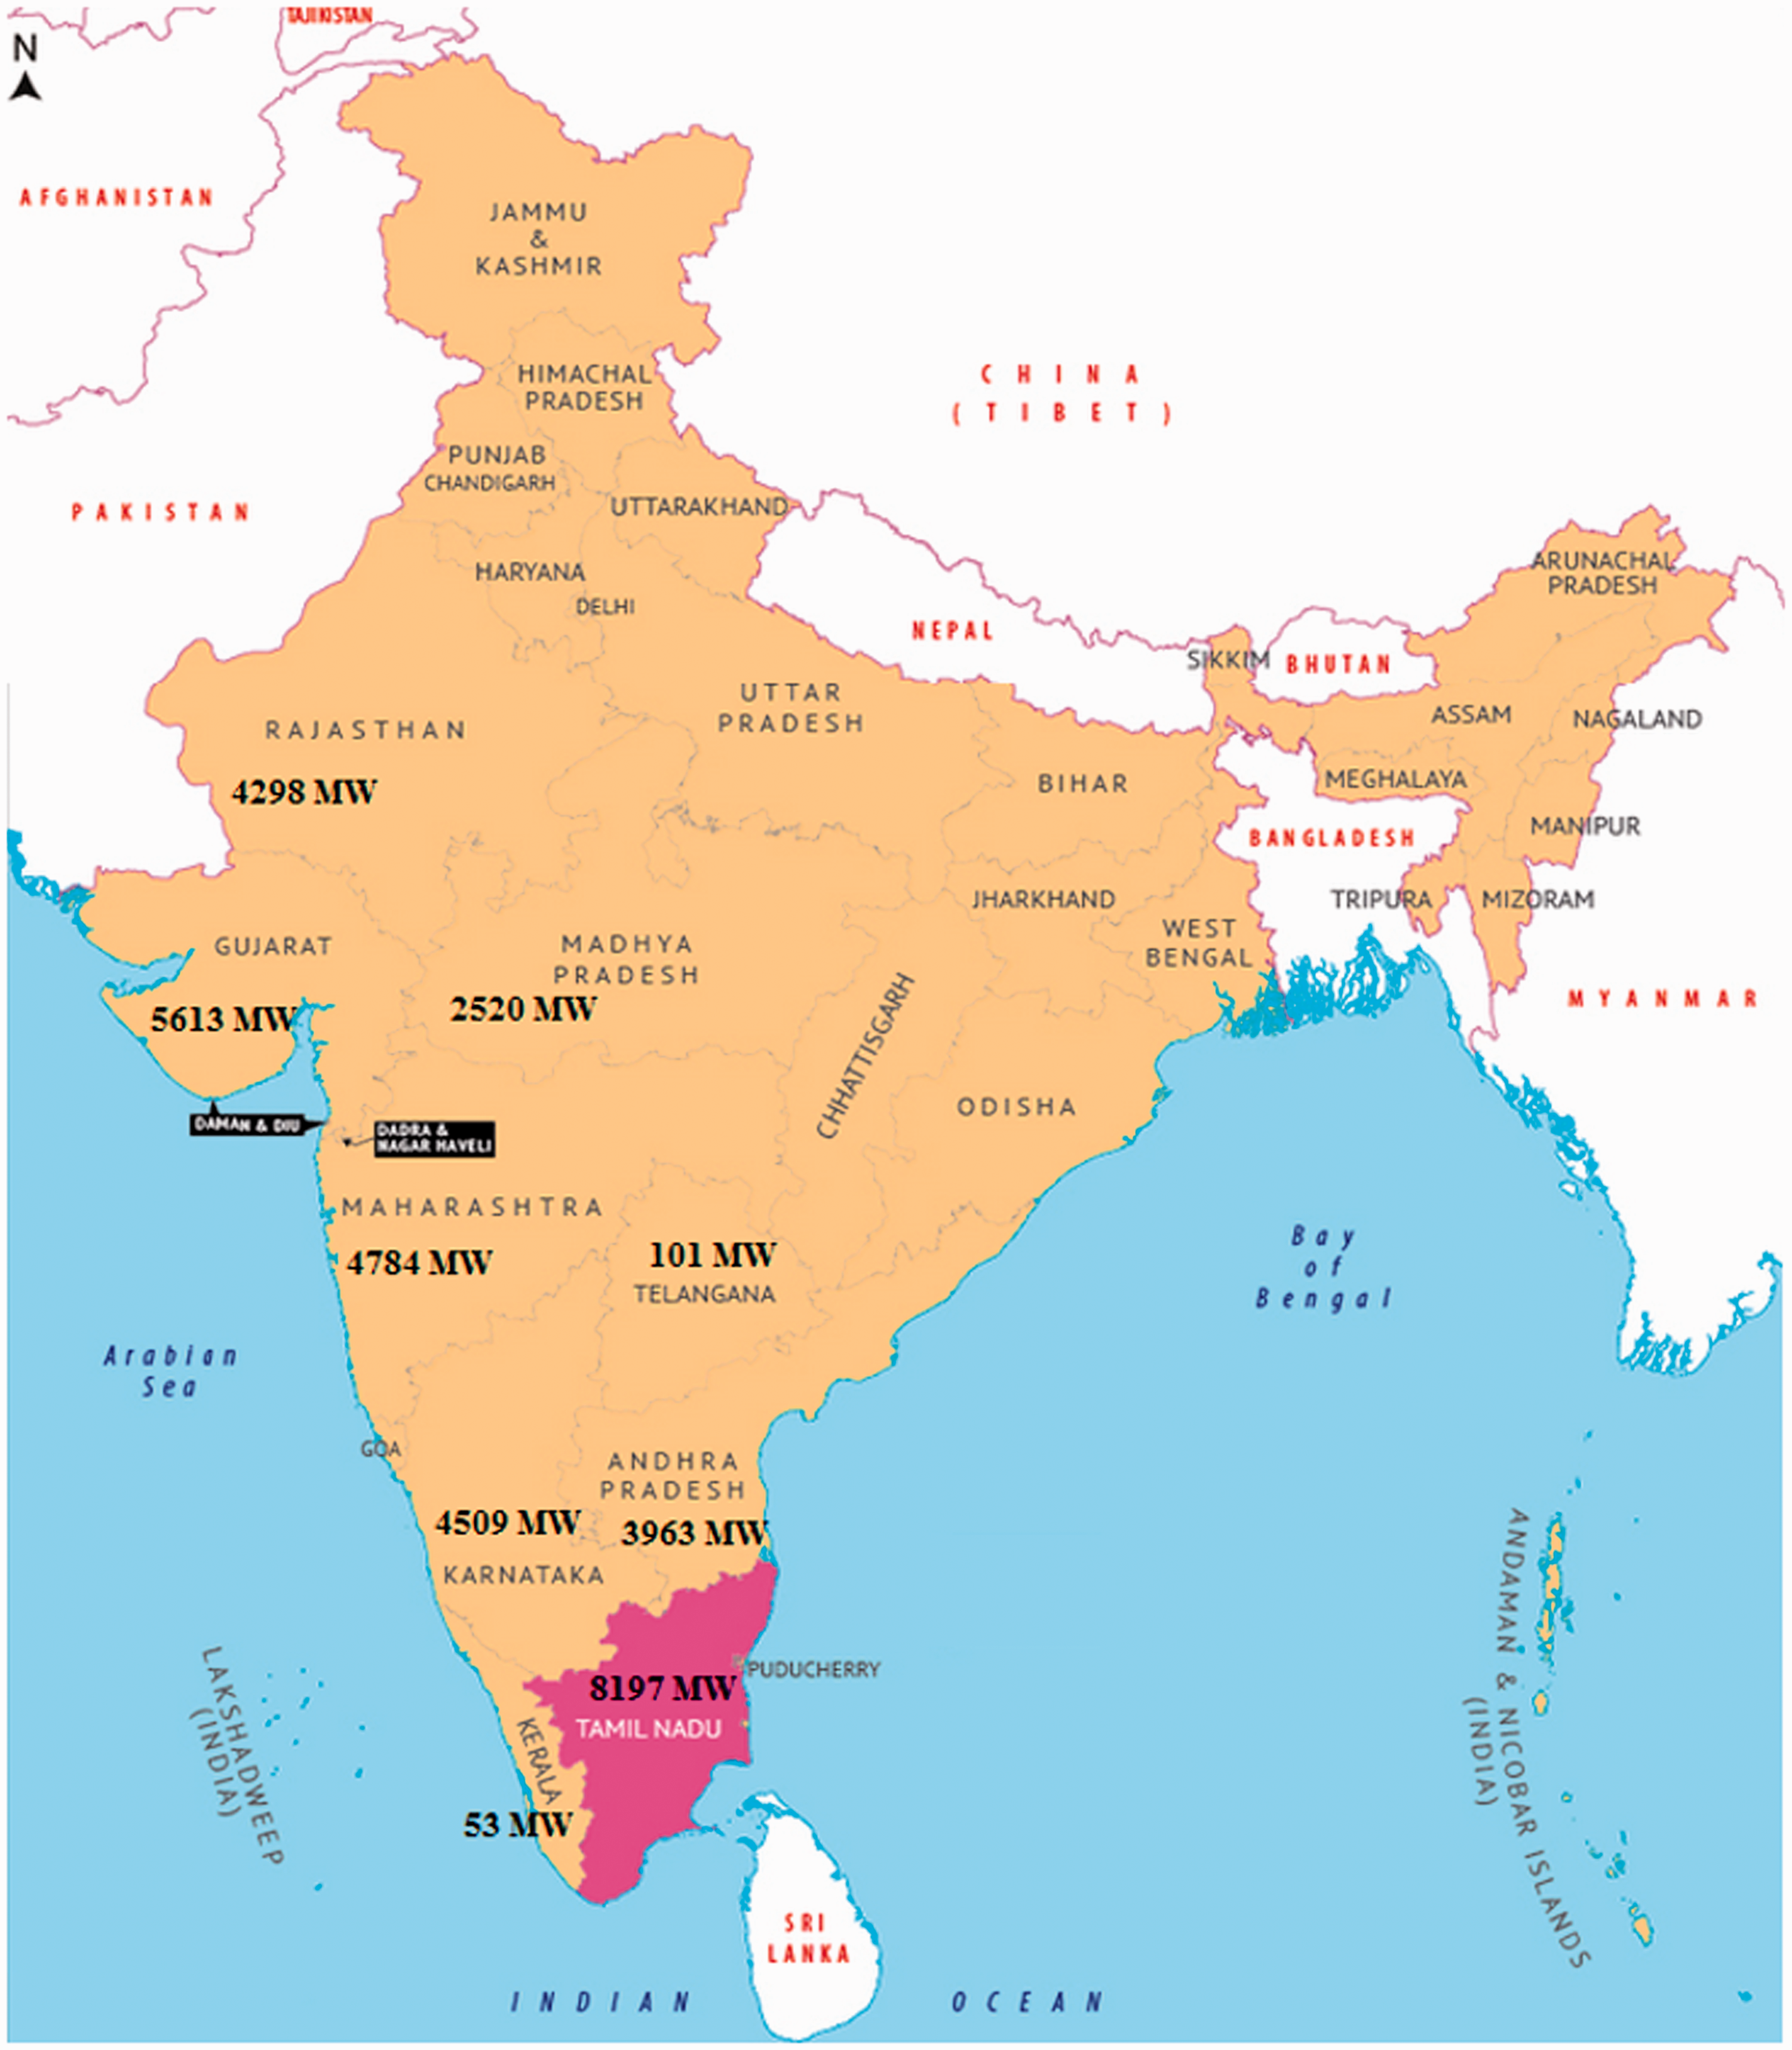
Map showing installed capacities of wind turbines in different states in India-as of FY2018.
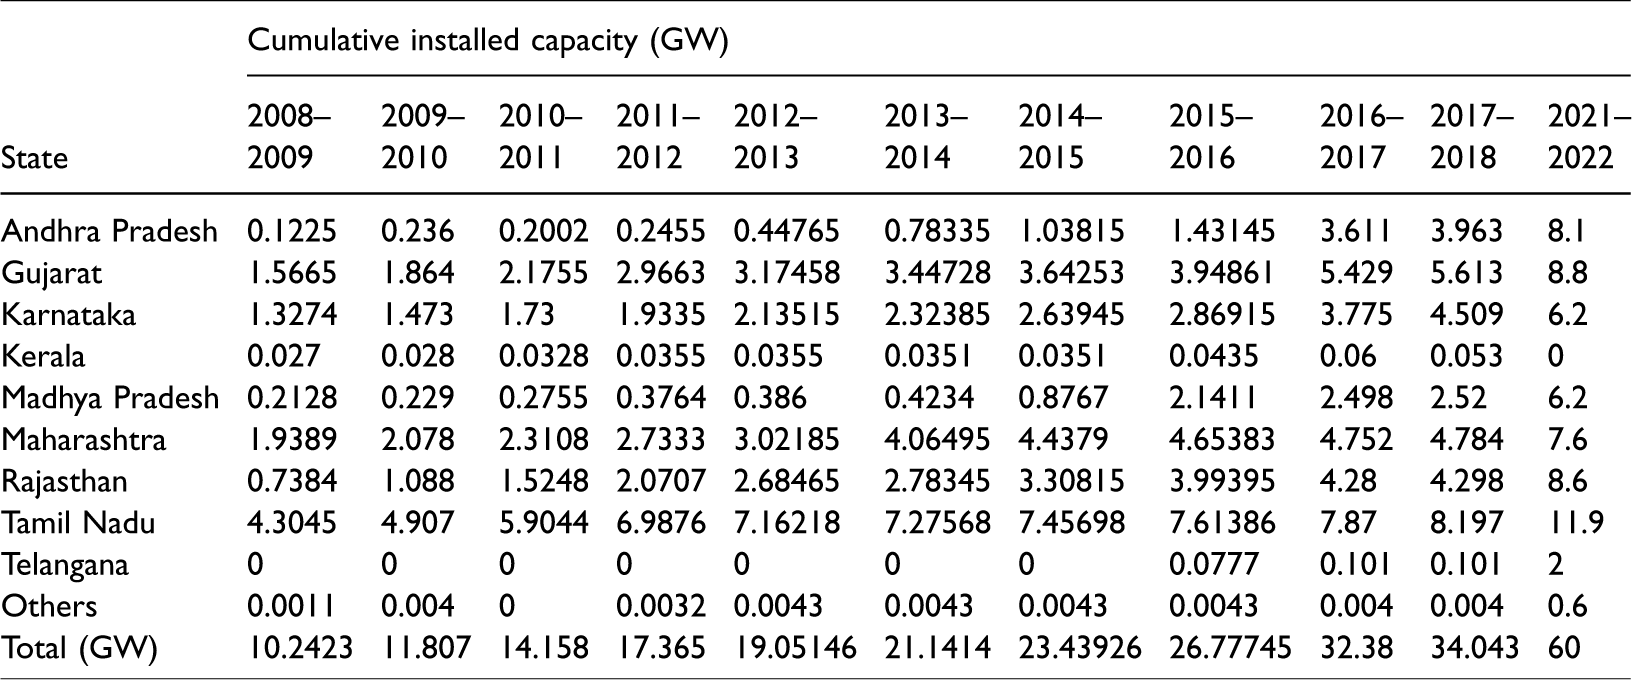
Table 4 shows the wind energy installed capacity from FY2008–2009 to FY2021–2022 and Figure 7 shows the currently installed capacities of wind turbines in different states. It is clear that the target is to reach 60 GW by FY2021–2022. Also, it can be seen that Tamil Nadu is the leader in wind power installation programme with 24.085% share, while Gujarat, Karnataka, Rajasthan and Maharashtra have collectively installed more than 56.42%. Wind power in the seven main states has 99.54% of the total installation. Almost 40% of installations are concentrated in Gujarat and Tamil Nadu, showing that they have crafted the wind energy policy very efficiently and other lagging states have begun developing their policies progressively to attract investors for wind energy installations.27–29

Percentage of installed capacities of wind turbines in different states in India as of FY2017–2018. 29
Figure 8 shows the installed capacities of wind turbines from FY2001–2002 to FY2017–2018, throughout 16 years. As shown in the figure, more than 50% of installations have taken place in the past eight years. The increased wind turbine installation over this period in India reflects the success of the government efforts and policies. In FY2001–2002, it was just 1.667 GW, and by FY2017–2018 it reached 34.043 GW and expected to reach 60 GW by FY2021–2022. 30

Cumulative installed capacities (MW) of wind turbines from FY2001–2002 to FY2017–2018. 30
Utilization of estimated potential and installed capacities
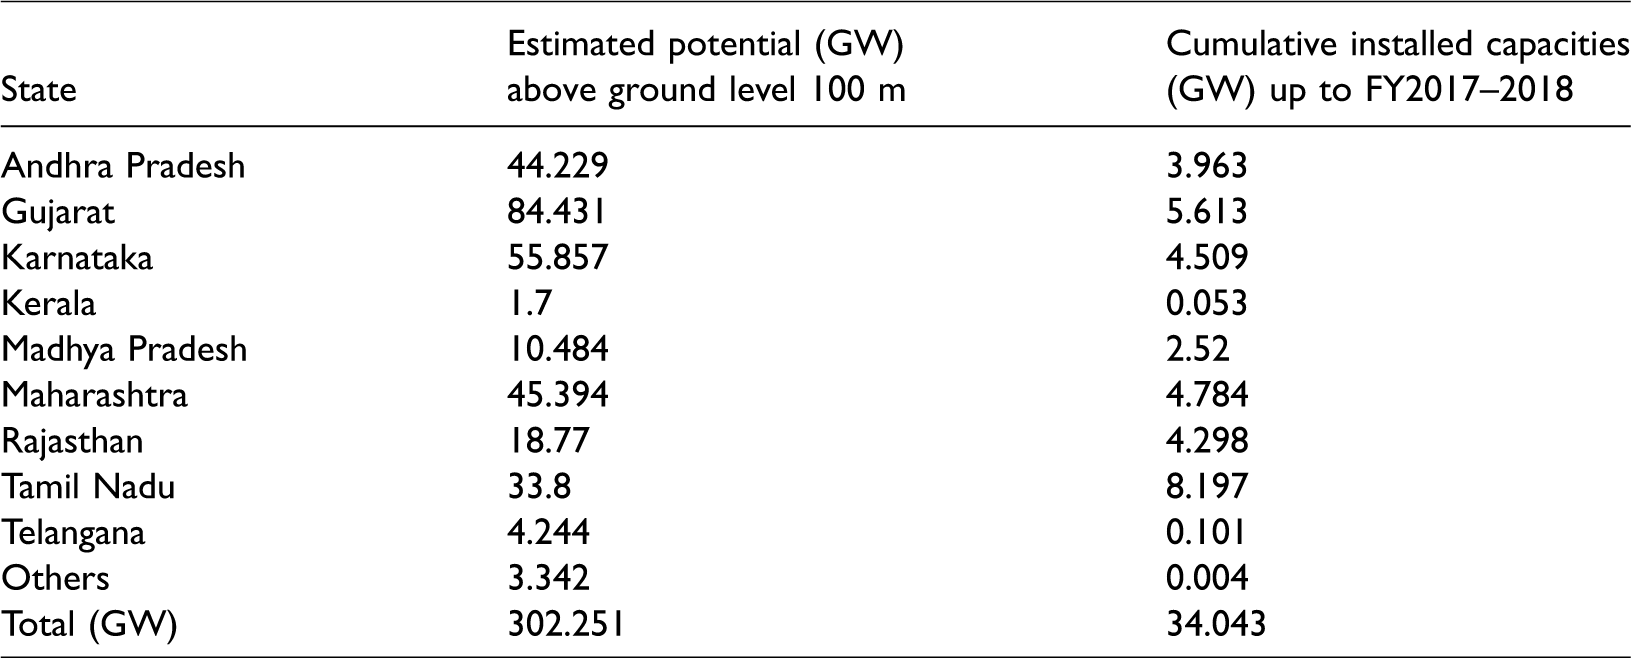
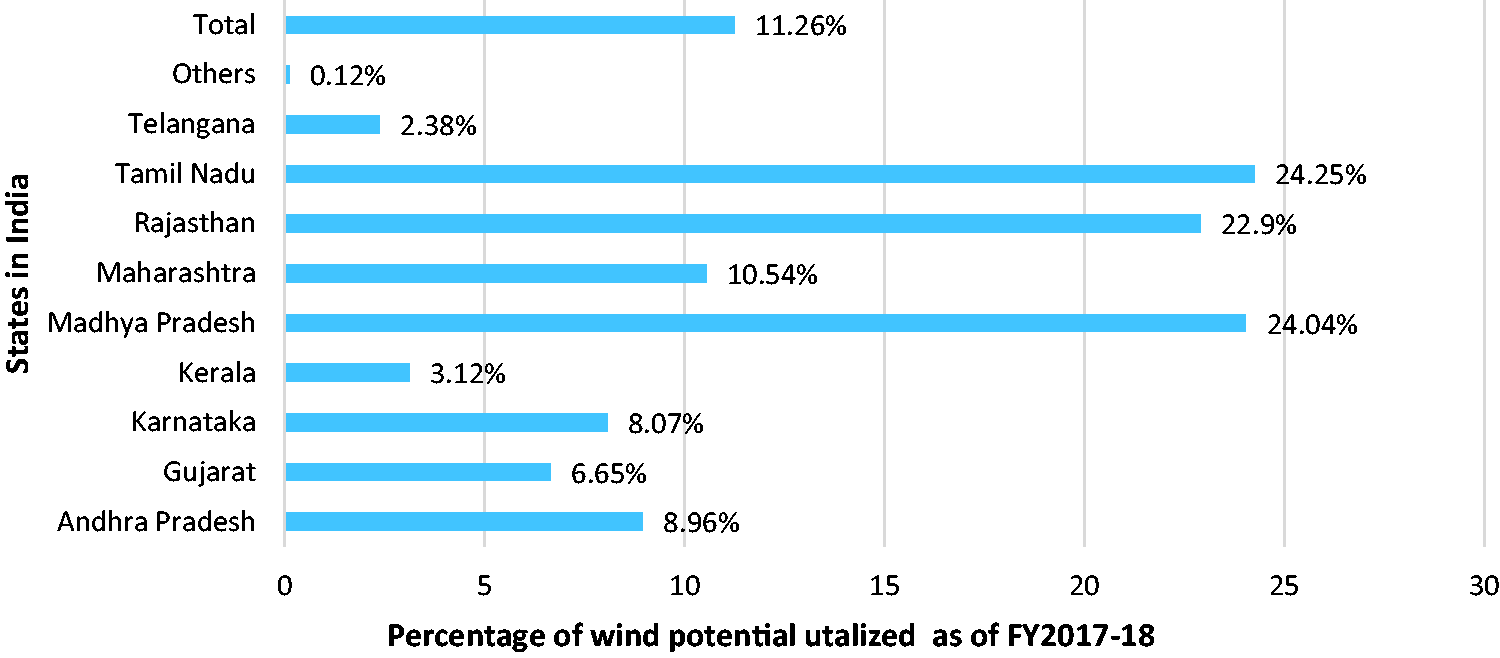
Table 5 displays the comparison of estimated potential (MW) and the cumulative installed capacity up to FY2017–2018. Figure 9 presents that Tamil Nadu utilized 24.25% of the estimated potential, Gujarat 24.04% and Rajasthan 22.9% as of FY2017–2018. Even though the estimated potential is 302.251 GW, the installed capacity is just 34.043 GW as of FY2017–2018, and the wind source has not fully utilized.
The annual wind speed of 3–5 m/s is experienced by the west coast region of the country. The western coastal region (central) and southern coastal areas have higher wind speed (more than 5 m/s) in the months between June to September (monsoon). Hence, western coast states are ideal places for wind harvesting with an average annual high-speed wind.31,32 The studies by the International Renewable Energy Agency (IRENA) in its report on Indian energy outlook 2016 study, submits that the wind power potential in India could be ramped up to 185 GW, an eight-fold rise over 15 years from FY2014–2015. This would require USD 42,000 million worth of investment before 2030. The Global Wind Energy Council (GWEC) predicted the country would have somewhere between 111 GW and 163 GW installed capacity by FY2029–2030.
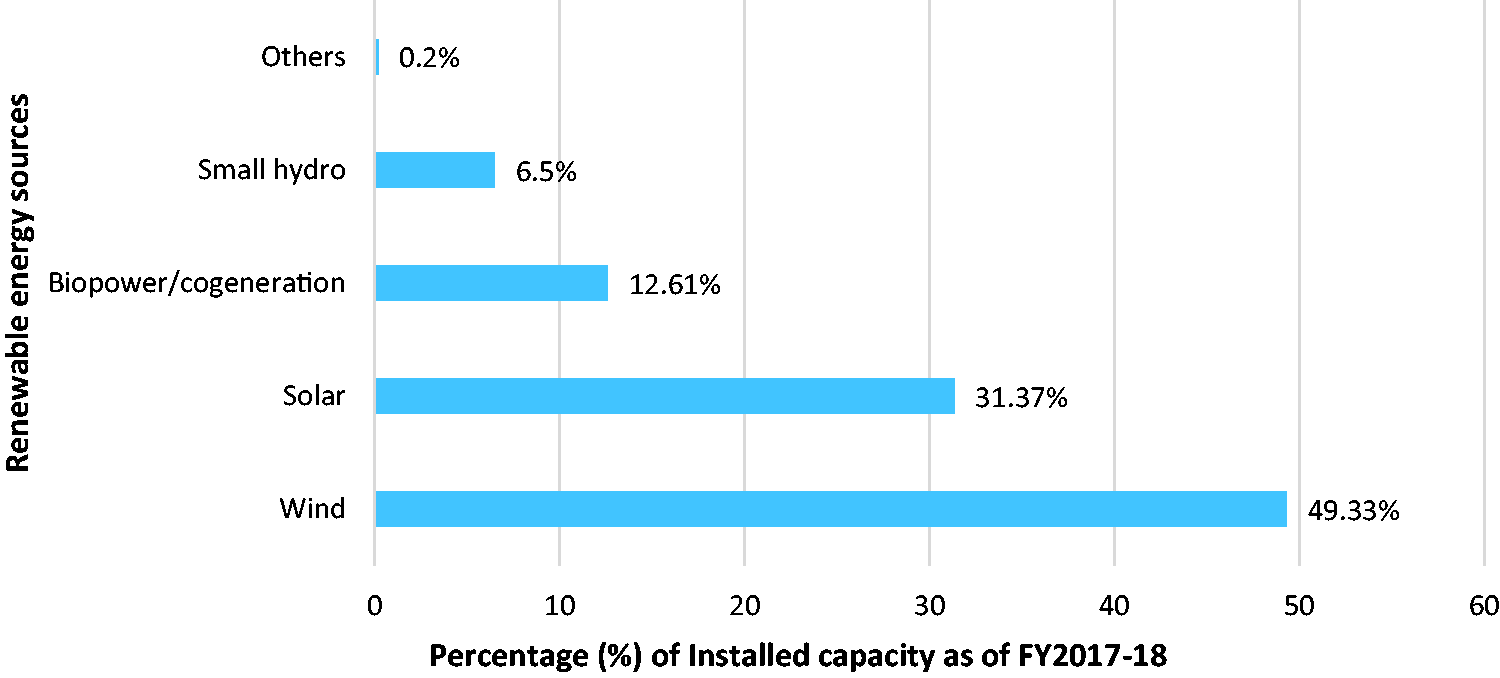
Figure 10 shows the comparison of installed capacity of wind with other renewable sources. It is noted that wind energy has 49.33% installed capacity (34.046 GW) followed by solar with 31.37% (21.65148 GW), biopower with 12.61% (8.70080 GW), small hydro with 6.5% (4.48581 GW) and waste to energy 0.2% (138.30 MW). The country is moving towards wind/wind–solar hybrid-based power generation to tap both technologies efficiently. 33
Comparison of the installed capacity of wind with other renewable sources (percentage) (FY2017–2018). 33
Capacity addition
Table 6 shows the wind capacity addition target and achievement. It is interesting to note that in FY2015–2016 and FY2016–2017, it exceeded the target. Whereas, in FY2017–2018 the target was not achieved due to the lower wind. The addition of only 1.7 GW in FY2017–2018 is a notable decline from the 5.4 GW capacity added in FY2016–2017. This decline was driven by a transition from the existing FIT-based power purchase agreement (PPA) regime to a competing bid-based PPA regime, following the considerable decrease in tariffs determined through the competitive bidding route against the earlier FIT regime. Now the wind sector is on a growth trajectory with a healthy order pipeline.34,35 The target for FY2018–2019 is 5.300 GW, FY2019–2020 is 6.0 GW, FY2020–2021 is 6.7 GW and FY2021–2022 is 7.356 GW.
Capacity additions: target and achievements (GW) from FY2007–2008 to FY2017–2018. 34
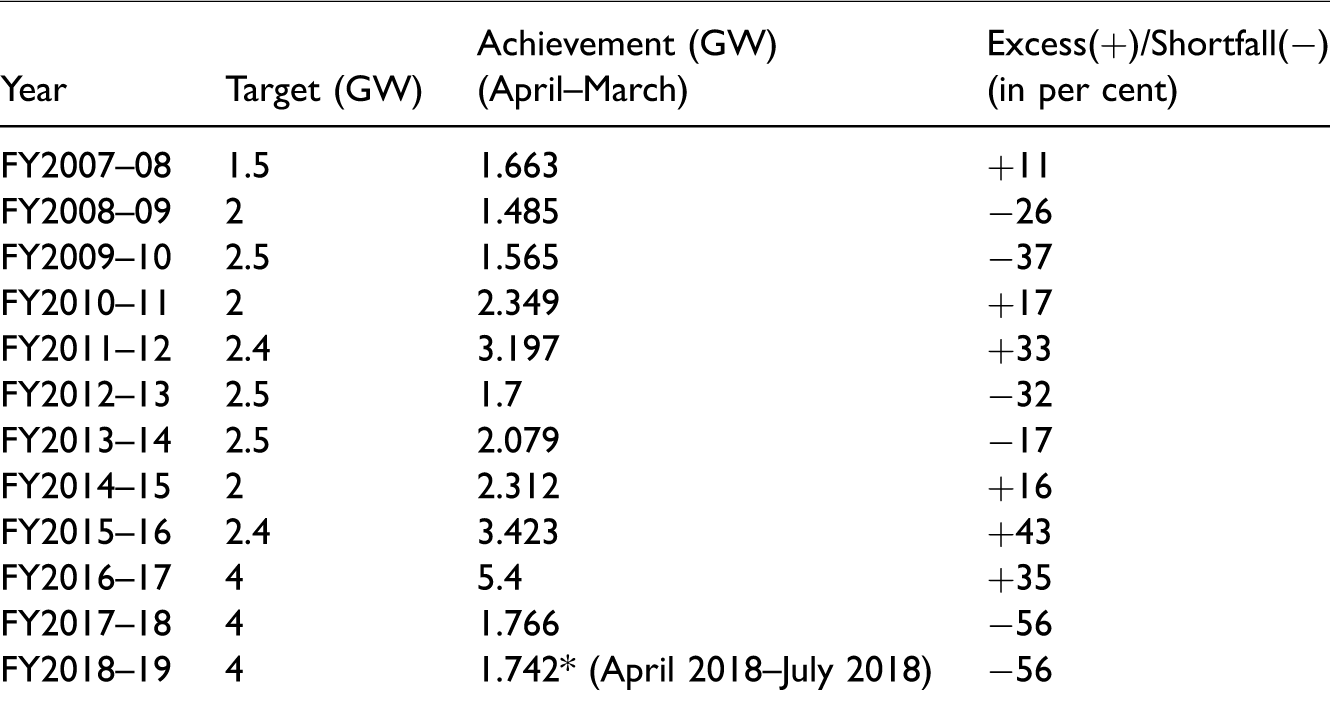
In FY2017–2018, the wind-based capacity addition was widely seen in the states of Karnataka which added 758 MW, Andhra Pradesh added 344 MW, Tamil Nadu added 336 MW and Gujarat added 273 MW. With this, the wind-based generation capacity has progressed to 34.0 GW as of 31 March 2018, against 32.3 GW as of 31 March 2017. The wind industry added 1.5 GW and 3 GW per annum between 2006 and 2015.
Projection of installed capacity
Figure 11 shows the past, present and future capacity addition and cumulatively installed capacity details. The capacity addition target for the 11th five-year plan in India (2007–2011) was 10.5 GW, and the target not achieved. The capacity addition target for the 12th five-year plan in India (2011–2016) was 11.8 GW and achieved more than its target to 12.711 GW. 36 In 2017, the installed capacity was 30.8 GW which increases to 34.043 GW in FY2017–2018, and it is expected to show 40 GW by the end of FY2018–2019. According to the World Resources Institute, the pace of addition will be supported by updated guidelines in the policy and the initiation of competitive tariff bidding in wind energy auctions.
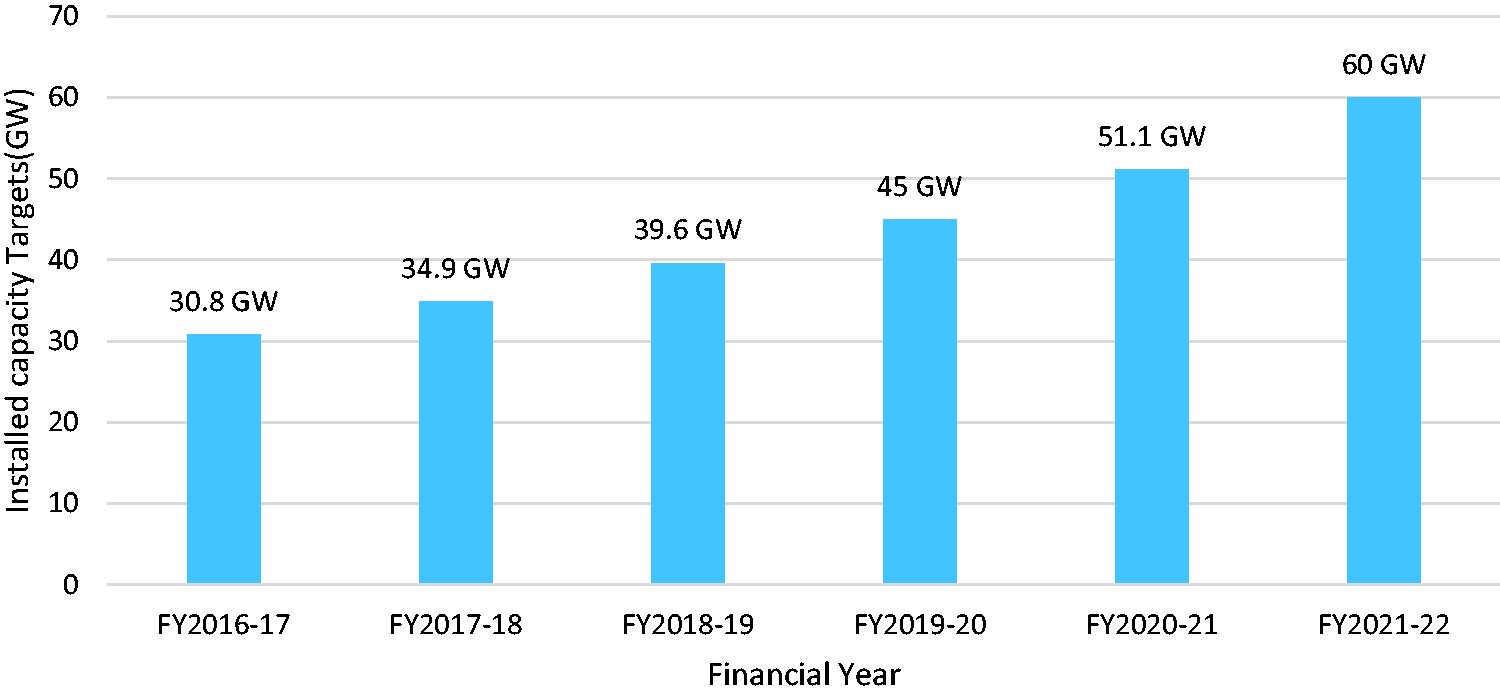
Cummulative target of Installed capacities (GW) of wind turbines from FY2016–2017 to FY2021–2022. 36
Electricity generation through the wind in India
The Central Electricity Authority (CEA) of the country has started collecting the renewable energy generation data since the FY2014–2015. The state-wise quantum of electricity produced from wind energy during FY2014–2015, FY2015–2016, FY2016–2017, and FY2017–2018 are shown in Table 7. As expected, Gujarat and Tamil Nadu are the leading states with 9160.9 MU and 11,930 MU, respectively.
The state-wise quantum of electricity produced from wind energy (MU) during FY2014–2015, FY2015–2016, FY2016–2017 and FY2017–2018. 37
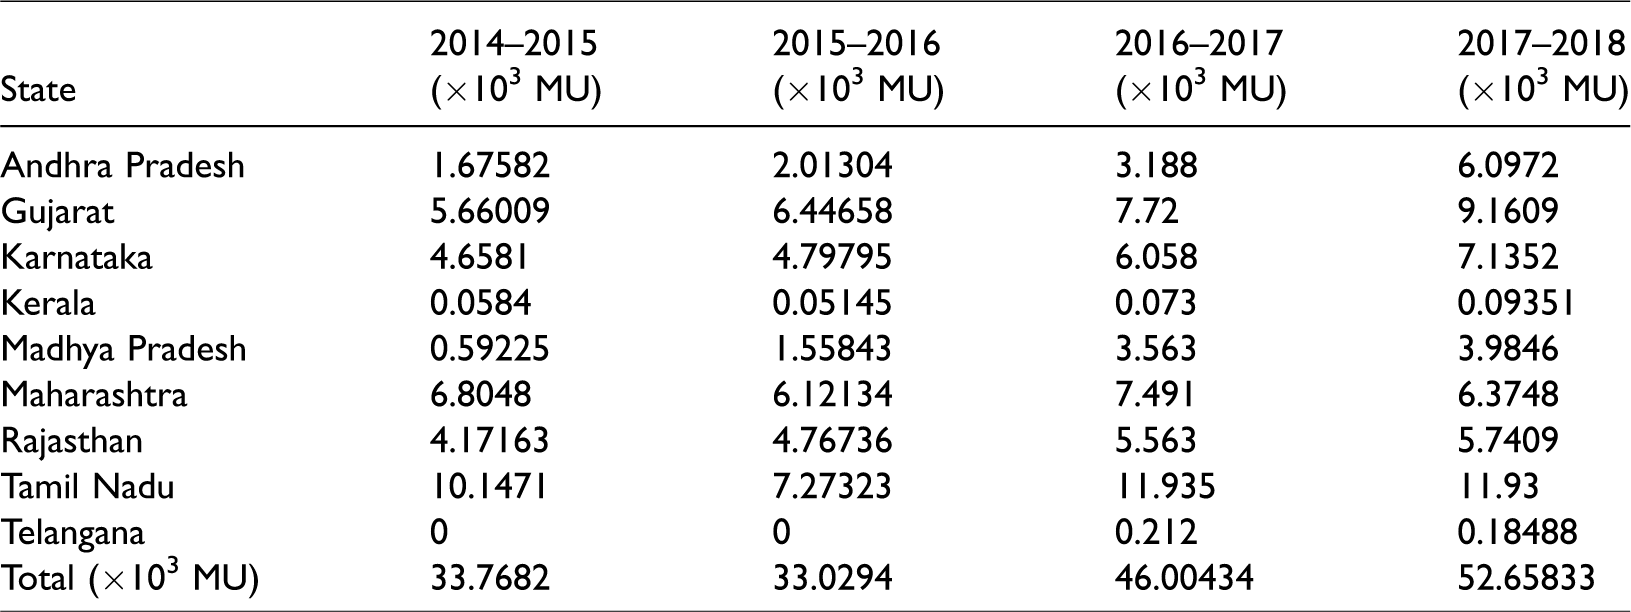
Table 8 shows the month-wise quantum of energy produced from wind energy from FY2014–2015 to FY2017–2018. It is noted that June, July, August and September are the months that have generated high electricity through wind energy, which is also the months with highest wind. 37
The month-wise quantum of energy produced from wind energy (MU) during FY2014–2015, FY2015–2016, and FY2016–2017 and FY2017–18. 38

The contribution of wind energy in the total renewable generation during FY2014–2015, FY2015–2016, FY2016–2017 and FY2017–2018 was 55%, 50%, 56% 53%, respectively. For FY2017, till February the total renewable energy production was 93207.99 MU and electricity generation from wind was 49751.57MU, which is shown in Figure 12.38–41 Clearly for FY2017–2018, solar contributed 24%, Bagasse 11%, biomass 3% and other 1%.
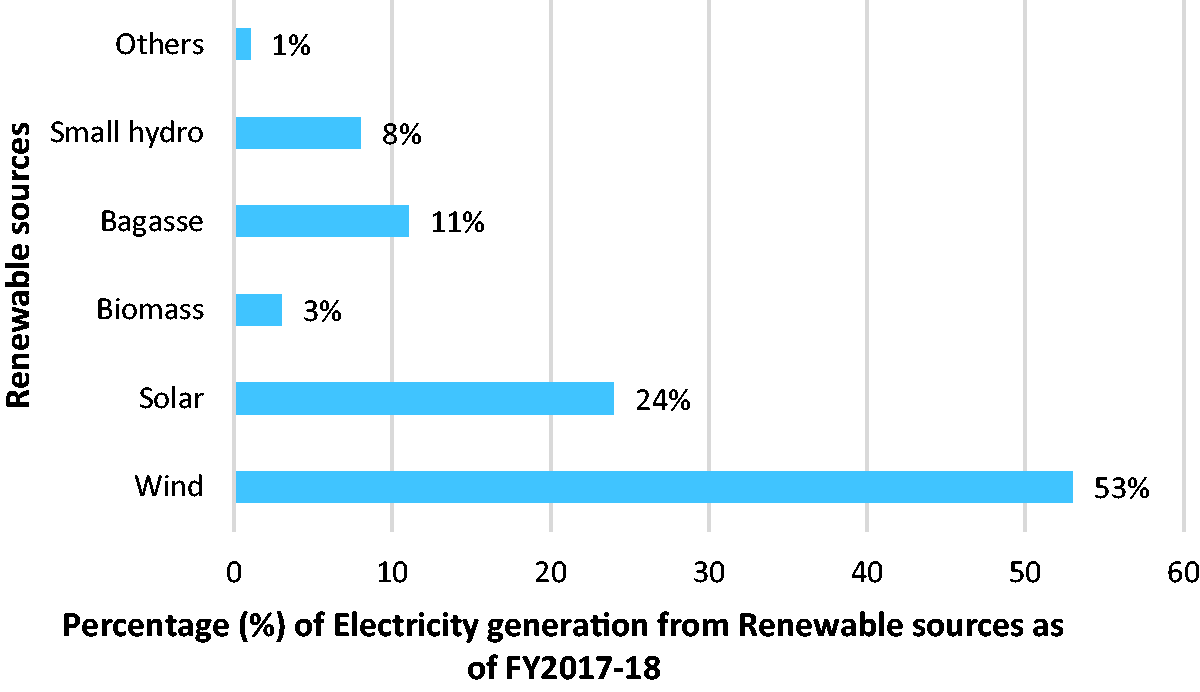
Comparison of electricity generation from wind with other renewable sources (percentage) (FY 2017–2018). 39
A summary of all the wind-based energy companies in India
Global wind turbine OEMs
The top 10 companies of the ‘world ranking’ added 43 GW, representing 76% of the global market, and amounting to nearly 20,000 turbines. Their cumulative capacity at the end of 2016 added up to 380 GW, more than three-quarters of the worldwide total which is shown in Figure 13. Vestas with 82.9 GW is the global leader followed by Siemens Gamesa Renewable Energy (SGRE), General Electric (GE). Indian company Suzlon is also listed in the global top ten ranks, which has shown 1.1 GW of the wind installed capacity. 42
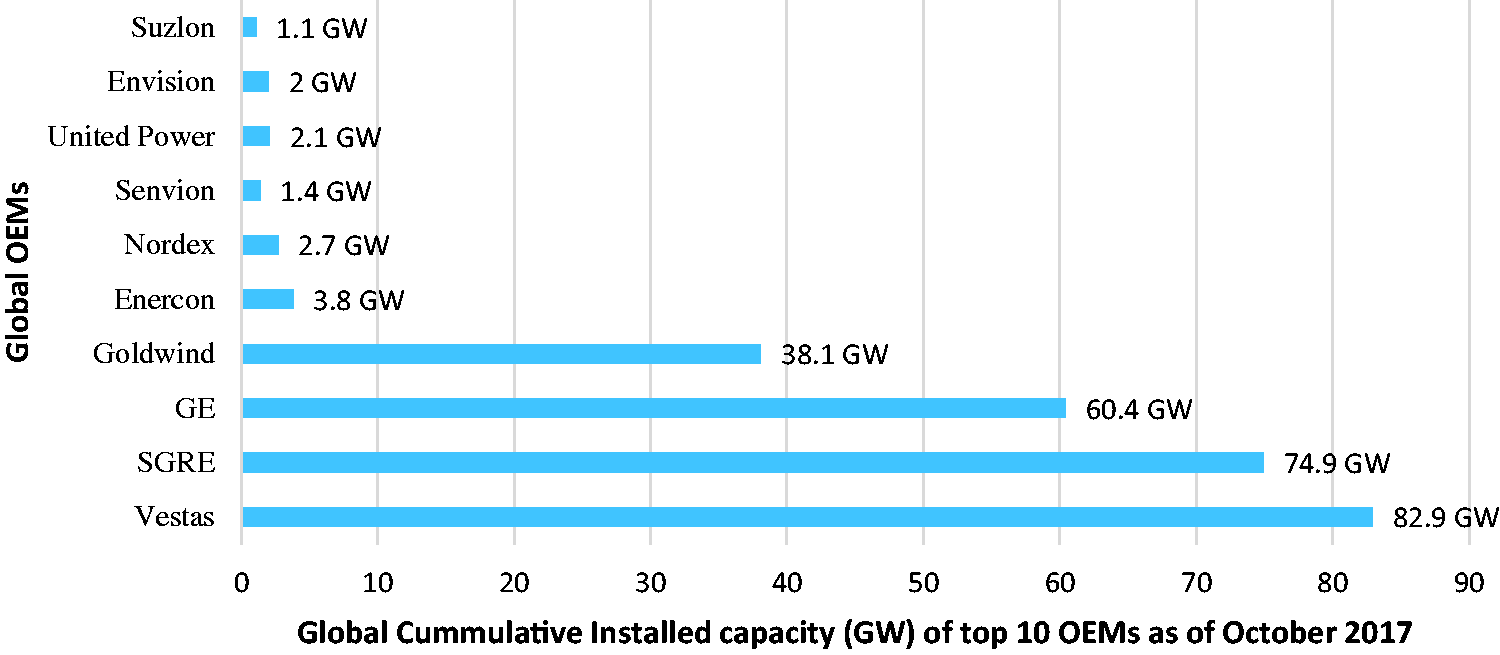
Global wind turbine cumulative Installed capacity (GW) of top 10 OEMs as of October. 42
Suzlon and global market
India’s leading domestic turbine maker, Suzlon energy limited finding a place among the world’s top 10 players on the back of its record and the future outlook of its national market. It installed 1.14 GW in 2016, placing it 16th in FTI’s table of leading wind turbine suppliers. But it lies eighth regarding cumulative capacity, with 16.8GW of turbines operating in North and Latin America, Europe and Australia. India’s ambitious wind targets offer ample opportunities for growth, not least in repowering, but other manufacturers are eyeing the market, and Suzlon will have to up its game on the technological front.
Wind turbine models and manufacturers in India
Table 9 covers the wind turbine manufacturers, collaborations/joint ventures and models. Acciona wind power manufactures wind turbine with 125 m diameter (largest) and Nupower with 141 hub height (largest). There are two type of tower manufactured by different companies: Tubular type and lattice type. The capacity values range from 500 kW to 2800 kW. Some of the companies manufacture in collaboration and joint ventures. Around 18 Indian manufacturers possessed valid type approval certificate and declared that the produced wind turbine models comply with CEA technical standards for the connectivity to the grid. There are four more manufacturers (Para Enterprises, Shriram EPC Limited, Siva Wind Turbine India Private Limited, Southern Wind Farms Limited) having approval but the wind turbine models do not comply with CEA standards. The CEA issues the technical rules for connectivity to the grid on 15 October 2013. 43
Wind turbines models and manufacturers in India as of FY2017–2018. 43

Table 10 shows the product class segmentation which covers the product size (range) and number of wind turbine generators (WTGs). There are around 942 WTGs of different make and type were commissioned and installed. Siemens Gamesa developed the largest commercial hybrid wind–solar project, which is India’s first most massive hybrid project with 50 MW wind farm connected to 28.8 MW solar facility.
Product class segmentation for FY2017–2018. 44
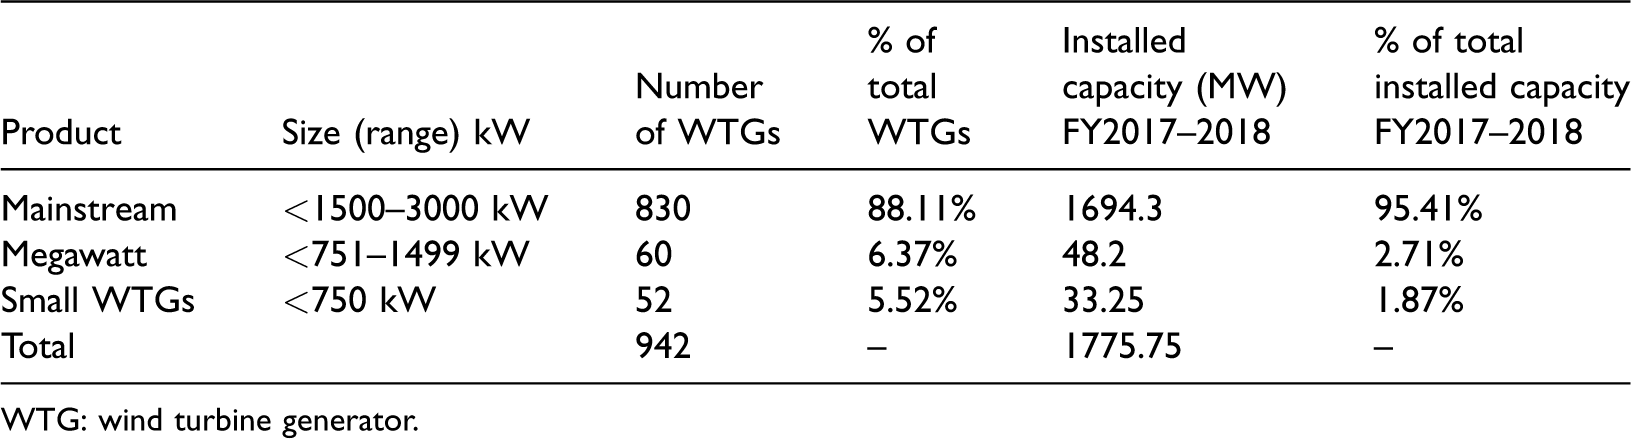
WTG: wind turbine generator.
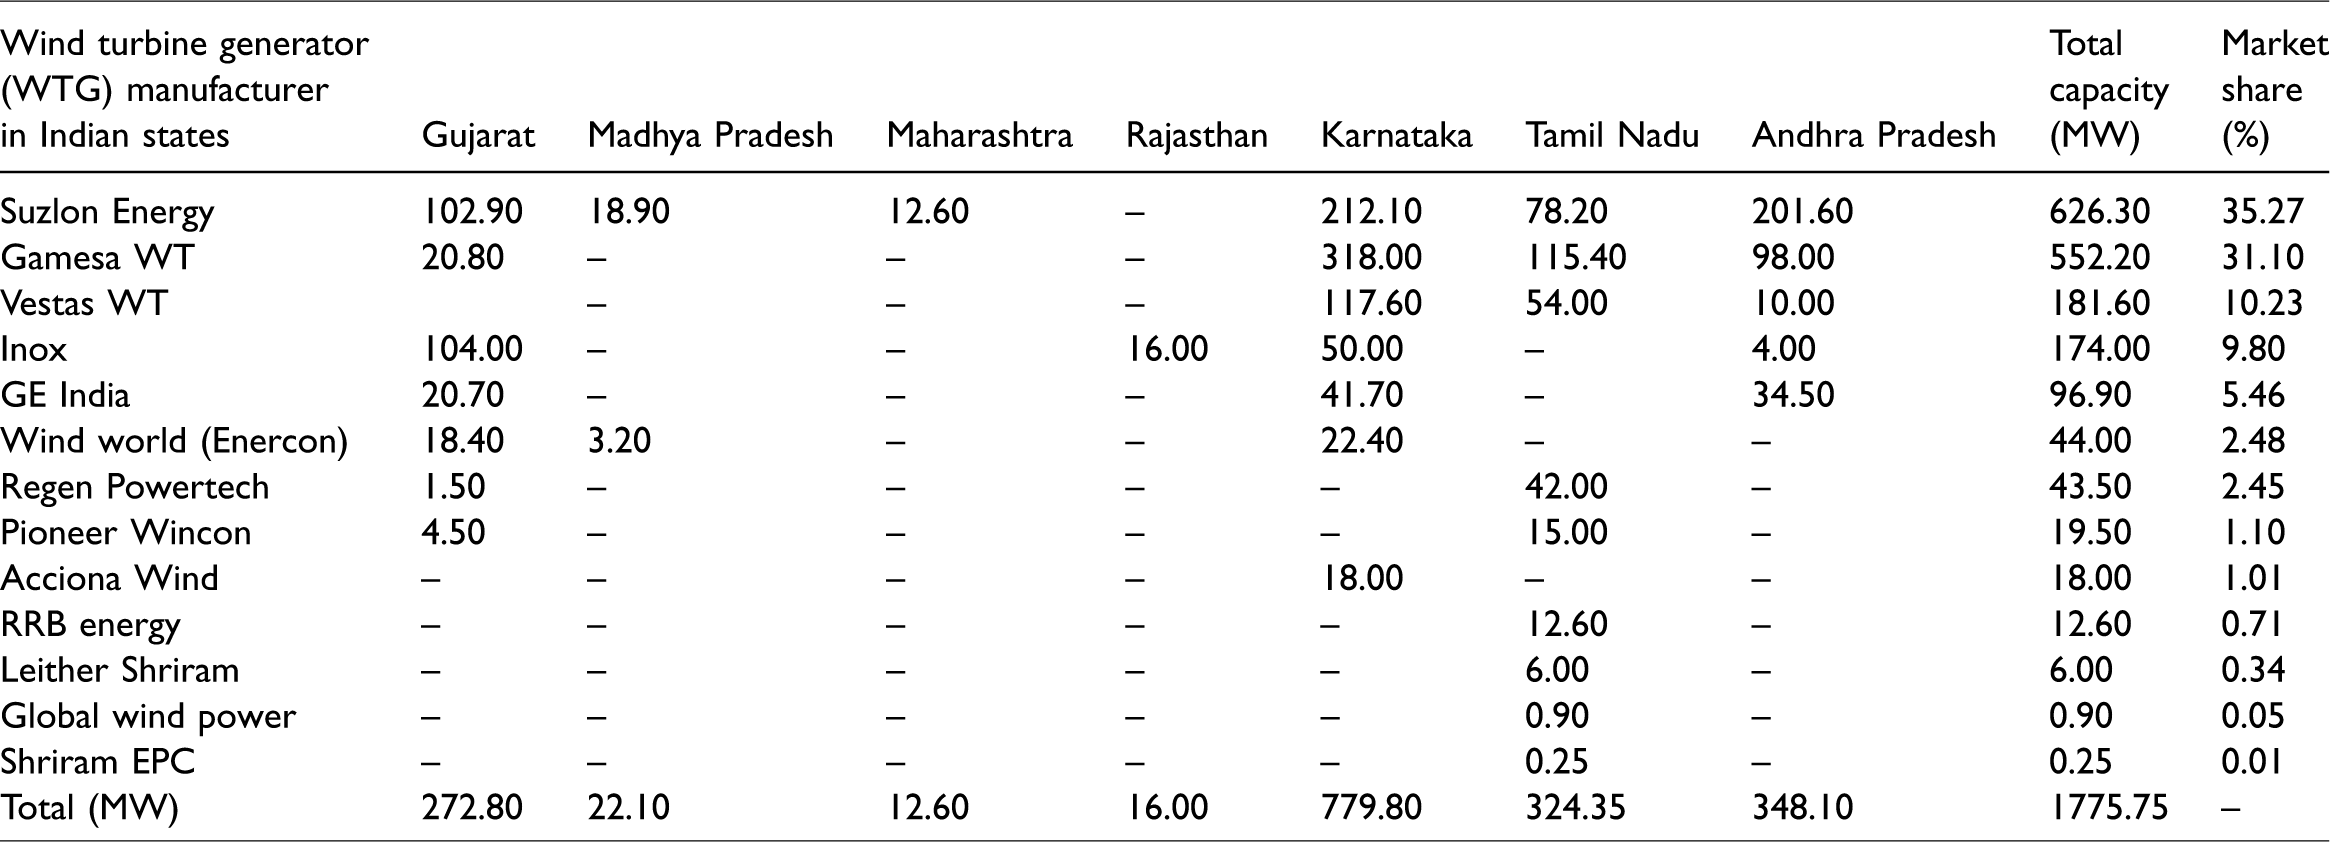
Table 11 shows the market share of OEMs for the FY 2017–2018. Around 13 OEMs added capacity, and the top five OEMs who added capacity close to 100 MW each are Suzlon Energy Limited, Gamesa Renewable Private Limited, Vestas Wind Technology India Private Limited, Inox Wind Limited and GE India Industrial Private Limited. 44 Figure 14 shows the top OEMs in India who have a cumulative installed capacity exceeding 1 GW in India.
Market share of original equipment manufacturers for the FY2017–2018. 44
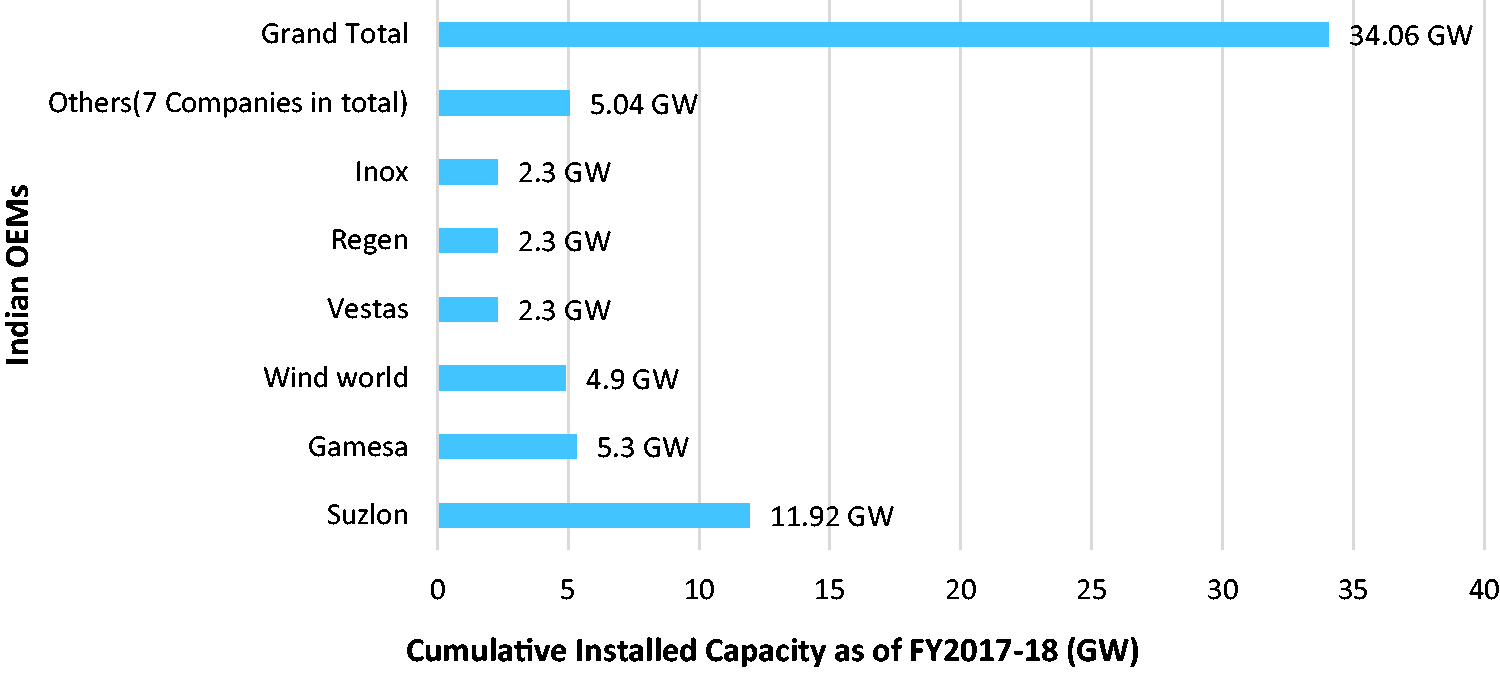
Top OEMs in India having the cumulative installed capacity exceeding 1 GW in India. 44
Market share of OEMs
Top OEMs are (1) Suzlon Energy Limited, (2) Wind World India Limited, (3) Regen Powertech Private Limited, (4) Inox Wind Limited, (5) Orient Green Power Limited, (6) Indowind Energy Limited. Top International players are (1) Vestas India, (2) Enercon India Private Limited, (3) Gamesa Wind Turbines Private Limited, (4) GE Wind Energy Limited.45–48 Many wind power OEM firms can produce wind turbines and the main challenge lies in developing technologies to meet the demand for mega-turbines in the future. Figure 15 shows the installed capacity of OEMs in India as compared with Suzlon. From complete Indian wind market installation of ∼34.046 GW till date, Suzlon’s cumulative installed wind capacity is ∼11.922 GW making it indisputable market leader. The company has stayed near the peak of the yearly commissioning leaderboard during its 23 years of history with its perfection in technology and end to end business contribution.49,50
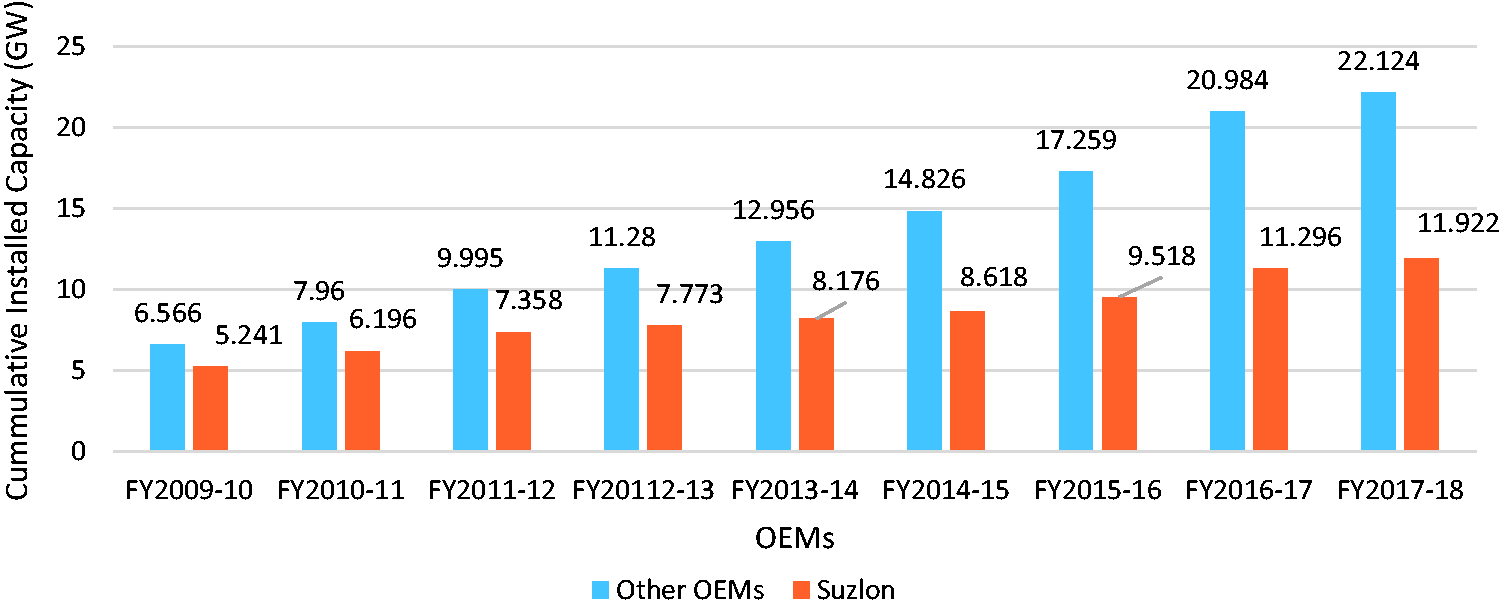
Installed capacity (GW) of others OEMs in India with Suzlon OEM (India) from FY2009–10 to FY2017–2018. 48
Global status of India in wind power
Global on shore installed capacity
According to the status of the global wind energy markets report till December 2009, the top five countries regarding installed capacity are Germany (22.3 GW), the US (16.8 GW), Spain (15.1 GW), India (7.8 GW) and China (5.9 GW). Regarding economic value, the global wind market in 2007 was worth about €25 billion (USD 37 billion) in new generating equipment and attracted €34 billion (USD50.2 billion) in total investment.
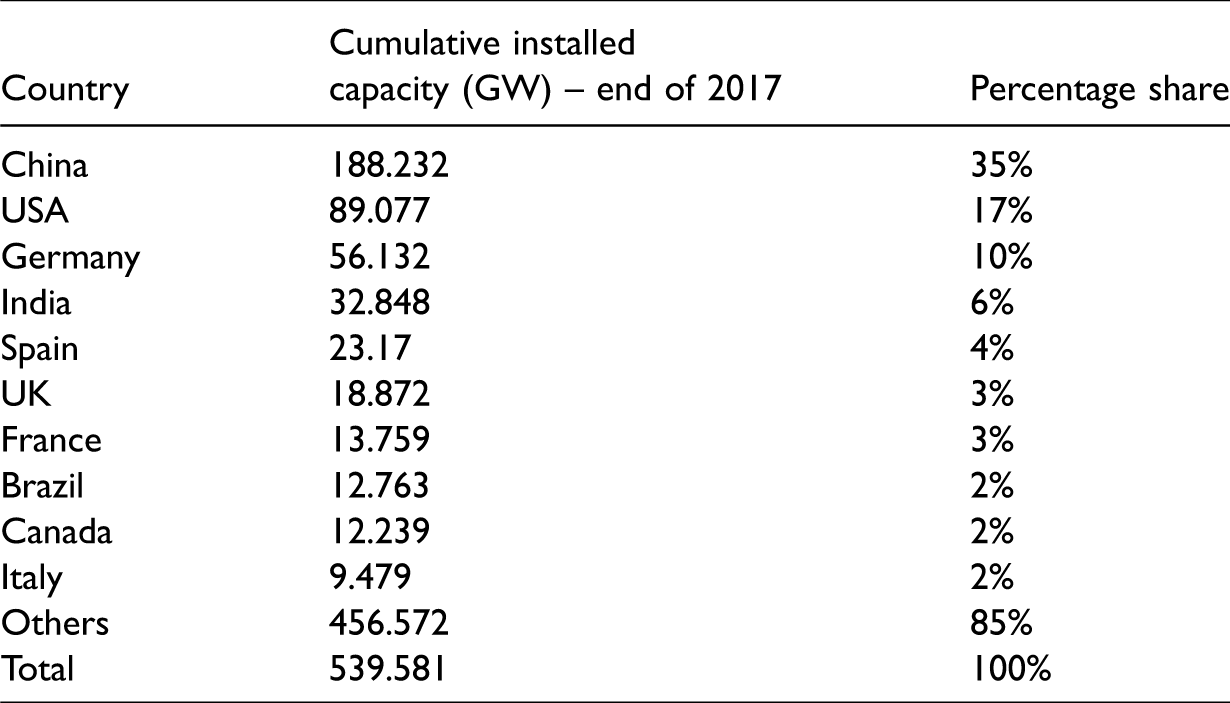
Figure 16 shows the global wind installed capacity from end of 2001 to end of December 2017. This is based on the GWEC report, 2017 which released its annual market statistics on 14 February 2018. It illustrates that there is a significant increase in the installed capacity with the global total of 539.581 GW. China is ranking first with 188.232 GW, followed by USA (89.077 GW), Germany (56.132 GW) and India (32.848 GW). The share of India in global wind installed capacity was 6% which is shown in Table 12. It is noted that China shown a 35% share, followed by the USA with 17% and Germany 10%.51–53
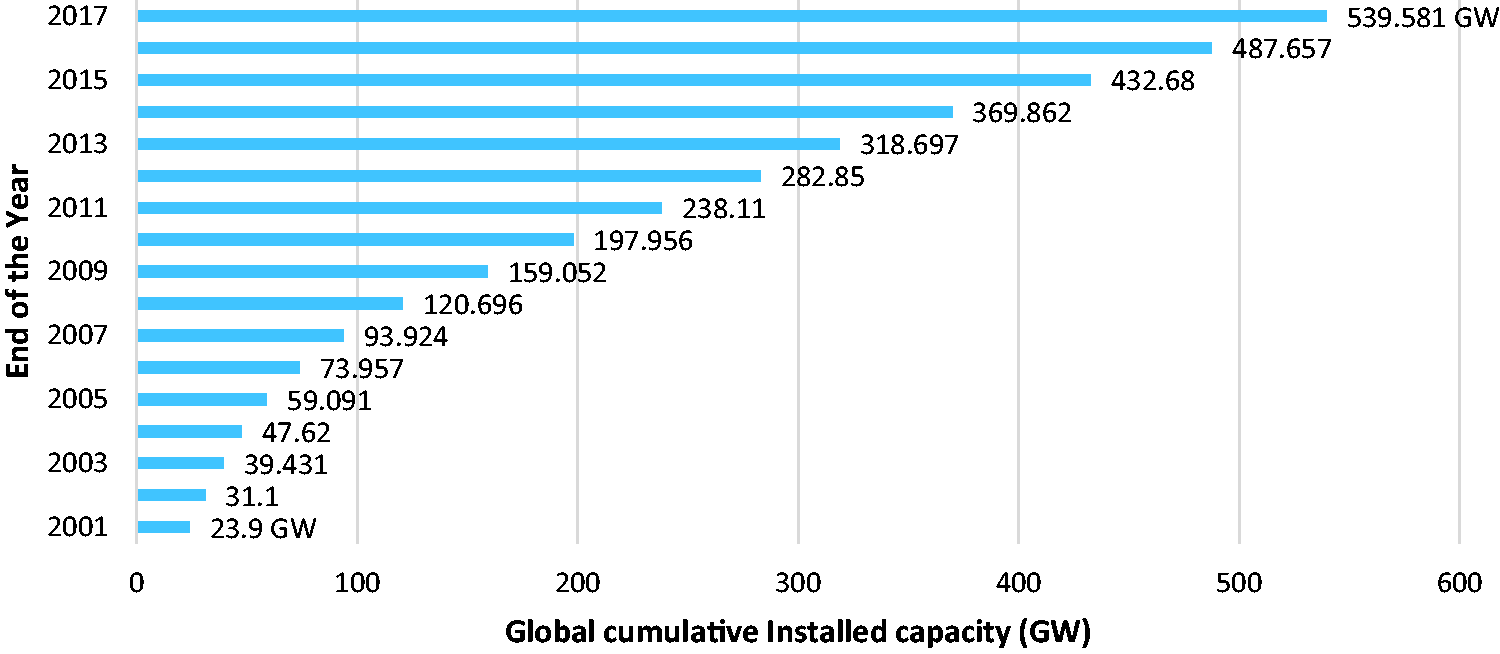
Global wind cumulative installed capacity (MW) from year end 2001–year end 2017. 51
The global onshore wind cumulative installed capacity (GW) and percentage of share till December 2017. 51
Global offshore-installed capacity
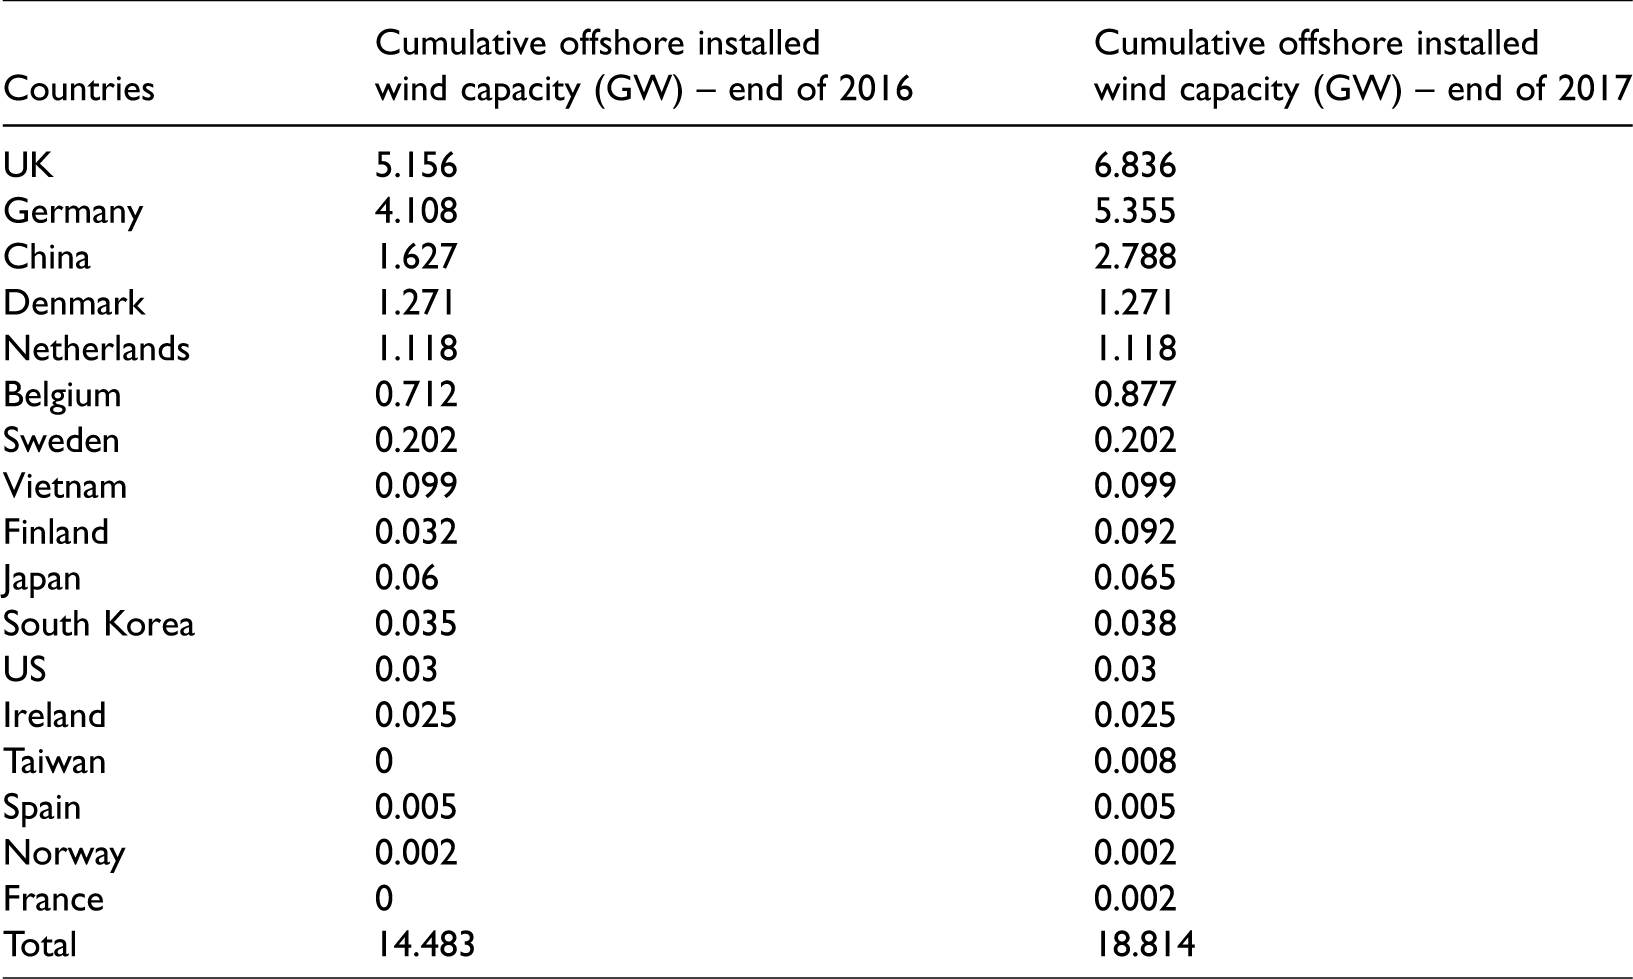
Table 13 shows the global cumulative offshore installed wind capacity (MW) till December 2017. The year 2017 was a spectacular year for the offshore wind sector. By the end of 2011, it was 4.117 GW, and it increased to 18.814 GW by the end of 2017). A record of 4.331 GW of new offshore wind power was installed over nine markets globally in 2017. This signifies an improvement of 95% on the 2016 market. Overall, there are now 18.814 GW of installed offshore wind capacity in 17 markets throughout the globe which is presented in Table 14. Approximately 84% (15.78 GW) of all offshore installations were located at the off coast of the 11 European countries according to the reports. The remaining 16% is mainly found in China, followed by Vietnam, Japan, South Korea, the United States and Taiwan. The UK is the world’s largest offshore wind market and accounts for just over 36% of installed capacity, followed by Germany in the second spot with 28.5%. China comes third in the global offshore rankings with only under 15%. Denmark now accounts for 6.8%, the Netherlands 5.9%, Belgium 4.7% and Sweden 1.1%. Other markets including Vietnam, Finland, Japan, South Korea, the US, Ireland, Taiwan, Spain, Norway and France make up the balance of the market. Meanwhile, offshore wind had its first ‘subsidy-free’ bids for offshore projects in Germany and a full subsidy free tender in the Netherlands, with champions of new offshore capacity getting no more than the wholesale cost of electricity. 54
The global offshore wind cumulative installed capacity (GW) and percentage of share till December 2017. 51

List of countries contributing to offshore global wind cumulative capacity (GW) at the end of 2016, 2017. 54
Renewable Energy Country Attractive Index (RECAI)
This RECAI ranking indicates which country has the abundant renewable energy investment attractiveness. Forty countries are included in the ranking. This index is compiled based on macro vitals such as economic stability, investment climate, energy imperatives such as security and supply, clean energy gap, affordability. It also includes the policy enablement such as political stability, support for renewables. Its emphasis on project delivery parameters such as energy market access; infrastructure and distributed generation; finance; cost and availability; transaction liquidity. Technology potentials such as natural resource, power off take attractiveness, potential support, technology maturity and forecast growth are also taken into consideration for ranking. Table 15 shows the RECAI ranking of the top 15 countries and their rank in FY2016 and till October 2017. India ranked second in the overall renewable energy market with RECAI score of 61.9 out of 100. Considering onshore wind the score is 49.2 and offshore is 19. 55 According to the RECAI ranking in May 2018, India moved down to the fourth position, next to China, USA and Germany. The reason is although solar tariffs have increased slightly in Gujarat’s latest auction, aggressively low bids in 2017 wind and solar auctions now look unsustainable. The warning of solar import tariffs and conflicts between developers and distribution companies are increasing investor concerns. 56
Renewable energy country attractive index (RECAI–October 2017). 55
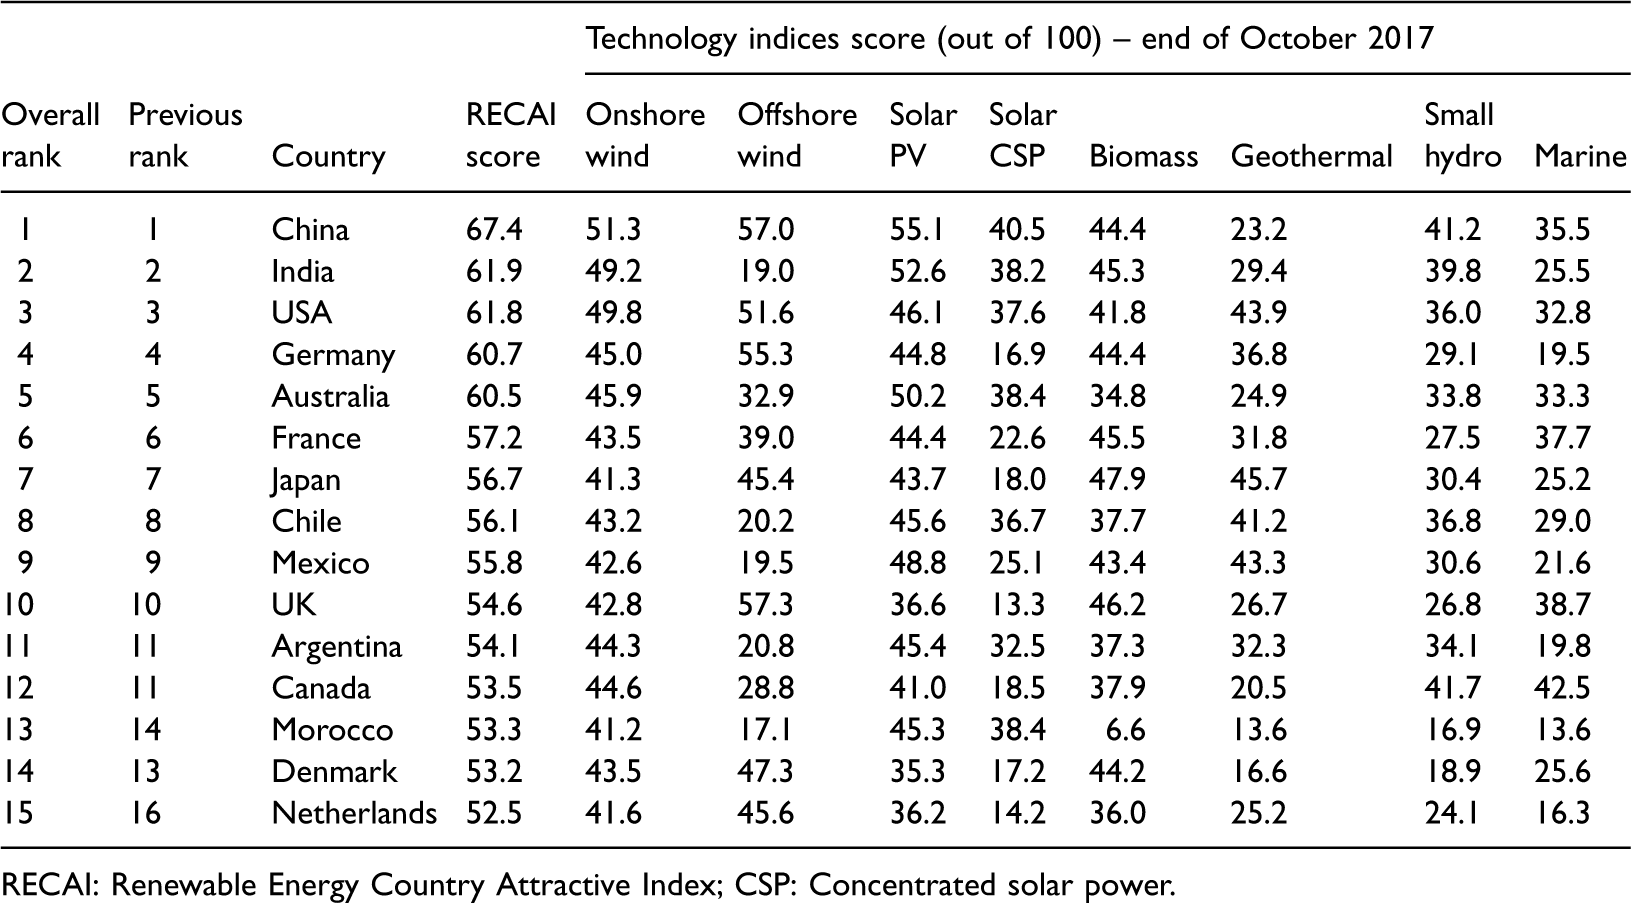
RECAI: Renewable Energy Country Attractive Index; CSP: Concentrated solar power.
Guidelines for developing of onshore wind power projects
To guarantee the sound and orderly increase of wind power sector in India, the MNRE published guidelines for the expansion of wind power projects in July 1995, revised in 1996 and same were updated from time to time. The recent update was on 22 October 2016. These guidelines are to facilitate the development of wind power projects in an efficient, cost-effective and environmentally favourable manner taking into account the requirements of project developers, state and national imperatives.
Site selection and feasibility
The method of wind power project development starts with site selection. Identification of proper sites depends upon land usage authorization, availability of wind resource, technically and commercially available grid connectivity, transport logistics and environmental acceptability.
Land use permission
It is expected that the project developer follows every regulation regarding land use, land cover and provide a guarantee that the land is chosen legally for the wind power project and will be used for that purpose only. The maximum term of four years allowed for development and commencement of commissioning of the project after allocation/permission. If the approved plan is undeveloped within the assigned time frame, the land allotment/land use permit may be revoked. However, an extension may be applied for force majeure conditions. For current project developers, where land is already allocated, or land use permit has been already given 18 months or longer, before the issue of the guidelines (22 October 2016) may be granted another 30 months subject to provide an undertaking that they are responsible for developing and starting commissioning of the project within a specified period of 30 months.
Availability of wind resource
The project developer is expected to assure the availability of wind resource at the site based on the several parameters estimated for the purpose. They also needed to guarantee the quality of the data captured at an appropriate site for the accurate estimation of the wind resource potential, project viability and sustainability of the project over the intended lifetime of the project. NIWE installed wind masts are free of cost, the academia and research organization are allowed to examine the wind power potential and use NIWE data.
Technically and commercially available grid connectivity
The project developer should guarantee that grid connectivity is technically and commercially achievable at the site selected.
Transport logistics
The project developer should assure that parts of the wind power project can be transported to the site chosen with existing infrastructure and in case any extension is required the same would be built without any legal problems.
Environmental acceptability
It is mandatory to get clearance certificates from concerning authorities if the site is in the forest area, vicinity of the habitat of migratory birds, routes of the airplane, civil aviation, defence and heritage institutions.
Type certification and quality assurance
Type certification is to validate that the wind turbine type is designed, documented and produced in compliance with design theories, particular standards and other technical conditions. For producers of wind turbines and components, variety and quality certification by an internationally accredited certification body shall be a necessary condition. The wind turbine model should have a certified power curve and IEC/GL type certification which is based on international accreditation. The standard certificate of the wind turbine model should compulsorily hold Hub and Nacelle assembly/manufacturing facility in India. No approval for installation granted until it has received type and quality certification. To help state nodal agencies (SNAs), investors, lenders and developers, the MNRE has the list of type and quality certified wind turbine models satisfactory for installation in India. The list is regularly renewed and updated through an online automated tracking and approval process.
Micro-sitting
Micro-siting is the optimization of power generation through the proper installation of WTGs in the wind farm field, considering every physical constraint of the area. As per the micro-siting criteria, developer(s) shall optimize the wind turbine fields within their area employing proper wind flow modelling and optimization tools (linear and non-linear)/techniques subjected to site estimation as per IEC 61400–1 standard for turbine protection. Another requirement is to keep a gap of 2*D (D-rotor diameter) distance perpendicular to the prevailing wind direction and 3*D distance in the current wind direction from the boundary line of all neighbouring land of another developer(s) with the proper offset. Similarly, project developers are expected to keep awake loss (concerning energy) of 10% among wind turbines with a proper offset for wind turbines sited on a footprint basis. It is mandatory to keep HH + 0.5 RD + 5 m (hub height + half rotor diameter +5 meters) distance from extra high voltage (EHV) lines, public roads, organizations, buildings, highways and railway tracks. No wind turbines should site within 500 m of any dwelling for the mitigation of noise. The above discussed micro-siting procedures will also support in repowering and be intercropping as the investors/developers will have no pressures with smallest distances within the available land guaranteeing optimized utilization of the area with wind resource. 57
Grid connectivity
For the establishment of the evacuation arrangement and grid connectivity, the Electricity Regulatory Commission order/regulation is applicable.
Compliance with grid regulations
Concerning the compliance of the grid regulations for the wind turbine, power quality and additional relevant specifications as per standards and regulations designated by the accredited certifying body should accompany with active/reactive power control, low-voltage ride-through (LVRT).
Metering and real-time monitoring
Telecommunication facility at the pooling station/sub-station should be connected to the availability-based tariff (ABT) compliant meter. The project developers shall allow implementation of forecasting and scheduling regulation. It shall also be essential to communicate vital grid parameters on a real-time basis to respective regional/state load dispatch centre.
Online registry and performance reporting of wind turbines
NIWE have developed a web-portal (an online registry) of wind turbines. Every month the project developer is expected to upload the summary of the wind turbine performance in the record.
Health and safety
To guarantee the health and safety of people who are working/living near the wind power installations, the NIWE will guide criteria for noise and shadow flicker in discussion with stakeholders.
Hybridization
In comparison with the conventional power, the wind is irregular and having low CUF. When wind is in hybridization with other renewable and storage technologies would provide reduced intermittency and productive utilization of transmission infrastructure. The project developer can employ hybrid techniques following the policies announced by the central/state governments.
Repowering
The wind project developers can opt for repowering of the wind turbines following the repowering policy of the central/state governments. Repowering is based on the enhanced wind turbine technology.
Decommissioning plan
The proposal to build wind power project should undoubtedly cover the decommissioning plan of the wind turbine after achievement of its useful lifetime. The NIWE will form guidelines for decommissioning of the wind turbines in discussion with stakeholders.
Policies and programmes
CERC tariff orders for procurement of power from wind energy generators
Central Electricity Regulatory Commission (CERC) in its regulation dated 16 September 2009 submitted its regulations and tariff orders for obtaining wind power into the grid. The tariff formation consisting of fixed price elements: return on equity, interest on loan capital and discount. Table 16 shows the CERC tariff orders for procurement of power from wind energy generators.
Central Electricity Regulatory Commission (CERC) tariff orders for the acquisition of power from wind energy generators. 58
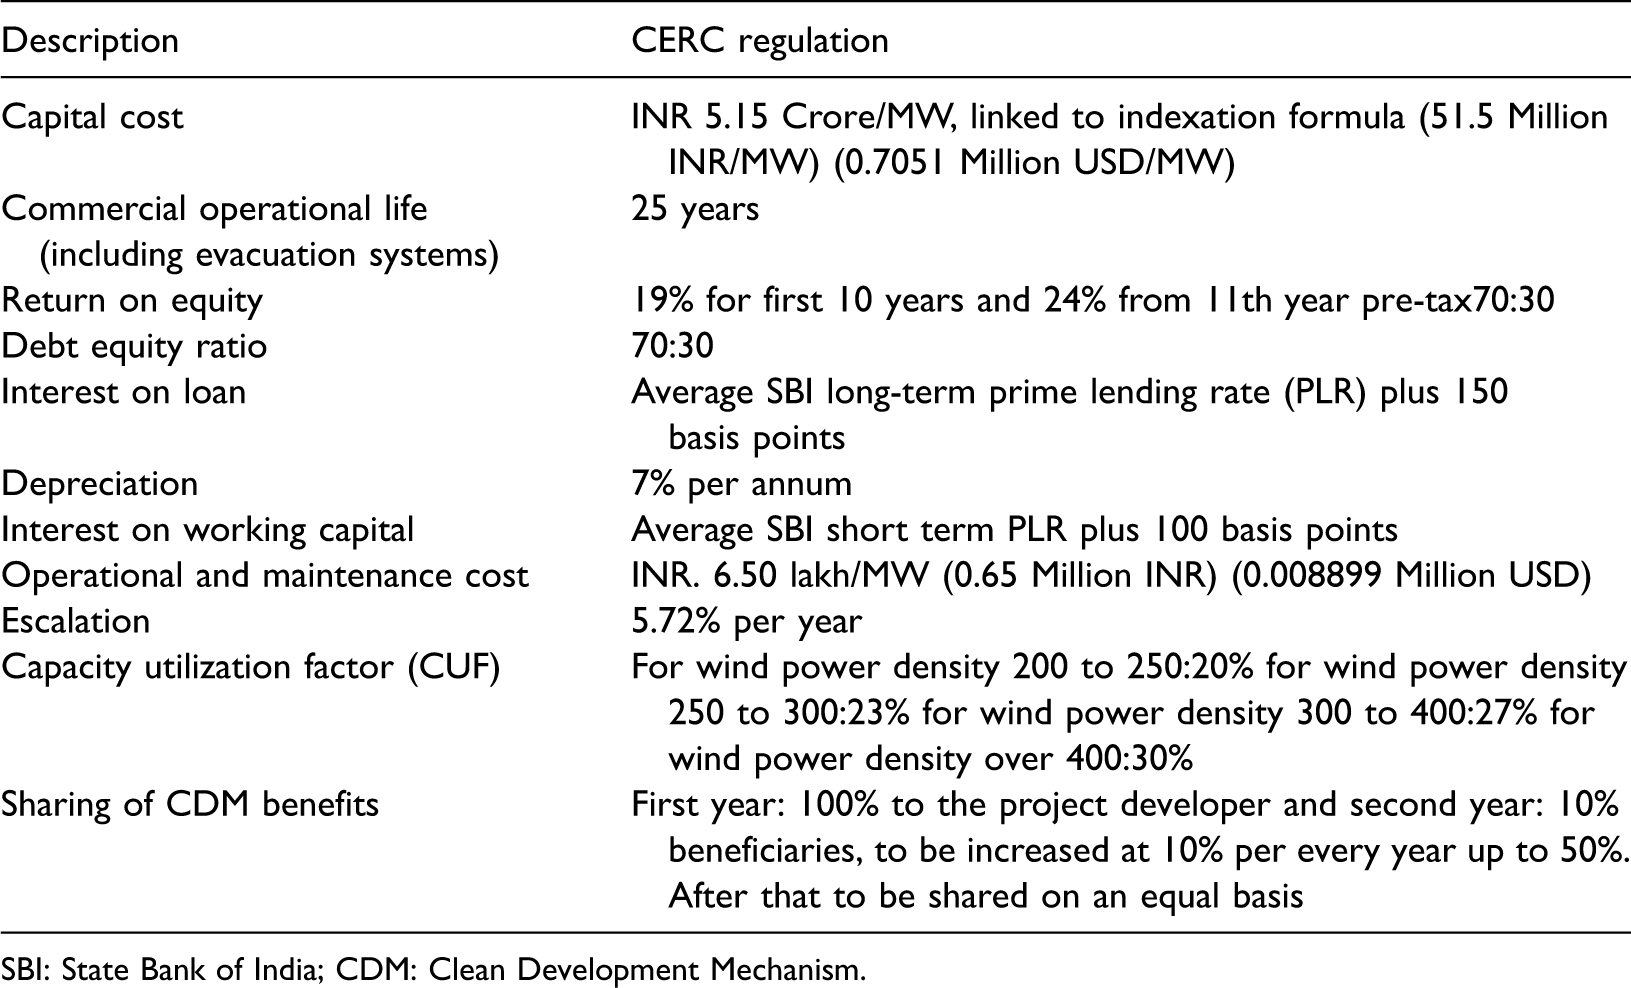
SBI: State Bank of India; CDM: Clean Development Mechanism.
Accelerated depreciation (AD)
The primary incentive for wind power projects in the past was AD. This tax benefit supported projects to subtract up to 80% of the cost of wind power devices during the initial year of project operation and was applicable for projects until March 2017. With this AD scheme investors are provided tax advantage up to 10 years by registering and rendering generation data to Indian Renewable Energy Development Agency Limited (IREDA). As of 1st April 2017, the AD tax decreased to 40%. 58
Indirect tax benefits
Indirect tax advantages include concessions on excise duty and reduction in customs duty for wind power equipment. Wind-powered electricity generators and water pumping windmills, aero-generators and battery chargers are without excise duties. Indirect tax advantages for manufacturers of particular energy parts vary from 5% to 25% depending upon the component.
Central-level generation-based incentives (GBI)
Granted by the central government since June 2008 and offered by IREDA, GBI for wind is possible for independent power generators for projects commissioned on or before 31 March 2012 with an installed capacity of 5 MW. As of December 2009, the GBI is priced at INR 0.50/kWh (USD 0.006846/kWh) of grid-connected electricity for a least of four years and a peak of 10 years, up to a peak of INR 6.2 million (USD 0.08489 million) per MW. The scheme will expand a total of INR 3.8 billion (USD 0.05202 billion) until 2012 and intends to incentivize capacity additions of 4000 MW. Wind power generators are getting a GBI requirement register with and give generation data to IREDA. The GBI is granted in addition to SERC’s state preferential renewable energy tariffs. However, independent power producers (IPPs) using GBIs cannot take benefit of AD advantages.
Renewable energy certificates (REC) and renewable purchase obligations (RPO)
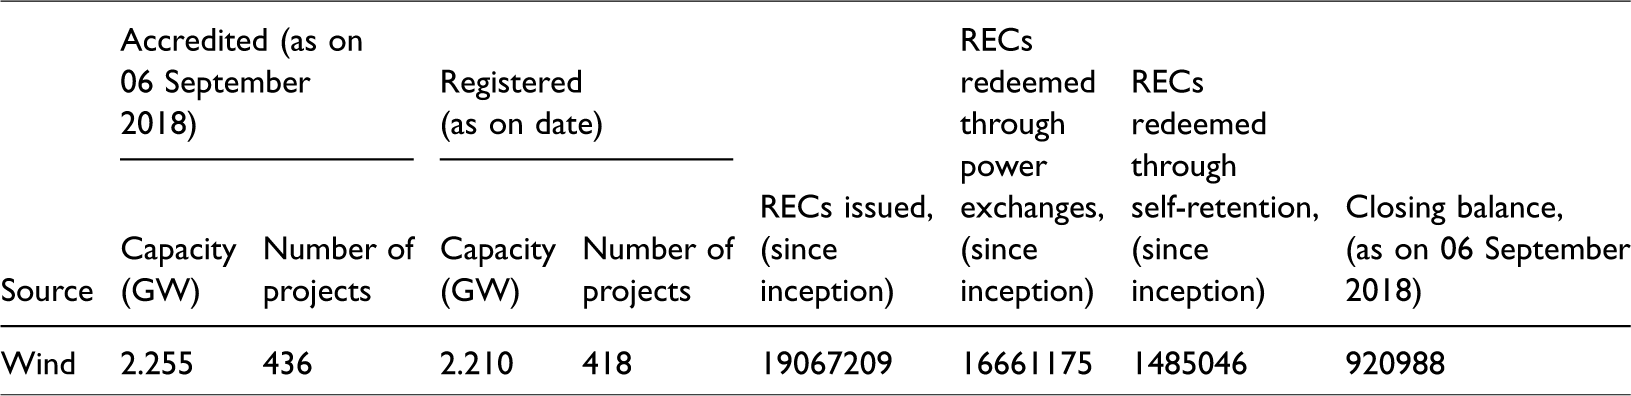
Renewable energy certificate (REC) is a market-based instrument to develop renewable energy and promote compliance of renewable purchase obligations (RPO). The main aim is to address the mismatch between RECs availability and the obligated entities conditions to match the RPO. Central Electricity Regulatory Commission (CERC) has selected National Load Dispatch Center (NLDC) as its Central nodal agency. 59 Tables 17 to 19 show the accredited wind generators with the total capacity of 2.2546 GW, and the number of projects is 436, registered wind generators with the full capacity of 2.20955 GW and the number of projects are 418 and REC issued closing balance as on 6th September was 920988. Under the electricity act of 2003, the National Action Plan on Climate Change (NAPCC) provides the policies for a roadmap for increasing the renewable energy share in total energy which includes thermal, nuclear, large hydropower. In India, the renewable sources are not covered equally across the various parts of the country as discussed earlier. Renewable energy sources (RES) are not significant in states like Delhi; this inhibits the SERC of the state from stipulating higher RPO. However, states like Rajasthan and Tamil Nadu have a very high potential and beyond the RPO level fixed by the SERCs. However, the hefty price of production from RES discourages the local distribution licensees from obtaining RE production beyond the RPO level mandated by the SERC. It is in this connection that the idea of REC assumes importance. It is also expected to support the RE capacity addition in the states where there is potential for renewable energy production as the REC framework attempts to build a nationwide level market for such generators to increase their price. CERC has announced regulation on REC in the realization of its mandate to develop renewable sources of energy and growth of the market in electricity. The framework of REC is anticipated to provide a drive to renewable energy capacity addition in the nation.
Accredited wind generators as on 06 September 2018. 59

Registered wind generators as on 06 September 2018. 59

Renewable energy certificates (RECs) issued since inception and closing balance as on as on 06 September 2018. 59
Ministry of Power (MoP) newly announced an order for long-term growth trajectory of RPO for solar and non-solar for three years, i.e., FY 2019–2020 to FY 2021–2022. To accomplish the target of 175 GW of RE by March 2022, the MoP in discussion with MNRE notified the long-term trajectory for RPO which is shown in Figure 17. The MoP has announced RPO targets keeping in mind the entire nation not just particular pockets which are intense in renewable energy. The entities can employ the REC market to comply with RPO obligation. However, despite the determined targets, RPO compliance has not been up to the mark. Some states and union territories rigidly adhere to RPO compliance. It is reported that 16 states and union territories reached <60% of their respective RPOs in FY2016–2017. Compliance requires to be seriously ramped up if there is any possibility of the current RPOs objectives being reached. 60

India’s revised RPO trajectory (percentage %): FY2016–2017 to FY2021–2022. 60
Small wind energy and hybrid systems programme
This programme is performed through SNAs for meeting water pumping and small power specifications in rural, semi-urban, urban windy regions for the classes of users such as individuals, farmers, non-government organizations (NGOs), central, state government agencies, local bodies and panchayats, autonomous institutions, research organizations, cooperative societies, corporate bodies, small business establishments, banks, etc. Table 20 which shows the category of wind windmills, the cost and the central financial assistance. 61
Central financial assistance. 61

Repowering policy
Repowering refers to replacing aging wind turbines with powerful and modern units to increase power generation. It can help old wind sites to more than double their installed capacities. According to the MNRE, most of the wind turbines installed till the year 2000 are of below 500 kW capacity. It estimates that over 3000 MW wind capacity installation is from 500 kW or below wind turbines. As per the policy, initially WTGs of less than equal to 1 MW capacity would be acceptable for repowering. The wind farm or turbine undergoing repowering will be freed from ‘not honoring the PPA’ for ‘non-availability of production’ during the time of performance of repowering. 62
Wind tariff in India
India’s wind power tariff declined to a record low of INR 2.64 (0.03614 USD) per unit in an auction administered by state-run Solar Energy Corporation of India (SECI) for 1 GW of wind power contracts that ended on 5 October 2017. It is interesting to see that companies like ReNew Power ventures private limited and Orange Sironj Wind power private limited bid INR 2.64 (0.03614 USD) per kilowatt hour (kWh) to win contracts for 250 MW and 200 MW each, while Inox wind infrastructure services limited and Green Infra wind energy limited bid a tariff of INR 2.65 (0.03639 USD) per unit for obtaining contracts of 250 MW each. These firms quoted the cost at which they will sell electricity to obtain contracts under the tender that got a demand for three times the grid-linked capacity being sold. These tariffs are cheaper than the average rate of power generated by coal-fuelled projects of India’s largest power generation utility, which is INR 3.20 (0.04381 USD) per unit. The price gap is fundamentally due to the prices of WTGs falling by 20%, over the past five years. These falling rates are attracting investors to India’s developing green economy. A case in point is a joint venture of French energy firm Engie SA and Dubai-based private equity firm Abraaj group which intends to invest around one billion USD in building a 1000 MW wind power platform in India. 63 As on 22 December 2017, wind power tariff dropped to an all-time low of INR 2.43 (0.03327 USD) per unit in an auction led by Gujarat Urja Vikas Nigam Limited (GUVNL), promoting clean energy initiatives of India. Sprng Energy and K P Energy quoted INR 2.43 per unit in an auction for 500 MW power capacities. The fall in tariff will boost clean energy because of India's target of having 60 GW wind energy capacities by FY2021–2022. 64
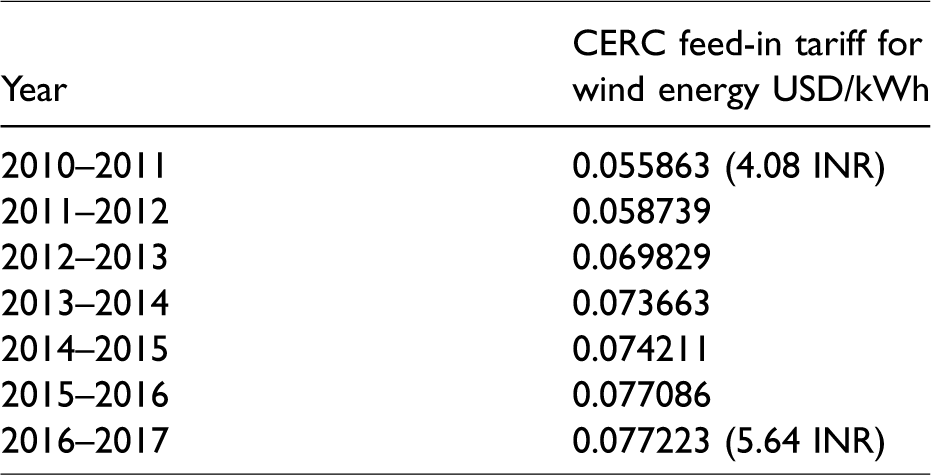
Feed-in tariff
FITs are a policy mechanism created to stimulate investment in RETs. It accomplishes this by offering long-term contracts to renewable energy producers, and it is to get money for producing companies own electricity. Renewable energy FITs and prices determined through competitive bidding. CERC gives orders for various renewable energy tariff, which is shown in Table 21. It is noted from the table that the values increase every FY. In FY2010–2011, it was 4.08 INR per kWh (0.05586 USD/kWh) and expanded to 5.64 INR/kWh (0.07722 USD/kWh) in FY2016–2017. The switch to an auction-based allocation of wind capacity from a FIT system has been done by the policymakers to promote more competition and better price discovery.65,66
Capital and operational cost for WET
Table 22 shows the year-wise capital and operational cost for WET from FY2010–2011 to FY2017–2018. The capital cost in FY2010–2011 was 51.5 million INR (0.7051 million USD) and 62 million INR (0.8489 million USD) in FY2017–2018. The operational cost was 0.65 million INR (0.008899 million USD) in 2011 and FY2017–2018, it is 1.112 million INR (0.01522 million USD).

Bid discovered prices and average power purchase cost
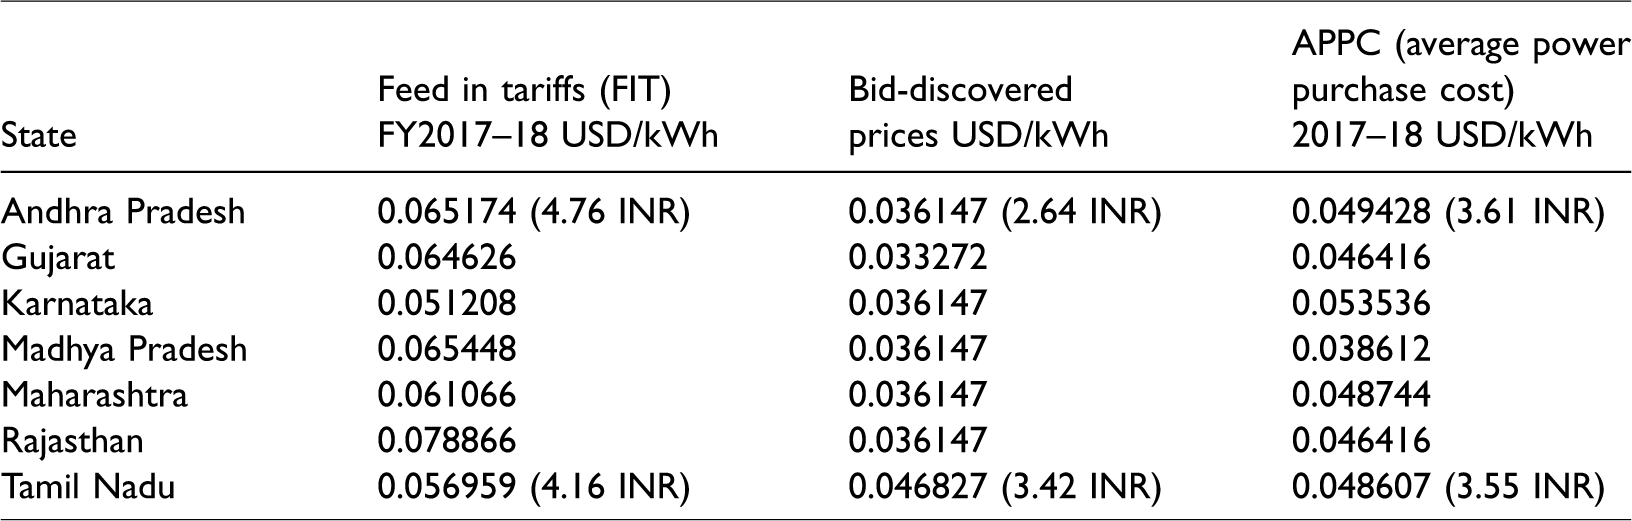
Table 23 shows the bid-discovered prices and average power purchase cost for the FY2017–2018 of the various states in India and their FIT. Karnataka with 3.74 INR/kWh (0.0512 USD/kWh) which shows lowest FIT and Rajasthan with 5.76 INR/kWh (0.0788 USD/kWh). FIT is the highest FIT among all other primary states. Representative competitive price for wind is 3.46 INR/kWh (0.04737 USD/kWh) used in the absence of state-specific bidding. Wind power prices in India are declining fast. Without either direct or indirect support (subsidies) through sales (auctions) for wind projects in December 2017, the levelized tariff (average cost of this renewable energy) of wind power attained a record low of INR 2.43/kWh [0.03327 USD/kWh]. In December 2017, union government announced the applicable guidelines for tariff-based wind power auctions to bring more transparency and decrease the uncertainty to the developers.67–69
Buy-back rate
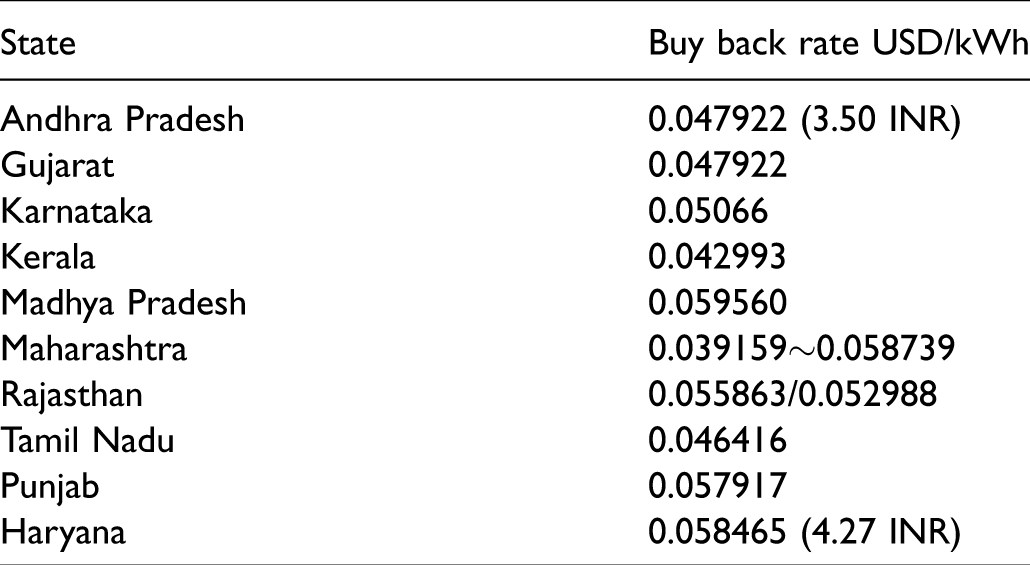
Buy-back rate is related to the policymaking in the field of wind energy to encourage and enable private sector investments and to facilitate a manufacturing base for wind turbines to cater to the market in the making. The industrial units were permitted to generate electricity anywhere in the state and that generation, after accounting for specific wheeling charges (around 2%) was deemed to have been consumed by the industrial unit. The consumption by the industrial group was permitted to be offset to the amount of generation from wind farm minus ‘wheeling’ charges. In the case of excess generation, the industrial unit was permitted to bank the energy with the state utility and draw upon it when required within a specified time frame. This was termed as banking and banking charges of 2% in kind was also levied. In case of sale of electricity to the grid, a “buy-back rate” was fixed at 1.75 INR (0.02396 USD)/kWh. These measures presented a framework under which private investments could take place. In 2003, after the commencement of the electricity act, SERCs had grown effective in nearly all the states and based on the wind regime in the state and discussions with the stakeholders, tariffs been established. These tariffs are now encouraging private sector investments in wind energy. 70 Table 24 shows the details of the past buy-back rate of wind power (before wind tariffs) in different states in India. The lowest is Maharashtra with 2.86 INR/kWh (0.03915 USD). However, this had gone up to 4.29 INR/kWh (0.05873 USD/kWh). The highest buy-back rate was in Madhya Pradesh with 4.35 INR/kWh (0.05956 USD/kWh). 71
Buy-back rate of wind power in different states. 71
Offshore wind energy development
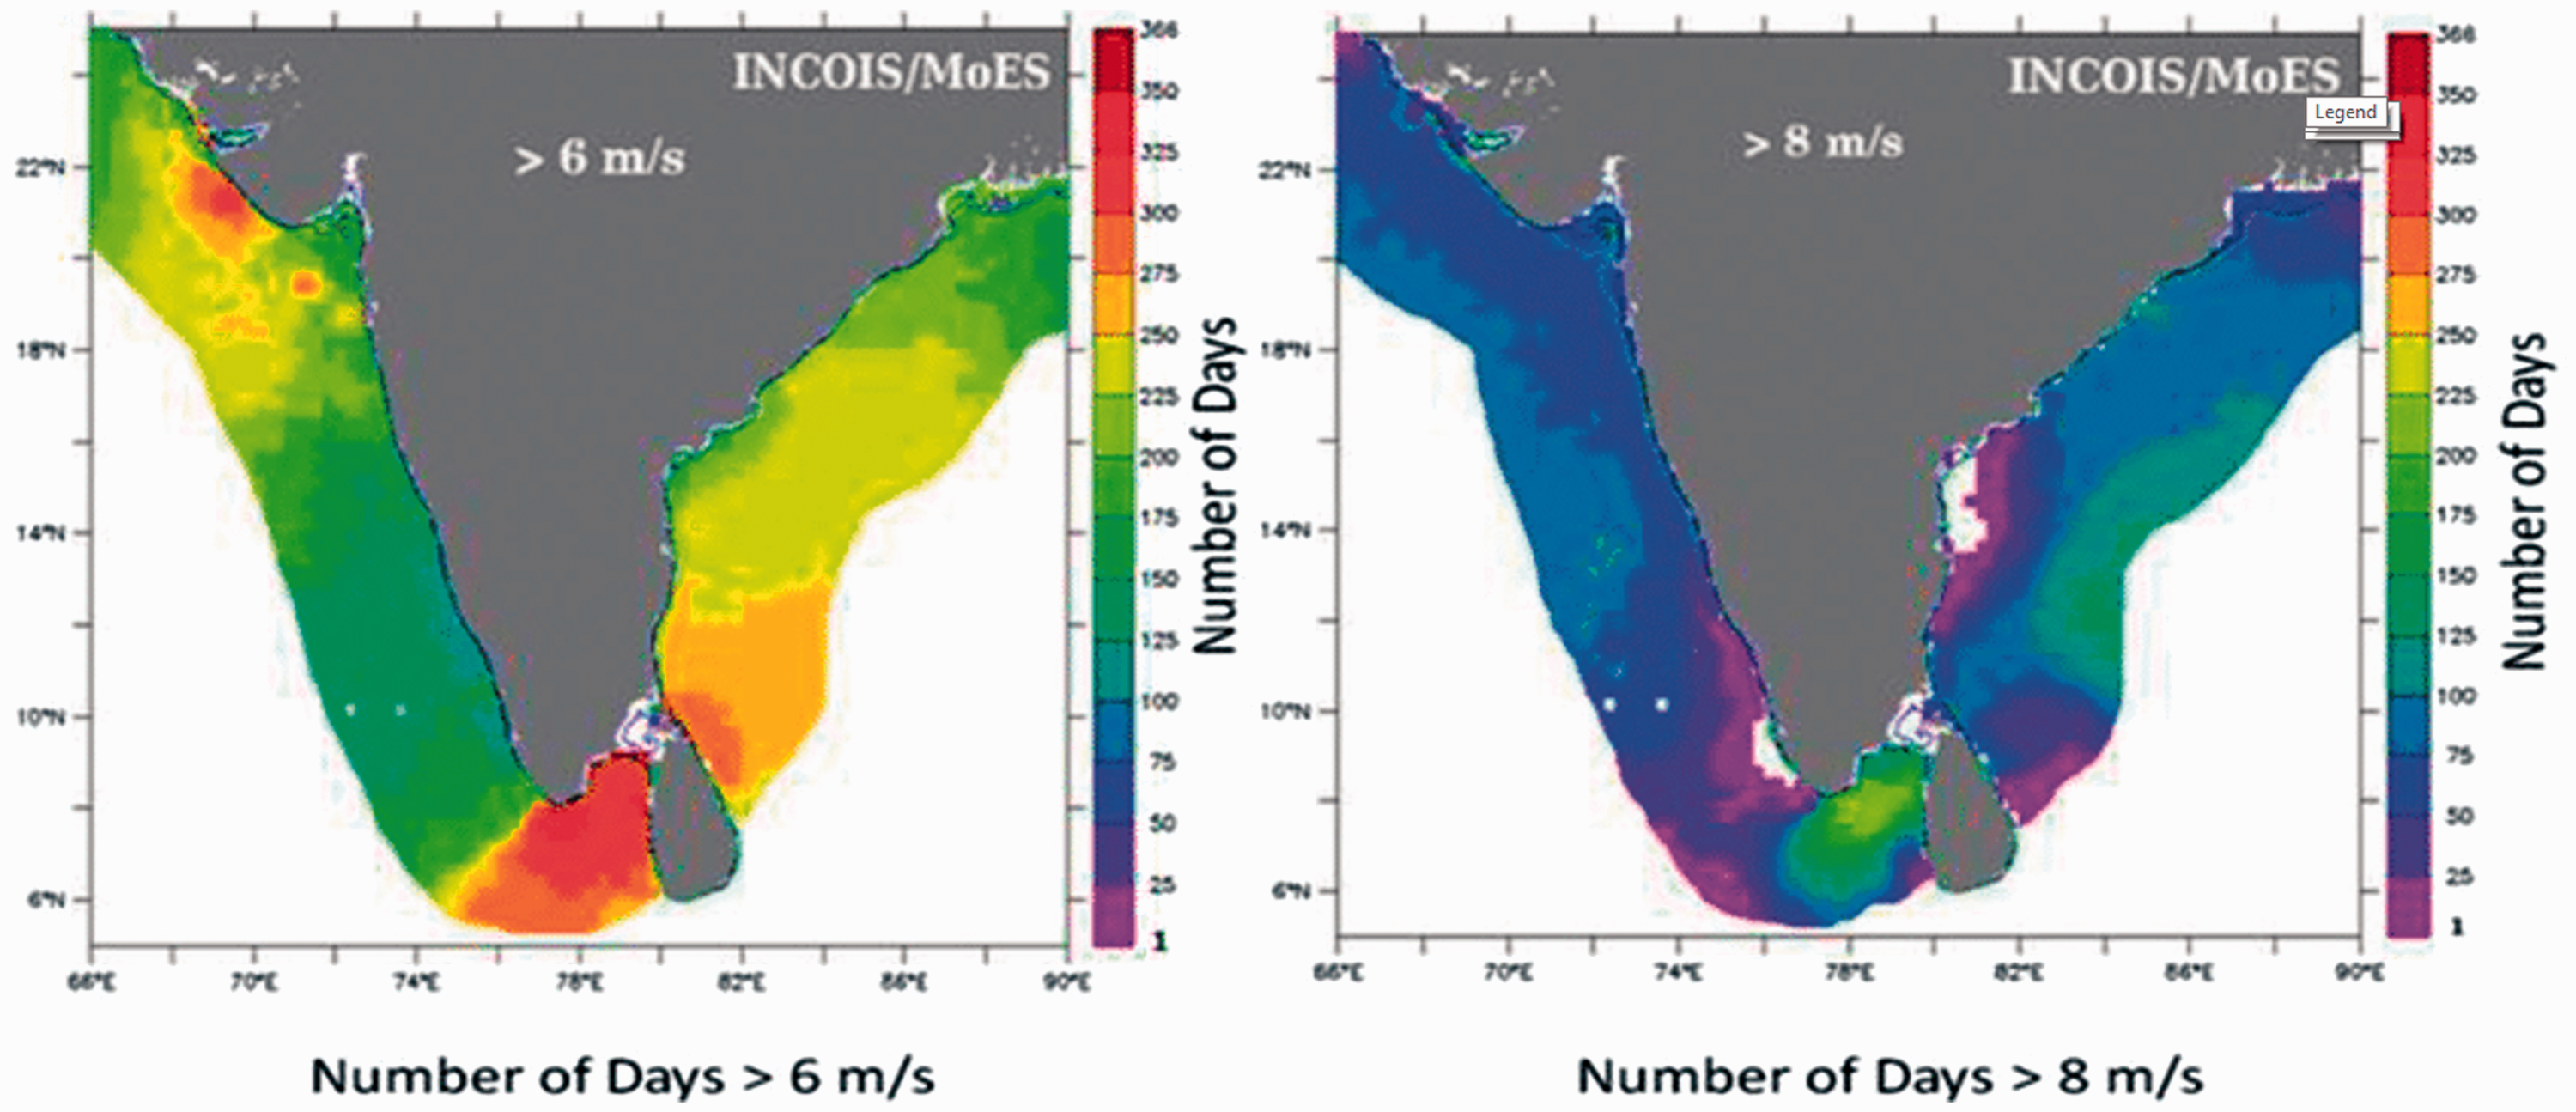
In addition to the onshore and repowering segments, significant potential exists in the offshore wind energy sector. Offshore wind development is comparatively a new phenomenon where Europe stands to be the only sizeable market at today, with a total offshore capacity of 18 GW at the end of 2017. Some particular construction specifications make offshore wind power 1.5–2.5 times more expensive than onshore wind development, making large-scale offshore wind development difficult in developing countries. Government support for small capacity offshore demonstration project could bring in public and private investment in offshore wind expansion. 72 Realizing the need, MNRE released a draft national offshore wind energy policy in May 2013. The policy determines offshore wind energy potential along the coasts of Tamil Nadu, Gujarat and Maharashtra. Preliminary estimates put the offshore wind potential off Tamil Nadu coast alone at 127 GW at 80 m hub height. The data obtained by the national wind institute reveal that Rameswaram and Kanyakumari could become two significant hubs for offshore wind power generation in the country as shown in Figure 18. Indian National Center develops the satellite image for ocean information services (INCOIS) and Ministry of Earth Sciences (MoES). It shows the days with the wind more significant than 6 m/s and 8 m/s. The magnitude of wind higher than 6 m/s and 8 m/s continues for more than 300 days and 200 days respectively along the coast of Tamil Nadu (Rameshwaram and Kanyakumari). A generation of 1GW of wind energy is expected from these hubs. Recently the country’s premier university, the Indian Institute of Technology (IIT) has been collecting data from Gujarat and Tamil Nadu. The ministry aspires to have data for at least one year to decide on proposing wind power firms for investment in the states. In research published in the Royal Meteorological Society and Journal of Meteorological applications, researchers at the Powai Institute in Mumbai have claimed that the increasing sea temperatures will help the offshore wind farms at these places. However, the cost of the offshore wind farm is expected to be very high at least for now, as the mast is to be 100 m high, then 50 m will be under the sea. Offshore windmills will be set up with support from the European Union (EU), and they have pledged to provide financial aid to the extent of 4 million USD for estimating the wind energy production potential. Beyond that, they will also guide Indian companies in setting up wind farms as well as managing them. As on date, United Kingdom, Germany, China and Denmark have the maximum capacity of offshore wind farms in the world with 6.836 GW, 5.355 GW, 2.788 GW and 1.271 GW respectively. 73 The country has made a dedicated commencement on its journey towards an offshore wind industry that has the potential to produce notable quantities of carbon-free, affordable and secure power.
Indian offshore wind resource–region of interest. 73
Wind–solar hybrid system
Research has revealed the complementary nature of solar and wind power and how hybridization of the two technologies will aid in minimizing the variability, apart from optimally utilizing the infrastructure, including land and transmission system. Therefore, with the objective of providing a framework for the promotion of large grid-connected wind–solar PV system, MNRE issued the draft wind–solar hybrid policy. The goal of the policy (currently pending approval) is to make the wind–solar hybrid capacity of 10 GW by FY2021–2022 and to encourage new technologies, methods and way-outs involving the combined operation of wind and solar PV plants. The policy provides guidelines for the integration of both RES. One significant requirement is that rated power capacity of one resource should be at least 25% of the rated power capacity of extra resource for it to be recognized hybrid project. The policy seeks to raise new hybrid projects as well as hybridization of existing wind or solar projects. The current wind and solar projects can be hybridized with larger transmission capacity than the approved one, subject to availability of margin in the current transmission capacity. The policy also grants for the acquisition of energy from a hybrid project on the tariff-based transparent bidding method for which government entities may request bids. The new policy allows the use of battery storage in hybrid projects for optimizing the output and further decrease variability. It mandates the regulatory authorities to form needed standards and regulations for wind–solar hybrid systems. With essential capacity additions in renewables in current years and with hybrid policy intending at better utilization of resources, it is expected that the hybrid policy would open up a new area for availability of renewable power at competing costs along with decreased variability. 74
Cost and economic of wind energy production in India
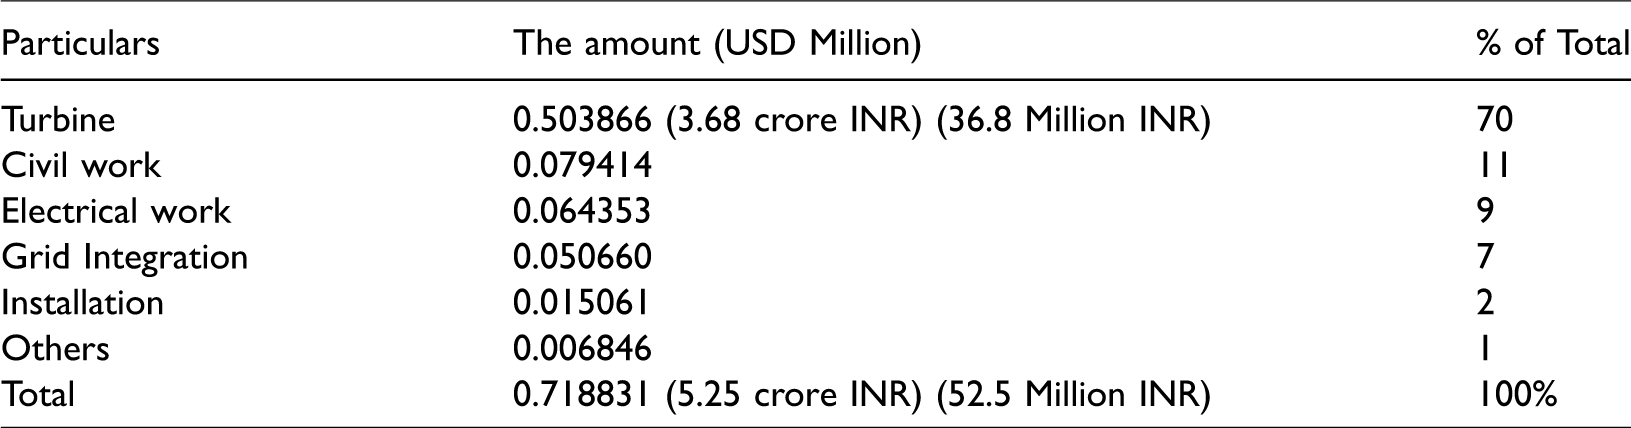
The installation prices of a wind project are dominated by the upfront capital expense, which can value for as much as 84% of the project cost. These expenses can be divided down into the following major categories: (1) The turbine cost (rotor, blades, nacelle, tower and transformer); (2) civil works (construction expenses for site formation and the foundations for the towers); (3) grid connection costs (transformers and sub-stations, the link to the local distribution or transmission network); (4) planning and project costs (essential proportion of total expenses) and (5) other capital costs (the construction of roads, buildings, control systems, etc.). 75 Table 25 shows the breakup of the capital expenses per MW. It shows that 70% of the money used for turbines and 11% for civil works. 76
The breakup of the capital expenses per MW (2010). 76
Capital investment
Wind energy is a capital-intensive technology, and wind turbine alone constitutes the most significant cost component followed by grid connection and others. The breakup of the cost of a typical wind farm is shown in Figure 19. Few key parameters that govern wind power costs are capital costs (cost of turbines, foundations and grid connection), variable cost (operation and maintenance, land rent, insurance, taxes), relatively lesser plant-capacity factor and economic lifespan of the investment. For successful implementation of wind energy, developers will need most of the funds (around 80%) during the construction phase itself. Hence, it is essential there must be right repayment conditions. In countries like India, a 70:30 debt–equity ratio is available to many renewable energy projects. However, lesser interest rates are needed to develop wind energy, due to the intermittent nature of wind (less plant capacity factor) and extended payback periods. Hence, due to incorrect funding conditions during the beginning phases, it may not be useful to harness this energy even though it may be the cheapest option. The net present value (NPV) and internal rate of return (IRR) are critical parameters which are utilized for project investment feasibility. 77
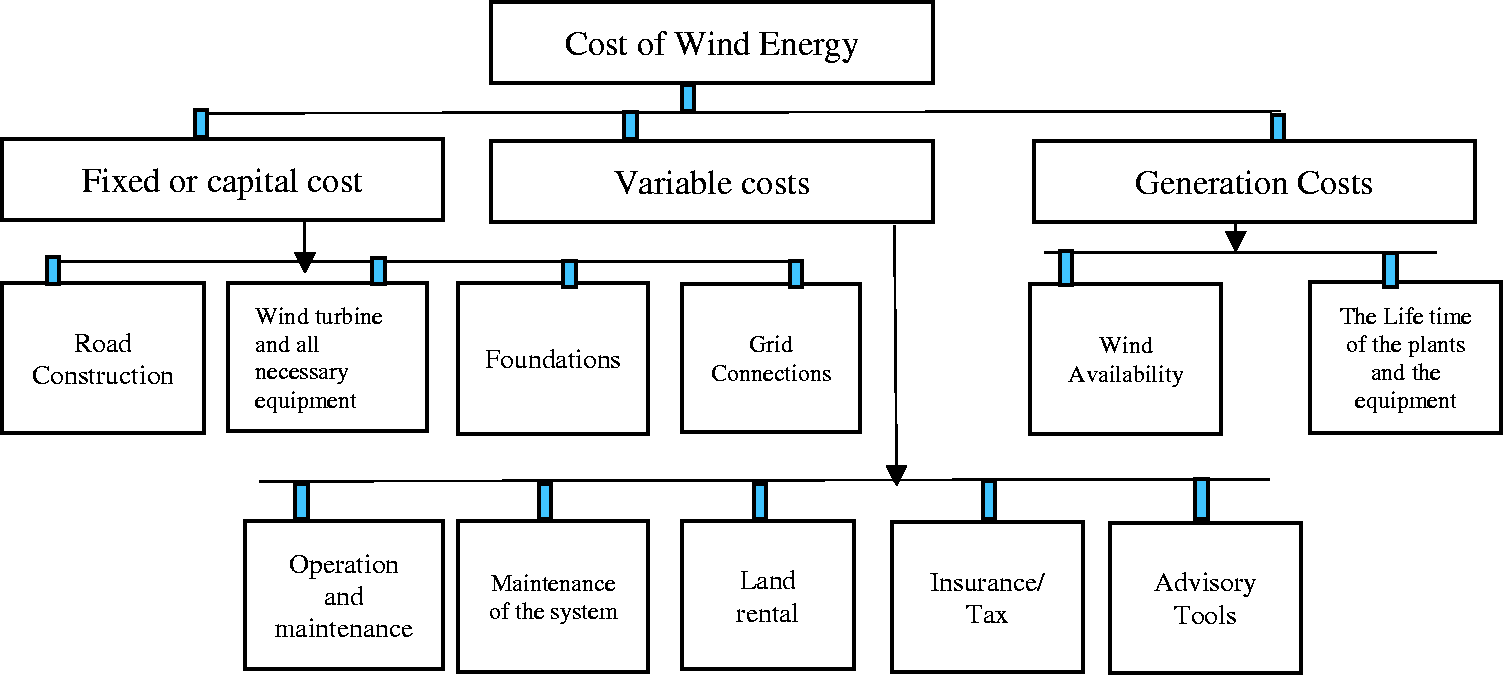
A typical breakup of the overall cost of large-scale wind energy system. 77
High production cost
The production cost is determined by power-produced, fixed costs (interest, land rent, insurance) and variable costs (maintenance/repair, miscellaneous). It is not always possible to implement wind energy at a large scale because of the intermittent nature of wind and high investments. Other relevant parameters include turbine design and selection and grid availability. Hence the production cost is an overall parameter to assess the success or failure of the project. It can be decreased by proper planning and taking necessary actions. To increase the consistency power system regulators are used to make detailed schedule plans for appropriate utilization of energy. To decrease the reserve capacity requirement, accurate forecasting methods are necessary. Power output (wind farms) also varies due to the constant variations in the outputs of each wind turbine (although all are supplied from same wind energy) which leads to a lesser plant capacity factor. 78 The lower plant capacity factor tests were thereby increasing the overall production costs. It is essential to improve wind power penetration which ultimately leads to more energy generation.
Health and environment effect of windmills
Wind energy can have both positive and negative impacts on the environment. Electricity generated by wind turbines does not yield pollutants like carbon dioxide, nitrogen oxides, sulfur dioxide, etc. It is determined that a 2.5 kW wind energy systems can save 1–2 tons of CO2 and a 6 kW system can save as much as 2.5–5 tones CO2. 79 However, it has some negative impacts such as noise and aesthetic pollution, which has adverse impacts on the wild and human life. Although wind power plants have a relatively little impact on the environment compared to conventional power plants, concern exists over the sound produced by the turbine blades and visual effects on the landscape. The turbine blades damage wildlife, and the flying spinning turbine blades are killing many birds. Most of these difficulties have been solved or significantly decreased through technological development or by suitably siting wind plants.
Impacts on wildlife
The wildlife impacts can be classified into two categories, i.e., direct and indirect. The immediate effect is the mortality rate due to collisions with wind turbines, and the indirect impacts include habitat disruption and others. However, the impact of wind turbines on wildlife is smaller as compared to other sources of energy. It is estimated that conventional power stations (fossil-fuelled) killed 20 times more birds than wind turbines per GWh. 80 Researchers and industries experts concluded that the position of wind plants does not add significantly to the decrease in bird’s mortality rate. However, that turbine with lower hub heights, shorter rotor diameter (higher revolution rate) and tighter turbine spacing lead to the killing of a more significant number of birds. 81 The newly developed turbines with tubular steel towers are safer and produce twice the energy than prop-style turbines. 82 In states like Texas (US), avian radars are used to detect birds in an area. If there is any risk to the passing birds, the system will stop the wind turbines immediately and start them again after the birds have passed the wind farm carefully.83–85
Noise impact
The most significant environmental problem which arises due to the implementation of the wind power sector is noise pollution. The effect of noise pollution can even lead to lower property values within a certain radius of the construction and is also hazardous for humans (up to some extent). Hence, before building a wind turbine, it is essential to study the types of noise produced by wind turbines. The level of sound is expressed with the L90 metric (baseline environmental sound levels for the wind turbine) which is the generally used to describe the continuous noise from the wind turbine. Noise emitted by a wind turbine divided into aerodynamic and mechanical types. Aerodynamic noise is due to the flow of air over and past the blades, and it increases with the speed of the rotor. It is observed that the lower blade tip speed leads to lower noise levels. A characteristic ‘whooshing’ sound is also created when the wind turbine interacts with atmospheric turbulence. 86 Careful design of the blades can minimize aerodynamic noise. Mechanical noise (wearing and tearing, improper designs and lack of preventive maintenance) is due to the moving components such as gearbox, generator, bearings, etc. Mechanical noise can be reduced by proper design and selection, maintenance, etc., and by using anti-vibration support footings and acoustic insulation curtains.
Visual impacts
Visual impacts are by the shape, colour and layout of the wind turbines. The extent of this problem often depends on individual perceptions which are almost impossible to measure. Usually, arranging of same-size turbines in uniform and straightforward rows with light colour columns can improve people’s opinions of the aesthetics of wind farm installations. The Quechee test, multi-criteria analysis (MCA) and the Spanish method 87 were used to analyse visual impacts considering different scenarios. It was concluded that turbines in operation cause lesser visual impact compared to stationary turbines. Shadow flickering caused due to the moving of blades, and the reflection of the sun’s rays from the wind turbine can also cause disturbance for residents living nearby. However, this can be minimized by optimizing the smoothness of rotor blade surface and coating the turbine with a less reflective material. Some other impacts include distraction of television reception or radar due to magnetic forces produced by the wind turbine and the higher chance of being struck by lightning. However, each of them can be minimized by taking proper measures. Through studies by Tremeac and Meunier, 88 it has been concluded that wind energy has less adverse environmental impacts as compared to other energy resources. Life cycle assessment (LCA) process is widely used to investigate environmental impacts. 89 It is recognized as a more comprehensive tool as compared to other environmental management systems (EMS) for efficient integration of environmental aspects in business and economy. Life cycle studies can also be practiced for floating offshore wind turbines or wind-fuel cell integrated systems. Manufacturers can use LCA analysis as a guideline to optimize their products and quality and subsequently obtain an eco-label.
Challenges of wind energy development in India
Considering the cost of conventional generation and wind power generation are considered wind power must compete with conventional generation such as coal. Depending on how dynamic a wind site is, the wind farm might not cost competing. Moreover, the cost of wind energy has declined dramatically in the preceding ten years; the technology needs a larger primary investment than fossil-fuelled generators. Good wind sites are often found in isolated locations, far from cities where the electricity is required. Transmission lines must be built to produce electricity from the wind farm to the city. However, developing just a few previously-proposed transmission lines could significantly decrease the costs of expanding wind power. The wind resource development does not maintain the productive use of the land. Land FIT for wind-turbine installation need compete with alternative plans for the area, which might be more considerably appreciated than electricity generation. 90 The key challenges are (1) incentive challenges, (2) transmission challenges, (3) regulatory challenges, (4) structural challenges, (5) efficiency challenges, (6) manufacturing challenges and (7) R&D challenges.
Incentive challenges
Profitability still dependent on government incentives/tariffs, AD advantage is not conducive to long-term growth (already has been given an option for a GBI scheme).
Transmission challenges (poor grid infrastructure)
Lack of transmission infrastructure – transmission infrastructure that is required to absorb renewable energy with intermittency effectively doesn’t exist. In 2005–2006, around 15% of wind generated in Tamil Nadu was lost because of congestion and a deficit of evacuation facilities. State transmission utilities (STUs) are responsible for transmission infrastructure. But many STUs are not financially stable enough to invest in necessary transmission upgrades. The continuous problem is paying transmission augmentation upstream of interconnection point. Fixing this needs state and central government entities, STUs, power plant developers and power purchasers.
Transmission challenges (grid integration)
Grid codes that cover standards for wind integration are required to ensure that variable electricity production from wind farms do not adversely influence the power system operation. There is a lack of grid codes that incorporate the behaviour of renewable generation. Not just for wind alone. The existing grid codes require being modified to provide standards for system stability and reliability.
Transmission challenges (obstacles to an efficient grid)
The following questions explain the transmission challenges which are the obstacles to the efficient grid. Who–who should pay for the evacuation facility (transmission capacity) up to the interconnection point: developer, power purchase, transmission utility or distribution company? What–what is the purpose of STU in developing transmission infrastructure for renewable energy projects? How so far, no renewable related standards are possible in CEA regulations? How the connection standards and grid code should be modified to accommodate wind energy sources?
Regulatory challenges (restrictive regulations)
Regulations across SERC regarding renewable generation grid connections and transmission prices are not yet uniform and are seldom vague. Costs for wheeling electricity are higher than those assumed by MNRE. Lowering and standardization are also needed also hurdles to ‘open access’ hinder interstate power sale.
Structural challenges
The task of promoting renewable energy is in the hands of the state government. Only 10 states have implemented quotas for a renewable energy share of up to 10 per cent. Wind energy does not have infrastructure sector status such as roads, power or ports projects do. Therefore, banks have been hesitant to go in for non-recourse funding for wind power projects. Till recently, investments in the wind power sector in the country have been mostly for captive purposes (shift towards IPPs because of higher tariffs, RPOs, and long-term PPAs).
Efficiency challenges
Estimate of effective turbine capacity not deterministic because the turbine manufacturers are not ready to give a guarantee. Forecasting of wind for short and medium term is also required. Site allocation process sometimes arbitrary. Without storage, scalability might be hindered, and the use of batteries for storage could increase costs by over 100%.
Looking ahead
Transmission infrastructure enhancements considerably needed. More proactive cooperation between state transmission utilities (STUs), developers and regulators is required along with more flexible distribution rules. A shift from AD to GBI focus is required to boost long-term investments. Short-term forecasting for the day ahead an hour ahead power system operation and dispatch is critical for any market for proper power supply and to minimize the cost of power supply. Encouraging renewable portfolio standard (RPS) and efficient implementation of RPO is required.
Take away for investors
Wind is a mature industry. Several incentives have been given, and more in the pipeline; the recent budget has been liberal. Technology advancements and innovations could further improve efficiency and profitability. Fundamental difficulties present in dependence on incentives, transmission, regulatory, structural and efficiency. These challenges cannot be resolved by private entities alone; private–public initiatives are required to overcome difficulties.
Manufacturing challenges
The two crucial factors that perform a vital role in the performance of the site are the wind at the site, and the machine availability, i.e., WTG will be capable of generation given the source of power exists. 91 Also, other manufacturing issues must be examined as the wind turbine components experience extreme stresses and failures. The challenges encountered include power characteristics, system fatigue, vibrations, the aerodynamics and acoustics of a wind turbine. Proper design of wind turbines must be appropriate concerning the aero dynamical stability and blade loading (for lighter blades). The design must consider the wind turbine blades, casings and towers which must withstand cold, heat, ice, rain and damage from varying wind velocities. Blades need to be constructed with a sizeable strength-to-weight ratio, so experimentation into new materials is essential. The ultimate goal is maximizing performance and decreasing production price without compromising reliability. Manufacturers are studying at weight reduction and enhanced assembly of threaded joints. Engineers are facing hurdles such as close tolerances, the strength of elements to resist operation in challenging situations and the availability of quality elements. It is also a difficulty to produce parts that are lightweight so that the system can be constructed more efficiently, but they must also be strong enough to face demanding operating requirements and the manufacturing is trying to build a local supply chain. The availability of a constant and adequate supply of locally sourced components is necessary, as turbine companies increasingly expand production facilities away from their home base; they are require to be able to hold access to enough quality elements to build the systems at their new place.
There is a challenge for grid security and stability due to the natural wind fluctuations, and man-made win turbine designs which are associated with the infirm nature of wind power. Proper forecasting and scheduling of wind power could address this issue. It is essential to note that the infirm nature of wind power, connected to both natural wind variations as well as man-made designs of the wind turbine, poses a difficulty for grid security and stability. Through proper scheduling and forecasting wind power, the above-said issues can be addressed. The wind turbines which are installed up to the year 2000 are located at sites replete with massive wind potential and having capacity below 500 kW. Repowering is essential to optimally utilize the wind energy resources because it is determined that wind turbines with less than or equal to 500 kW capacity produce 3000 MW capacity installation. The moderate pace of utilization of the country's wind energy production and resource potential in the modern times could be connected to several factors such as the acquisition of land, high rate of interest and inadequate grid infrastructure, etc. There is a demand to build a sufficient grid and transmission infrastructure over the country with significant wind potential so that the state distribution utilities can remove regularly-increasing amounts of wind power. There have to be attractive incentive policies and an integrated policy framework in place to promote investment in the wind sector. Land clearance for wind energy installation and land conversion concerns are very time-consuming, and this should be made smooth. Engineers will have to grow stronger multiskilled, flexible and prepared to travel to acquire skills and most importantly ‘transfer skills’ to ensure the destiny of the wind industry. The great difficulty with wind turbines is that vast numbers of components are required, and therefore the manufacturing sector needs to accommodate to make the increasing quantities. The education qualification of the engineers is essential in the manufacturing field, and they are expected to have a bachelor, master or doctoral degrees in product engineering with experience in manufacturing qualifications and process development.
R&D challenges and research studies
Research and development (R&D) performs a crucial part in the growth of the country and the accomplishment of its vision, especially in the wind power sector. The nation has invested heavily in building a robust R&D foundation that facilitates the design of state-of-the-art products by leveraging skills from around the earth. The wind turbine technology has been continuously dynamic, and India has implemented its experience to identify the primary requirements of this capricious environment which include reliability, ease of operation, cost reduction and load reduction for weight. Its focused research, evolving development and cutting-edge technology have made India a market leader in the wind industry. The country focus on producing innovative products and services has helped in producing wind energy attractive and profitable for investors.
The research issues (challenges) anticipated in the short-term time span are (1) resource characterization for offshore and land-based deployment, (2) wind atlases for the nation (3) cost-effective manufacturing techniques, (4) state-of-the-art methods and testing equipment for large wind turbine elements, (5) advanced electric system design for large levels of wind penetrations, (6) advanced techniques for electricity markets, (7) wind plant internal grid design and grid codes, (8) issues of spatial planning, (9) tools to identify price drivers of WET, (10) recycling of wind turbines. Research issues anticipated in the mid-term time span include the following: (1) siting optimization, (2) build environment resource estimate, (3) wind plant complex-flow modelling, and experimentation, (4) wind and energy production forecasts, (5) systems engineering to optimize designs, (6) wind turbines in deep waters offshore and the integrated numerical design tools for the offshore, (7) distributed systems upgraded design, (8) wind turbines in diverse working conditions, (9) innovative rotor architectures, (10) noise reducing technology, (11) innovative drivetrain designs and topologies, (12) advanced power electronics, (13) support structure design and optimization, (14) advanced wind turbine controls, (15) offshore installation and logistics, (16) small wind turbine production, (17) operational data management, (18) operations and maintenance (O&M) and diagnostic techniques, (19) testing facilities and practices, (20) transmission planning, (21) offshore transmission planning, (22) power system studies, (23) distributed wind on the grid, (24) human use effects and mitigation, (25) environmental strategies and planning, (26) workforce education. The issues identified to deliver results in the long-term time span are as follows: (1) atmospheric complex flow modelling and experimentation, (2) marine environment design limitations, (3) floating offshore wind plants, (4) innovative turbines and components, (5) active blade elements, (6) advanced blade materials, (7) advanced generator design, (8) advanced offshore support structures, (9) advanced wind turbine, and wind power plant controls, (10) advanced manufacturing techniques, (11) high-reliability system expansion, (12) grid operational tools, (13) smart grid architectures, (14) mitigate impacts on marine environments.
Many researchers have developed mathematical models for the calculation of material and structural stresses for the improved design of the horizontal axis and VAWTs. 92 The reasons being: To determine the extreme-response of wind turbines which are controlled by varying the pitch angle 93 to design optimized and more reliable wind turbines, 94 to consider the most influential parameter which is the blade pitch angle, to understand the aerodynamics of the blade (‘Aero foil’ shape design parameter). Calculating the strength of fibrous composite materials and also to determine the failure strength of these materials.95,96 To design and to increase the lift coefficient of airfoils and also to reduce both fatigue and extreme loading. To achieve higher lift-to-drag ratio. To design modifications such as diffuser augmented wind turbines (DAFT).97,98 Research has also been carried out on building augmented wind turbines (BAWT) in which the building shape is optimized to increase the wind energy. 99
The R&D unit has taken out projects in different fields like grid associated studies of wind farms, maximum blade angle for energy maximization and failure investigation of gearboxes of wind turbines intended at the current wind turbine installations. The continuing projects in the NIWE department are (1) expansion and validation of design methodologies and design tools for low and medium wind regimes, (2) experimenting wind farms, (3) experiment on small wind turbines, (4) interconnection of wind turbines with the grid modelling, (5) flow distortion throughout the wind turbine nacelle parameterization, (6) renewable energy devices installation. 100 (7) grid-integrated wind energy conversion system and its power evacuation study, 101 (8) survey on power quality concerns on grid-connected wind farms and their remedial actions, 102 (9) experimental aspects of wind turbine blading over full 0 to a 360° angle of attack, 103 (10) research on the small capacity wind turbine with the compressed air energy storage system, (11) design and improvement of a useful small mill of 5 kW capacity for producing maximum/optimum power in a given time, (12) design and developing of a grid interactive 3 kW rooftop wind turbine-based hybrid system, (13) optimal design of axial flux permanent magnet generator for low-speed direct-drive wind turbine applications, (14) cyber-physical controller for real-time EMS of microgrid application and hybrid energy management, (15) Low wind speed regimes and the design and expansion of 1 kW hybrid VAWT system, (16) Development and installation of micro thruster augmented wind power generator using a 200 kW MICON Power Plant at CWET facility in Kayathar, (17) a new fused converter for wind–PV hybrid system to power rural telephony, (18) design, construction of 3 kW wind aerogenerator and wind charge controller, (19) electrifying the residential–rural area using hybrid DC microgrid system, (20) domestic small horizontal axis wind turbine and its vibration control, (21) structural assessment and strengthening of existing telecom towers to enable them to support small wind turbines, (22) with the help of the magnetically levitated micro-vertical axis windmill, generating electricity in low-velocity regimes.
Suggestions are made to overcome the barriers
As discussed earlier the obstacles which are preventing the growth of WET are related to (1) capacity allocation to the location, (2) site choice including geography/topography/wind resource, (3) land clearing, (4) proper policy framework, (5) WTG technology and (6) power evacuation up to the grid. The following recommendations are made to overcome the barriers. There is a requirement for the long-term prospect in policies which will afford greater regulatory and policy confidence to the investors and will assist in bringing more investment in the state. Provide project area information such as whether the project is in the forest, revenue or private land. Decrease the obstruction in land identification/allotment for wind energy projects by explaining the procedures and allow the purchase of private property immediately from landowners. Investors of wind energy should be permitted to trade electricity to any entity of their decision (like third-party sale (TPS) deed. Rigidly enforce that the projects completed within three years from the date of allocation. The signing of PPA, wheeling, and banking, etc., should be done promptly after commissioning the wind project to bypass production loss for the investor. Specification of region-wise CUF/tariff based on wind power density (WPD) to induce the investors to investigate new sites with changing wind speeds and wind power densities. Following initial capacity allocation by the government, state renewable energy development limited being the nodal agency should be permitted to clear the capacity enhancement/capacity transfer instead of referring to the government again for checking and permission. Policy framework for repowering of wind farms is to be enunciated. 104
Policy recommendation for the wind power sector
Policies to support wind energy are often created to align with broader goals including diversification of electric generation sources to develop long-term price stability; reducing of greenhouse gas emissions, and technology innovation to enhance global competitiveness. Although wind energy has grown cost-competitive in various contexts, difficulties to wind power deployment still exist. Important limitations include (1) absence of consistent policy signals, which can generate uncertainty in markets, (2) unstandardized and time-consuming regulatory and sanctioning processes, (3) concerns of utilities associated to the integration of distributed or variable power on the grid, (4) public concern linked to land use, sound, visual and other environmental consequences that may be connected with wind, (5) demand for post-installation and ongoing skillful labour for turbine maintenance, (6) at high wind penetration levels and in competing for wholesale markets, potential influences on other production sources due to low or negative bidding.
Policy recommendations for the wind power sector in India are given below: 105 Renewable electricity (wind) standards: (1) establishing long-term renewable energy sources targets that rise over time to promote sustained wind growth particularly concerning financial incentives, (2) setting the standard to support wind production, (3) establishing subnational RESs to help various wind resources and development requirements, (4) building set-asides for offshore wind technologies, (5) supporting a broader enabling policy condition. Feed-in-tariffs: (6) FIT should be created to improve deployment of wind energy technologies by giving market confidence for developers based on the long-term purchase agreement for electricity generation at a specified cost. (7) differentiating wind FIT payments concerning resource quality, (8) differentiating wind FIT payments about project capacity, (9) differentiating wind FIT payments for offshore wind advancement, (10) concerning the wind technology, wind FIT payments can be adjusted. Net metering and Interconnection standards for distributed wind: (11) Bonus payments and premiums to encourage broader wind developing intentions. (12) Wind FIT cost degression need, (13) caps on projects or capacity, (14) building interconnection standards, (15) a wind net metering policy needs. Wind investment and production tax credits: (16) Building an appropriate incentive rate and controlling prices, (17) establishing a steady policy environment, (18) determining the tax incentive period, (19) considering wind production tax credit, (20) wind investment tax credit, (21) supporting non-taxable entities, (22) recognizing competitive renewable energy zones, (23) decreasing risk and cost of capital, (24) creating wind ordinances, (25) streamlining grant processes.
Conclusion
Energy security, economic growth and environmental protection are India’s energy policy drivers in light of raised costs of crude oil. A crucial part of the solution will lie in developing wind energy technologies to address concerns about energy security, economic development in the face of increasing energy costs, competitiveness, health expenses and degradation of the environment especially environmental influences (noise) related to wind power generation, interference due to radio wave communication equipment and deaths of birds due to rotors. A rapid push is needed to meet the target to foster the growth of several other associated businesses. The industry is developing wind power technology and engaged in bringing new products to market that meet the requirements of the local conditions across the country.
However, in India, research and development need additional assistance from the public sector, and funds must be made ready for dedicated government agencies and universities for creating the essential ecosystem for industry-specific projects. Which in effect improves the capabilities of the technical institutions and build a robust research community and ultimately decrease the price of the wind system. For the time being, attained grid parity continues a challenge, and we suggest operating expenditure and capital expenditure to be decreased. The country’s increasing energy demand requires effective energy management. India should establish more consistency and synchronization among the central and state electricity regulatory bodies and government departments for effective implementation of multiple plans, policies and incentive.
In the coming years, the energy mix of the country is going to change. It is high time to develop a comprehensive wind energy policy and design assistance schemes to send across positive signals to the wind energy generators. The Indian government has set the framework for a broad-based wind energy program and created it primarily to meet the increasing energy needs and to meet power deficit. Although the price reduction and technological advancement of wind energy systems in recent times have been supporting, they continue an expensive source of energy. The commercial arm of MNRE, IREDA and other financial and banking organizations have supported the industry as a stable market where there is guaranteed offtake and no marketing difficulties. The Government has stated a laudable renewable energy target of 175 GW by 2022 out of which 60 GW will be getting from wind energy. This will need an addition of wind power more than 6.5 GW per annum. The nation would require over 26 GW per annum from all the renewable sources to reach 100% (175 GW) by the year 2022 following the national action plan for climate change. The government commitment to a promotional tariff, incentivizing generation, plans to revitalize the REC market through RPO obligation will undoubtedly make this market active and self-sustaining.
Footnotes
Declaration of conflicts of interests
The authors declared no potential conflicts of interest with respect to the research, authorship, and/or publication of this article.
Funding
The authors received no financial support for the research, authorship, and/or publication of this article.