
Abstract
This study is based on the removal of cadmium from water by adsorption onto nanochitosan in order to reduce the impact of cadmium toxicity to humans and animals. The adsorption of cadmium onto this particular nanochitosan is a novel study assessed through equilibrium and kinetic experiments. It provides an effective method of cadmium removal to avoid cadmium health impacts described herein. The influence of different parameters on the effectiveness and efficiency of cadmium adsorption onto nanochitosan are presented by studying the effects of pH, initial cadmium concentration and the dosage of nanochitosan. Commonly used equilibrium models are described, and the discussion focuses on an analysis of different isotherm and kinetic models to determine the best fit model for predicting the cadmium–nanochitosan adsorption capacity. All models were studied for their statistical significance using two error methods; the Sum of Squared Error to the natural experimental data and the R2 method to the linearised experimental data. Since the R2 values were very close, the best fit is described according to the findings of the minimum Sum of Squared Error values. The capacity of nanochitosan was found to be 1.96 mmol Cd/g adsorbent. Most previous research studies propose a Langmuir equilibrium model for the adsorption of cadmium on chitosan and nanochitosan; however in the present study, three isotherms were tested; the best fit isotherm was the SIPS followed by the Langmuir, and the best fit kinetic model was the pseudo-second order followed by the Elovich model. The SIPS model indicates a multiple adsorption mechanism, a second-order chemisorption mechanism with two main complexation bonding methods, namely, a complex with one amine functional group and a second complexing type with two amine groups and two hydroxyl groups.
Introduction
Water shortage is a growing global challenge, an issue that comes from increasing demand and increased contamination of water. With increased industrialisation, the extent of wastewater contamination with heavy metals such as cadmium is expected to grow, an aspect that poses serious health risks. Furthermore, long-term exposure to cadmium has been found to be highly correlated with different chronic diseases, which include cancer, diabetes, kidney failure and high blood pressure.1,2 The first findings of cadmium-induced health issues can be traced back to the 1930s, where acute gastrointestinal effects were reported among industrial workers exposed to the metal.3,4 The incidence of cadmium toxicity was found to be common among people consuming drink and food contaminated with the substance.5,6 Globally, there are concerns that cadmium-related diseases are related to environmental pollution. 1
According to Kazemipour et al., 7 cadmium is naturally found in the sulphide ores of zinc, lead or copper, and consequently, it is found in discharges from the commercial production processes of these metals. In the past, cadmium was used for electroplating of metals and in the stabilisation of plastics. In recent years, it has become a significant component in the manufacture of a vast amount of electronic applications, also in the communications and in the aerospace industries. 8 All these sources contribute to its migration into rivers and groundwater and subsequently into the food chain. Agriculture is another significant source of cadmium, predominantly from phosphate ore-based fertilisers. 9 The chemical fertiliser is understood to have some traces of cadmium, which contaminate the soil and water through runoff, ending up in water bodies. Fossil fuel combustion in thermal power stations has been found to be a significant source of cadmium, which is released into the atmosphere. It is therefore evident that there are several different sources of cadmium, including sewage sludge and smelter emissions.
It is difficult to remove toxic metals from an aqueous medium, as they are often present in trace amounts, can create complexes with natural organic matter and are not biodegradable or decomposable. They cannot be metabolised, are highly toxic, enter the food chain through a number of pathways and cause long-term damage to living organisms.10,11 Many of the techniques used presently for water treatment including coagulation, complexation, chemical precipitation and biological applications are not viable for cadmium removal, as they cannot meet the regulatory standards.12,13
Other popular techniques include reverse osmosis, liquid–liquid reduction, oxidation-reduction, membrane separation and evaporation. 10 However, adsorbents are preferred for their low-cost and ease of operation.14–16
Ion exchange materials have traditionally been used for cadmium and other heavy metal removal processes.17,18 However, these materials are also expensive to produce and the search for cheaper more sustainable adsorbents is ongoing. Natural materials can provide heavy metal and other organic pollutants removal as an attractive economic option.19–22 The opportunity for producing heavy metal adsorbents with metal ion attractive groups has been achieved from the waste shell of crustaceans in the form of the amino-functionalised polysaccharide chitosan.7,23–28
In the present study, a nanochitosan material has been produced to enhance the surface area for adsorption. 29 The removal of cadmium from water has been investigated using equilibrium studies to estimate the adsorption capacity, and rate studies have been performed to determine the kinetic parameters. The equilibrium data have been analysed by the Langmuir, Freundlich and SIPS equilibrium isotherm models to distinguish between a single adsorption mechanism (Langmuir), a heterogeneous mechanism (Freundlich) and a multi-mechanism adsorption process (SIPS). Subsequently, the effects of different parameters on the effectiveness and efficiency of cadmium adsorption onto chitosan are presented by studying the effects of pH, initial cadmium concentration and the dosage of nanochitosan. Based on the results of the present study, a multi-mechanism process of the adsorption of cadmium onto nanochitosan has been proposed.
Materials and method
Materials
Chitosan (2-acetamido-2-deoxy-D-glucose-(N-acetylglucan)) is a partially deacetylated polymer of acetylglucosamine and it is usually prepared from chitin (2-acetamido-2-deoxy-D-glucose-(N-acetylglucosamine). The degree of deacetylation (DDA) of chitosan was 99.83% and determined by infrared spectroscopy. All other chemicals (acetic acid, sodium hydroxide and nitric acid) used were of analytical grade. For this study, the nanochitosan adsorbent, a material with high ability of adsorption, has been prepared to attract the metal cations of cadmium. To achieve the study objective, the interaction of nanochitosan adsorbent and cadmium metal ions in aqueous medium has been investigated using different concentrations of cadmium ion (Cd2+) while regulating a standard volume of solution and with the addition of a controlled mass of the exchange nanochitosan adsorbent. The effect of pH on the adsorption capacity has also been investigated in order to select an operating pH to optimise cadmium removal. The results obtained from the process have been used to assess if nanochitosan is a viable material which can be used in an adsorption treatment as an effective adsorbent.
Preparation of nanochitosan
Chitosan powder was rinsed several times using deionised (DI) water to eliminate any impurity present on the adsorbent surface. It was then dried under vacuum condition for some time (three days), and stored in a desiccator for a while before being used in the conversion process. Then, 2.5 g of the powder (chitosan), which acts as the main raw material, was completely immersed in 1% dilute acetic acid under conditions of magnetic stirring. A tripolyphosphate (TPP) solution (95.4 ml, 1.45 mg/ml) was then mixed with the chitosan solution (150 ml, 2 mg/ml in 0.5% dilute acetic acid) at a rate of 10 ml per min in a 500 ml round bottom flask while stirring (1200 r/min). The mixture was further stirred for another 20 min to obtain a milky emulsion at a pH of 5 as shown in Figure 1. To obtain the nanoparticles, the mixture was frozen at a temperature of about –4°C. 29 Afterwards, the nanoparticles were then exposed to atmospheric conditions where they were precipitated. This was followed by stirring for one day before centrifugation. The nanoparticles were then washed using DI water before being vacuum dried at 60°C for another one day. This method produced nanochitosan particles in the range between 150 and 250 nm when using a Malvern zetasizer.
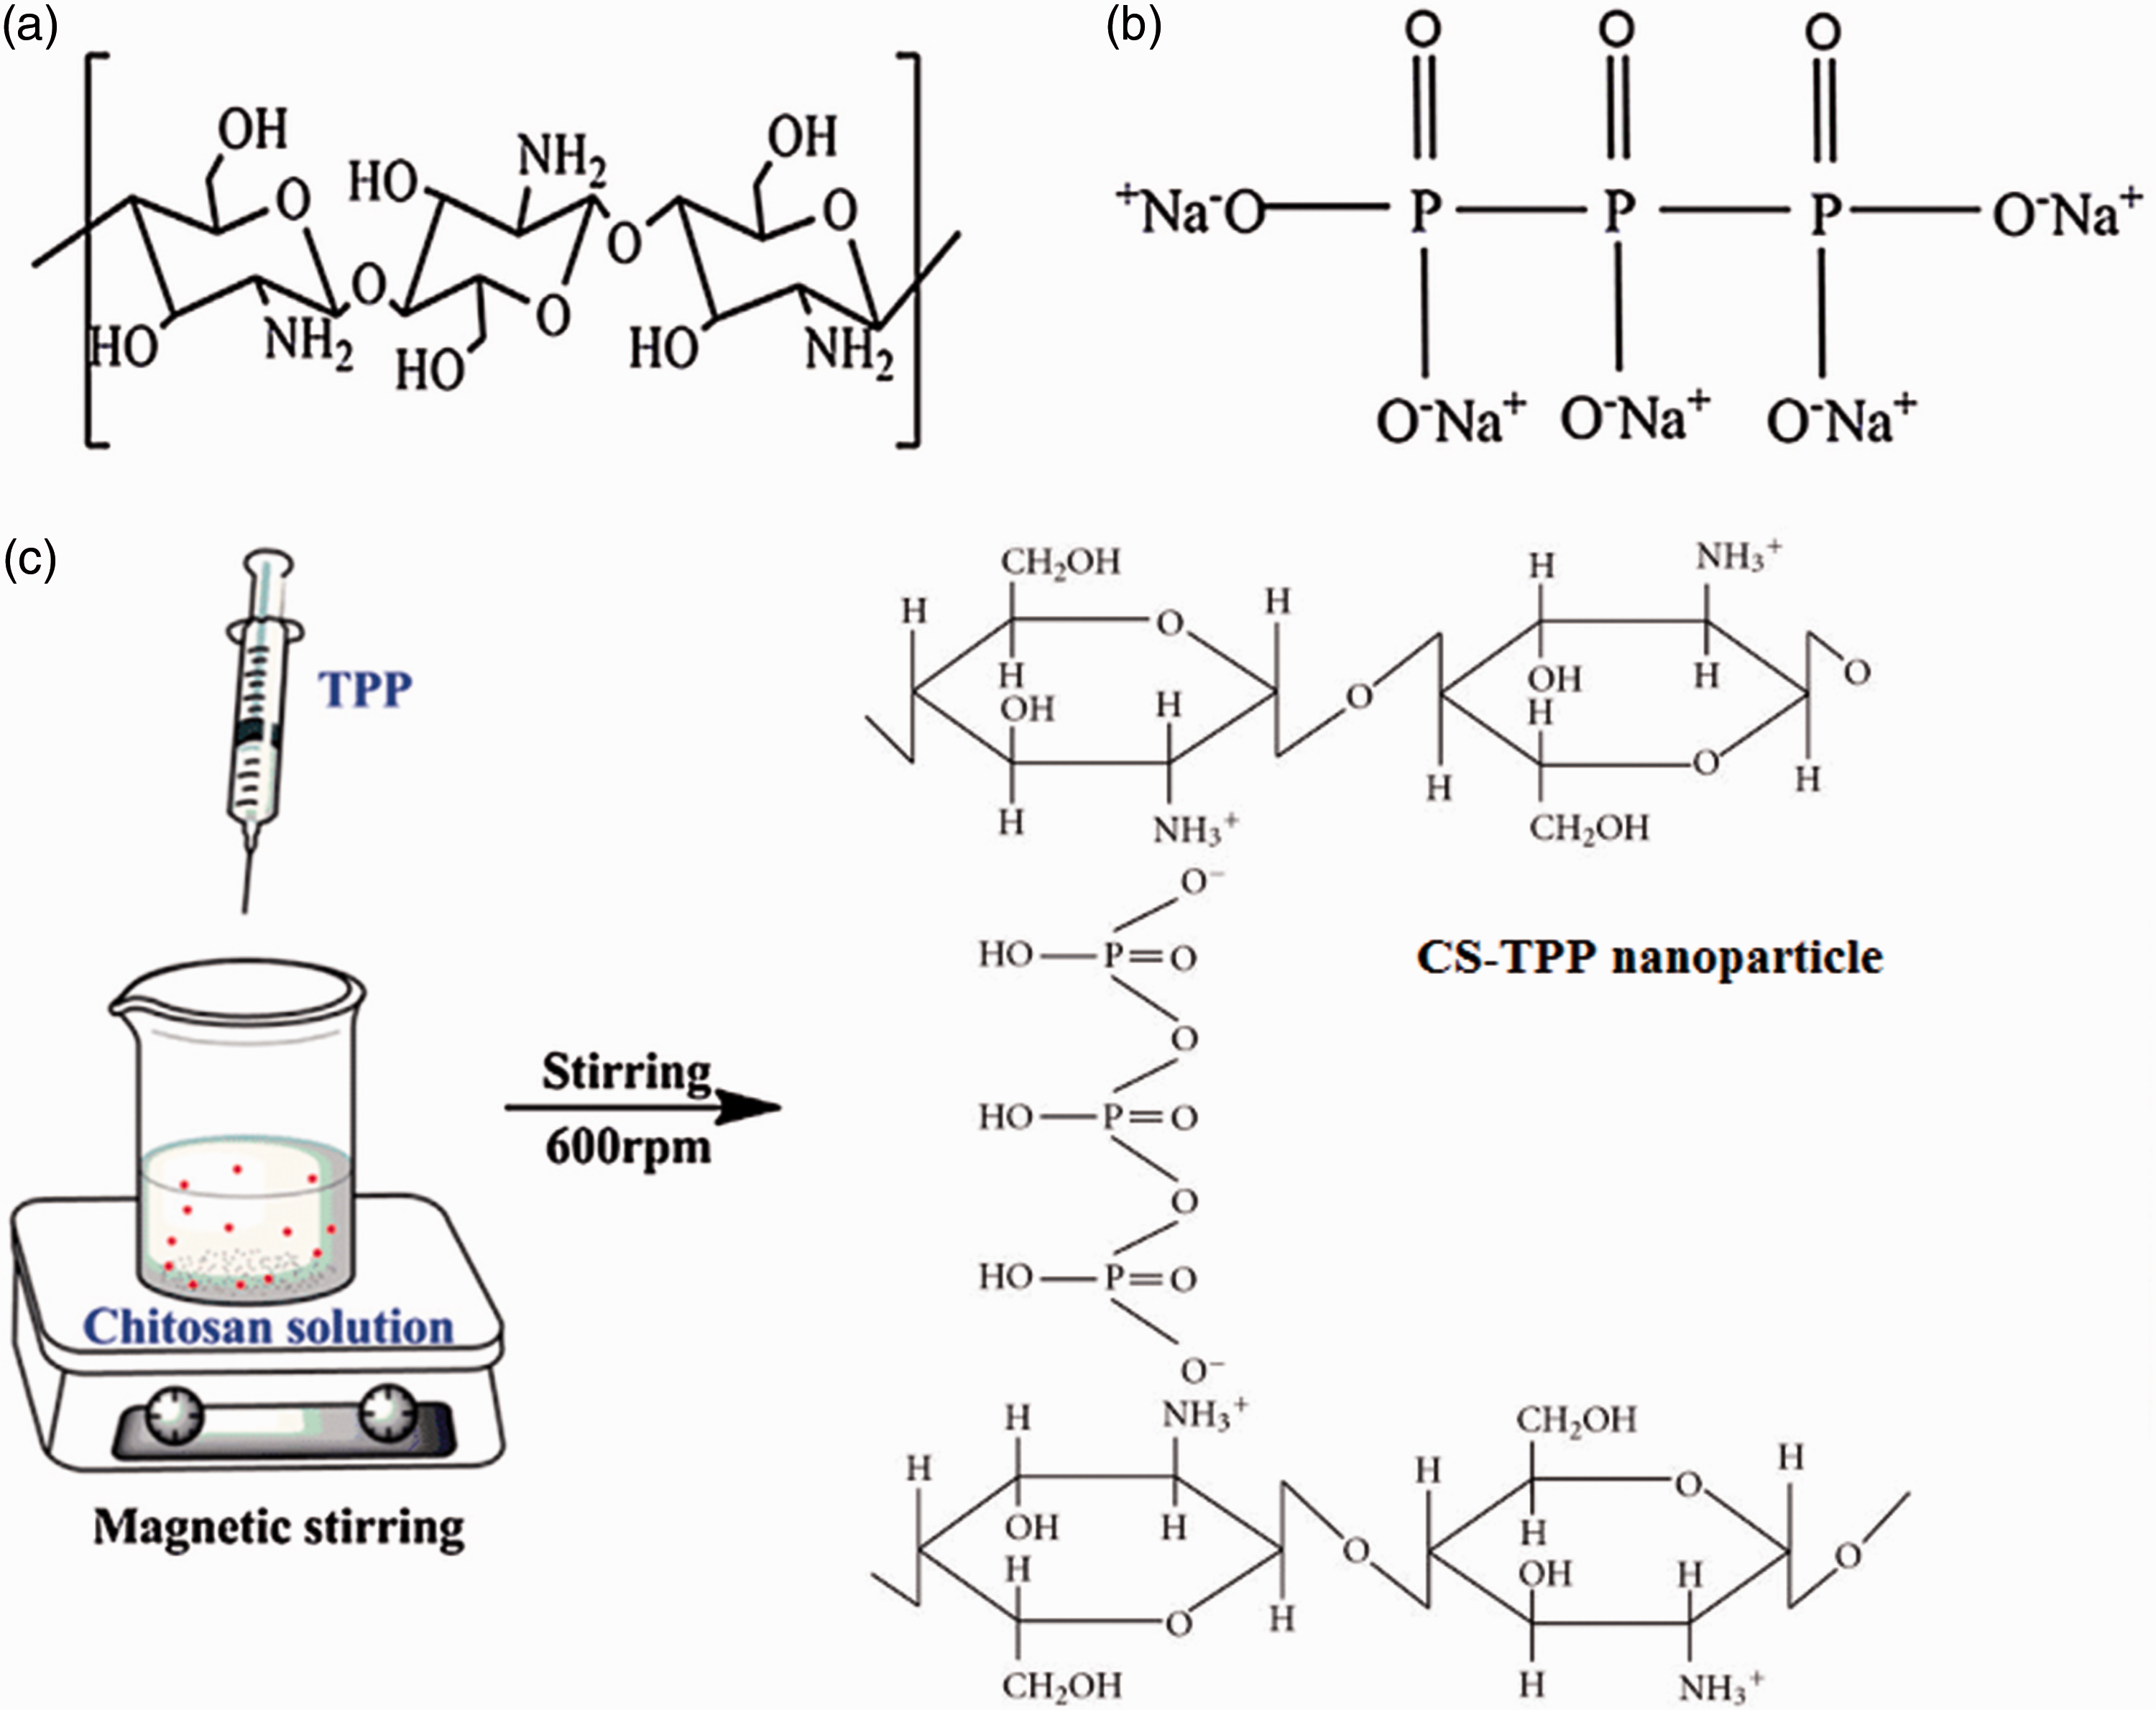
Mechanism of preparation nanochitosan by using TPP as a cross-linker. (a) Chitosan, (b) sodium tripolyphosphate, (c) sample solution. 30
Characterisation of the adsorbents
Several key properties of the nanochitosan were determined, namely: pHpzc, surface charge, crystallinity, surface area, degree of deacetylation, NH2 loading and particle size range.
Sorption study experiments
The Cd2+ solutions were prepared at different concentrations using cadmium nitrate (Cd(NO3)2). The initial pH was changed by the addition of hydrochloric acid while maintaining the temperature at around 22°C. About 0.025 g of nanochitosan was added together with about 50 ml of aqueous cadmium solution in an HDPE bottle. The process further included sample collection at different time intervals to understand the optimal time required to achieve equilibrium. Additionally, the suspension was left to settle for about 2 min before collecting the top, clear part of the solution. The collected solution was then measured to analyse the Cd2+ concentration with the use of a Perkin Elmer Optima 3000 XL-Series ICP-OES.
To effectively conduct the equilibrium isotherm studies, a nanochitosan mass of 0.1 g was used. This mass was added to a solution of 100 ml and agitated at a speed of 200 r/min for 12 h. The initial Cd2+ concentrations were (mmol/L) as follows: 0.25, 0.50, 0.75, 1.00, 1.25, 1.50, 1.75, 2.00, 2.50, 3.00, 3.50, 4.00, 4.50, 5.00, 5.50 and 6.00.
Kinetic studies
Batch kinetic experiments have frequently been used to investigate the influence of different parameters on the adsorption rate of various materials, since the rate of pollutant removal – hence the contact time required for adsorption – has a significant effect on the size and therefore the capital cost of the polluted water treatment system. To adequately achieve this study objective, the standard agitated adsorption tank was used in the experiment as shown in Figure 2. All the dimensions of the batch adsorber shown in Figure 2 are relative to the diameter, Di, of the adsorber vessel. This configuration will provide ideal mixing for the nanochitosan adsorbent in the vessel.

Agitated batch kinetic adsorption vessel.
The process included the addition of cadmium metal ion solution with specific concentrations, which were adjusted to an initial pH value of 4.5. A volume of 1.7 L of the metal ion solution was added to the container, and a specific mass of the nanochitosan was added into the vessel as required. A constant agitation speed of 400 r/min was used to achieve constant mixing and ensure that any external mass transfer across the particle boundary layer was constant in all experiments. The study involved the investigation of two main variables. Firstly, the effect of cadmium ion concentration – this study adopted a constant mass of chitosan (1.70 g) with initial concentrations of 1.00, 2.00, 3.00 and 4.00 mmol/L. Secondly, the effect of nanochitosan mass – this involved the use of initial Cd2+ concentration of 3.00 mmol/L with the different nanochitosan masses of 0.85, 1.70, 1.75, 2.150, 3.40 and 5.10 g.
Results and discussion
Nanochitosan characterisation
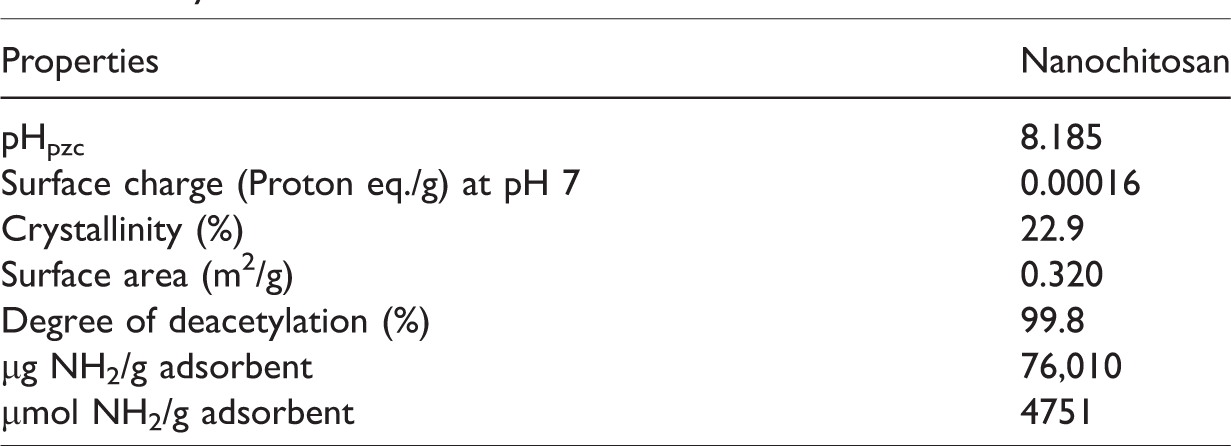
The physiochemical properties of nanochitosan are summarised in Table 1. The potentiometric titration technique was used in measuring the surface charge density of the material (nanochitosan). A mass of 0.5 g of the sample was dissolved in 100 ml of nitric acid. The solution was then titrated with 0.1 M standard sodium hydroxide (NaOH). To complete the procedure, nitrogen gas was then bubbled through the solution, and following this procedure the pH measurement was carried out with a digital pH meter (Orion, model 420 A pH meter).
Physiochemical attributes of nanochitosan.
To determine the point of zero charges (pHpzc), potentiometric mass titration developed by Faria et al.
31
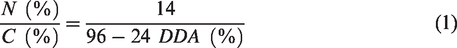
was undertaken. To determine crystallinity of the particles, X-ray diffraction was used, and the surface area was obtained using a Coulter Omnisorb Model 100CX BET analyser. The DDA was determined as shown by equation (1).
The particle size range as measured by the Malvern zetasizer was in the range between 150 and 250 nm.
Effect of solution pH
The effect of the solution pH on the adsorption capacity is shown in Figure 3. The cadmium capacity tends to a saturation value after pH 4 at a capacity of 1.96 mmol Cd/g nanochitosan. At low pH values, the H+ ions compete with Cd2+ for the adsorbent sites. After pH = 5.0, the adsorption capacity becomes constant at 1.96 mmol/g up to a value of pH = 7. No measurements were undertaken after pH = 7, due to the likely precipitation of metal hydroxides in an alkaline environment. That is, the adsorption of cadmium increases with increase in pH, but up to a given point (at an approximate pH = 5). This is attributed to the fact that surface charge is positive at lower pH values (pH < 2), a case which makes H+ ions effectively compete with Cd2+, thus a decrease in adsorption.

Effect of pH on Cd2+ adsorption by nanochitosan (adsorbent weight: 0.100 g, volume: 100 ml).
However, between pH of 2 and 5, there is a rapid increase adsorption due to the decreased competition from hydrogen ions, which have become fewer with increasing solution pH, and the negatively charged surface of the adsorbent easily attracts positively charged cadmium ions.32,33 This is because at a pH of around 3.5, the concentration of H+ ions becomes approximately an order of magnitude less than cadmium and competition becomes insignificant resulting in a constant saturation capacity to be reached. 34 In all the studies, the final solution pH was in the range of 5.5 to 6.0.
Effect of initial Cd2+ concentrations and contact time
Adsorption of cadmium was studied at different masses and concentrations at varying contact times (0–420 min). It was observed that cadmium adsorption occurs rapidly at the very early stages on the adsorbent’s external surface which is then followed after approximately 50 min by a more slow internal diffusion process, most likely a rate controlling stage.35,36 This two-stage behavior and its division at approximately 50 min was independent of initial Cd2+ concentration which was varied between 1 and 4 mmol, although the capacity and rate of uptake were increased under increasing Cd2+ concentration (Figure 4). Furthermore, the observed initial rapid adsorption can be attributed to the availability of many surface sites, which are occupied within a short time followed by a reduction in the adsorption rate. Once the cadmium solute molecules have occupied these sites, the remainder in solution need to diffuse into the internal sites; in addition, the occupied surface sites will also tend to repel the oncoming ones, resulting in a further reduction in the adsorption rate. 33

Effect of initial Cd2+ concentrations at initial pH = 4 and final pH = 5.5–6 and m = 1.7 g.
Effect of adsorbent mass on Cd2+ adsorption by nanochitosan
The adsorption takes longer to reach equilibrium in cases where the adsorbent mass is the smallest (m = 0.85 g) but faster where the mass is larger (m = 5.10 g) as shown in Figure 5. The higher the adsorbent mass, the greater is the surface area and the number of adsorption sites, and therefore the cadmium adsorption rate will be faster than the lower concentration cases. 37
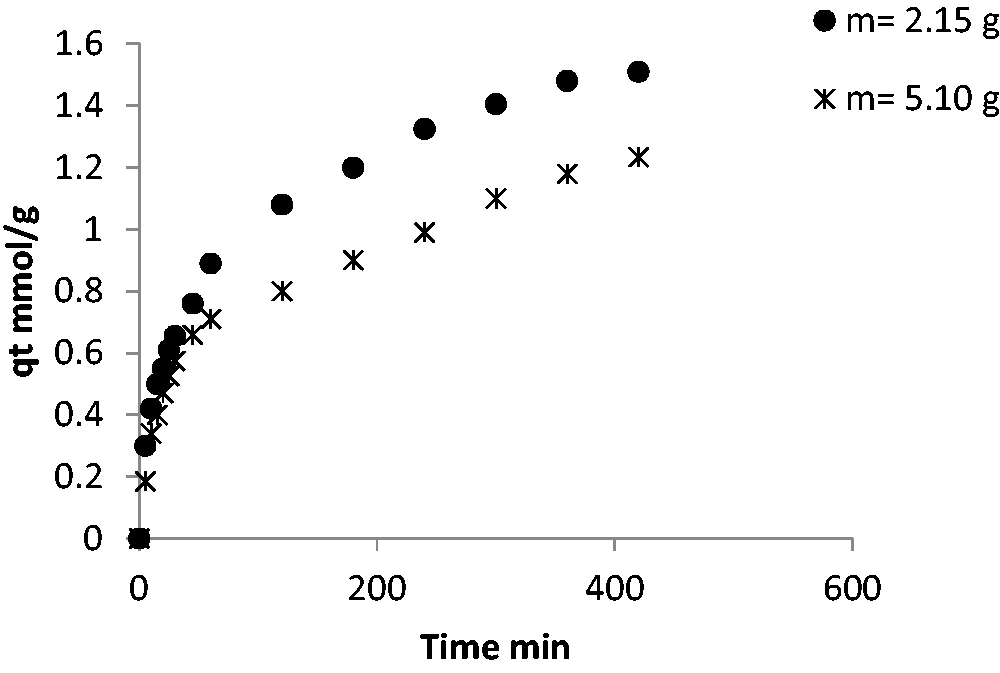
Effect of adsorbent dosage on the adsorption of Cd2+.
Adsorption isotherms
Graphs are frequently used to represent adsorption in equilibrium studies and are referred to as adsorption isotherms. The adsorbate amount on the adsorbent in the form of a function of concentration or pressure at a specific temperature defines the process of adsorption. The adsorbed quantity is normalised by the adsorbent mass for comparison of different materials.
38
The adsorbate adsorbed at the equilibrium, qe (mg/g) was calculated in equation (2).

In the above equation, C0 and Ce (mmol/L) are the initial and equilibrium concentrations, respectively. The volume of the adsorbate (L) is shown as V and the mass of the adsorbent (g) is depicted as m. Several models can be used to predict the representation of an equilibrium distribution. Some of the commonly used models are the Langmuir isotherm, Freundlich isotherm and SIPS isotherm.
Langmuir isotherm model
This model
39
assumed that adsorption takes place at only specific homogeneous sites within the adsorbent. When a specific site is occupied by a particular molecule, adsorption does not take place at that particular site.
40
It is also assumed that all sites are equivalent in terms of their energetic characteristics and their identity. The Langmuir isotherm is represented for the adsorption process in a linearised form by equation (3).

Freundlich isotherm model
This model
41
describes heterogeneous systems and contains a heterogeneity factor 1/n. The model is applicable to scenarios which involve the non-uniform distribution of the adsorption affinity and heat with regard to heterogeneous surfaces and is used as a means to represent multilayer adsorption.
42
The Freundlich isotherm is represented for the adsorption process in linearised form by equation (4).

SIPS isotherm model
The Langmuir and Freundlich expressions are combined to predict heterogeneous systems of adsorption using the SIPS isotherm. The SIPS isotherm model helps overcome the problem of rising adsorbate concentration that is inherent in the Freundlich isotherm model.
42
The linear form of the SIPS isotherm model is depicted in equation (5).
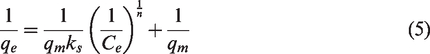
The SIPS equilibrium constant, kS (L/mg), is nonlinear, and therefore Microsoft Excel Solver was used to obtain the best fit for the three constants kS, qm and n. The fitted values were kS = 0.0412 L/mg; qm = 1.96 mmol/g and n = 1.37. The qe vs. Ce values are plotted in Figure 6 to illustrate the performance of this equilibrium model.
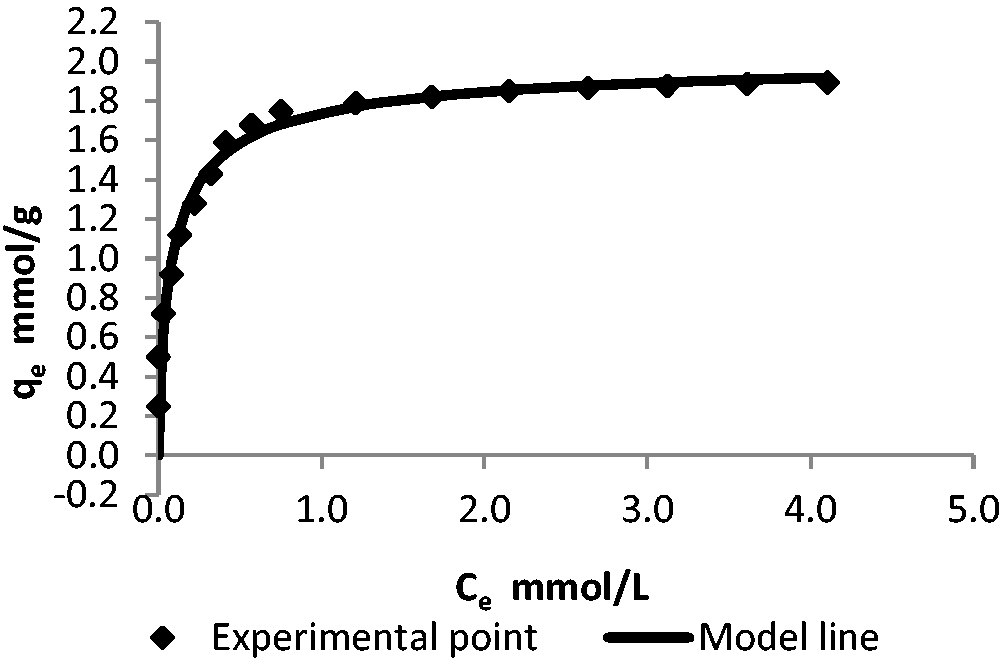
SIPS plot for the adsorption of Cd2+ on nanochitosan at initial pH = 4.5 and final pH = 5.5–6.0.
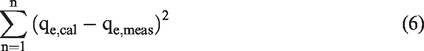
The SSE and R2 values for each of the isotherms and equations discussed previously are listed in Table 2. Sum of the squares of the errors method is a dimensionless quantity used for nonlinear fit and it can be represented by equation (6)
The SSE and R2 values for different isotherm models.
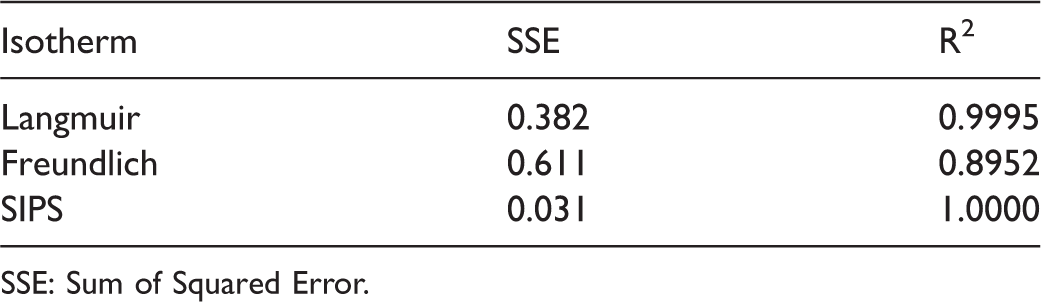
SSE: Sum of Squared Error.
R2 is a statistical parameter that measures the deviation of data from the regression line and it is used for linear fit and is given by equation (7)


In Table 2, the SSE values show their deviation from the ideal fit. 43 The SIPS isotherm shows excellent correlation and an ideal fit to the experimental data.
The SIPS isotherm is a combined expression for both Langmuir and Freundlich models. At high adsorbate concentration, the SIPS behaves as Langmuir isotherm model with less deviation. The Langmuir isotherm also shows a very good correlation, although its deviation is less than in the case of the SIPS model. The Langmuir model was originally developed for a gas-solid phase model and may have limitations in terms of its applicability to the liquid phase. The Langmuir assumptions include ideal adsorption on homogenous sites having a constant energy of adsorption.
The Freundlich equilibrium model is particularly an outlier in this regard confirming that the model may, in fact, be deficient in terms of its thermodynamic principles. 42 A model adhering closer to the ideal fit in this case is the SIPS isotherm followed by Langmuir isotherm.
The R2 statistic depicts the success of a particular fit when considering variation with respect to data. 43 The R2 values lie between 0 and 1, and a specific value indicates the proportion of variance in a specific model as a percentage. In Table 2, the R2 value of the SIPS isotherm explains 100% of the variation in the data, indicating a multi-mechanism system. The Langmuir isotherm model also depicts a similar case. However, the Freundlich isotherm model values show the least correlation between the model values and predicted values. As R2 is most suited to linear equations and not a suitable parameter to compare models of different numbers of parameters, for this study, the SSE is considered as a more viable measure to determine the best model.
Kinetic models
Pseudo-first-order model
The ideal adsorbent is required to have a fast adsorption rate and high capacity. The pseudo-first-order and pseudo-second-order models are two widely used models in the study of adsorption kinetics.
44
The linear form of pseudo-first-order model is depicted in equation (10).

The pseudo-first-order model operates with a number of assumptions including the occurrence of sorption exclusively on localised sites and an absence of interaction between sorbed ions. 45 Also, it is assumed that the adsorption energy is independent of surface coverage. The concept of maximum adsorption is applicable in the presence of a saturated monolayer consisting of adsorbates on the surface of the adsorbent. Plotting ln(qe–qt) vs. t, gives the value of qe and k1 which were derived from the slope and intercept, respectively.
Pseudo-second-order model
The pseudo-second-order equation helps to evaluate the effective sorption capacity, the rate constant of the pseudo-second-order kinetic model and the initial sorption rate even when no parameters are known prior to the experiment.
46
The linear form of pseudo-second-order model is shown in equation (11).

Plotting t/qt vs. t gives the value of qe and k2 which were derived from the slope and intercept, respectively.
The effect of varying initial cadmium solution concentration on the time-dependent adsorption capacity is shown in Figure 7 for four different initial concentrations, and the agreement between the pseudo-second order model predictions and the experimental data points is excellent. In Tables 3 and 4, the individual values of the Correlation Coefficients and the Sum of Squared Error (SSE) are shown.

Pseudo-second-order plot for the adsorption of Cd2+ on nanochitosan at initial pH = 4.5 and final pH = 5.5–6.0 and m = 1.70 g.
Pseudo-second-order constants and error analysis for variable mass.

SSE: Sum of Squared Error.
Pseudo-second-order constants and error analysis for variable initial concentration.

SSE: Sum of Squared Error.
Elovich equation
One of the most useful models for describing such adsorption is the Elovich equation (12), which is given by

The linear form of Elovich equation can be obtained by integrating equation (12) to produce equation (13)

Plotting qt vs. ln(t) gives the values of a and b, which are derived from the slope and intercept, respectively.
In the Elovich equation, it is assumed that interaction occurs between the sorbed ions and that localised sites are the only place where the phenomenon of sorption takes place. 45 Furthermore, there is a linear increase in the adsorption energy and m, the mass of adsorbent.
In Table 5, the values of the SSE and R2 are recorded for all three kinetic models, and it indicates that the pseudo-second-order model is a much better fit when compared to the pseudo-first-order and Elovich equation. This is true on account of the striking difference between the SSE values for the two kinetic models. It should be noted that the pseudo-second order rate constant, k2, is a composite rate constant based on the multi-mechanisms taking place.
The SSE and R2 values for different kinetic models.
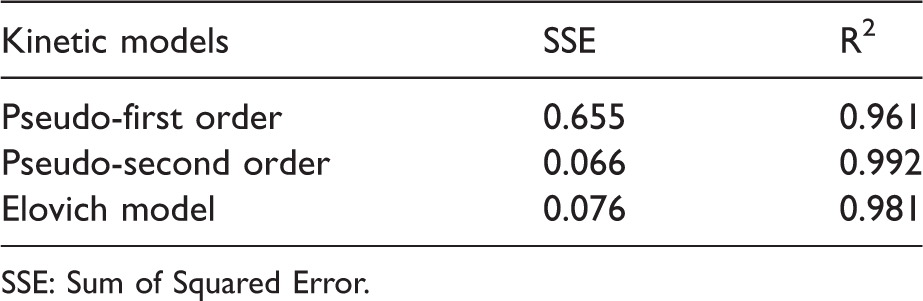
SSE: Sum of Squared Error.
Mechanism of adsorption
The two potential mechanistic schemes of adsorption are shown in equation (14) and Figure 8 representing: (i) chelation with the lone pair of electrons on the nitrogen amine group and (ii) complexation of cadmium with a group of oxygen atoms, by sharing the lone pair of electrons on the oxygen atoms. The metal ion can be chelated with the NH2 and OH groups in the chitosan chain forming a stable complex by co-ordination. The nitrogen lone pair electrons in the amino and N-acetylamino groups can establish dative bonds with transition metal ions. Also, some hydroxyl groups in these biopolymers may function as donors; hence, deprotonated hydroxyl groups can be involved in the co-ordination with metal ions.48,49
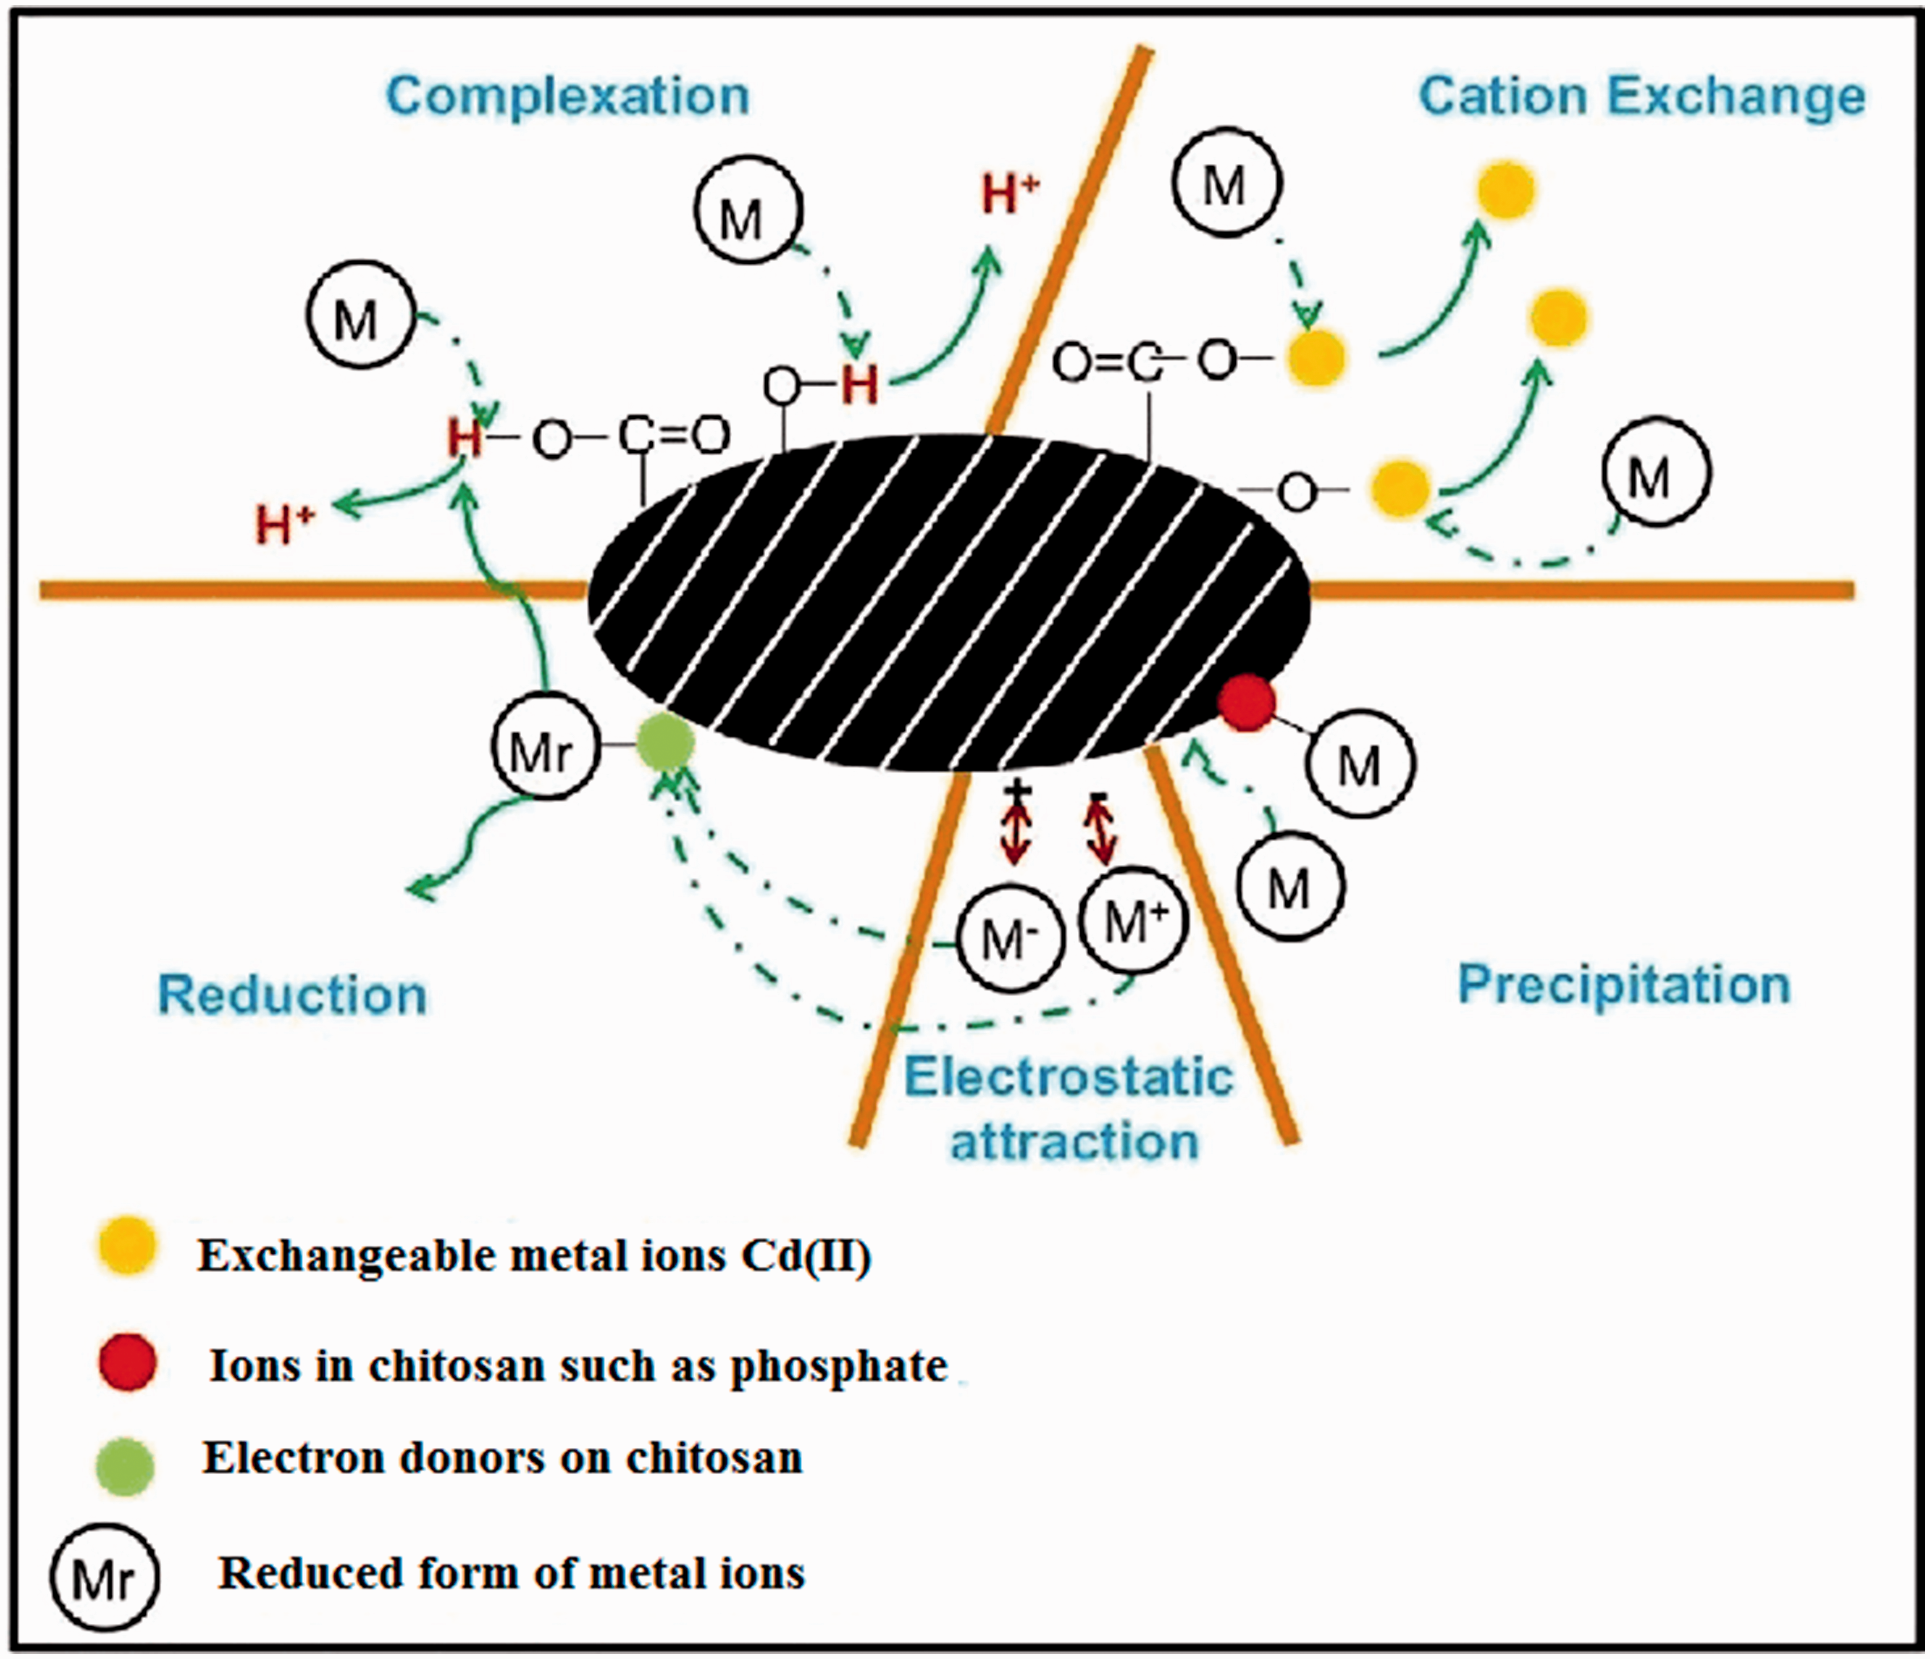
Adsorption mechanism-metal complexation. 47
Both complexation and chelation are processes in agreement with the two best fitting rate mechanisms, namely the Elovich model and the pseudo-second order model. For further insight into the mechanisms, the best fitting equilibrium isotherm results, which were the SIPS and the Langmuir isotherms, can be explored. The Langmuir requires one equal energy homogeneous adsorption reaction scheme. The SIPS is a modified Langmuir–Freundlich hybrid isotherm and can accommodate the two proposed similar sorption mechanisms.
The strong correlation with the Langmuir model also suggests that the adsorption energies for the two mechanisms are similar. This is reasonable because the basic process in both mechanisms is lone pair electron sharing. The single-stage Langmuir analysis had an SSE of 0.382 and a correlation coefficient of R2 = 0.9995. Structural chemical analysis studies would provide the best evidence of the structural nature of the sorbed species, and temperature studies are required to determine the thermodynamic parameters and hence whether the mechanism involves chemisorption or physisorption.

Conclusion
Cadmium toxicity is an important area which must be addressed in the present state of environmental pollution control. This is true owing to the health hazards caused by cadmium heavy metal toxicity and its prevalence from both natural and anthropogenic sources. The paper discusses the process of adsorption for cadmium on nanochitosan. The nanochitosan demonstrated a high adsorption capacity of 220 mg/g or 1.96 mmol/g nanochitosan, which has been derived from both the isotherm models and the experimental isotherm results.
Adsorption is a noteworthy remedy for environmental pollution. In this context, it is important to assess the effectiveness of the adsorption kinetics for the adsorbent system under consideration. Thereafter, the appropriate course of action can be implemented to solve the underlying equation for the various parameters. Based on the data, a range of adsorption reactions and adsorption models have been presented. The three different kinetic models evaluated for the adsorption of cadmium on nanochitosan include: pseudo-first-order equation, pseudo-second-order equation and Elovich equation. The best correlated kinetic model reveals important characteristics and trends of the data leading towards a proposed mechanism.
The two main error statistics studied for each of the models is the R2 statistic and the SSE statistic. SSE is the preferred statistic to perform an evaluation of the models, since it is specifically directed at measuring the deviation from the model fit. The models are evaluated to find the best equation which adheres to minimum error. Out of the different isotherm equilibrium models studied, an analysis of SSE finally reveals that the two most viable models, in this case, are the SIPS isotherm and the Langmuir isotherm, with the SIPS isotherm providing the best fit. For the kinetics studies, it was found that the pseudo-second-order model followed by the Elovich model has the best fit.
Footnotes
Declaration of conflicting interests
The authors declared no potential conflicts of interest with respect to the research, authorship, and/or publication of this article.
Funding
The authors received no financial support for the research, authorship, and/or publication of this article.