



Abstract
The haze climate has seriously affected people’s lives in China, and one of the important causes is particular matter (PM). For further, PM also has a negative impact on human health, especially respiratory health. A modified two-stage EBM (Epsilon-based Measure)data envelopment analysis (DEA) model considering undesirable outputs was used in this study to explore the energy utilization, PM and respiratory efficiency evaluation in China. It is concluded that the total efficiency value of Beijing, Inner Mongolia, Shandong and Tianjin is high, while that of China’s other provinces is low. The overall efficiency of most provinces in the first stage is better than that in the second stage, and the efficiency difference between provinces in the second stage is more significant. There is a significant difference in PM efficiency between provinces, which needs to be managed by governments of different regions. Except for Beijing, Jiangsu, Inner Mongolia, Shandong and Tianjin, the efficiency of respiratory diseases in most provinces still needs to be improved. Therefore, it is suggested to optimize the industrial structure, accelerate the adjustment of energy structure, strengthen the treatment of air pollution and increase public expenditure on medical care, so as to improve residents’ respiratory health.
Introduction
Energy utilization is the basic element of economic development, but it also causes serious environmental problems. With more and more attention being paid to the sustainable development goals (SDGS), how to use energy efficiently to achieve economic development on the premise of environmental friendliness is an important issue that urgently needs to be solved. Many scholars have conducted extensive analysis on the relationship between energy consumption and environmental pollution, such as Choi, 1 Liu and Wang, 2 etc., and have found that energy consumption has a significant effect on environmental pollution. According to the “China Energy Supply and Demand Report” (2019), China’s total energy consumption in 2018 was 4.64 billion tons of standard coal, accounting for 23.6 percent of the world’s total primary energy consumption, ranking first in the world for ten consecutive years. As the world’s largest energy consumer, China also has one of the highest level of atmospheric pollutants in the world. Environmental fine particulate matter (PM2.5) and inhalable particulate matter (PM10) have been the main air pollutants in China for a long time. In 2019, the average emission concentrations of PM2.5 and PM10 in China were 36 μg/m3 and 63 μg/m3 respectively, which were improved compared with those in 2018, but still could not meet the standards of the “Air Quality Criteria” (2016). PM is a major cause of smog and causes serious public health risks. 3 And PM pollution is an important factor leading to respiratory diseases. 4 In the literature review on the health effects of outdoor air pollution by Sun et al., 5 it was found that the adverse effects of outdoor air pollution on health results gradually became the focus of the academic community. Donaldson, 6 Cohen 7 and other scholars have also confirmed the significant impact of PM on public health. In order to cope with air pollution, the Chinese government has also taken measures. In 2018, China began to implement the three-year action plan to win the battle for blue skies. It is hoped that by 2020, compared with 2015, PM2.5 concentrations in cities that do not meet the standards will drop by more than 18%. It has effectively reduced air pollution to maintain the quality of the air environment and human health. However, China still faces severe challenges in terms of atmospheric pollution control. Therefore, this study conducted a comprehensive evaluation of energy utilization, PM and respiratory system health, and expected to discuss the impact of energy utilization on respiratory system health and put forward feasible policy suggestions to achieve China’s SDGS.
Although Li, 8 Shi 9 and other scholars have conducted a comprehensive discussion on the relationship between energy utilization, environmental pollution and health, the relationship between energy utilization, air pollution and human health are rarely discussed together. Considering that air pollutants have the largest and most direct impact on the human respiratory system, especially the important impact of PM particles on the respiratory system, therefore, it is significant for this study to focus on the impact of energy utilization on respiratory system. In addition, although DEA has become a widely used method in the analysis of air pollution and energy efficiency in the past, it still has the problem of radial and non-radial errors. In order to solve above problems, a modified two-stage EBM DEA model considering undesirable outputs has been supposed in this study to explore the relationship between energy utilization, PM and respiratory health in China. There are three contributions in this paper: first, in addition to exploring traditional energy and environmental efficiency, this study also puts respiratory health factors into the model, so as to comprehensively explore the relationship between energy consumption, air pollution and respiratory health; second, it can avoid the shortcomings of efficiency value and improve the underestimated or overestimated space with the use of modified undesirable EBM two stage DEA; third, some policy suggestions are put forward in the hope of reducing air pollution in China and improving the health of Chinese residents.
Literature review
It is known from the past literature that the analysis of energy consumption, air pollution and respiratory health can be divided into the following two aspects. The first is the analysis of energy efficiency and air pollution. Chang 10 studied the correlation between CO2 emissions, energy consumption and economic growth in China. Goto, M et al. 11 found that greenhouse gas emissions are the main reason for the inefficient unification of the industry. Sarwar et al. 12 studied the relationship between economic growth, education, health problems and carbon emissions, and advocated low-carbon economy. In addition, many scholars have used DEA method to analyze this aspect. Fang 13 used DEA method to study the energy performance of China and the United States, whose results showed that the performance of China’s technical efficiency was worse than that of American companies. Choi et al. 1 explored China’s energy efficiency with SBM-DEA method, finding that CO2 efficiency was not good. Liu and Wang 2 used DEA to explore the current situation of regional energy consumption and sewage and air pollution control in China. Meng et al. 14 conducted a comprehensive investigation on the empirical research on China’s regional environmental economic evaluation from 2006 to 2015 by using DEA model. The models used in the above papers are mostly one-stage DEA, and the results still have room for improvement. Wu, 15 Chen, 16 Han, 17 Gong, 18 He, 19 and other scholars also proposed two-stage or three-stage DEA model combining different methods to improve the shortcomings of one-stage DEA. Referring to the above literature, this paper proposes an EBM two-stage DEA model considering undesirable outputs to solve the problem of radial and non-radial errors and to improve the overestimated or underestimated space.
The second is the effect of air pollution on respiratory health, especially the impact of PM on respiratory health. A number of scholars have also separately assessed the impact of air pollution on respiratory diseases.20–22 Romieu et al. 23 found that air pollutants were risk factors for respiratory infections. Chauhan et al. 24 discussed the relationship between air pollution and infection, and explored how the two can synergistically lead to respiratory diseases. Fung et al. 25 studied the role of air pollution in exacerbating hospitalization for respiratory diseases in London. Cao et al. 26 found a significant correlation between air pollution levels and lung cancer mortality. Khilnani et al. 27 summarized the latest research on the adverse effects of environmental and household air pollution on health. Farooq et al. 28 found that the carbon emissions increase would lead to a significant increase in health problems and encouraged afforestation. Pi et al. 29 collected research objects from CHARLS to study the relationship between physical health, air pollution and medical insurance costs. Chen et al. 30 discussed the relationship between high environmental air pollution exposure and children’s respiratory health in Jinan, China from 2014 to 2016. All the above literatures have proved the adverse effects of air pollution on human health and put forward some solutions worth learning from. In particular, Shahbaz, 31 Sinha 32 and Yuan 33 have put forward a lot of policy suggestions on energy consumption that are worth learning from the sustainable development goals, such as promoting clean production. On the other hand, there are more and more scholars focus on the relationship of PM on respiratory health. Donaldson et al. 6 found that the increase of PM10 was associated with the deterioration of respiratory diseases and death. Cohen et al. 7 found that PM2.5 resulted in about 5% mortality from cancers of the trachea, bronchus and lungs. Tecer et al. 34 found that PM had significant effects on childhood asthma, allergic rhinitis, upper respiratory tract diseases and lower respiratory tract diseases. Grigg 35 found that long-term inhalation of carbon-containing PM10 air could affect the normal development of children’s lung function. Correia et al. 36 found that the average life expectancy increased by 0.35 years when PM2.5 concentration decreased by 10 g/m3. Liu et al. 37 concluded that in China, PM10 and PM2.5 appear to be positively correlated with respiratory mortality. Yorifuji et al. 38 proved that acute PM exposure is associated with increased mortality among elderly people. Cao et al. 39 discussed the effects of PM on respiratory health in different age groups. According to 2254 studies collected in scientific database, Xie et al. 40 used meta-analysis to determine the contact response coefficient between PM2.5 pollution and different health endpoints. Applying the global burden of disease method, Zhu et al. 41 developed the data set of PM2.5 premature deaths in 129 provinces and cities in China in 2006, 2010 and 2015. Madureira et al. 42 found that PM emission had a more significant impact on newborns. Studies on the relationship between PM and respiratory health are extensive and in-depth. From the point of view that energy consumption leads to air pollution and then affects human health, however, correlational study is rarely discussed by scholars.
Several scholars have also conducted a comprehensive analysis of energy, environmental pollution and health. Li et al. 7 used the modified dynamic SBM model to analyze the energy efficiency and AQI efficiency of 31 provinces and cities in China from 2013 to 2016. Shi et al. 43 used the two-stage dynamic DEA model considering poor output to compare the economic, environmental pollution and health efficiency of 30 provinces in China. Shi et al. 8 conducted a dynamic analysis on the impact of industrial pollutant emissions in China on human health.
This study will refer to the above study, use modified EBM two-stage DEA model considering undesirable outputs, which can avoid the disadvantages of underestimating or overestimating the efficiency value and improving space, comprehensively study the relationship between energy utilization, air pollution and health.
Methods and model
Modified two-stage EBM DEA model
DEA is an effective method to evaluate the priority of multiple decision schemes in multi-oriented environment. 44 Referring to existing national and regional energy efficiency assessment literature, in the first stage, Wang et al. 45 selected energy consumption, labor and capital stock as inputs and GDP and CO2 emission as outputs. Feng et al. 46 selected labor, fixed assets, renewable energy and non-renewable energy as input variables, and GDP as output. Wang et al. 47 took labor, energy consumption and stock of energy conservation knowledge as input items and GDP as output items. The energy effect on air pollutant emissions was selected as the first stage, while the effect of pollutant emissions on respiratory system health as the second stage. In the first stage, this paper selected energy consumption, industrial labor and industrial fixed assets as the input index and industrial GDP as output index, while CO2, PM2.5 and PM10 as the undesirable output.
Particulate pollution has led to substantial health losses, especially from lung cancer and respiratory diseases. Lin et al. 48 found that PM2.5 exposure would have substantial adverse effects on the health of lung cancer patients. In order to further explore the impact of PM on respiratory diseases, health expenditure was selected as the input item in the second phase of this paper, while the output item was mortality of lung cancer and incidence of respiratory system.
Referring to the papers of Li, 49 Chen 50 and other scholars, this study propose a modified undesirable EBM two stage DEA model. The DEA method can be used to evaluate the differences in relative efficiency, find the reasons for the high and low efficiency, and put forward suggestions for improvement based on the results of efficiency. In addition, by combining Epsilon-based Measure, this model can solve the radial and non-radial errors, and use the optimal recent improvement to improve the underestimated or overestimated space. However, there are limitations to this approach: the DEA method can only compare the relative efficiency, not the absolute efficiency, and the model’s explanation of the influence mechanism is not rigorous enough. We hope to improve on this in future research.
The modified undesirable EBM two stage DEA model is as follows:
The number of DMUs is n, equal to 30 in this article. The number of divisions is k, in this article there are two stages, so k equals to 2. Where DMUj = (DMU1, DMU2,…, DMUk, …, DMUn). There are m input types Xj = (X1j, X2j, …, Xmj), and there are s outputs where Yj = (Y1j, Y2j, …, Ysj), therefore, the efficiency of the DMU unit is:

Subject to:


In this article, m1 represents the input in the first stage, which is industrial labor, fixed assets and energy consumption; m2 represents the input in the second stage, which is health expenditure, CO2, PM2.5 and PM10. Where Y: DMU output, X: DMU input,
The efficiency score for Division k is given by:

When
If an inefficient decision-making unit needs to achieve an optimal efficiency goal, the following adjustments are needed:


The dynamic relationship of each index is shown in Figure 1.

Network model.
The construction of the indicator system is shown in Table 1.
Input and output variables.

Input-output efficiency of each stage and data sources
Industrial fixed assets, industrial labor, energy consumption, industrial GDP, CO2, PM2.5, PM10, health expenditure, mortality of lung cancer and incidence of respiratory diseases
There are ten key features of this present study: industrial labor, which is total number of industrial employment at the end of each province; industrial fixed assets, refers to the stock of industrial fixed assets at the end of each province; energy consumption, which is the amount of standard coal consumed by each province every year; industrial GDP, refers to the final result of the production activities of all units of industry in a certain period of time calculated at the market price of each province; health expenditure, which is the total annual social and individual medical expenditure of each province; undesirable outputs are CO2, PM2.5 and PM10; outputs of second stage are mortality of lung cancer and incidence of respiratory diseases. In our study, “I” represents area and “t” represents time.





Data sources
Since energy consumption and PM data are not complete after 2017, this study selects data from 2013 to 2016. Since energy data of Qinghai province are difficult to obtain, this study selected 30 provinces in China except Qinghai province as research objects. We hope to improve this deficiency by increasing the time span of the data in future studies. Data of industrial labor and industrial fixed assets were taken from China Statistical Yearbook; the energy consumption and industrial GDP data were drawn from China Energy Statistical Yearbook and China City Statistical Yearbook; the health expenditure data were taken from China Health Statistics Yearbook; data of CO2 emission, PM2.5 and PM10 concentration were obtained from China Environmental Statistics Yearbook and Provincial Ecological Environment Bulletin; data of mortality of lung cancer efficiency and incidence of respiratory diseases efficiency were taken from Chinese Health and Family Planning Statistical Yearbook.
Results and discussion
The total efficiency value from 2013 to 2016
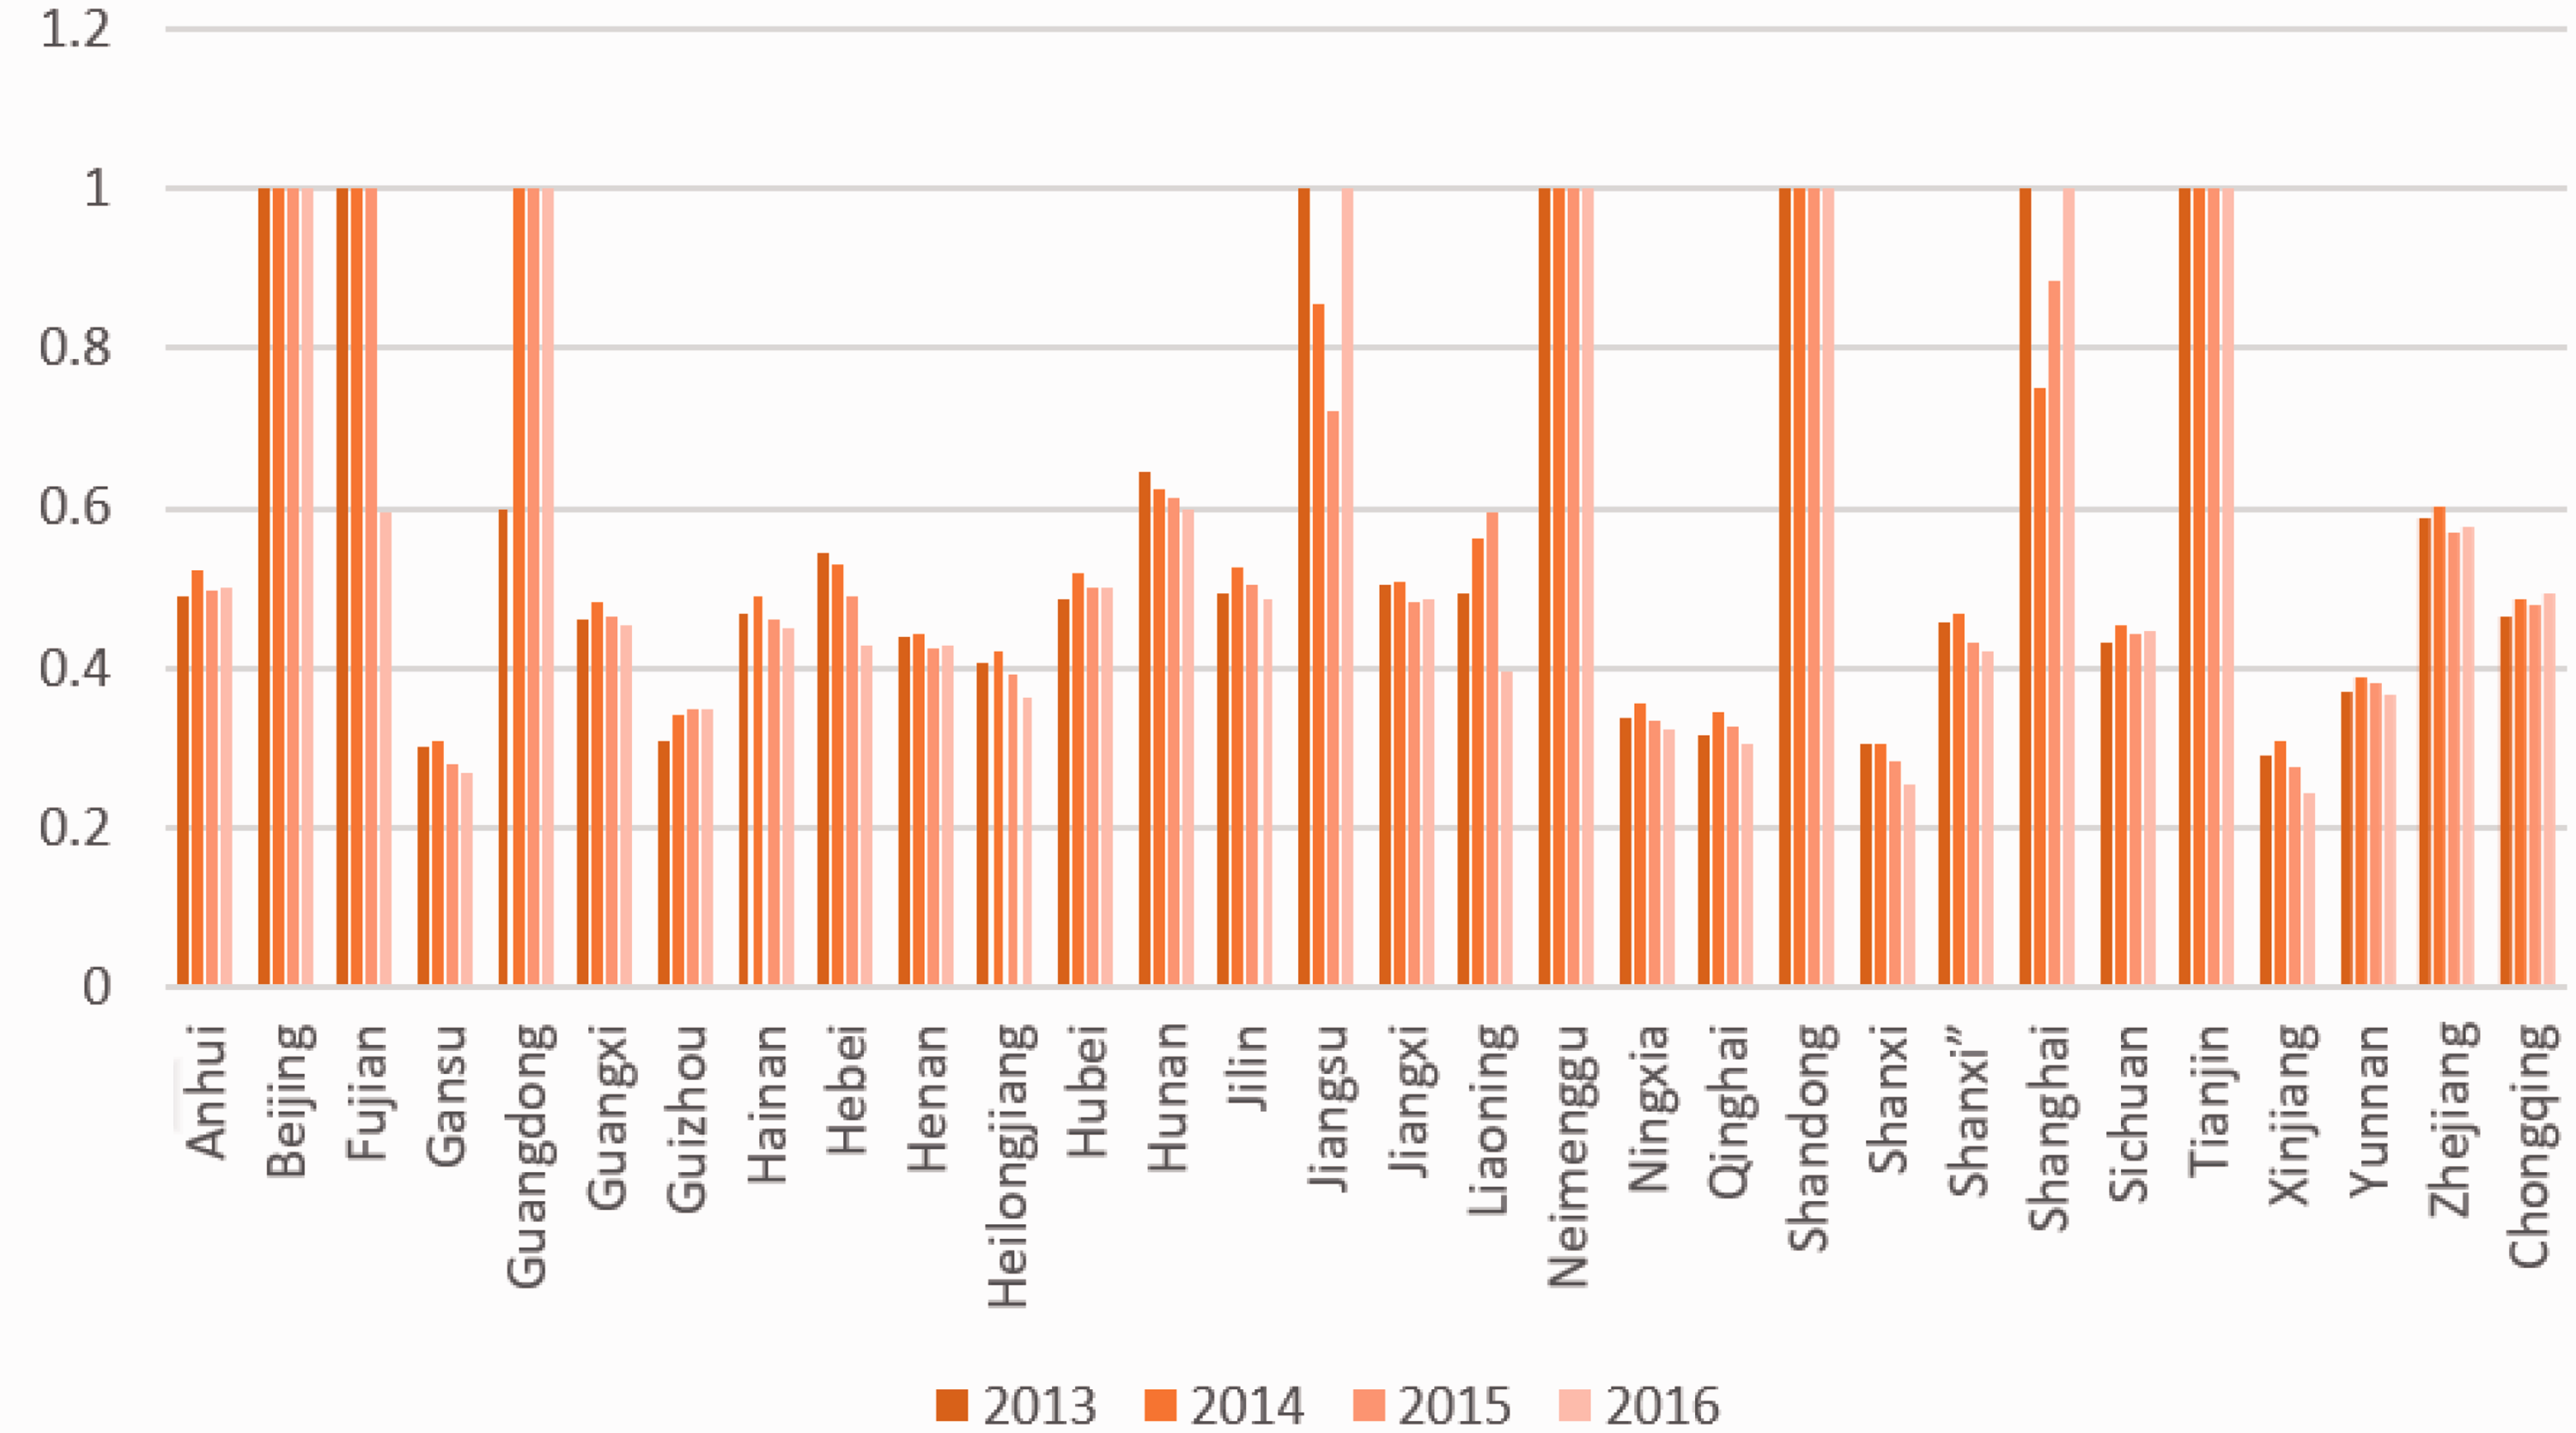
Table 2 and Figure 2 show the total efficiency value and ranking of 30 provinces in China from 2013 to 2016. First of all, only Beijing, Inner Mongolia, Shandong and Tianjin had a total efficiency value of 1 in the past four years. Guangdong and Fujian had an efficiency value of 1 for three years. The total efficiency of Jiangsu and Shanghai was 1 in the first year and the last year, and it fluctuated slightly from 2014 to 2015. The total efficiency of the above provinces performed well. However, the total efficiency level of other provinces was generally low, and the total efficiency values of most provinces in four years was lower than 0.6. It can be concluded that energy utilization does have an impact on respiratory diseases, and that energy utilization in most provinces doesn’t meet the criteria to achieve the sustainable development goals. Therefore, it is feasible to improve the incidence of respiratory diseases by adjusting the energy structure.
Overall efficiency by province from 2013–2016.

2013–2016 total efficiency by province.
Meanwhile, in terms of time series, the efficiency values of Anhui, Guangdong, Guizhou, Hubei, Liaoning, Shanghai, Sichuan and Chongqing showed an upward trend. The efficiency of the remaining 18 provinces showed a general downward trend. The province with the biggest decrease in efficiency value was Fujian province, which decreased from 1 in the previous three years to about 0.6 in the last year. It shows that most provinces have relatively weak awareness of sustainable development and need to take corresponding measures to strengthen that.
Efficiency analysis at each stage
Table 3 lists the stage efficiency values of all provinces from 2013 to 2016. In the first stage, nine provinces had a total efficiency value of 1 for four consecutive years. In addition, the first-stage efficiency values of Anhui, Guangxi, Hainan, Hubei, Jilin, Jiangxi, Zhejiang and Chongqing were all between 0.8 and 1, indicating that the above eight provinces had good efficiency, but there was still some room for improvement. The efficiency values of Henan, Shaanxi and Sichuan were also about 0.8. In the other 10 provinces, the first-stage efficiency was lower than 0.8. Five of the 10 provinces, Gansu, Ningxia, Qinghai, Shanxi and Xinjiang, all had four-year efficiency values below 0.6. It indicates that the provinces are consciously controlling the environmental impact of the industrial production sector. In addition, the relatively poor performance of Gansu, Ningxia and other five provinces is related to the fact that their industries are mainly energy-based and energy-driven. Therefore, it is necessary to promote the development of green industry. The policy suggestions put forward by Yuan et al. 28 to promote the development of green industry are worth learning from.
Efficiency on two stage by province during 2013–2016.

Four provinces had a total efficiency values of 1 in the second stage, including Beijing, Inner Mongolia, Shandong and Tianjin. Guangdong and Fujian had an efficiency value of 1 for three years. In Jiangsu and Shanghai, the efficiency values were 1 in the first and last year. The second-stage efficiency value of most provinces was not good, and the four-year efficiency values were generally lower than 0.4. Among them, the efficiency values of 18 provinces like Anhui and Gansu were all lower than 0.2 for four years, and the efficiency values of most of them were only between 0 and 0.1. This shows that the vast majority of provinces in the second stage of the efficiency is very poor, which is related to inadequate health expenditure of each province.
In conclusion, the efficiency value of the first stage of each province was better than that of second stage. The difference between provinces in the first stage was also smaller than that in the second stage. But there were still great room for improvement in both stages for many provinces. Only a few provinces continued to improve their efficiency values at both stages.
Efficiency analysis of input and output indicators in two stages from 2013 to 2016
Efficiency analysis of input indicators in two stages
Table 4 and Figure 3 show the efficiency values of industrial labor input, energy consumption and health expenditure of each province in 2013 and 2016.
Comparison of efficiency values of industrial labor, energy consumption and health expenditure in provinces from 2013 to 2016.


Comparison of efficiency values of industrial labor, energy consumption and health expenditure in provinces from 2013 to 2016.
First of all, 11 provinces including Beijing, Fujian, Guangdong had four-year industrial labor input efficiency values of 1. Jilin and Zhejiang provinces had efficiency values of 1 for two years. In addition, the efficiency values of industrial labor in Anhui, Hubei, Jiangxi, Shaanxi, Sichuan and Chongqing were 1 in one year, and there was room for improvement to varying degrees in other years. The input efficiency values of industrial labor force in Guangxi, Henan, Ningxia and Qinghai were all between 0.8 and 1, showing good performance. The efficiency value of Heilongjiang in the first two years was both greater than 0.9, but the efficiency value gradually declined from 2015 to 2016. The other six provinces performed relatively poorly. In general, the input efficiency value of industrial labor force in all provinces was mostly higher than 0.8, and the lowest was also above 0.5, showing a good performance.
The difference in energy consumption efficiency between provinces was very large. First of all, there were nine provinces where the efficiency values were 1 for every four years. What’s more, although the efficiency values of Hainan, Jiangxi and Zhejiang did not all reach 1, they were above 0.8. Eight other provinces had efficiency values between 0.6 and 0.8, including Anhui, Guangxi, and so on. The efficiency value of Liaoning province in the first three years was above 0.6. The efficiency values of the remaining provinces were lower than 0.6. Among them, the efficiency values of Ningxia, Qinghai, Shanxi and Xinxiang were between 0.2 and 0.3. The performance of energy consumption efficiency in all provinces is basically consistent with stage performance in the preceding paper, especially in Ningxia and other provinces with poor performance. Just as Sinha et al. 27 have mentioned, renewable energy policies will help to improve the situation. The efficiency value of energy consumption varied with time. The provinces with rising efficiency included Guizhou, Hubei, Hunan, Sichuan, Qinghai and Yunnan. The efficiency of the other 13 provinces showed a downward trend.
The efficiency of annual health expenditure in each province was lower than the other two indicators. There were only four provinces with an average efficiency values of 1 in four years, including Beijing, Inner Mongolia, Shandong and Tianjin. Other provinces that had done relatively well include Fujian, Guangdong, Jiangsu and Shanghai. In addition to the above provinces, 22 other provinces had low efficiency values in each year, and the maximum efficiency value in these provinces was only about 0.47. From the perspective of time series, the efficiency value of health expenditure input in most provinces showed a downward trend. Anhui, Liaoning and Shanghai were the only provinces with rising trend. Overall, most provinces were less efficient in terms of health expenditure. This shows that the provinces have insufficient input in health expenditure, which urgently needs to be strengthened.
Efficiency analysis of output indicators in two stages
Table 5 and Figure 4 list the efficiency values of industrial GDP, mortality rate of lung cancer and incidence rate of respiratory diseases in each province from 2013 to 2016.
Comparison of efficiency values of industrial GDP input, lung cancer mortality and respiratory diseases incidence in provinces from 2013 to 2016.


Comparison of efficiency values of industrial GDP input, lung cancer mortality and respiratory diseases incidence in provinces from 2013 to 2016.
Provinces have generally performed well on GDP indicators. Except for the efficiency value of Liaoning province, which was around 0.91 in 2016, the efficiency values of the remaining 29 provinces were 1 in each of the four years, indicating that the performance of all provinces in China is very good in terms of GDP, so we just need to keep it up.
The efficiency values of lung cancer mortality were significantly different among provinces. There were four provinces with an efficiency values of 1, including Beijing, Inner Mongolia, Shandong and Tianjin. In addition, the efficiency value of this item was 1 in the first three years of Fujian province and 1 in the last three years of Guangdong province. In both Jiangsu and Shanghai, the efficiency values were 1 in the first and last year. The efficiency value of this project in Hebei province was 1 in 2013. The efficiency values of Hunan and Zhejiang provinces were between 0.4 and 0.8 in four years, while that of Liaoning province was between 0.4 and 0.8 in the first three years. The efficiency values of six provinces including Anhui, Guangxi, Henan were between 0.2 and 0.4. The efficiency values of the other 12 provinces were less than 0.2. In terms of time series, except Jiangsu and Shanghai, the efficiency values of the remaining 24 provinces showed a downward trend. Among them, the biggest drop is in Hebei province, from 1 in 2013 to around 0.37 in 2016.
There was room for improvement of respiratory morbidity in many provinces. First of all, only Beijing, Jiangsu, Inner Mongolia, Shandong and Tianjin had efficiency values of 1. The efficiency value of this item was 1 in the first three years of Fujian province and 1 in the last three years of Guangdong province. The efficiency value of Shanghai was 1 in 2013 and 2016. In Hunan and Zhejiang, the four-year efficiency values were between 0.4 and 0.6, while in Liaoning, it was higher than 0.4 in the first three years. The efficiency values in Anhui, Henan, Hubei and Sichuan were between 0.4 and 0.6. In the other 13 provinces, the efficiency values were less than 0.2. As time goes by, the efficiency values of the other 20 provinces showed a trend of decline, except Guangxi and Liaoning, whose efficiency value showed a trend of increase. The province with the biggest drop in efficiency value is Hebei, which dropped from around 0.91 in 2013 to around 0.36 in 2016.
The efficiency values of the mortality of lung cancer efficiency and incidence of respiratory diseases efficiency were consistent with those of the previous stage, indicating that energy consumption does have an impact on respiratory diseases. It would be helpful to adjust energy structure, optimize industrial industry, etc.
Efficiency analysis of undesirable output indicators in two stages
Table 6 and Figure 5 show the comparison of efficiency values of CO2, PM2.5 and PM10 of each province from 2013 to 2016.
Comparison of efficiency values of CO2, PM2.5 and PM10 in provinces from 2013 to 2016.


Comparison of efficiency values of CO2, PM2.5 and PM10 in provinces from 2013 to 2016.
CO2 emission efficiency and PM emission efficiency showed different scores even in the same province. Eight provinces, including Hunan and Shandong, had CO2 efficiency values of 1 in four years. Besides, the efficiency values of Guangxi, Hubei, Sichuan, Zhejiang and Chongqing were between 0.8 and 1 in four years. The efficiency value of Hainan province was around 0.89 in the first year and between 0.7 and 0.8 in the following three years. The efficiency values of Anhui, Hebei, Henan, Jilin, Jiangxi, Qinghai and Yunnan provinces ranged from 0.4 to 0.7. In Liaoning, the efficiency value of the first three years was between 0.4 and 0.7. The efficiency values of the remaining seven provinces were all lower than 0.4 in the four years, among which Ningxia and Shanxi had the worst performance, with the efficiency values of all four years lower than 0.2. According to the trend of time series, this efficiency values of 11 provinces showed an increasing trend. Sichuan province saw the biggest increase, from around 0.83 in 2014 to around 0.99 in 2016. The efficiency values of 10 provinces including Hainan, Hebei, Heilongjiang, etc. showed a decline trend. Compared with the research results of Choi 1 in 2012, CO2 efficiency has been relatively good, but there are still deficiencies. In addition, as Shahbaz et al. 26 have suggested, it would be helpful to design energy policies with cleaner production practices in mind.
The efficiency of PM2.5 performed worse than that of CO2. Nine provinces had PM2.5 efficiency values of 1 for four consecutive years. In addition, there were three provinces with four-year efficiency values higher than 0.4 or about 0.4, including Hebei, Liaoning and Zhejiang. Nine provinces had efficiency values between 0.2 and 0.4, including Anhui, Guangxi and so on. The four-year efficiency values of Shanxi and Guizhou were about 0.2. The efficiency values of the remaining 7 provinces were less than 0.2, showing poor performance. Among them, Ningxia and Qinghai had the worst performance, with the highest efficiency value in Qinghai only around 0.06 and that in Ningxia only around 0.07. Over time, the efficiency values increased in 10 provinces, including Gansu, Guangxi, Guizhou, Henan, Heilongjiang, Ningxia, Qinghai, Sichuan, Zhejiang and Chongqing. Ten provinces showed a downward trend, with the biggest drop coming from Liaoning province, which dropped from around 0.99 in 2015 to around 0.47 in 2016. This indicates that the improvement of PM2.5 in these provinces is not stable.
The efficiency of PM10 in most provinces was similar to that of PM2.5. There were 9 provinces with PM10 efficiency values of 1 for four consecutive years, including Hunan, Shandong, and Shanghai etc. There were three provinces with four-year efficiency values higher than 0.4 or about 0.4, including Hebei, Liaoning and Zhejiang. In 15 provinces, the efficiency values were between 0.2 and 0.4. Other six provinces had a four-year efficiency values of less than 0.2, showing poor performance. Among them, Ningxia and Qinghai provinces were the worst performers. According to the changing trend of time series, there were 16 provinces where the efficiency values were on the rise, among which Zhejiang province saw the biggest increase. Five provinces showed a downward trend, including Hebei, Hubei, Jilin, Liaoning and Shanxi.
The low PM efficiency value indicates that the industrial production in the provinces produces lots of PM emissions from energy utilization, which should be paid more attention to.
Conclusions and recommendations
Conclusion
The total efficiency level of most provinces was generally low, whose efficiency value in four years was less than 0.6.
The efficiency values of most provinces including Anhui in the first stage were better than that of the second stage. Provinces in northwest China, such as Gansu, had lower efficiency values in both stages.
Among the input indicators at all stages, the efficiency values of industrial labor input in all provinces were relatively high. The efficiency value of annual health expenditure performed worst.
Among the output indexes of each stage, the GDP indexes of each province performed very well. Respiratory morbidity efficiency was roughly the same as that of lung cancer mortality, which performed relatively worse.
In terms of undesirable output, there were large differences between provinces, and PM emission efficiency and CO2 emission efficiency had different scores in the same province. CO2 efficiency performed better than PM2.5 and PM10 efficiency. The efficiency values of PM2.5 and PM10 were similar on the whole.
The results obtained are still limited. Due to incomplete data, only 30 provinces were selected as research objects in this study, and only data from 2013 to 2016 were available. In addition, our method only compared relative efficiency. We hope that above limitations can be improved in future studies to produce more accurate results.
Recommendations
The industrial structure should be optimized and adjusted. For the provinces with low production efficiency, such as Gansu, Ningxia, Qinghai, Shanxi and Xinjiang, whose industries are mainly energy-based and energy-additive, their industrial layout should be optimized, the relocation and renovation of heavy polluting enterprises should be accelerated.
The energy structure should be adjusted. Provinces with low energy consumption efficiency, such as Gansu, Guizhou, Shanxi and Xinjiang, should improve energy utilization efficiency and build clean, low-carbon and efficient energy systems. In addition, renewable energy policies will help to improve the situation.
Stricter measures for the discharge of pollutants should be formulated. Government departments should encourage local governments to formulate and implement stricter pollutant emission standards to promote PM emission reduction and reduce the concentration of PM in the atmosphere, especially in provinces with high undesirable output such as Ningxia, Qinghai, etc.
The government should focus more on increasing public expenditure. In particular, Ningxia, Qinghai, Xinjiang and other provinces with poor efficiency values of lung cancer mortality and respiratory diseases should increase health expenditure for lung cancer and respiratory diseases.
Footnotes
Declaration of conflicting interests
The author declared no potential conflicts of interest with respect to the research, authorship, and/or publication of this article.
Funding
The author received no financial support for the research, authorship, and/or publication of this article.
