
Abstract
The linkage between water and energy, the water-energy nexus, is site specific. An integrated management approach to both resources begins with understanding a region’s water-energy nexus. This study built an inventory of water and energy consumption in 17 South Korean regions at each stage of the urban water cycle from 2012 to 2017, estimated the water-related energy intensities, and compared those values across regions. Additionally, this study conducted a series of regression analyses to identify the influences of various factors on water-related energy consumption. This study found regional variance in the total energy intensity as well as in the energy intensities at different stages of the water cycle. Both energy consumed and energy intensities generally increased over the study period. The findings show that greater attention should be paid to energy consumption in the water sector, especially in the wastewater treatment sector. In addition, the regression analyses revealed that management of energy intensity is the most impactful way to reduce energy consumption in the water sector. The positive impacts on water pollution and water consumption also bolster the necessity of water conservation efforts. This study presents regional priorities related to the water-energy nexus and provides water-related energy intensity benchmarks that local governments can use. The findings highlight the necessity of an integrated approach to water and energy.
Keywords
Introduction
Water and energy are linked.1–5 Because of their interdependence, a nexus approach to integrated resource management is required to avoid unexpected trade-offs and to promote synergistic effects.6,7 Management and utilization plans are more comprehensive and coordinated when they take interlinkages into account. 8 Such integrated practices require understanding and quantifying these interlinkages, which can be measured from the perspective of either water for energy or energy for water. Studies on energy for water are also needed because the energy consumed while supplying water is significantly increasing. 3
Interest in the urban water-energy nexus is growing as climate change and urbanization accelerate.9,10 The water sector is more decentralized by region than the energy sector. This implies that there are opportunities for regions to contribute to energy transition by pursuing synergy in the interlinkages. 11 In South Korea, regional utilities withdrew 55% of the total amount of water. In addition, regional utilities purified 61% of raw water in 2016. 12 As Kollmann et al. 13 pointed out, the water sector provides an opportunity for regions to contribute to or participate in energy transition as “unexpected resources.” The new climate regime highlights the role of nonstate actors, including subnational governments, in climate change; energy-for-water approaches need be emphasized because local governments have the authority to control water directly and energy indirectly.
This study explored the energy-water nexus across the urban water cycle in 17 regions in South Korea by building a panel-type inventory of the amount of water processed (withdrawn, purified, distributed, or treated) and the energy consumed at each stage of the urban water cycle. Based on this constructed inventory, this study investigated and compared the energy intensities of the water sector by region and over time. Also, this study explained differences in water-related energy consumption by analyzing the relationship between water-related energy consumption and factors such as pollution and population. The findings enlighten national and regional policymakers by quantifying the interlinkage between these two resources and by identifying regional priorities in terms of the water-energy nexus. The water-related energy inefficient regions will attract the attention of water and energy management bodies; the influencing factors indicate priorities. This research fills a gap in the water-energy nexus literature by exploring the South Korean case, 11 as literature has mostly focused on China.
This study is laid out as follows. The next section provides background information regarding the current status of the urban water cycle in South Korea, such as who manages the water cycle, what share of the public sector’s energy use is accounted for by the water sector, and what policies national and local governments enforce to reduce energy use in the water cycle. ‘Literature review’ section reviews the regional water-energy nexus literature, which explicates site-specific features of water-related energy and explores influences on water-related energy. This is followed by the section in which methodology and data are explained. Next, the results are discussed and described by presenting changes in energy intensities by water cycle stage and region and analyzing the impacts of other factors on water-related energy consumption. The last section offers conclusions.
Energy for water: Status and policies in South Korea
According to Article 52 of the Framework Act on Low-Carbon Green Growth, the Korean government is required to control water demand through interventions such as water saving, rainwater use, and wastewater reclamation. In addition to the responsibilities of the central government, Article 3 of the Act on Promotion and Support of Water Reuse makes local governments responsible for formulating and implementing policies to promote water reuse and for installing and managing water facilities in their jurisdictions. The Water Supply and Waterworks Installation Act and the Sewerage Act prescribe that the heads of local governments are responsible for managing water systems and their facilities in order to provide clean and safe water for local residents. This implies that local governments have significant authority over water supply and wastewater treatment.
K-water is a Korean public corporation established for the purpose of improving people’s lives and the public welfare by developing and managing facilities for water resources. K-water provides local governments with raw water to be purified and builds and manages local facilities for waterworks and sewage.
The 17 Korean regions have established individual environmental conservation plans. These plans include waterworks and sewerage management. All of these plans seek water conservation through water demand management, control and management of energy consumption, and renewable energy deployment at public buildings.14–29 The Seoul Metropolitan Government 28 also pursues energy conservation at its water purification and wastewater treatment facilities. Although all regions seek water and energy conservation, they have not recognized the opportunities for synergy that are possible through water-energy nexus approaches.
Electricity is consumed at each stage of the urban water cycle: withdrawal, purification, distribution, end-use, and waste treatment. The South Korean water sector’s energy consumption has become more electrified. 11 Table 1 shows that the total electricity consumed for water supply and treatment in South Korea increased by 42% from 2011 to 2016 (7.4% CAGR (compound annual growth rate)). The water sector comprised a significant proportion of the public sector’s total electricity consumption (68% as of 2016), an increase of 31 percentage points since 2013.
The water sector’s share of total public sector electricity consumption.
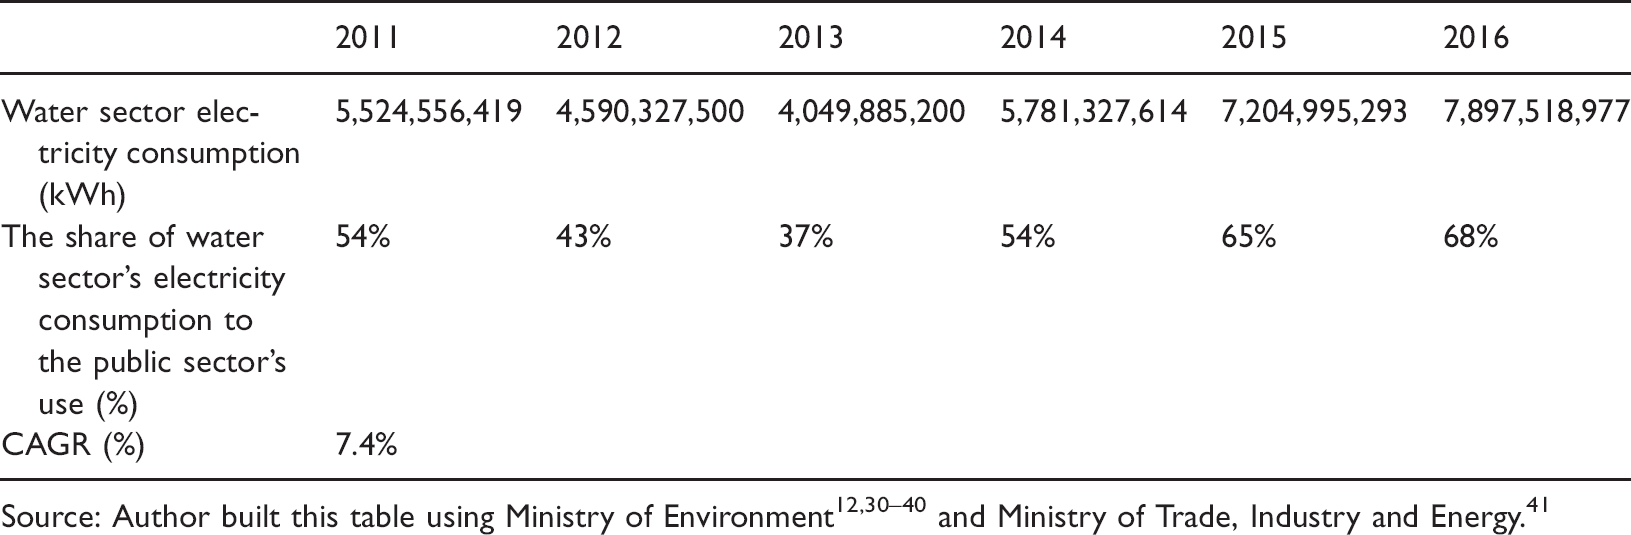
Source: Author built this table using Ministry of Environment12,30–40 and Ministry of Trade, Industry and Energy. 41
As Figure 1 shows, electricity consumption in the water sector varies by region. a Energy consumption by the water sector increased from 2012 to 2017, except in Incheon and Gwangju. Seoul and Gyeounggi, home to more than half of the national population, consumed the most water-related electricity in both 2012 and 2017. This can be attributed to regional population size and the level of economic activity, 42 as seen by the presence of industrial complexes and a large regional GDP. 43
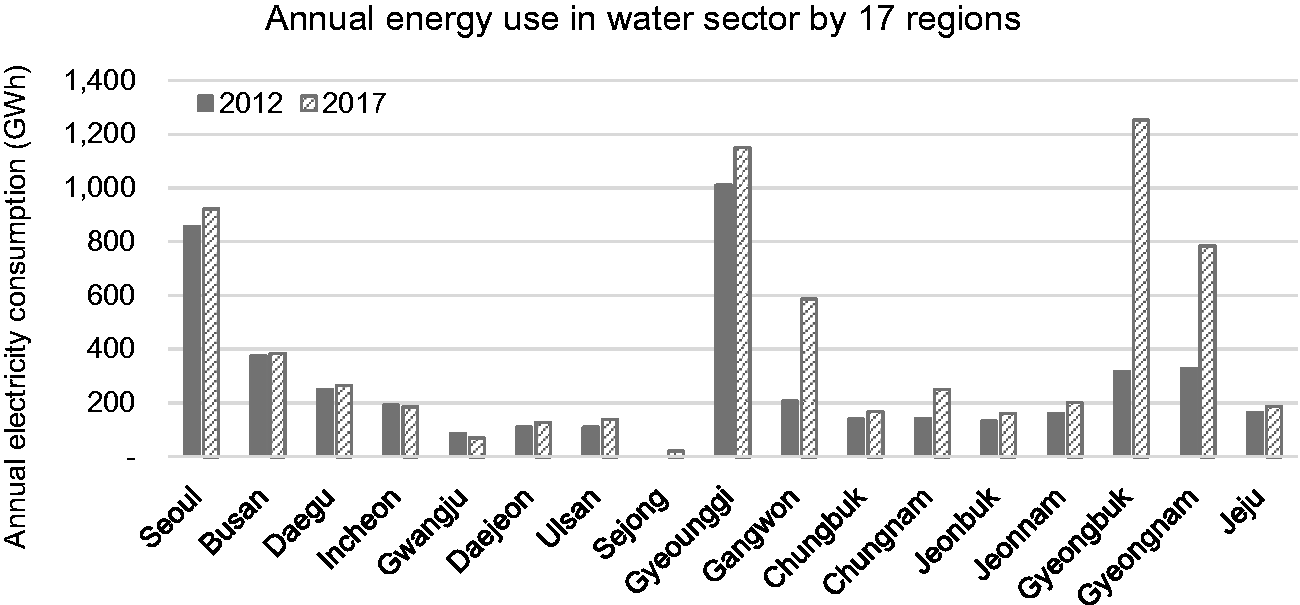
Among the 17 regions, Gyeoungbuk had the highest increase in electricity consumed by the water sector, +935GWh, followed by Gyeoungnam (+456GWh) and Gangwon (+380GWh). Sejong b had the highest rate of increase in electricity used by the water sector, increasing by more than nine times since this fast-growing city was built in 2012. In contrast, water-related electricity consumption in Incheon and Gwangju decreased from 2012 to 2017. The annual power used by Incheon’s water sector dropped from 193 GWh in 2012 to 186 GWh in 2017. Gwangju had the greatest decrease (−16GWh) in electricity used by the water sector, from 86GWh to 73GWh.
Literature review
The interlinkage between water and energy significantly differs across regions because of factors such as climate, geographical features, operational efficiency, and advanced treatment levels.46–48 Therefore, a great deal of research has been devoted to understanding site-specific interdependency.11,49
Beyond the studies that investigate this interlinkage within a single region, comparative studies have been conducted to analyze the interrelation of multiple regions in terms of the water-energy nexus. Lam et al. 46 estimated per capita water consumption, per capita energy consumption, and energy intensity for water provision – and traced the time-series trajectory of the interlinkage of water and energy – in 17 cities. They found that energy consumption generally declined; Melbourne had the largest reduction in per capita energy use for water provision, dropping 45% from 2001 to 2015. They attributed the reduction to decreased water demand. Through this comparative work, they established reference cities such as Berlin, Melbourne, and San Francisco for water-energy nexus approaches. Lee et al. 50 compared energy and greenhouse gas intensities in the water sector in 20 regions in four countries. They also investigated the influence of water risks on the water-energy-carbon nexus, finding that regions with higher water risks, largely attributable to water accessibility, had higher energy and greenhouse gas intensities. Although risks from water accessibility are inevitable, they pointed out opportunities that can be grasped from wastewater treatment facilities, such as energy recovery.
In addition, studies that draw regional implications regarding the water-energy nexus have been conducted for multiple regions within a country, especially China. Li et al. 51 explored the city-level water-energy nexus in Beijing, Tianjin, and Hebei by analyzing the consumption of water for energy and energy for water in these cities through a multiregional input-output analysis. They found that Shijiazhuang consumed the most energy to supply water, followed by Beijing and Zhangjiakou. Xiang and Jia 52 estimated energy consumption by stage of the urban water cycle in 2015 and the expected increase in water-related energy use for each stage in China by determining the energy intensity of the individual stages. Their results indicated that the electricity used by China’s water sector in 2015 accounted for 3.4% (732 million GJ) of national electricity consumption. P.-C. Chen et al. 53 examined the water-energy nexus between Hong Kong and Guangdong by developing a water-energy mixed-unit input-output table to record water and energy flows between the regions. They found that Hong Kong was heavily dependent (79%) on its hinterland, Guangdong, for freshwater provision, but the city only modestly (21%) depended on Guangdong for electricity. They forecasted future water and energy demand, taking into consideration population growth and improvements in water and energy systems, and found that water for energy and energy for water will increase by 7.8-9.0% from 2012 to 2050. Wang et al. 54 built inventories of water-related energy and energy-related water for 15 regions in China and quantified the water and energy embedded in monetary flows between the different regions using multiregional input-output analysis. They tracked the transfer of water embedded in commodities between different regions, finding that it was transferred from western to eastern regions and from northern to southern regions. In terms of the water-energy nexus, Beijing and Shanghai have large impacts on other regions.
Much research has been conducted to capture site-specific interlinkages between water and energy, and the literature has discussed the impact of factors such as climate, geographical features, operational efficiency, and advanced treatment levels on the water-energy nexus. However, the influence of these factors has not yet been statistically tested. In addition, despite the increasing significance of the water-energy nexus in urban areas because of climate change and growing urban populations, existing studies are geographically concentrated on China. In one of the few studies that have investigated the water-energy nexus in South Korea, Kim and Chen 11 assessed the water-energy nexus in a single city, Seoul. They found that energy transition initiatives had positive effects on energy intensity in the water sector. Taking a step further, this study aims to assess and compare the regional water-energy nexus in South Korea and examine the influences of various factors by conducting a regression analysis.
Methodology and data
To attain the research goal, this study constructed an inventory of electricity consumption and the amount of water processed at individual stages of the water cycle in 17 regions from 2012 to 2017, using data from the Statistics of Waterworks and Statistics of Sewage.12,30–38,44,45 This study included electricity that was directly consumed at local facilities to process water at the withdrawal, purification, distribution, and wastewater treatment stages. Because this study aimed to explore the site-specific water-energy nexus and provide policy implications for local government, it focused on the stages operated by local governments. Electricity embedded in the water imported from other regions was not included because the statistics did not disclose the origins of imported water. Using the collected data, electricity intensities (the amount of electricity in MWh consumed to process a cubic meter of water) were calculated and compared.
Next, this study explored the impacts of factors such as energy intensity – a proxy for operational efficiency – water consumption, regional population, and biochemical oxygen demand (BOD) – a proxy variable for water pollution – on regional water-related energy consumption. These influencing factors were selected based on the literature review and data availability. The period from 2012 to 2017 was chosen because statistics for Sejong have been collected since 2012. This study modified these data to account for the population size of individual regions. This study used a series of regression models to analyze the effects of per capita BOD (kg/person), total energy intensity (MWh/m3), per capita water consumption (m3/person), and a dummy variable for whether water was imported
c
on the dependent variable, per capita energy consumption (PCEC) by the water sector (MWh/person). Equation (1) shows the model, illustrating the influencing factors and the dependent variable, PCEC. XTEI is total energy intensity (MWh/m3), XPCB is per capita BOD (kg/person), XPCWC is per capita water consumption (m3/person), and I is a dummy variable for whether water was imported. Our priori was that energy intensity, BOD, and water consumption would have positive influences on water-related energy consumption. We expect that when water is imported from other regions, the water-related energy consumption excluding energy embedded in the imported water would be reduced; thus the coefficient of the dummy variable would be negative.

Depending on the above model, this study tested six models and identified the model with the best fit to statistically explain the influences of various factors on water-related energy consumptions in South Korea.
Results and discussion
Changes in energy intensities by urban water stage and region
Figure 2 indicates differences in the total energy intensities at each water cycle stage in 17 regions in 2017. Energy intensity describes how much electricity is consumed to process a cubic meter of water; lower energy intensity means that water is processed more efficiently. Chungbuk had the highest intensity (3.926 MWh/m3) in 2017, followed by Gangwon (2.726 MWh/m3) and Gyeoungnam (2.076 MWh/m3). Gwangju had the lowest total energy intensity (0.305 MWh/m3), followed by Incheon (0.683 MWh/m3) and Daegu (0.702 MWh/m3). In 2017, more than half of the 17 regions had energy intensity that was more than 1.000 MWh/m3.
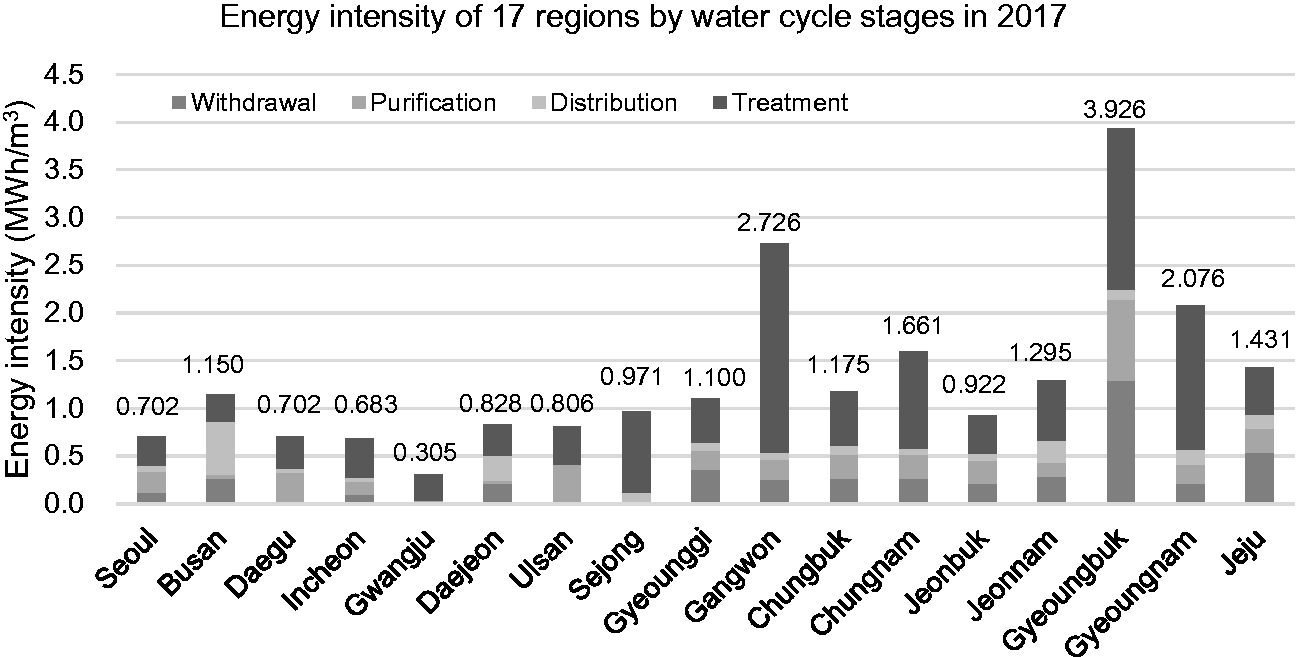
Energy intensity of 17 regions by water cycle stage in 2017.
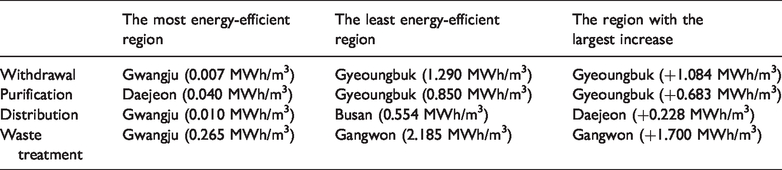
In terms of energy intensity by water cycle stage, the wastewater treatment stage had the largest share of total energy intensity, except in Busan, Ulsan, and Jeju. The energy intensity of wastewater treatment was the highest in Sejong because this newly developed city imported purified water (27,711,958 m3 in 2017) from other regions rather than withdrawing and purifying its own water. The region that had the highest energy intensity at the wastewater treatment stage in 2017 was Gyeoungbuk (3.926 MWh/m3), followed by Gangwon (2.726 MWh/m3). Gwangju had the lowest energy intensity at the wastewater treatment stage (0.265 MWh/m3) in 2017, followed by Busan (0.284 MWh/m3) and Seoul (0.298 MWh/m3).
Daegu, Ulsan, and Sejong used no electricity at the withdrawal stage. Among the other 14 regions, Gwangju had the lowest energy intensity at the withdrawal stage (0.007 MWh/m3). At the distribution stage, Ulsan had the lowest energy intensity, almost 0 MWh/m3. Among the other 16 regions, Gwangju (0.024 MWh/m3) and Incheon (0.040 MWh/m3) had the lowest energy intensity at the distribution stage.
Figure 3 shows changes in the energy intensities of the 17 regions between 2012 and 2017. Energy intensities increased from 2012 to 2017, except in three regions (Incheon, Gwangju, and Jeju). Gyeongbuk had the largest increase (+2.984 MWh/m3) in total energy intensity among the 17 regions, with a significant rise at the wastewater treatment stage (+1.267 MWh/m3). Gangwon showed the second largest increase (+1.711 MWh/m3) in total energy intensity from 2012 to 2017. Gangwon’s energy intensity for wastewater treatment increased more than four times from 2012 to 2017 (+1.700 MWh/m3). In contrast, decreases in total energy intensities during the same period were observed in Incheon (−0.016 MWh/m3), Gwangju (−0.189 MWh/m3), and Jeju (−0.720 MWh/m3).
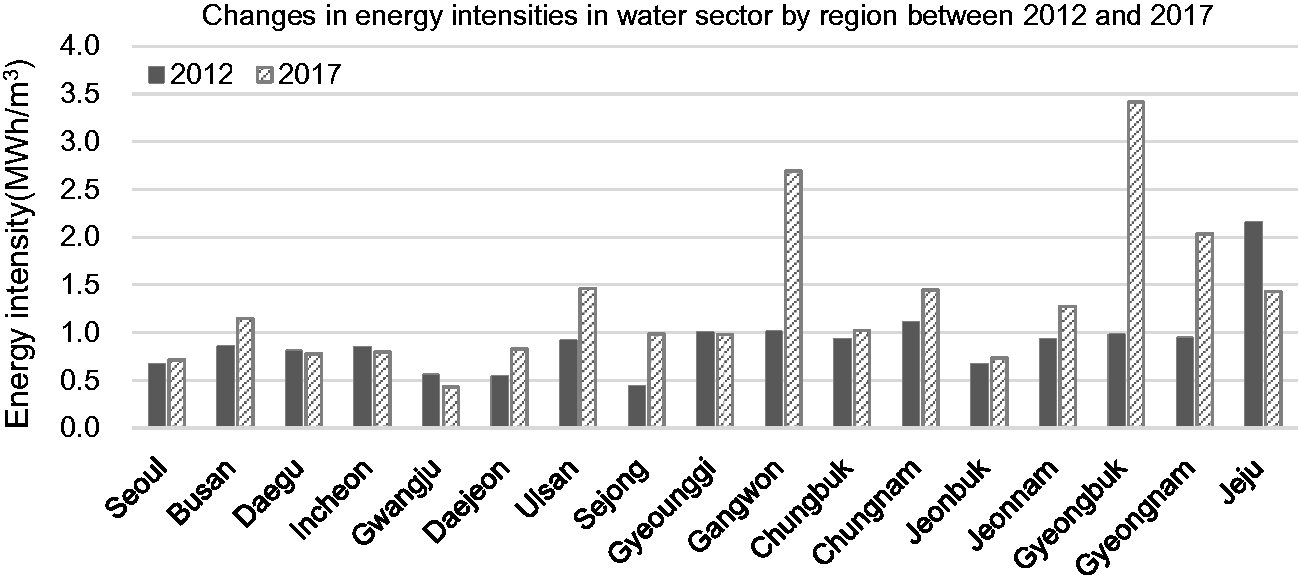
Changes in energy intensities in water sector by region between 2012 and 2017.
Regarding changes in the intensity of each water cycle stage between 2012 and 2017, the energy intensity rose the most at the wastewater treatment stage except in five regions (Busan, Daejeon, Gyeounggi, Jeonbuk, and Jeonnam). In Busan, energy intensity increased the most (+0.328 MWh/m3) at the distribution stage from 2012 to 2017. Daejeon (+0.228 MWh/m3) and Jeonnam (+0.192 MWh/m3) also had their largest increase in energy intensity at the distribution stage. Energy intensity increased the most at withdrawal stage from 2012 to 2017 in Gyeounggi (+0.075 MWh/m3) and Jeonbuk (+0.064 MWh/m3). Gangwon had its largest increase in energy intensity (+1.700 MWh/m3) at the wastewater treatment stage. Gyeoungbuk had the second largest rise (+1.268 MWh/m3) in the energy intensity of the wastewater treatment stage. The energy intensity of the wastewater treatment stage also increased by a large amount in Gyeoungnam (+1.046 MWh/m3) from 2012 to 2017. The annual data detailing energy intensity by stage is presented in Table 4 in Appendix.
Regression results for the impacts of the factors on water-related energy consumption.

Note: Significance code: * = 0.05, ** = 0.01, *** = 0.001.
Benchmark region for water-related energy intensity at each urban water stage in 2017.
Analysis of the impact of factors on energy intensity
This study conducted a series of regression analyses to investigate the effect of various factors on energy consumption in the water sector. The independent variables were per capita BOD (kg/person), total energy intensity of water sector (MWh/m3), per capita water consumption (m3/person), and a dummy variable for whether the region imported raw water from other regions; the dependent variable was per capita energy consumption (MWh/person). This study tested six regression models that varied on the inclusion of dummy variable and the type of models (linear or nonlinear). The models were named to describe these differences: L and NL stand for linear and nonlinear, and the NL models are further divided into log-log (NL-L) and semi-log (NL-SL) models in Table 2 and Table 5 in Appendix. The log-log models use the log of the dependent and independent variables (other than the dummy variable, when included), where the coefficients imply how much the percentage change of explanatory variables leads the percentage change of dependent variable like elasticity concept in economics the rate of change of dependent variable. The semi-log models use the log of only the dependent variable. Each of these three models were run with and without the dummy variable, the inclusion of which is indicated by adding D to the end of the model name.
Model NL-LD, the log-log model that included the dummy variable (see equation (2)), is the best fit to the data; it had an R-Square of 0.8099. The variance inflation factors of the exploratory variables do not show multicollinearity.
d
All coefficients of the independent variables in this model are statistically significant at 
Discussion
This study explored site-specific interlinkages of these two resources in South Korea, much as other studies have investigated regional relationships in other countries.10,55,56 This study identified large regional differences in total energy intensities, ranging from 0.428 MWh/m3 in Gwangju to 3.416 MWh/m3 in Gyeoungbuk in 2017 (see Table 3). The study also identified meaningful regional differences in the energy intensities of individual stages. At the withdrawal stage, the 2017 energy intensities ranged from 0.007 MWh/m3 in Gwnagju to 1.290 MWh/m3 in Gyeoungbuk. Daegu, Ulsan, and Sejong, which imported raw water or purified water from other regions, did not consume electricity at the withdrawal or purification stages. Gyeoungbuk was the least energy-efficient region at the withdrawal and purification stages. Ulsan did not consume any electricity to distribute water in 2017, while Busan was the most energy-intensive region at the distribution stage in 2017. Finally, the 2017 energy intensity of wastewater treatment ranged from 0.265 MWh/m3 in Gwangju to 2.185 MWh/m3 in 2017 in Gangwon.
The results reveal general and regional priorities for energy consumption in the water sector. Water-related energy consumption needs more attention because both water-related energy consumption and related energy intensity increased. These increases varied by region. For example, Gyeoungbuk’s energy intensity was more than 10 times larger than Gwangju’s energy intensity in 2017, as Figure 2 shows. Furthermore, while Gyeongbuk’s energy intensity increased the most at the wastewater treatment stage, Busan’s energy intensity increased the most at the distribution stage.
The general trend of increasing energy intensity implies that attention should be given to the water-energy nexus by the central as well as local governments. Targets for water-related energy intensity need to be set and progressively strengthened. The government, Ministry of Environment in the case of South Korea, needs to promote countermeasures to reduce water-related energy consumption in regions where the energy intensity of the water sector is above average. Also, it is necessary to build the system to support local governments lagged by providing operational know-how through training programs and financial supports for adopting more efficient technologies, while it gives top runners proper incentives.
At the same time, best practices should be shared among local governments. For example, energy intensity decreased in Jeju, an island, even with its additional use of desalinization.31,45 In addition, Gwangju used the least electricity to process water and had relatively low energy intensity for the entire study period. The central government needs to investigate why some regions have lower energy intensity and share these best practices with other regions.
To achieve the Nationally Determined Contribution, available measures should be investigated and implemented. From that perspective, the measures to reduce water-related energy consumption need to be promoted. For South Korea, especially, some water facilities f should reduce energy use and GHG emission under the cap and trade. 57 This approach could help the facilities comply with the obligation.
The regression analysis shows that energy intensity (energy use efficiency in the water sector) has the largest influence on per capita energy consumption in the water sector, which implies a priority for reducing energy intensity. The regional differences in the water-energy nexus call researchers and policymakers to discover the reasons for these differences.
At the same time, the positive relationship between water-related energy consumption and water pollution (BOD) and water consumption confirms the significance of complementary efforts, such as reducing water pollution and water conservation. According to World Energy Outlook 2018, 58 energy use in the water sector accounted for 4% of global electricity consumption in 2018, and wastewater treatment accounted for about a quarter of the electricity used by the water sector. Managing wastewater treatment plays a crucial role in attaining SDG 6 and SDG 7. Because global warming is expected to lead to more energy being needed for wastewater treatment, 59 a proactive approach is needed.
The positive relationship between the water-imported dummy variable and water-related energy consumption implies the existence of additional factors. Theoretically, water importation should contribute to a reduction in energy consumption in the water-importing regions because of the energy embedded in the imported water. In Daegu and Ulsan, where water was imported from other regions during the analysis period, total energy intensity was relatively high, even considering that the intensity of withdrawal stage was not included, as seen in Figure 1. The relatively high energy intensity of these regions, the strongest influencing factor, could have led to this unexpected result.
Conclusion
Energy and water are interlinked challenges that are site specific. Better management of these two resources begins with understanding these interlinkages. This study established an inventory of energy and water consumption in 17 South Korean regions for the period from 2012 to 2017. It estimated and compared water-related energy consumption regionally and temporally. This study identified big regional differences in total energy intensity as well as in energy intensity at individual stages. Energy intensity and water-related energy consumption generally increased over the analysis period, though with regional differences. The findings show that great attention needs to be given to energy consumption in the water sector and that individual regional governments have different priorities in terms of the water-energy nexus. This study found that energy intensity had the strongest influence on the water sector’s electricity consumption, which calls for energy efficiency enhancements in the water sector. This can be attained through energy conservation as well as energy production activities in water sector. The positive effects of water pollution and water consumption also imply that water conservation efforts are needed. Again, these findings confirm the necessity of an integrated approach for water and energy. In addition, the coefficient of the dummy variable reveals the strong impact of energy intensity on energy consumption, which calls for scrutinizing the influences of additional coefficients.
The findings of this study contribute to identifying benchmark regions for each stage of the urban water cycle, which allows individual regions to audit their energy consumption in the water sector. The findings call for more attention from researchers and policymakers and provide ideas about which stage is the priority in each region. This was the first analysis of the impact of factors that influence energy consumption in the water sector. Most existing studies on the water-energy nexus in Asia have concentrated on China. This study fills a gap in the geographical distribution of water-energy nexus research by investigating site-specific interlinkages in South Korea.
However, some limitations remain. First, the energy embedded in the water imported from other regions was not included because information about the flow of water was not accessible. Second, due to data availability, the influence of additional factors such as the influence of institutional arrangements (e.g., whether local governments run water facilities directly or private companies run the facilities based on the contract with local governments) was not investigated. Third, this study did not attain proper attribution of the differences in water-energy nexus linkages due to lack of supporting data. Finally, before implementing policy measures to enhance water-related energy intensity, the cost-benefit analysis of those measures needs to be conducted to investigate the possible trade-offs, which was not included in this study since it is beyond the research scope. These limitations can be resolved by further research.
Footnotes
Declaration of conflicting interests
The authors declared no potential conflicts of interest with respect to the research, authorship, and/or publication of this article.
Funding
The authors disclosed receipt of the following financial support for the research, authorship, and/or publication of this article: This work is financially supported by the National Research Foundation of Korea (NRF- 2018S1A5A8028278) and Korea Ministry of Environment (MOE) as Graduate School specialized in Climate Change.
Notes
Appendix
Regional energy intensity by stage of urban water cycle in 2012 and 2017.
Region
Year
Withdrawal
Purification
Distribution
Treatment
Total
Seoul
2012
0.125
0.185
0.081
0.251
0.662
2017
0.118
0.224
0.063
0.298
0.716
Busan
2012
0.232
0.136
0.226
0.258
0.852
2017
0.265
0.047
0.554
0.284
1.150
Daegu
2012
0.000
0.319
0.064
0.317
0.806
2017
0.000
0.330
0.037
0.334
0.779
Incheon
2012
0.127
0.192
0.034
0.347
0.845
2017
0.100
0.139
0.038
0.406
0.797
Gwangju
2012
0.256
0.023
0.005
0.210
0.554
2017
0.007
0.024
0.010
0.265
0.428
Daejeon
2012
0.198
0.033
0.031
0.279
0.541
2017
0.211
0.040
0.259
0.318
0.828
Ulsan
2012
0.000
0.381
0.000
0.332
0.911
2017
0.000
0.812
0.000
0.400
1.460
Sejong
2012
0.166
0.229
0.106
0.003
0.437
2017
0.000
0.000
0.118
0.852
0.987
Gyeounggi
2012
0.291
0.276
0.058
0.388
0.999
2017
0.365
0.196
0.085
0.454
0.981
Gangwon
2012
0.301
0.178
0.051
0.485
1.008
2017
0.252
0.215
0.075
2.185
2.692
Chungbuk
2012
0.236
0.195
0.078
0.455
0.929
2017
0.263
0.256
0.091
0.564
1.021
Chungnam
2012
0.288
0.228
0.062
0.581
1.108
2017
0.333
0.252
0.066
1.010
1.445
Jeonbuk
2012
0.146
0.208
0.026
0.343
0.667
2017
0.210
0.246
0.070
0.397
0.733
Jeonnam
2012
0.270
0.144
0.042
0.589
0.929
2017
0.291
0.137
0.234
0.632
1.271
Gyeoungbuk
2012
0.206
0.212
0.117
0.408
0.975
2017
1.290
0.850
0.110
1.675
3.416
Gyeoungnam
2012
0.198
0.193
0.094
0.457
0.942
2017
0.213
0.195
0.166
1.502
2.036
Jeju
2012
0.894
0.718
0.147
0.393
2.152
2017
0.534
0.257
0.150
0.491
1.432