



Abstract
It is now a common consensus that there is a need to lessen the consumption of fossil fuels as they are the main cause of greenhouse gases. Electricity is one of the chief determinants of greenhouse gases emission as its generation is dominated by fossil fuels. Thus, it is imperative to decarbonize the electric power sector. The main objective of this work is, therefore, to examine the potentials to switch from fossil fuels to clean energy which comprises of nuclear power and the various renewable energy sources of solar energy, hydropower, wind energy, biofuels, and geothermal. Due to the unsuitability of the ordinary least squares (OLS) procedure in the face of severe multicollinearity, the ridge regression procedure was adopted to obtain the parameter estimates using the U.S. annual electricity sector data for the period 1985 to 2018. The results show that substantial substitution exists between clean energy and the fossil fuels of coal and natural gas in the U.S. electricity sector. The results also underscore the importance of energy resource in the process of economic growth and development of U.S. To fully harness the potentials of clean energy, the study recommends increased investment in each of the components of clean energy. This should be complemented with various policy instruments such as provisions of tax credits and feed-in tariffs for clean energy and imposition of tax on carbon consumption.
Introduction
One of the key objectives of the various multilateral environmental agreements (including Kyoto Protocol of 1997 and Paris Agreement of 2015) and initiatives (such as Intergovernmental Panel on Climate Change or IPCC) is the reduction of fossil fuels as they are the main cause of greenhouse gases (especially CO2 emissions), which in turn increases global warming. The consequences of rising global warming include worsen air pollution, higher wildlife extinction rates, recurring cases of acidic oceans, rising sea levels, and recurring cases of natural disaster (including droughts, storms, floods and heat waves). The alternative to fossil fuels is clean energy, which is constituted by nuclear energy and renewable energy sources such as hydroelectricity, biomass, geothermal energy, solar energy and wind energy. Clean energy sources are mostly carbon neutrals and generate insignificant or no emissions.
Besides, clean energy sources constitute the mainstay of green electricity generation. Over the past five decades, nuclear power use has decreased CO2 emissions by more than 60 gigatonnes, which is almost two years’ value of world’s energy-induced emissions. 1 Substituting fossil fuels with renewable electricity sources will generate a reduction of at least 38% in CO2 emissions per capita in most cases. 2 Although the use of clean energy sources might lead to a rise in consumption of fuel and unnoticeable loss of power on conventional diesel engines with no or less modification, 3 substituting fossil fuels with clean energy will still lead to more output. This is because the power generated from clean energy sources are used in all productive sectors. 4
Hence, the increase in their use is likely to lead to improved public health because rising emission levels have negative impact on public health. Since most clean energy is locally sourced, energy security is likely to increase as their use increases. Clean energy can generate numerous jobs, and moreover, most of these jobs are likely to benefit the local population as they involve installation as well as construction works. Wind farms need technicians for maintenance, while solar panels require humans to install them. In contrast to fossil fuel industry, which is often mechanized and capital intensive, the clean energy technologies are more labour intensive. There are more jobs generated for every unit of energy generated from clean energy than from non-clean energy. 5
In most countries across the world, the fossil fuels dominate the energy sector, especially the electricity generation mix. About 16,947 terawatt-hours or 63% of the total electricity was generated through fossil fuels sources while only about 9,823 terawatt-hours or 36% of the total electricity was generated through clean energy in 2019. 6 Not surprisingly, electricity and heat production generated 13 billion tonnes of CO2 emissions or 41% of the total CO2 emissions from fuel combustion in the globe in 2017. 7 One of the most important and efficient ways to reduce CO2 emissions and global warming is to decarbonize the electric power sector through the substitution of fossil fuels with clean energy. 8 The viability of such substitution can be investigated within the inter-fuel substitution context as demonstrated by Berndt and Wood. 9
This study therefore aims to investigate the potential of substituting the fossil fuels- coal and gas for clean energy in the course of electricity generation in the U.S. The present study uniquely contributes to the extant literature in many respects. First, it is perhaps the very first single-country specific study that empirically analyzes substitution possibilities between clean energy and fossil in the quest for clean and sustainable electricity generation for a single-country. Majority of the extant papers have focused on the examination of the substitutability relationships among the traditional energy quartet of electricity, natural gas, coal, and oil. Second, using clean energy as a composite unit provides the opportunity of incorporating less visible renewable energy sources such as geothermal energy, solar energy and wind energy into the analysis. Third, the existing studies have also been largely conducted within the framework of the aggregate energy sector with limited attention on the electricity sector.
Fourth, the study thus has the potentials of offering further insights to relevant stakeholders in the process of trading off high-carbon emitting fossil fuels for the various components of cleaner energy such as hydro, wind, solar, biomass and nuclear power for electricity generation. Fifth, the estimated elasticities are useful in the designs of computable general equilibrium for energy-related models which are uniquely distinct from the other computable general equilibrium models in that constant elasticity of substitution types of production functions are incorporated, where output is treated as a function of energy and other non-energy inputs, which permits the substitution of the different energy inputs for one another. 10 This is especially important in the case of the U.S. with considerable potentials for various types of clean energy resources for electricity generation.
We have selected the U.S. due to several reasons. Firstly, with a real GDP of US$18 trillion, the U.S. was the biggest economy in the globe and accounted for 22% of the global GDP in 2019. 11 Secondly, by consuming 94.65 exajoules of energy and accounting for 16% of the total energy consumed in the globe, the country was the largest energy consumer after China in 2019. 6 Thirdly, by generating 4401.3 terawatt-hours of electricity in 2019 and accounting for 16% of the total electricity generated in the globe, the U.S. is the second largest electricity generator in the globe after China. Fourthly, by producing 4,965 million tonnes of carbon dioxide in 2019, the country has the second biggest carbon dioxide in the world after China and accounted for 15% of the total carbon dioxide emitted in the globe. 6 Fifthly, similar to the situation in several nations, fossil fuels dominate both the energy consumption mix and electricity generation fuel mix in the country.
About 1,747 terawatt-hours or 63% of the total electricity was generated through fossil fuels sources in the country, while about 1,612 terawatt-hours or 36% of the total electricity was generated through clean energy in 2019. 6 Thus, making the electricity sector one of the major causes of the country’s emissions. According to the International Energy Association, 7 electricity and heat production generated 1823 million tonnes of CO2 emissions or 38% of the total CO2 emissions from fuel combustion in the country in 2017.
We organize the remainder of the paper in the following way. A review of the extant literature is in the next section, while the Model, data, and estimation technique section explains the model, data and the technique of estimation adopted in this study. The Results and discussion section present the empirical findings, while the last section comprises the conclusion as well as the policy implications of the paper.
Literature review
Among the various subfields within the broad field of energy economics, interfuel substitution studies have received scholarly attention as an important area. Table 1 provides a summary of selected studies including notable early contributors as well as recent advances on the subject. Originally inspired as a response to the global oil shock of the 1970s through the pioneering work of Berndt and Wood, 9 early contributors on the subject were focused on the substitutability between the traditional energy quartet of electricity, natural gas, coal, and oil (See Fuss; 12 Pindyck; 13 Uri; 14 Hall 15 ). In recent times, notable contributors that have followed this line of research comprise of Lin and Liu, 16 Lin and Atsagili, 17 Lin and Tian, 18 Wang and Lin, 19 Wesseh and Lin, 20 Serletis and Xu, 21 Li et al., 22 and Lin and Abudu. 23
Summary of selected studies on inter-fuel substitution.

Note: Definition of abbreviations: AE: Aggregate Economy; INDS: Industrial Sector; TRS: Transportation Sector; ELS: Electricity Sector; MFS: Manufacturing Sector; MI: Machinery Industry; EGS: Energy Sector; GDP: Gross Domestic Product; K: Capital; L: Labor; EG: Energy; C: Coal, G: Gas; O: Oil; E: Electricity; H: Hydropower; MG: Motor Gasoline; P: Petroleum; BIOD: Biodiesel; ETH: Ethanol, B:Biomass; BIOF: Biofuel; CE: Clean Energy; DE: Dirty Energy; RE: Renewable Energy: NRE: Non-renewable Energy; LM: Logit Model; SUB: Substitute; COMP: Complement; TCF: Trans-log Cost Function; I3SLS: Iterative 3-Stage Least Squares; 2STCF: 2-Stage Trans-log Cost Function; IZGLS: Iterative Zellner Generalized Least Squares; IZ: Iterative Zellner; TPF: Trans-log Production Function; RR: Ridge Regression: ISURE: Iterative Seemingly Unrelated Regression; VAR: Vector Autoregressive; DFAM: Differential Fuel Allocation Model; NCESPF: Nested Constant Elasticity of Substitution Production Function; MSMLDS: Markov Switching Mini-flex Laurent Demand System; DLM: Dynamic Logit Model; NQ-CF: Normalized Quadratic Cost Function.
Source: Compiled by the authors.
In recent times, scholars are expanding the subject of interfuel substitution to focus on other areas such as Tan and Lin 24 who extended the analysis to examine the influence of carbon tax on the ecological efficiency of China’s energy intensive industries and Wesseh and Lin’s 25 work on energy substitution and technology costs in a transitional economy. However, the increasing quest to avert global warming and ensure resource sustainability has necessitated the need to expand the scope and accommodate other energy sources, especially renewable energy sources, into the analysis.
In response to this quest, for instance, Kim, 26 in a study on the Korean electricity industry, investigated the substitutability relationships between renewable energy and nuclear power using a monthly data series that spanned the period January 2006 to December 2013. The result of the estimated Morishima substitution elasticity shows that renewable electricity and nuclear power are complementary while renewable electricity and fossil fuelled thermal power generation are found to be substitutes. In another study conducted to investigate the possibility of switching from non-renewable energy to renewable energy for Ghana, Lin and Ankrah 27 used the ridge regression estimation technique to obtain the parameter estimates. The findings show a negative impact of non-renewable energy while renewable is found to have a positive albeit insignificant impact on the Ghanaian economy. The study also found evidence of positive but weak substitutability between the two energy sources. The limited substitutability was attributed to inherent problems associated with transition such as scale, cost, and location and thus recommends an optimal energy matrix with both renewable and non-renewable energy sources.
Apart from incorporating renewable energy as a composite energy source, its constituents such as hydropower and biomass have also been incorporated into the analysis. For instance, Khalid and Jalil 28 incorporated hydroelectricity into the analysis in a study on Pakistan energy sector. Using the ridge regression procedure to estimate a trans-log production function for a four-fuel model involving hydropower, coal, petroleum and natural gas for the period 1980–2013, the results show that hydroelectricity has the highest output elasticity and all factors are found to be substitutes and thus suggested the subsidisation of energy development programs in conjunction with the application of taxes and infrastructural developments to redirect technology towards the development of the hydroelectric power sector.
Using a different approach, a similar conclusion on the substitutability relationships between hydropower as a renewable energy source and the non-renewable energy sources of coal and natural gas was reached by Bello et al. 29 for Malaysian electricity sector. In a somewhat different study, Solarin and Bello 4 extended the analysis by further introducing the dynamics of sustainable development in investigating the potential for substitution between fossil fuels and biomass in Brazil for the period 1980–2015 with a conclusion that biomass can serve as a strong substitute for the non-renewable energy sources of natural gas and coal and that there are some inherent negative impacts of fossil fuels use on the economy that are made noticeable with the use of the sustainable development index.
There is no denying the fact that the U.S. has received a great deal of attention on interfuel substitution studies. For instance, Hossain and Serletis 30 investigated the degree of substitutability among fossil fuels for the period 1919 to 2012. Though the magnitude was small, their study provided evidence that substitution potentials exist between natural gas and crude oil while no evidence of such substitutability potentials could be established in the case of coal and oil. Furthermore, the study also reveals that, in response to changing coal prices, natural gas serves as substitute for coal, but coal proves not to be a substitute for natural gas when the price of the latter is varied. In another study focusing on the U.S. transportation industry, Brown 31 investigated the substitutability between natural gas and other petroleum-based fuels. The result shows evidence that relatively weaker gains in prices of natural gas in the U.S. would enhance the substitution of natural gas for oil in the transportation sector in the country.
In a relatively recent study, Mugabe et al. 32 examined the relative technical efficiency and fuels substitution potentials in the U.S electricity generation sector. Employing a panel of annual state-level data that covers the period 2001 to 2017, the study observed different state level substitution elasticities from the pre-2009 to post-2009 periods which was attributed to spatial heterogenous of the continuous availability of relatively cheaper natural gas for electricity production. The final analysis shows that technical efficiency is enhanced by substitution elasticities while CO2 emissions are reduced by substitution elasticities across states state.
There have also been scholarly efforts that incorporated individual components of renewable energy in interfuel substitution studies for U.S. For instance, Suh 33 explored the interfuel substitution possibilities among ethanol, biodiesel, natural gas, and oil in the U.S. transportation sector. The outcome of the study showed that the demand for ethanol is more elastic relative to other fuels while petroleum is shown to be the fuel that has the most inelastic demand. The study also found ethanol to complement natural gas and substitutes petroleum while biodiesel proved to be a substitute for petroleum. In terms of the nature of the interrelationship between natural gas and ethanol, the latter is found to be a complement for the former. Substitutability relationship is established between ethanol and petroleum as well as between biodiesel and petroleum. Before then, Jones 34 had shown evidence that biomass can substitute natural gas, while Suh 35 had established substitutability between coal and biomass; and between natural gas and biomass while establishing a complementary relationship between biomass and electricity.
In a later study, Suh 36 revealed substitutability relationships between ethanol and petroleum; between gas and petroleum; and complementary relationships between ethanol and natural gas. More recently, Hossain and Serletis 37 examined biofuel substitution in the transportation industry of the U.S during 1990–2017, utilizing the normalized quadratic model. The study found that there is a limited substitution possibility between natural gas and biofuel, and between oil and biofuel, when there are changes in prices of fossil fuels.
From the survey of the literature, we observed that interfuel substitution studies that have incorporated clean energy as a composite energy source into the analysis is rare. As far as we know, it is perhaps only Papageorgiou et al. 38 that have done so in a study on a panel of 26 countries including the U.S for the period 1995 to 2009. The study showed that the estimates of the elasticity of substitution within the energy aggregate are pointedly more than one, averaging 2 for the electricity sector and as high as 3 for the non-energy industries. This present study is a departure from Papageorgiou et al. 38 as we have not lumped non-renewable energy into a composite unit of dirty energy as done in Papageorgiou et al. 38 We have analyzed each components of non-renewable energy viz-a-viz the clean energy to determine which one offers highest substitution potential for clean energy. Unlike Papageorgiou et al. 38 which a panel study, this study has been conducted solely using U.S. data and thus offers a more single-country specific policy insights and recommendations.
Model, data, and estimation technique
Model
The adopted model is a twice differentiable transcendental logarithm (trans-log) production function of a second order Taylor Series expressing the relationship between output and different input combinations of the form:

In this specific instance, the output of interest is the real gross domestic product (GDP) while the inputs are capital stock (K), labour (L), and energy (E). According to the theory of production in microeconomics, the energy (E) is assumed to be homothetic and weakly separable into its various components. The major energy components for US under considerations are the fossil fuels of coal (C) and natural gas (G) and then clean energy (CE) which is a combination ofnuclear energy and renewable energy sources. Given the multivariate nature of the trans-log models with k number of regressors, the number of estimable parameters is given as 
From equation (2), we can generate the estimates for the output of elasticities for the energy inputs which are then further used to derive the elasticity of substitution between them. For a linear homogenous production function, the economically feasible boundary is required to satisfy the condition that the marginal products of all inputs be positive. Consequently, the positive elasticity of output for each energy input 
Thus, for each of the energy factors coal, natural gas and clean energy, the output elasticity is obtained as:




Equation (7) is further transformed as follows:
a

Lin and Liu
16
has demonstrated that the substitution elasticity between two inputs 


Data
The employed dataset are the yearly series of U.S. real gross domestic product (GDP), gross fixed capital formation (GFCF), labour, and the energy consumption series for coal, natural gas, and clean energy for the period 1986 to 2018. The World Development Indicators (WDI) of the World Bank 11 is the source of the real GDP and GFCF series and they have been expressed at constant 2010 US dollars to avoid inflationary bias. The Conference Board, 40 through its data and analysis section provided data for the labour series proxied by the numbers of employed persons (in thousands per persons). The energy data were scooped from the Statistical Review of World Energy of the British Petroleum (BP) 6 and are obtained at their million tonnes of oil equivalent (MTOE) values. The clean energy series is a composite series which involves the combination nuclear energy and renewable energy sources including hydropower, solar energy, wind energy and biofuels, biomass, geothermal energy, and wind energy.
Estimation technique: Ridge regression
The existence of squared polynomials makes trans-log models highly susceptible to severe multicollinearity problem which can affect the efficacy of the estimation. In this instance, the standard errors of the estimated parameters are overstated thereby deflating the test-statistics. Consequently, the p-values become insignificant with grossly inconsistent coefficients thereby weakening the overall predictive power of the model. Under these circumstances, the direct use of the traditional ordinary least square (OLS) method would lead to unreliable and misleading parameter estimates.
An alternative method that specially addresses the problem of multicollinearity was developed by Hoerl.
41
This unique regression procedure, known as the ridge regression, entails slightly modifying the parameters of the least squares estimates by incorporating a penalty parameter knows as the ridge parameter (k) such that the typical matrix for the least squares parameter estimates given as
We strive to obtain a value of k that is optimum. An optimum k value is the one that ensures that the error of the mean squared obtained from the ridge regression estimation procedure falls below the mean squared error of the ordinary least squares estimation and the lesser this value the better as it implies a lesser bias in the estimation. Hoerl and Kennard 42 proposed the use of the ridge trace as a systematic way of identifying the optimum k value. The plot of the ridge race displays the relationships between the ridge regression parameters and the various values of the ridge parameters k. Usually, the regression parameters will fluctuate as the value of k varies and eventually stabilizes around a particular k value which in known as the optimum value of k.
Results and discussion
Ridge regression results
The results of the tests for the extent of multicollinearity in the model are as shown in Table 2. First, we present the variance of the inflation factors (VIFs) of each variable which is the quotient of the variance of the overall model to that of the variance of a single independent variable. As reported in the table, with the exception of capital labour, all explanatory variables have VIF that significantly exceed 100. In addition to the VIF, it is also noted that some variables have Eigen values whose condition numbers are greater than 100. These results show that there is a presence of severe multicollinearity problems in the model and as such the direct application of the conventional OLS estimation technique is no longer tenable.
Least squares multicollinearity test result.
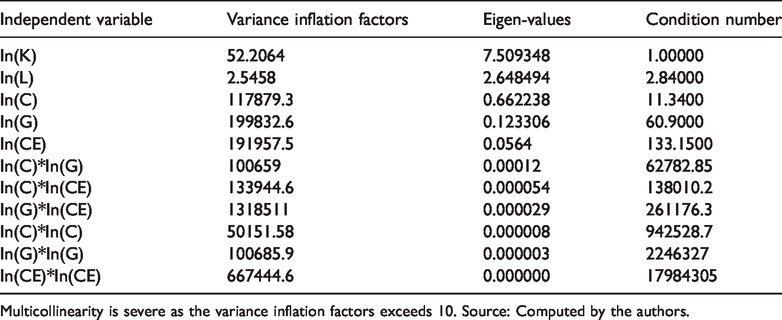
Multicollinearity is severe as the variance inflation factors exceeds 10. Source: Computed by the authors.
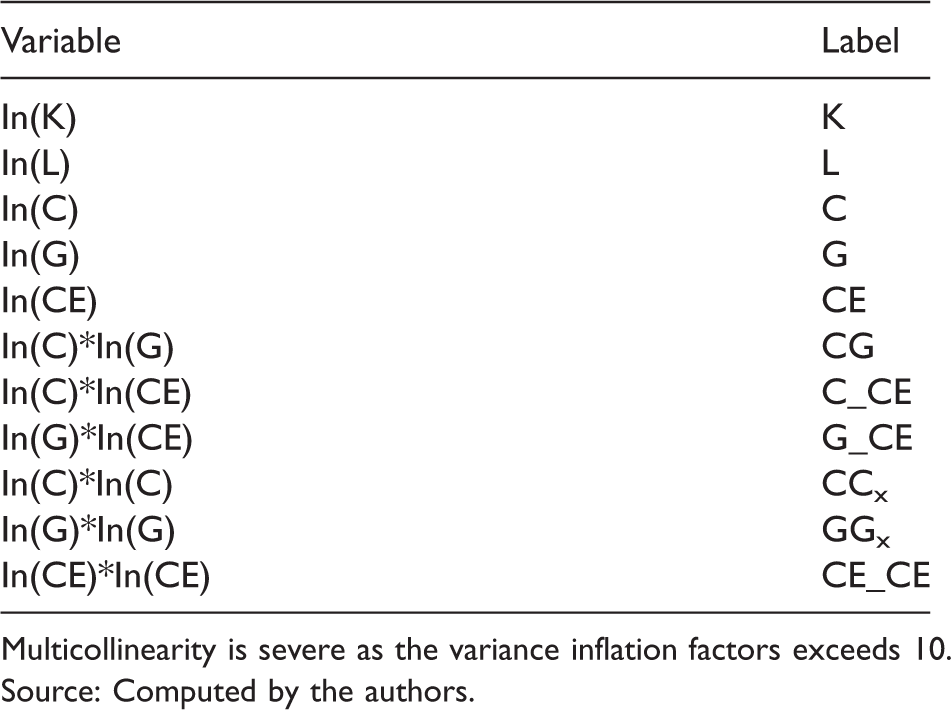
Having established the suitability of the use of the ridge regression procedure, the next step is to determine the optimum value of the ridge parameter using the ridge trace plot. Figure 1 shows the ridge trace plot for the ridge regression procedure. Based on this plot, a ridge parameter of 0.10072 has been chosen as the optimum value of k as the parameter estimates become stable around this value. A logarithm measure has been used to display several k values such that the values on the vertical axis, including the OLS solution where k assumes the value of zero, can be represented. In reality, the log of zero is negative infinity, and therefore the true solution for the OLS cannot be captured when the horizontal axis is represented on a log scale. It is observed that varying k makes the values of the parameter to fluctuate until they become stabilize around the k value of 0.10072.
The ridge trace plot for the selection of optimum penalty parameter.
Furthermore, we have demonstrated the effects of the ridge regression procedure on the variance inflation factors of the parameter estimates in Table 3. In the table, several values of ks are shown with their corresponding parameter estimates. The first row, highlighted in red, with a k value of zero corresponds to the VIFs of the OLS estimates while the last row, highlighted in green, with a k value of 0.10072 corresponds to the VIFs of the ridge regression estimation. As can be seen, varying the penalty parameters (k) reduces the variance inflation factors. The OLS penalty parameter of zero has correspondingly large values of VIFs which continue to decrease with gradual increment of the penalty parameter until the value of 0.10072 where the variance inflation factors for all variables have come under 10 thereby effectively addressing multicollinearity.
Impact of the ridge parameter (k) on the variance inflation factor.
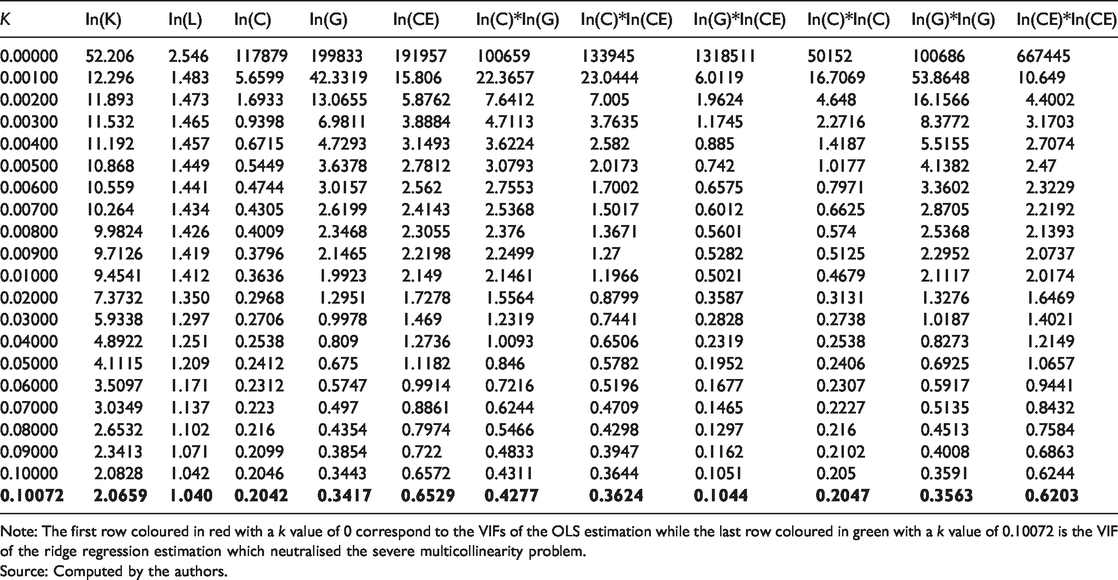
Note: The first row coloured in red with a k value of 0 correspond to the VIFs of the OLS estimation while the last row coloured in green with a k value of 0.10072 is the VIF of the ridge regression estimation which neutralised the severe multicollinearity problem.
Source: Computed by the authors.
The main regression results, with the estimated parameters of the regression procedure, are presented in Table 4. The table displays the values of the variance inflation factor for each of the parameter and as can be seen these values are below 10 thereby establishing the fact that the problem of multicollinearity has been effectively solved. In addition to this, the F-ratio is also significant at 1% level with an R-squared of 97.1% indicating a strong goodness of fit and predictive power of the parameter estimates in the model. This is also reflected in the significance levels of the parameters with the majority being significant at the 1% level. It is also observed that, with the exception of coal with negative and insignificant coefficient, most of the parameter estimates are not only positive but also significant which underscore their significant positive impact in the U.S. This is quite understandable, considering the fact that energy resources are important factors in the economic development process of the U.S.
Ridge regression parameter estimates.
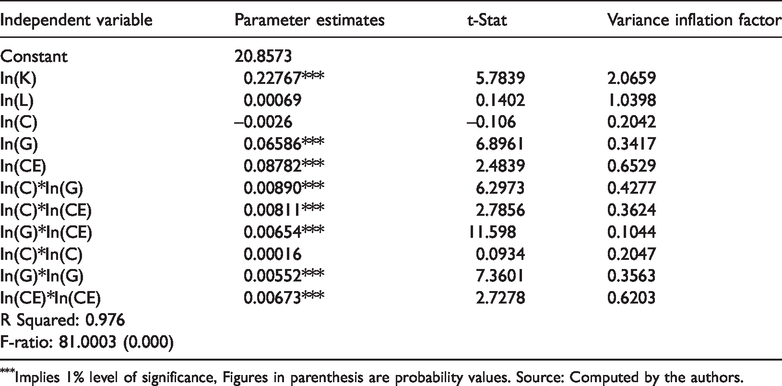
Implies 1% level of significance, Figures in parenthesis are probability values. Source: Computed by the authors.
Output and substitution elasticities
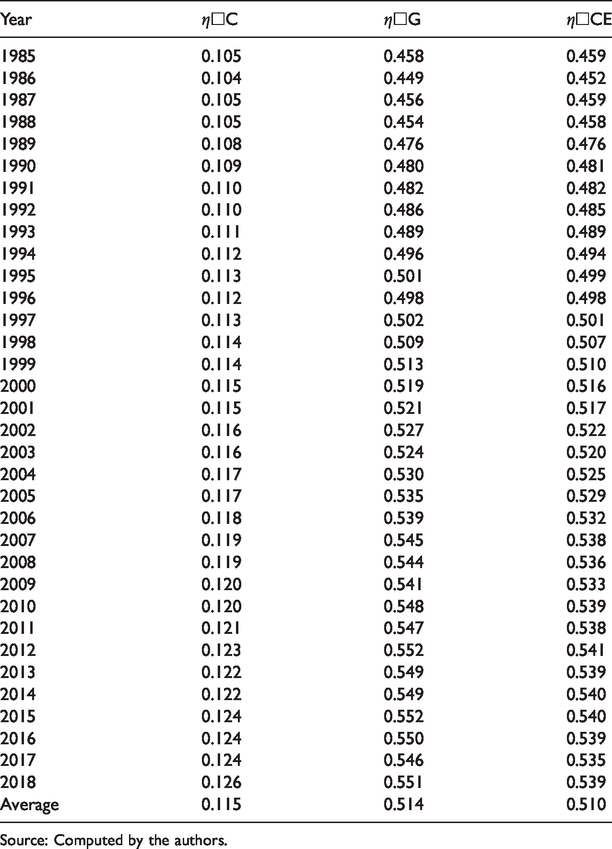
The estimated coefficients of the ridge regression procedure presented in Table 4 are used to generate the output elasticities for the fuel inputs based on equations (4) to (6) respectively for the carbon emitting fuels of coal and natural gas, and the clean energy which is a combination renewable energy sources and nuclear energy. The results, presented in Table 5 show that the average output elasticities, over the sample period, for all energy series are positive thus fulfilling imposed condition of positive technical economic region of equation (3). Intuitively, the results indicate that a 1% increase in the amount of coal, natural gas and clean energy consumption will respectively lead to a corresponding increase in output by 0.115%, 0.514% and 0.510%. The results show that clean energy and natural gas have almost the same output elasticity value with coal has the least output elasticity value despite constituting a higher proportion of the fuel mix than clean energy. This is a pointer to the importance of clean energy not only to electricity generation but also to economic growth in the U.S.
Output elasticity estimates 1985–2018.
Source: Computed by the authors.
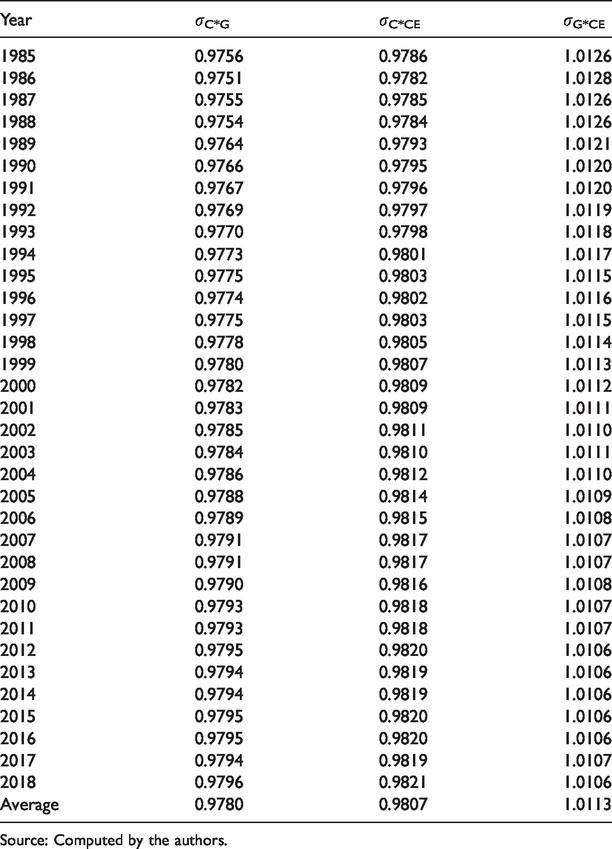
The values of the estimated output of elasticity are used to obtain the substitution elasticity estimates between the energy pairs using equations (9) to (11) respectively for the symmetric substitution elasticities between natural gas and coal, clean energy and coal, as well as between clean energy and natural gas and the outcomes are as shown in Table 6. The results show positive substitution elasticities values between all energy pairs considered with an average value of one. Specifically, the substitution elasticity between coal and gas is 0.978, between coal and clean energy is 0.981 and between gas and clean energy is 1.011. It is noted that the substitution elasticity value between clean energy and each of the fossil fuels is higher than the substitution elasticity between the fossil fuels. It is also noted that highest substitution elasticity value occurs between clean energy and natural gas which might be a pointer to the scientific claim that natural gas is cleaner than coal.
Substitution elasticity estimates 1985–2018.
Source: Computed by the authors.
Discussion of results
The foregoing results which show positive output elasticity of the fuel input is an indication of the presence of increasing returns in their usage, over the course of time, in the production of electricity. As components of clean energy, biofuels, wind, geothermal, and solar energy consumption in the US in 2019 was almost three times more than the consumption level in 2000. 6 The increasing deployment of clean energy sources leads to improvement in the economy as renewable energy sources such as hydropower, wind, biomass and solar are being adopted in various economic activities and across different sectors in the country. The clean energy industry produces several billions of dollars in economic activity and it is anticipated to continue to expand continuously in the future.
There is great economic prospect for the nations that invent, produce and export clean energy technologies. These outcomes are consistent with findings from extant literature such as Cevik et al. 43 and Solarin and Bello 44 on the positive impact of energy resources (especially renewable and clean energy) on the economy of U.S. It is also noted that despite having a high large percentage in the energy consumption profile of US, coal has the least output elasticity. Natural gas has the highest output elasticity followed closely by clean energy. This is a probably a reflection of some of the negative externalities associated with coal being the fuel with the most severe consequence on the environment.
The results also indicate that the energy pairs are substitutes. The substitutability between clean energy and each of the fossil fuel is higher than the substitutability between the fossil fuels. This is an indication that it is better and easier to substitute clean energy for fossil fuels of coal and natural gas than to substitute coal for natural gas or natural gas for coal. Though, studies that have investigated the substitution possibility between clean energy as a composite energy unit and fossil fuels are rare, the outcome of the present study can be compared with studies that have examined the substitutability between the individual components of clean energy and fossil fuels. In this regard, the outcome of this study is consistent with the works Jones, 34 Suh, 35 Hossain and Serletis 37 and Papageorgiou et al. 38 The outcome of this study however slightly contradicts Suh 33 who found ethanol, a renewable energy source, to be a complement for natural gas.
The substitutability of clean energy for the fossil fuels of coal and natural gas is unsurprising and may be attributed to a number of reasons. First is the fact that clean energy is a composite energy unit comprises of several energy components such as nuclear energy and combinations renewable energy sources like hydropower, solar energy, wind energy and biofuels, biomass, geothermal energy, and wind energy. The significant progress in the U.S. clean energy industry is assisting to create the path for a cleaner and sustainable energy future. In recent times, the costs of various clean energy sources such as solar energy system and hydroelectric facilities have fallen considerably thereby helping to provide more American families and businesses access to clean and affordable energy.
Another reason for this result is that some of these energy sources that constitute the clean energy offer numerous advantages relative to the fossil fuels. These include dependability, established technology, and relatively inexpensive costs of running and upkeep. For example, hydropower, a component of clean energy, is exceptionally adaptable to variations in demand which is an important asset for operators of electricity network. 45 Similarly, wind energy also offers advantage in terms economy of space and flexibility in usage and are naturally freely available. Wind turbines can be installed in distant places and its capacity varies according to needs. Apart from hydropower and wind power, other components of clean energy such as nuclear power, solar power, and biomass are appealing to producers of energy due to their relative insulation to external shocks as they are mostly locally produced resources. Hence, the combination of these factors improves the substitutability of clean energy for non-renewable energy sources of natural gas and coal.
Conclusion
In this study, we have attempted to examine the substitution possibilities between clean energy, which comprises of nuclear power and renewable energy sources of hydropower, solar energy, wind energy and biofuels, biomass, geothermal energy, and wind energy, and the fossil fuels of coal and natural gas for the U.S. electricity sector. Using the U.S. annual electricity sector dataset that covers the period 1985 to 2018, we adopted the ridge regression econometric technique to obtain the parameter estimates of a second order Taylor Series approximation log linear trans-log production function. Our findings show that all energy inputs have positive output elasticity satisfying the marginal product positivity condition that defines the productive section of a linear homogenous production function. In terms of the nature of the relationships between the fuels, we find evidence that all energy inputs under study are substitutes as evidenced by the positive substitution elasticity estimates which is on the average around unity between all the fuels.
The results have some important policy implications for the U.S. as a highly industrialised nation. First, the positive output elasticities of the energy fuels underscore the importance of energy in the economic growth of U.S. This implies that the U.S. has to continually harness its various energy sources for the growth and development of her economy. This is significant taking into consideration the fact that renewable energy which constitutes the largest fraction of clean energy contributed about 11,500 trillion British thermal units (Btu) which is an equivalent of 11.4% of aggregate 2019 energy consumption in the US. The electricity sector was responsible for more than half of the 2019 renewable energy consumption in the US, and renewable energy sources accounted for 17% of total U.S. electricity generation. 6 However, caution must be exercised with respect to the implication of the output elasticity estimates of the fossil fuels. Though the fossil fuels of coal and gas also have positive output elasticity estimates, they are the largest source of CO2 emission in the U.S.
Secondly, being an industrialised nation with heavy dependence on energy use to power its economy, the U.S. is continually under tremendous to keep down its emission intensity. Thus, positive estimate substitution elasticity estimate between clean energy and the fossil fuels implies that the U.S. can continue to satisfy its energy needs by switching from fossil fuels to adoption of clean energy without exerting additional pression on its emission intensity as clean energy sources are reputed for emitting low or no emissions. The country has to significantly reduce the consumption of fossil fuels and correspondingly increase that of clean energy sources to fully maximize the potential of fuels substitutability.
It is noted that despite its potentials, clean energy still accounts for a considerable low fraction of the U.S. energy profile not only within the electricity sector but also with the aggregate energy consumption. Thus, there is need to maximise this potential by increasing the share of clean energy in the country’s energy profile. One way to achieve this is to increase the level on investment in each of the component of clean energy. Such investments can be targeted at funding research that promotes initiatives that help to develop various aspects of clean energy development. The recent effort announced by the U.S. Department of Energy (DoE) on August 1,32,020 to provide a funding of U$20 million for schemes that will boost (R&D) and performance validation for perovskite photovoltaics (PV) for the fiscal year 2020 is a right step in the right direction. 46
To continue to drive the growth of clean energy sources, the U.S., through its various energy institutions such as the DoE, must continue to implement strategic policies in the transition to a cleaner, domestic and more secure energy future. In order to achieve this, key variables that affect market conditions such as deployment cost, diversity, proximity to demand and transmission should be effectively manipulated to optimum advantage. Various policy instruments such as provisions of tax credits, feed-in tariffs, and imposition of tax on carbon consumption should be appropriately employed to promote the use of clean energy while reducing the share of fossil fuels in the country’s overall energy profile. These policies must be in accordance with energy efficiency programs to serve as windows of opportunities to support and sustain the country’s industrial sector.
It is instructive, however, to note a seeming limitation of this study especially in terms of the adopted methodology. Though the adopted trans-log production function provides an insight on the nature of substitutability relationships between input pairs, it, unlike the cost function does not enable the estimation of the own and cross-price elasticities of the fuel inputs. Therefore, for policy designs, especially those involving energy prices, future studies employing the trans-log cost function should be considered.
Footnotes
Declaration of conflicting interests
The author(s) declared no potential conflicts of interest with respect to the research, authorship, and/or publication of this article.
Funding
The author(s) received no financial support for the research, authorship, and/or publication of this article.
