
Abstract
Experiments were conducted to investigate the effect of red mud (RM) dosing on granular sludge formation, biogas production and carbon dioxide reduction from palm oil mill effluent (POME) digestion. The results show that dosing RM adversely affected sludge granulation due to the formation of precipitates and hydrolyzates with poor settleability. However, at the optimal dosage (4.5 g RM/L), it could benefit granules formation and stability by improving the in extracellular polymeric substances and biogas production rate was 87.9 l g-VSadded/d at 4.5:30 mixing ratio. The ratio of 0.5:80–2.5:50 g-VS did not affect methane production and the highest methane yield average 79.9 l/g-VS added for RM:POME of 4.5:30, 14.5 higher respective to that of POME alone only. A CO2 reduction of 89.6% was obtained at RM of 4.5:30 (r = 0.998). The chemical oxygen demand (COD) removal was 87% obtained at 30 g COD/l and 4.5:30 g-VS with growth of sp. Methanosarcina. The process evaluation was found model cone best fitted and actual production of CH4. The evidence by low root mean square prediction error (RMSPE) showed high correlation difference (Dif. %) with predicted value and actual values. Analyses were evaluated that the POME degradation with RM utilization, substantially enhanced the hydrolysis rate (khyd), lag phase time h (λ) and methane production rate (Rm) of mixing ratio of RM:POME. Furthermore, the system showed solid reduction with the increased production of methane.
Introduction
In recent year demands of renewable energy for the energy sources has accelerated significantly and at the same time, the wastewater and industrial wastewater anaerobic digestion to meet the energy. In the current requirement, biogas has attracted much attention to fulfil the desired demand of an eco-friendly and promising energy fuel from anaerobic digestion. Thick brownish colloidal water with mixture of 94–96% Water, 4–6% solids and 0.5–0.7% oil including 2–5% solid comes from the sterilization, sludge and hydro-cyclone palm oil mill effluent wastewater. 1 Palm oil mill effluent (POME) actually in acidic range usually pH from 4–5, chemical oxygen demand (COD) and biological oxygen demand (BOD) are 26.3 and 63.5 gL−1. 2 Mostly the microbial growth in the range of pH between 6.8 and 7.3, during that time the microbes are not livable than 4 and greater than 9.5.3,4
The alkaline extraction of bauxite wastes from aluminium industry in red mud (RM) by bayer process. Due to iron oxide availability the wastes in red color, 65% of the mass in red mud. 4 RM containing iron oxide with composition of fine particles aluminium, titanium oxides and hydroxides.5,6 The alkaline nature, iron and mineral particles in RM, RM has a significant impact on acid neutralization (Wang et al., 2008). In present time, RM has huge amount of iron, due to this bulk application in wastewater and industrial wastewater treatment by Li et al.7–9 Neutralization of acidic wastewater, RM is used to healthy microbial growth for better treatment and biogas production.10,11 RM is used as neutralization of wastewater, sequestration of CO2 and reduction of metals from sites contaminated and application in industrial wastewater treatment or as well as biogas production using as an biocatalysis.12,13 Reduction and sequestration of CO2 from wastewater and reduced the burden of CO2 of its environment. 14
Great attention has been paid to accelerate the start-up period and enhance anaerobic co-digestion POME in upflow anaerobic sludge blanket reactor (UASBR) with the aid of organic and inorganic chemical compounds.15,16 Minerals such as Fe, CaCO3, CaOH(PO4)3, AlSO4, and FeS are formed as a result of metabolic activities, physicochemical reactions and are accumulated either inside or on the surface of granules.17–19 Some metal ions, such as Ca2+, Fe2+, Al3+, Mg2+ and CaO, Ca(OH)2 enhance granulation and play an important role in microbial granule to sequestration of CO2 14 , 20 . Effectively application of iron on sludge granulation to enhance acetoclastic methanogenesis for the growth of sp. Methanosarcina in UASBR was used by Ahmad20,21 and. 14
In recent years has gained the popularity the use of organic and inorganic wastes fermentation in an upflow anaerobic sludge blanket reactor for the treatment of industrial wastewater, over world wide application. 22 With RM is help full for co-digestion of industrial wastewater mainly due to the positive energy balance of anaerobic treatment processes and the development of inexpensive and high rate treatment in UASBR. 23 It is a fact that there are lots of studies carried out on the influence of changing the feed the batch anaerobic reactors, 17 but citations to continuous reactors are troublesome to search and to know its effect. The UASBR exhibits positive features, such as high organic loading rates (OLRs) in different COD load and RM, with low energy demand. 15
Moreover, POME and RM, thus a good balance between carbon source and C/N ratio balance these two parameters have to be obtained for good digester operation. RM will reduce methanogenesis time of contact between substrate and biomass. 24 In this regards, the co-digestion of POME with RM is a complex microbiological process involving different types of biochemical reactions. 25 The mechanism of kinetic of methane evolution and yields involved in the anaerobic digestion is thus definitely fundamental for designing the anaerobic process,26–29 evaluating the character of anaerobic digestion optimization the process.
The kinetics study was to evaluate the impact of RM on methane production, methane yields and wastes reduction during anaerobic digestion and to explore the mechanisms of CO2 reduction. In this study, RM was added as the batch mode POME digestion system with different doses, aiming to explore an effective and a practically feasible method to enhance biogas production from POME. The application of three types of kinetic models (first-order kinetic, modified Gompertz and Cone models) were applied and compared with more exact principle kinetics of methane yields and production from anaerobic digestion of POME.
Material and methods
Sample collection
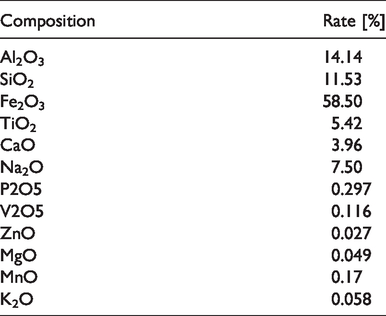
A dry red mud sample was collected from Oman. The red mud sample was washed with water and filtered to obtain approximate particle sizes. The POME samples were collected from SC-Palm Oil Mill, situated in the Sohar, Oman. The samples were stored at 4°C prior to use in the study, to decrease the biological degradation and acidification. The physiochemical characteristics of POME are given in Table 1. Table 2 summarizes the characterization of the red mud sample used for POME treatment. Samples were prepared in accordance to the method as described in the literature. 30
Physico-chemical properties of the POME.
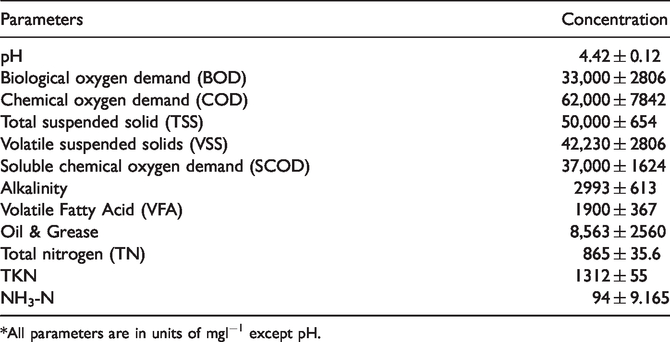
*All parameters are in units of mgl−1 except pH.
Composition of red mud.
Extraction of iron
The processes to extract iron according to, 31 includes reducing the iron oxide to elemental iron or magnetite, magnetically separating the iron out of the red mud, evaluating the iron product for commercial use and smelting (if necessary) to recover iron as a value added product, and investigation for use of the non-magnetic material. Each of these steps depends on a number of variables, significantly altering the individual end products. These variables include the carbon content, temperature, time and the presence of a calcium oxide layer, which maintains a reducing atmosphere. Table 2 summarizes the results gathered from experiments performed on the complete reduction of the iron.
Seed sludge formation
Prior to this study, a 5 l UASB reactor was incubated with flocculant sludge taken from commercial anaerobic digester of palm oil treatment plant for one month at 35°C, using 3.5 g glucose as organic substrate. Nutrients (in mg/L) like NH4Cl 174; MnCl2.4H2O, 0.15; CoCl2.6H2O, 2.3; ZnCl2, 23; NiCl2.6H2O, 0.12; H3BO3, 0.08; Na2MoO4.2H2O, 0.085; Yeast extract (100); CuCl2.2H2O, 0.17 were also added to improve granulation. During this period the reactor was fed daily with 155 mL of diluted POME. At the end of this period, about one-liter quantity of this biomass containing 11,130 mg/L COD; 4,600 mg/L BOD; 3,236 mg/L TS (total solids), and 9,125 mg/l VSS (volatile suspended solids) was used to seed the experimental reactor. Sodium bicarbonate (NaHCO3) solution was used to adjust the pH value of POME in the range of 6.5 to 7.5. As one liter of seed sludge was introduced into the reactor, the corresponding sludge loading rate was 0.5 g-VS/h.
UASBR operation
A laboratory-scale UASBR (5126 cm3) with 5 l working volume was used in this study and continuously operated at 35°C (Figure 1). Heating of the reactor was done from hot water through the water jacket. The feed was introduced from the bottom of the reactor by using peristaltic pump. A gas-solid-liquid (GSL) separator was installed at top of the reactor for biogas capturing. Intermittent mixing was applied with volume and to avoid RM settling in the reactor. The experimental setup of the UASBR is shown in Figure 1.
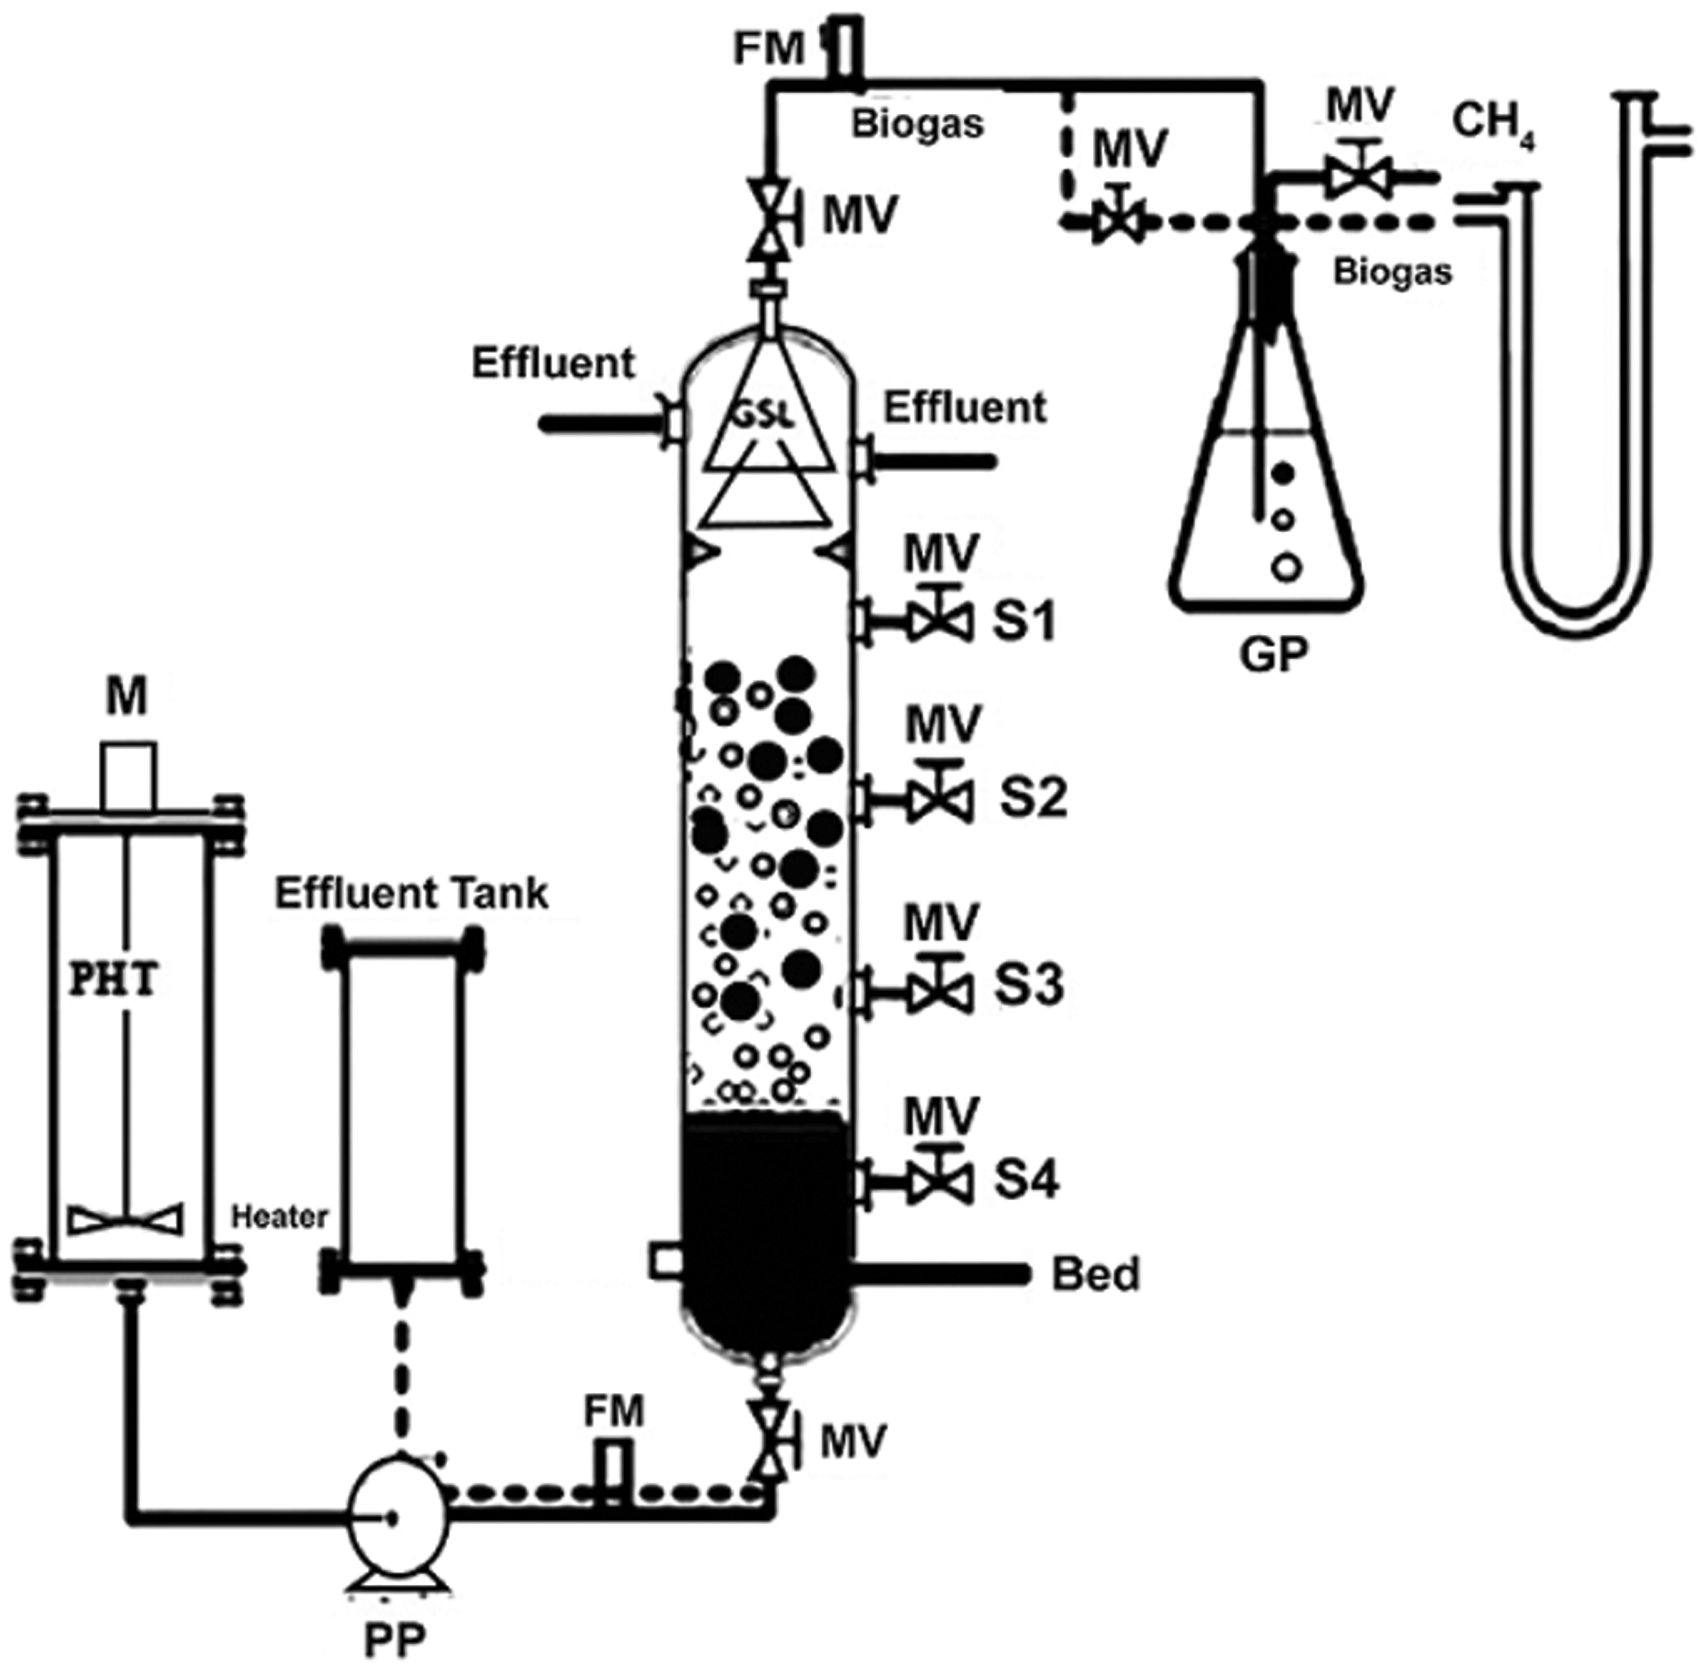
Schematic diagram of fed batch UASB reactor: Experimental setup of UASBR: PHT-POME holding tank; Effluent Tank; PP-Peristaltic pump; M- Motor; SI-S4-Sample port; Bed; GSB- Granular Sludge Bed, FM- Flow meter; MV- Manual valve; Heater; GSL- Gas solid liquid; GP-Gas purifier tank; CH4.
Process analysis
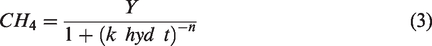
In present study, the mass balance, rate equation and Monod of, mathematical models were applied to the UASBR for determination of kinetic analysis. Modified first-order kinetic (equation (1)), Modified Gompertz (equation (2)) and models Cone (equation (3)), were applied to analyze the cumulative methane production from POME and RM for methanogenesis in this study.23,32,33


Analytical analysis
The analyses of all samples were carried out in an according to standard methods. 30 COD was measured by direct digestion method using HACH-DR 5000 apparatus high range (435HR program), and the biogas yield with a wet gas meter (W-NK-O.SA, Shinagawa). Gas samples were obtained through an inverted funnel placed above baffles near the top of the reactor. Biogas composition was determined using a gas chromatograph (GC-8A, Shimadzu, Kyoto) with a thermal conductivity detector equipped with a steel column packed with WG-100 (GL Sciences, Tokyo) at 50°C. Volatile fatty acids (VFA) were determined with a gas chromatography (W-NK-O.SA, Shinagawa), equipped with a 2 m x 4 mm glass column packed with Suplocopor (100–120 mesh) coated with 10% Fluorad FC 431. The particle size distribution of the different RM samples was determined by using a particle size analyzer (Model 2000E, Malvern). A major oxide analysis of each RM sample was done using ICP-OES (Vista-PRO Radial, Varian). Samples were first set by lithium metaborate/tetraborate fusion. Headspace gas samples were collected regularly and analyzed for CH4 and CO2 gas. All tests were conducted in duplicate at 37°C in a shaker at 150 rpm. The RM-iron in the solution was estimated by permanganate titration.
Results and discussion
Batch experiment
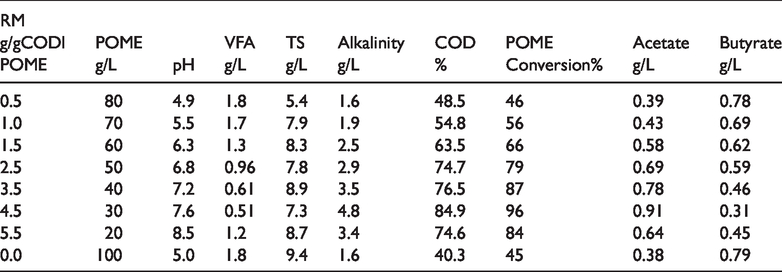
To determine the effective mixing ratio of the RM:POME was applied concentrations of 0.5:80, 1.0:70, 1.5:60, 2.5:50, 3.5:40, 4.5:30, and 5.5:20 g-VSadded (Table 3). The effective dose of 4.5:30 g-VSadded was indicated neutral pH 7.5 and healthy microbial activity by continuous reduction (15.5 to 84.9%) of initial COD concentration. Interestingly, alkalinity was increased from 1.6 to 4.8 g/L with decreasing VFA and COD (Table 3). POME contains about 0.91 g/L acetate in terms butyrate decreased up to 0.31 g/L, and high volatile suspended solid 5.3 g/L were more effective for POME conversion 96%. Maximum degradation of VFA was observed at POME concentrations of 30 g COD/L and at 4.5:30 g-VSadded. Such concentration favors the anaerobic degradation of VFAs upto greater extent and positive effect on VFA degradation.
Effect of RM doses on various parameters in POME effluent treated at various RM in g/l POME during fermentation time of 80 days.
Biogas production
The rate of biogas production and release of iron obtained in an anaerobic digestion is presented in Figure 2. As shown in Figure 2, when RM was added to POME digestion system, their influence on biogas production was relevant to the mixing ratio dosage. When the mixing dosage of RM was 4.5:30, however, the average biogas production decreased to 87.9 l g-VSadded,/h of the control and release of Fe was 0.15, which was further decreased to 24.9% of the control as the dosage of RM increased to 5.5:20 g-VSadded and release of Fe was 1.15. Apparently, higher concentrations 4.5:30–5.5:20 g-VSadded were capable of inhibiting the biogas production. The same observations were reported by other researchers when the behavior of RMs in wastewater treatment system was studied.37,38 Supported to our findings, the production of methane and removal of COD performance using UASBR negatively affected when the Al bauxite residue was 10.5 g/l and also overall performance of UASBR.17,39
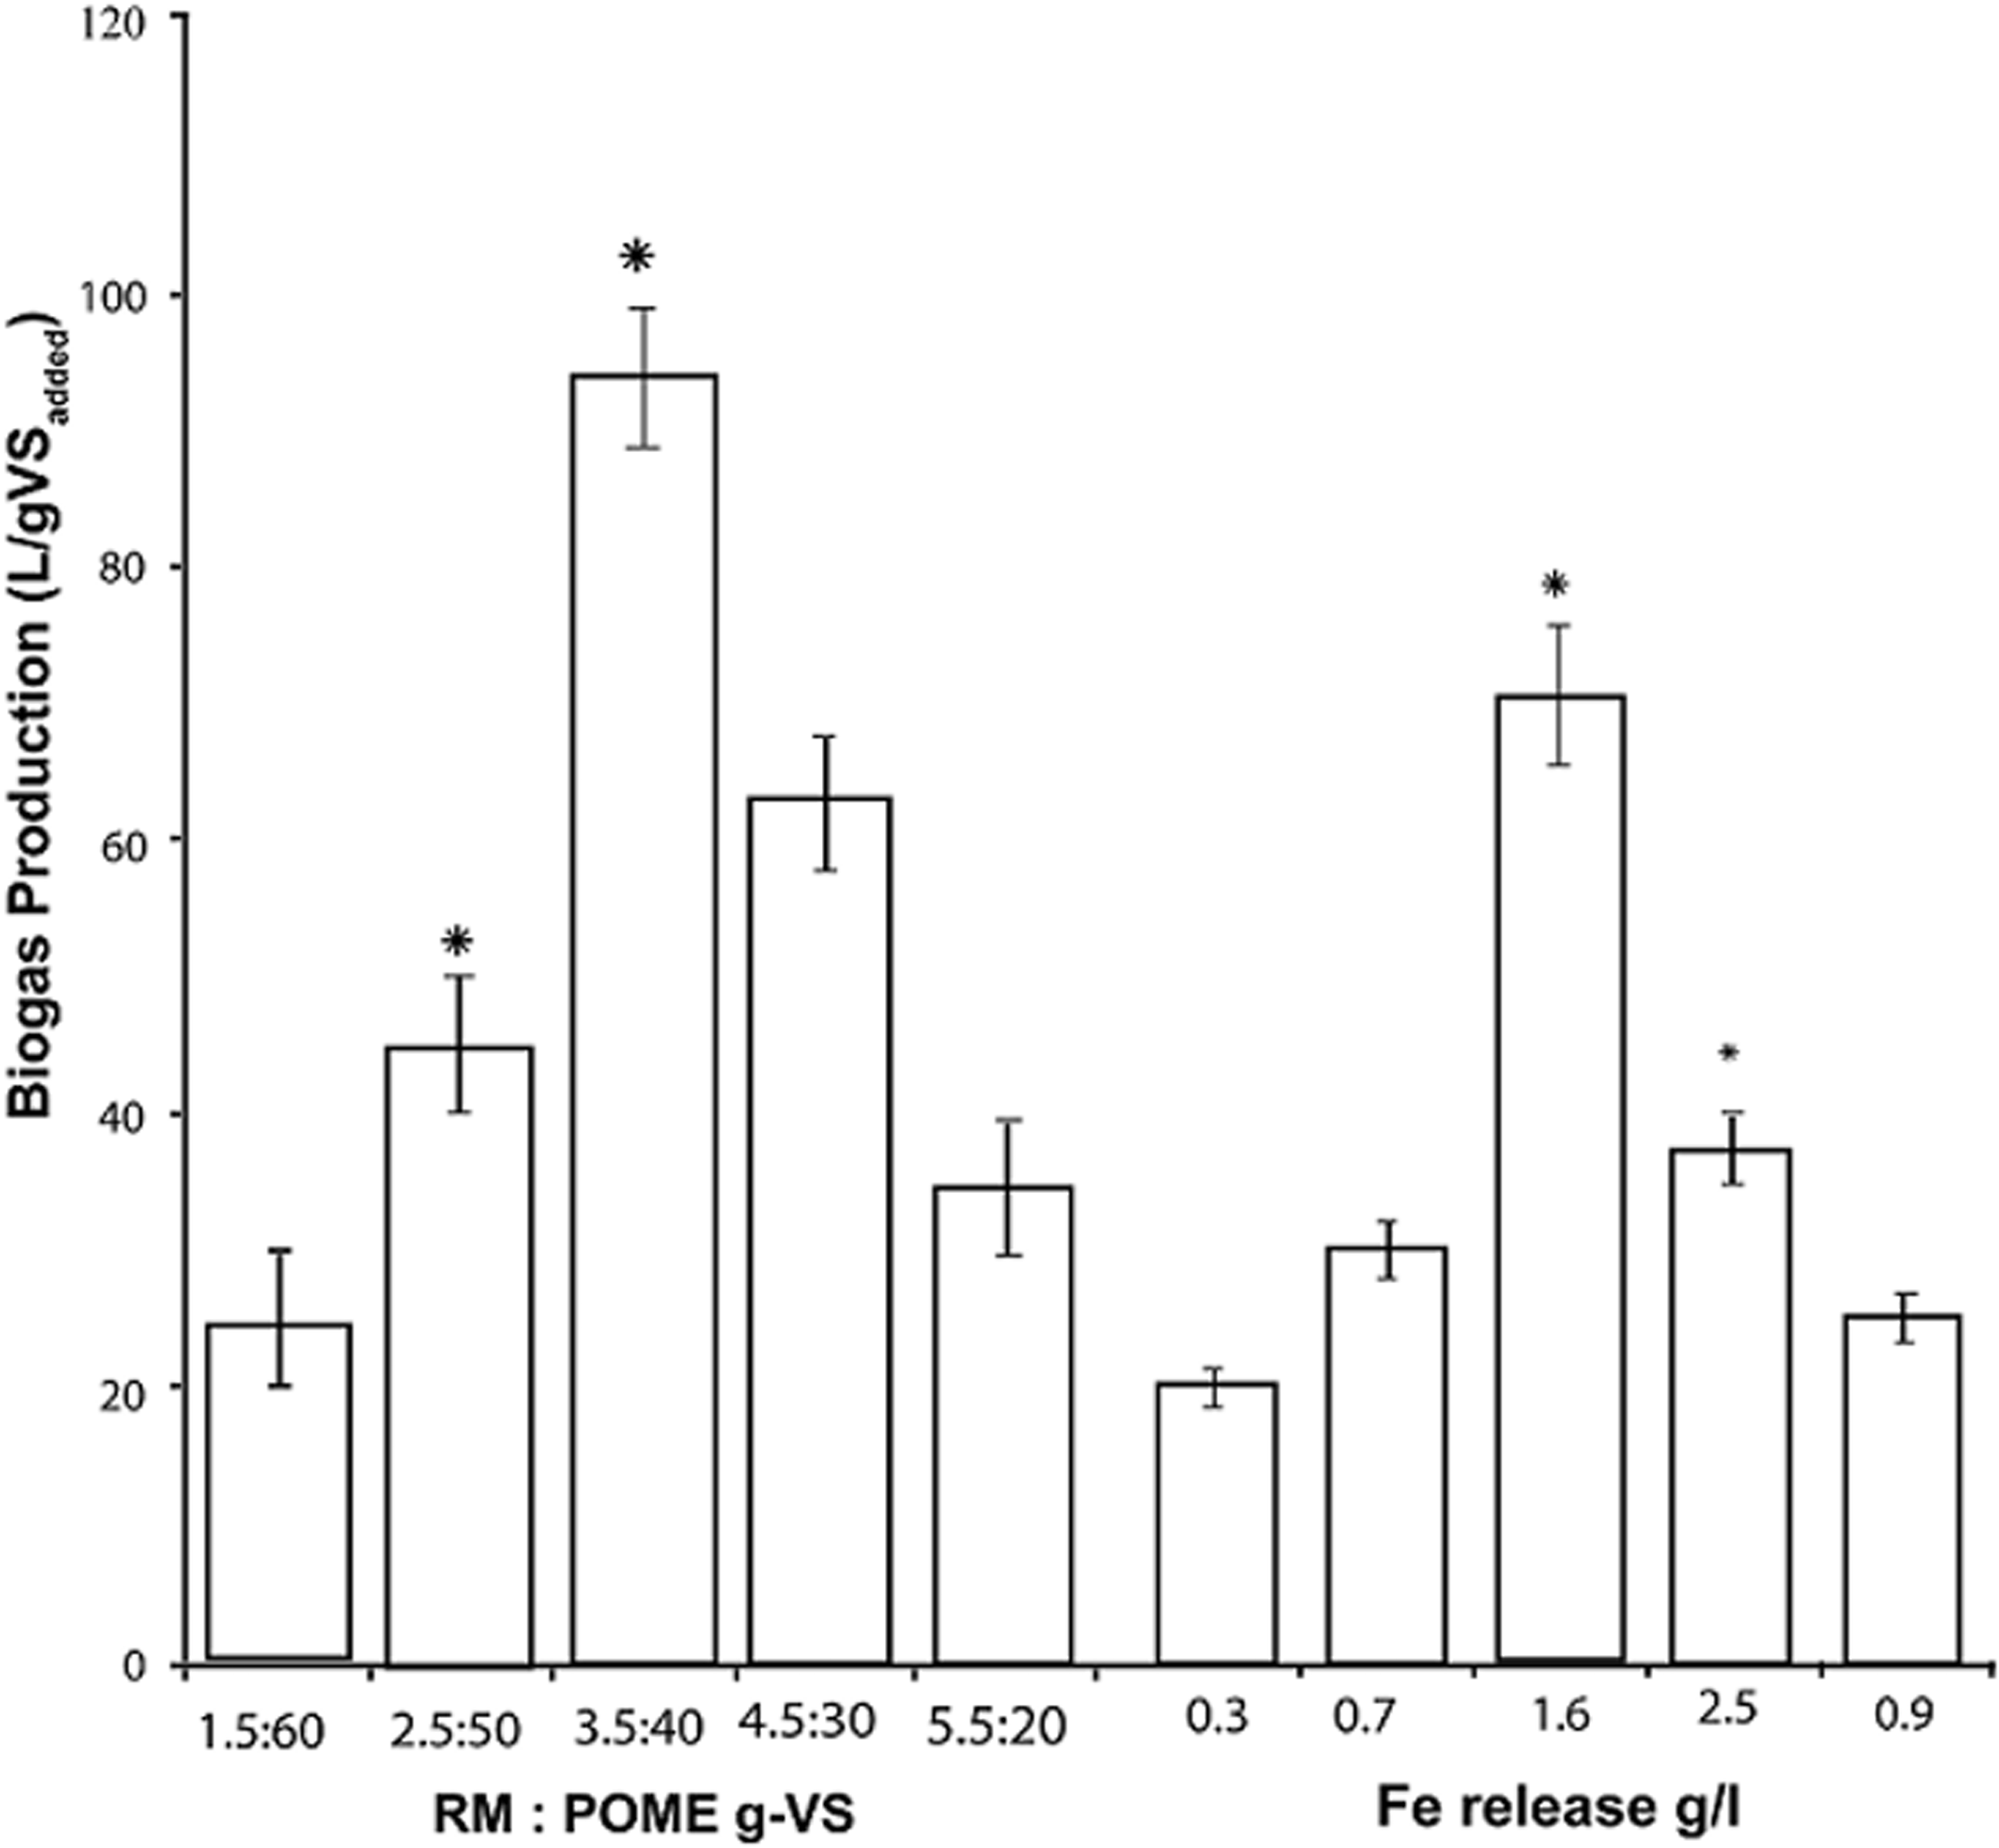
Effects of different mixing dosages ratios of RM:POME for biogas production during POME co-digestion and the corresponding released Fe. Asterisks indicate statistical differences (p < 0.05) from the control. Error bars represent standard deviations of triplicate tests.
UASBR performance
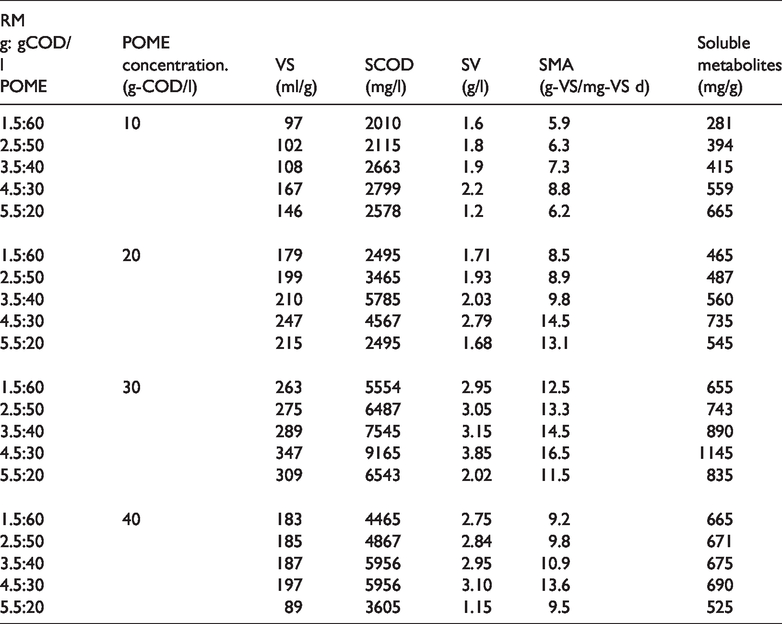
In this research, operated an upflow anaerobic sludge blanket reactor (UASBR) continuously at 35°C in order to observe the effects of varying the RM from operating at various days. Application of RM was carried out because of its abundance wastes, cost effectiveness and bioavailability for microbial digestion and neutralization of wastes. 40 Effect of RM on various parameters in POME effluent treated at different mixing dosages of RM:POME ratios like sludge volume (SV) 347 ml/g production rate was increased with a decrease of mixing ratio of RM:POME. On other hand, SCOD and SV yield showed an opposite trend as it decreased when RM was reduced. The specific methanogenic activity (SMA) was 16.5 g-VSS d at 4.5:30 g-VSadded, also showed an increase in production rate soluble metabolites of 1145 mg/l (Table 4). During the acclimatizing phase, the SV and SCOD were steadily rose upto the values of 347 ml g/l and 9165 mg/l at 4.5:30 g-VSadded respectively (Table 4). The effect of mixing ratio for co-digestion of POME on SMA and SV showed that the greatly increased up to the 4.5:30 g-VS, but no such enhancement in SMA and SV had been identified even after the mixing ratio was gradually increased up to 5.5:20 g-VS, hence showed negative correlation factor (r = 0.879). The soluble metabolites are vital indicators for evaluating the fermentation properties and distinguishing the fermentation type. The main soluble metabolites (acetate, propionate, butyrate, valerate and ethanol) were analyzed after the fermentation process, and the results are illustrated in Table 4. As is known that acetate 1145 mg/g was the dominant metabolites in all fermentation mixing ratio, acetate and butyrate usually show positive relationship with methane production.23,41 Above results indicated that the addition of RM could contribute to more efficient fermentation pathway for methane production. Due to application of RM-Fe and BR impacted on effectively biodegradation of organic POME, enhance too fast growth of active sludge and pronounced rapidly growth and involvement of methanogens.3,38 Moreover, same results were mentioned, methane production when POME fermented with bauxite residue, red mud wastes.3,39
Effect of RM on various parameters in POME effluent treated at different dosages of RM:POME ratios during fermentation in reactor.
Methane production and CO2 reduction
The methane production was the highest methane yield average 79.9 l/g-VSadded for RM:POME ratio of 4.5:30, 14.5 higher respective to that of POME alone only. Furthermore, the methane production rate was drastically decreased when the mixing ratio RM/POME from lower to higher (Figure 3). By contrast, previous research was decrease in methane production rate in suspended cell systems caused by cell washout at low or high co-substrate like CKD-CaO, algae, rye grass, sludge and RM-Fe.42,43 The methane yield values were within the range of, but the methane yield significantly decreases from 1.85 l g-VSadded, when the RM:POME was 1.5 g-VSadded. At a higher RM of 5.5 g-VSadded, both methane production rate and yield were lower (Figure 3). The methane content in the biogas percentage was maintained in the range of 69 to 92% at RM of 3.5 to 4.5 g-VSadded. At all range of RM, a high POME conversion of over 98.5%, utilization of RM 87.6% according to conversion of POME in soluble metabolites and average CO2 reduction of 89.6% was found at 4.5:30 g-VSadded, except for the runs at a lower RM:POME of 0.5:80–2.5:60 g-VSadded (Figure 3). Mineral precipitates such as FeO2 and Fe2O3 formed, and sequestration of CO2 reactions occurred mostly through reactions of CO2 with Fe(OH)2 and HCO3. During this reaction FeO2 and HCO3 is the predominant carbonation product of UASBRs.30,44 Thus the have been developed in recent studies to promote sludge methanogenesis, increased solubilization co-digestion, suspended solid settled removal and methane yields, carbon dioxide reduction from industrial wastewater, use of pretreatment like CaO-CKD, RM-Fe, bauxite, algae, food wastes.5,35,38 According to Ahmad 36 found that using red mud for enhanced metanogenesis for sludge reduction at the dosage of 0.006 g Fe/l and in sludge Fe content was 0.057 gFe/g VSS. According to Vlyssides et al. 35 was found that the iron ratio up to 0.024 g Fe/g VSS.
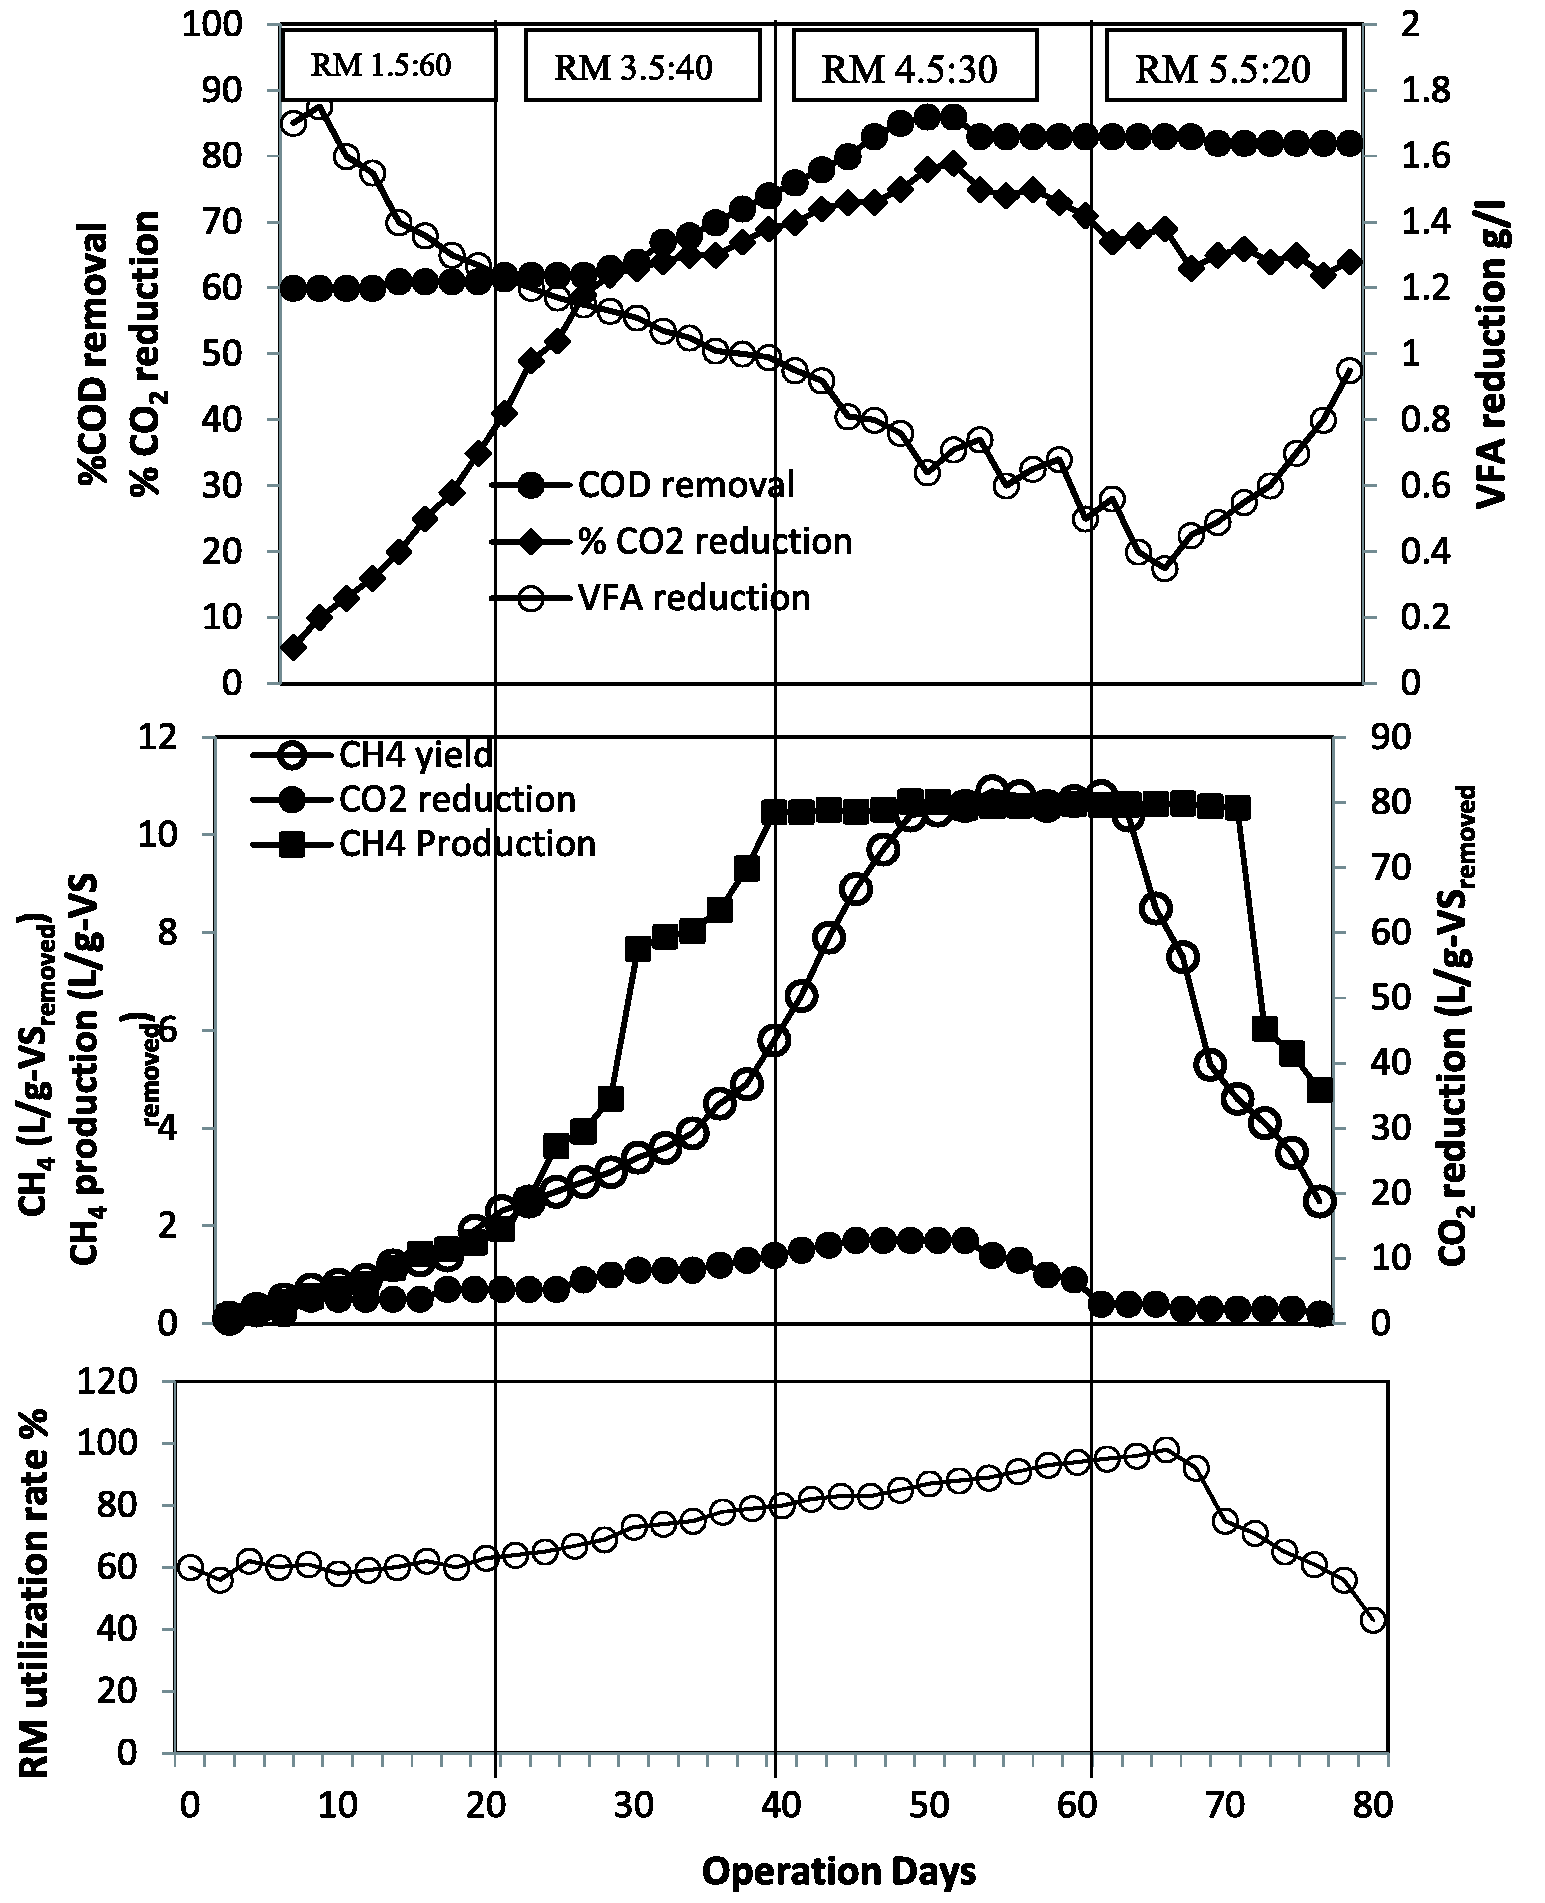
Performance of the reactor at various days for methane production, COD removal efficiencies and CO2 and methane yield and mixing ratio of RM/POME ratio g-VS added.
Environmental safe
Solids removal
Figure 4, discuss the final TS and SS levels after 80 days the co-digestion of different RM:POME mixing ratios. At higher mixing ratio dosage reduce the total solids removal was 82% have been observed at mixing ratio of 4.5:30 g-VSadded. However, both of them sharply in an accordance with the increasing RM:POME dosage, particularly at 4.5:30 g-VSadded was TS 16.5 and SS 9.5 g/l, the suspended solids removal was 31.45% than sole POME co-digestion 7.74%, which might be due to inactive fermentative bacteria and soluble metabolites in the system. This can be proved by34,43 that influent contained a high proportion of suspended solids which can difficult to microbiologically hydrolyze within the short or high proportion of RM with POME. However, these residues resulted in high concentration of loadings do not create any problem in the effluent as they settled rapidly and can be removed easily before final effluent discharge. The reactor operation time was constant so mixing ratio was also constant during experiment (Figure 4). As a result of this, the RM mixing with POME was degraded more easily, eventually giving a more satisfying TS and SS removal and output of more methane.
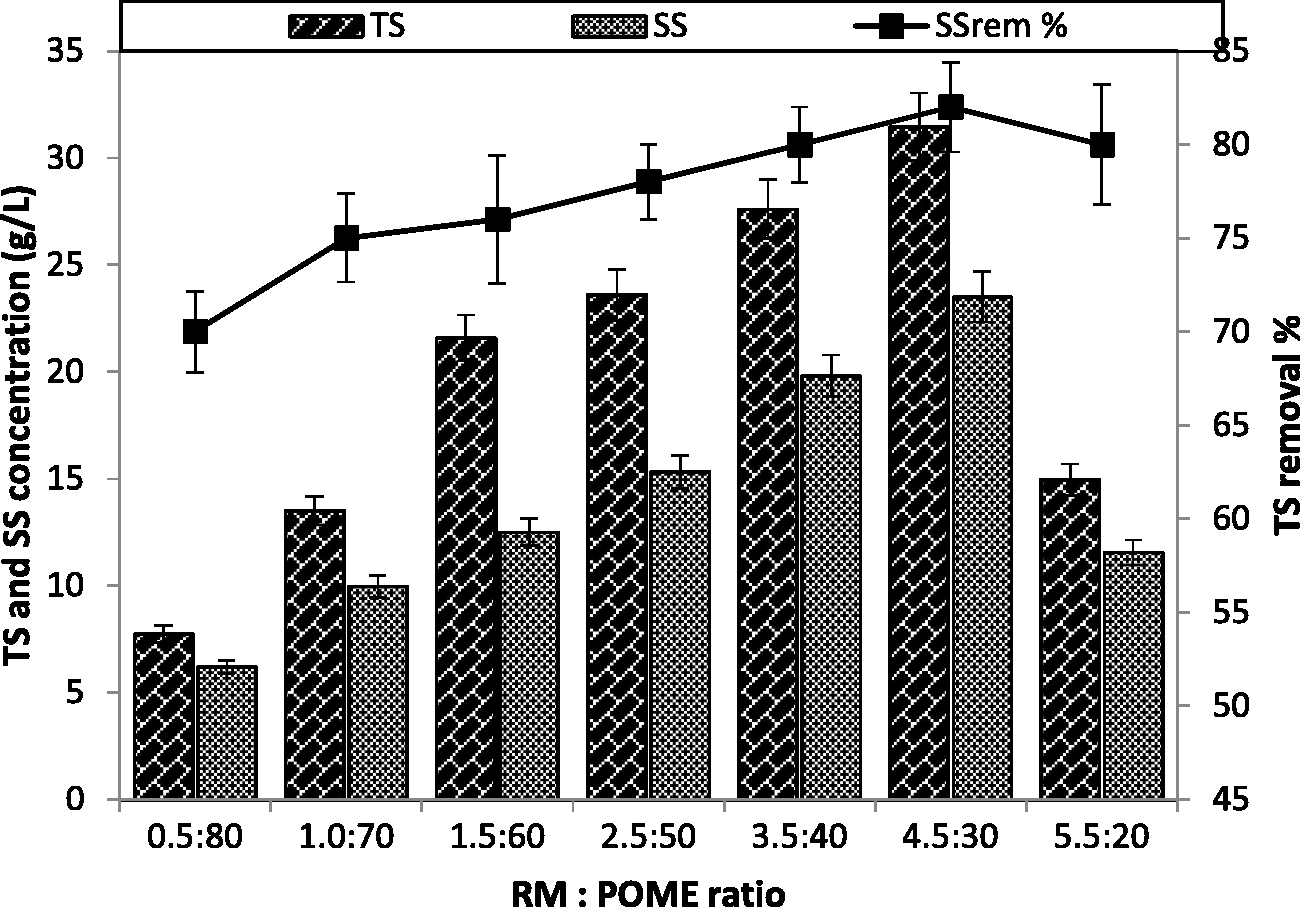
TS and SS concentration: TS removal % contents on day 80 for co-digestion of POME with RMs at mixing ratios of 0.5:80, 1.0: 70, 1.5:60, 2.5:50, 3.5:40, 4.5:30, and 5.5:20 g-VS added.
Process evaluation
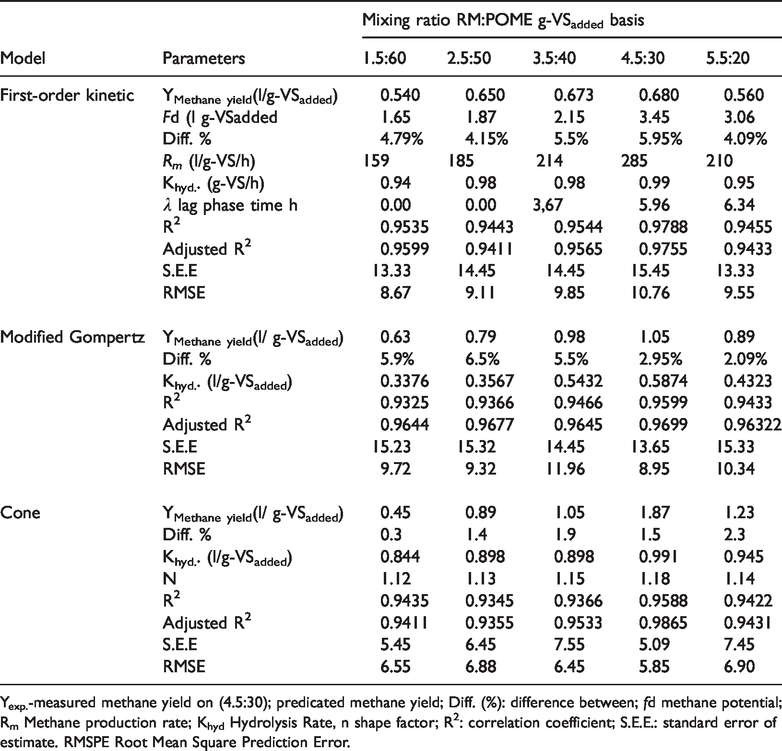
Three types of kinetic analysis kinetic models (first-order, modified Gompertz and Cone) were applied to characterize the methane production obtained from batch fermentation tests, and the results of relevant kinetic parameters such as Y, fd, khyd, Rm, λ and n were estimated presented in Table 5. It can be seen the methane production was well fitted by all these three kinetic models with R2 of 0.9544–0.9788 for the first-order kinetic model, with R2 of 0.9466–0.9599 for the modified Gompertz model, and with R2 of 0.9366–0.9588 for the cone model.
Process evaluation for co-digestion of POME with RM at different doses ratios.
Yexp.-measured methane yield on (4.5:30); predicated methane yield; Diff. (%): difference between; fd methane potential; Rm Methane production rate; Khyd Hydrolysis Rate, n shape factor; R2: correlation coefficient; S.E.E.: standard error of estimate. RMSPE Root Mean Square Prediction Error.
The involvement of RM for the co-digestion of POME resulted in not higher fd was also elevated hydrolysis and methanogenesis rate. As for the parameters achieved from the models (Table 5) measured methane yield (Y)-measured on day 80 was observed in modified first-order kinetic model (0.68), Gompertz model (1.05), followed by cone (1.87), it can be observed that the highest difference (i.e. diff.,%) between the measured methane yield (Y) and predicted was observed first order kinetic (4.79–4.09%) followed by Gompertz model (2.09–9.9%). The cone model was lowest ranging from (0.3–2.3%) for all studied parameters. The cone model among all proposed models, best fitted the actual methane production, which was also strongly supported by it’s the low standard error of estimate (S.E.E., i.e. 5.42–7.45). The hydrolysis rate constant (khyd) evaluated for first-order kinetic, and Cone models increased from 0.175 to 0.194/d, and 0.244 to 0.290/d. As for the maximum methane production rate (Rm), it was 159 to 285 l/g-VSadded d, indicating that the co-digestion with RM can indeed facilitate the methane production from POME (Table 5). The above study was supported by,3,5 find out that the co-digestion of sludge without water with manure enhanced the bioavailability of organic matters in anaerobic systems.
The enhancement of methane production might be because that more biodegradable acetate, VFA and butyrate and nutrients condition, and the dilution of compounds in the co-digestion system enhanced the activities of anaerobic bacteria.34,35,43 Similar activities affect on biogas production volume and rate from sewage sludge were also observed by co-fermentation with CKD alkaline pretreated POME,27,44 or glucose,27,45 or food waste Latif et al. (2011 b). As for the lag time (λ), there were no lag time at POME:RM ratios of 1.5:70 and 2.5:60. However, with the further increase of RM proportion, the lag time showed almost increasing trend (Table 5). The result of λ was in agreement with the methane production pattern, possibly because methanogenesis should readapt the substrate condition with more RM addition. The Root Mean Square Prediction Error (RMSPE) and was calculated as well. Similar to the results of diff. (%), Cone model gave the lowest RMSPE values [6.55–5.85] as shown in Table 5, proofing the high suitability and adequate precision of this model. production pattern, possibly because methane producers should readapt the co-digestion condition with more RM addition.27,42
The finding from this result proved that the modified Gompertz equation was not always the most fitted model for predicting methane evolution, since the characteristics of substrates and methanogenesis employed, and operating conditions could significantly influence the precision and suitability of models.27,45,46 However, limited attention has been paid on the Cone model in spite of its higher precision in some cases. It is expected that more kinetic models should be considered when kinetically analyzing biogas production performance.
To determine the kinetic coefficients yields and methane yield measured, we plotted Figures 5 and 6 using the data from Table 5. More importantly, the order of RM:POME dosage activity was totally in agreement with the order of methane yield predicted l/g-VSadded added and methane yield actual l/g-VSadded. As shown in Figure 5, methane yield predicted was exponentially increased with the increase of RM:POME activity with high correlation coefficient of 0.998. As shown in Figure 6, methane yields actual production was linearly increased with the increase of RM:POME anaerobic co-digestion activity with high correlation coefficient of 0.994.
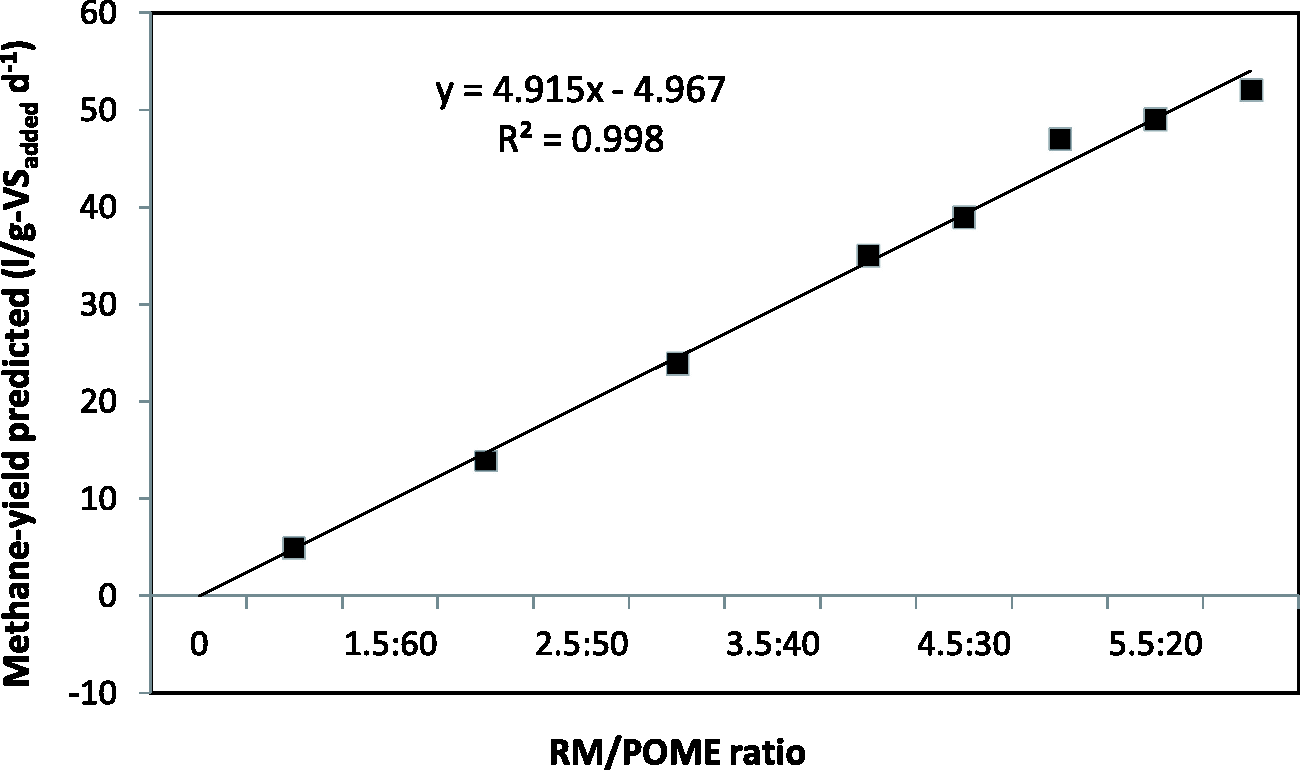
Relationships between RM/POME digestion activity and methane yield: quadric correlations between Y(80)-measured methane yield.
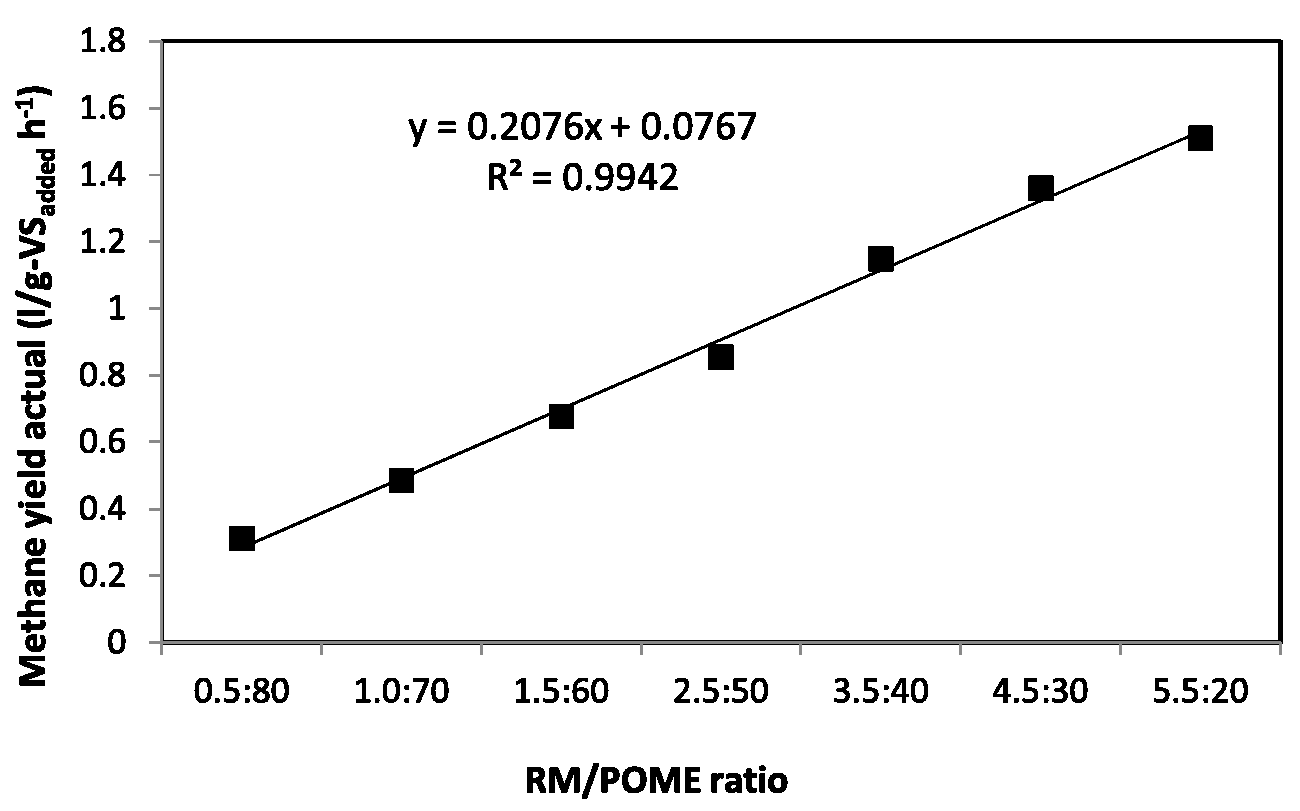
Relationships between mixing ratio of RM:POME co-digestion activity and methane yield: Cone model correlation of actual methane yield.
Conclusions
The proposed kinetic studies were applicable to the anaerobic digestion process, including the granulation of POME in the UASBR with utilization of RM influent substrates. Dosing RM resulted in the adhesion of precipitates onto small-size sludge particles, and reduced the microbial diversity and activity of granules. RM improved the solubilization of substrate and maintains the soluble metabolites, sludge volume (SV), specific methanogenic activity (SMA), reduces the volatile fatty acids (VFA) and inducing a stable co-digestion condition. A CO2 reduction of 89.6% was obtained at RM of 4.5:30 (r = 0.998). The chemical oxygen demand (COD) removal was 87% obtained at 30 g COD/l and 4.5:30 g-VS. Cone model best fitted the actual evolution of methane production, supported by low RMSPE and S.E.E. as well as high Pearson’s correlation between the measures actual values. RM substantially promoted the hydrolysis rate (khyd) and methanogenesis methane potential (fd), well explaining the increased suspended solids removal and output of methane. However, size growth of granules not only increased the active biomass ratio and granule diversity, but alleviated the inhibition to granules.
Footnotes
Acknowledgements
The authors thank to University of Nizwa (UNIZWA) and UMP (Malaysia) for its technical support of this research from the research cluster group (Energy and Environment - renewable energy). From university helping the experimental sample analyzes by Professor Anwar Research Cluster Group Energy, Environment and Sustainable technology.
Declaration of conflicting interests
The author(s) declared no potential conflicts of interest with respect to the research, authorship, and/or publication of this article.
Funding
The author(s) received no financial support for the research, authorship, and/or publication of this article.