
Abstract
This study analyzes the relationship between globalization, energy consumption, and economic growth among selected South Asian countries. This study also finds causal association between energy growth and nexus of CO2 emissions, and employed the premises of the EKC framework. The study used annual time series analysis, starting from 1972 to 2017. The data set has been collected from the world development indicator (WDI). The result of a fully modified ordinary least square (FMOLS) method describes a significantly worsen the quality environment in the south Asian region. The individual country as Bangladesh shows a positively significant impact on the CO2 emissions and destroying the level of environment regarding non-renewable energy and globalization index. However, negative and positive growth level (GDP) and square of GDP confirm the EKC hypothesis in this region. This study has identified the causality between GDP growth and carbon emission and found bidirectional causality between economic growth and energy use.
Introduction
Several economies try to increase the level of competition and economic growth; thus, globalization is playing an important role and can produce sustainable economic growth in developing countries. Recently, various countries have been connected to each especially culturally, socially, economically, and politically, due to globalization and advanced information systems. Globalization permits advanced technology and its transfer through FDI from advanced nations to less technological advancement countries. Therefore, globalization's role in determining economic growth is crucial, and It enhances human economic activities by owing to technological innovations and investment activities (foreign direct investment) of the country.
Conversely, the worldwide demand for goods and services has required increased energy demand; it concluded economic growth is mainly driven by energy. Thus, energy consumption of non-renewable is highly associated with the growth rate, worsening the environment's quality. The leading cause of deforestation, depletion of natural resources, climate change, and global warming is carbon dioxide emissions and globalization. 1
The economy's growth (GDP) is highly connected with energy use and takes as a measure for the “oxygen” for the whole world’s countries. Non-renewable energy is a prerequisite for the achievement of economic growth. 2 Various developing countries and their inhabitants (especially South Asian countries) are living below the poverty line. To lift millions of inhabitants out of poverty, many South Asian countries are trying to achieve economic growth through industrialization, globalization, and trade liberalization. Additionally, Climate change and global warming represent preeminent global issues. Sea levels are rising, snow and ice are melting in polar zones, and due to global warming, the average temperature of the earth is increasing. Notably, more significant government efforts can be reduced poverty and environmental degradation, and in these economies, the issue is to achieve sustainable economic growth.
Unfortunately, land degradation, agricultural development, industrial development, infrastructure development, and other practices have deteriorated environmental quality. The leading cause of climate change and the rise in earth temperature is carbon dioxide emissions.3–6 GHGs represent a combination of gases, but CO2 makes up approximately 75 percent of these gases in the atmosphere. These gases move from one place to another continuously, stay within the biosphere, and not disappear/dissipate for thousands of years. The Joint Research Center of the European Union (EU) reported that the world's ninety percent CO2 emissions are fossil fuel incineration. 7 in recent decades, primarily responsible for environmental degradation is the most developed economies; however, the ratio of CO2 emissions has also increased in developing countries. 8 This converts ocean water into carbonic acid, and marine life and coral reefs are being damaged due to high carbon dioxide rates in the atmosphere. 9
Global warming and environmental degradation have lately been a major challenge for the nations of the world. Increasing CO2 emissions and other greenhouse gas (GHG) emissions have produced extensive environmental effects. These effects have created unexpected changes in weather conditions, increased earth temperatures, and presented more significant dangers to ecosystems. The answers to some questions can be obtained from the EKC model, such as whether an economy can achieve economic growth without worsening the ecological system and whether the environmental quality is deteriorating by the rapid economic growth. Prior empirical and theoretical studies have discussed the energy-growth-emission nexus in well-intentioned works; however, more research is required on this topic for further policy recommendations due to inconclusive findings.
Additionally, the determinants of CO2 emissions in terms of fossil fuel energy sources and economic growth have been discussed in several empirical works.6,10–22 Halkos23,24 explored the growth and environmental degradation nexus and also discussed other pollutants. Similarly, nitrogen and sulphur dioxide have been examined;18,20,25 others have also observed sulphur dioxide. 26 Different studies assessed different countries and different periods and used different methodologies, which leads to inconsistent findings; thus, the quality of the environment can be strengthened by the effective use of energy and sustainable development policies of growth. More effective policies are required, especially in Asian countries where emissions remain high. This study addresses the energy-growth carbon emission nexus, thus based on sequential past empirical research using some control variables under the EKC hypothesis.
Energy demand is essential for growth, but the supply side is limited (the supply of conventional oil and gas are predicted to decline). 27 Nevertheless, geopolitical, economic, environmental and technological challenges are confronted by the energy sector. Thus, energy is vital and increases environmental degradation in economic growth. The next century will face many energy challenges. Among these, energy demand and environmental degradation will be the largest issues due to rapid economic growth and dependence on energy sources. CO2 emissions and climate change are becoming more prevalent due to fuel combustion. 28 Energy is essential for industrial and agricultural production, and this energy increases CO2, nitrous oxide and methane emissions. As a primary energy source worldwide, the fossil energy ratio is rising as fossil fuels produced 82 percent of the global’s energy in 2015. This ratio has remained roughly the same for the last 40 years, as reported by the IEA. 28 Renewable energy sources represent alternatives on-renewable sources and can be helpful in overcoming these issues. 29
Environmental pollution and CO2 emission are strongly affected by economic growth and development. The growth-environmental degradation nexus is not a focus of the early stages of economic growth, environmental issues are not sufficiently considered, and advanced technologies have-not been accessible to solve these issues. 30 Consequently, as per capita income increases, the level of environmental degradation also increases. Numerous researchers have found the links between CO2 pollution, economic development and energy sources as significant. Various explanatory variables are also incorporated in the analysis of the emission, growth and energy consumption nexus, such as trade openness, financial development, population, and other factors. This well-studied topic uses different time period frameworks for different countries, with different methodologies and different controlled variables in various empirical analyses. The findings of these studies conflict with each other and vary according to the country assessed. The tri-variant nexus between CO2 emission, growth and energy has been significantly explored by various researchers.31–47
Even though environmental pollution caused by energy and growth are especially important in Asian countries, however few researchers have analysed the topic as a group for the South Asia region. In the context of the South Asian countries, this subject is also not well documented. Thus, this research includes existing studies on countries in South Asia. As a sub-sample, there have been some important past research, including in Asia-Pacific economies.18,22,44,48–56
Finally, following the global agenda for reducing CO2 emissions, this study investigated the GDP growth, CO2 emission relationship to determine the nexus between CO2 emissions and growth, as well as to provide suggestions for further policy making. The adoption of weak econometrics techniques, wrong statistical data, ignoring diagnostic testing or neglecting random walk trends and serial dependence in time series analysis can be observed in testing the EKC hypothesis. The results maybe spurious if incorrect statistical techniques are applied. To overcome these issues, this study uses an overview of the cross-country panel time series to test the interim and long-term associations under the EKC scheme between the study variables. As an alternative, this study also used renewable energy and technological innovation impacts on environmental quality to obtain the most robust results.
Therefore, this study examines the globalization, growth-emission nexus with other selected variables due to its importance in policymaking and sustainable economic growth across the globe. The study tries to identify the causal growth-energy and environmental degradation nexus under the EKC framework's premises for selected South Asian economies. The unique contribution of our study is tried to overcome a vacuum in the recent studies, under the framework of EKC and by adding some plausible variables. This paper used the most recent data with the latest econometrics techniques and a robust model to fill this vacuum in the empirical literature. The research study question is tightly focused on the policies of environmental sustainability. The main objective of this study is to identify the role of globalization economic growth, i.e., Does economic growth significantly increase/decrease CO2 emissions in the south Asian countries? and Do the selected Asian countries demonstrate an environmental Kuznets curve to demonstrate the growth-CO2 emission hypothesis? Similarly, Can GDP growth be achieved without worsening environmental health in these countries? The literature review is discussed in second section. The model's theoretical framework, a model, and the econometrics methodologies, including the data description, are described in the third section. The results are predicted in fourth section. Finally, the conclusion is discussed in the fifth section and gives suggestions for further researchers and policymakers.
Literature review
A detailed description of the literature review is given, which is based on theoretical, conceptual and empirical analyses of the nexus between energy-growth-induced emissions. The relation between GDP growth and CO2 emissions alone cannot be presented in comprehensive detail; therefore, following the literature review by Nassani et al., 56 this study incorporates various other variables and examined their impacts on CO2 emissions. The studies on Asian countries are discussed as the subsample, and the findings are not identical.18,22,44,51–56 However, except for Niu et al. 43 all other studies have taken various countries to be a whole group. Furthermore, only a few studies used subsamples in the context of Asian countries. This deficiency in previous studies provides motivation for further analysis on this topic with some additional information and changes. With all these deficiencies, this study seeks answers to the research queries.
Recently, the EKC hypothesis have been tested by Jaunky 51 and Cowan et al. 57 and confirmed the existence of EKC tests for cross-country panel data. Besides, Cicea et al. 58 and Ibrahim and Law 59 have assessed panel data under the EKC hypothesis and found mixed results. Similarly, the EKC hypothesis have been tested by Ajmi et al. 60 for G7 nations and found that the results do not verify the authenticity of the EKC by using Granger’s causality test. The energy use, CO2 emissions and economic growth nexus has also been examined by various researchers who have not reached the same conclusions.
In the USA setting, Soytas et al. 34 applied enhanced vector auto regression and observed that CO2 emissions are a big source of energy consumption caused by Granger. In addition they have also explored the energy, CO2 emission and energy growth nexus but have not found any causality among them for the USA; similarly, the results of Soytas and Sari 61 and Ghosh 62 for Turkey and India, respectively, do not indicate any causal relationship among energy, growth and CO2 emissions.
The plentiful empirical analyses on the growth-environment nexus in the innovative EKC premises, but their contribution to empirical analysis is undeniable (especially the studies of Shafik and Bandyopadhyay; 63 Panayotou; 64 and Grossman and Kruege 65 ) Various past empirical works have been performed on this topic to investigate the EKC premises using panel data approaches.67–70 Similarly, various empirical works have employed time series data for cross-country or single country analysis. Thus, this study attempts to estimate the panel group data analysis under the framework of EKC and will thus also contribute to the existing literature.
Through the use of these possible variables within the EKC system, the contribution of this analysis is special, which makes this research distinct from other studies and helps fill a literature void. Furthermore, this research includes the structure of energy use (non-renewable and renewable energy), technological innovation based on CO2 mitigation, the financial growth role and trade openness under the umbrella of the EKC framework. Globalization with non-renewable sources has not been grouped together (in the framework of the EKC hypothesis) in the South Asian countries background; this research used the new evidence in the scientific literature using the most modern econometric methods and a robust model. The research study question is tightly focused on the policies of environmental sustainability with the help of globalization and renewable sources of energy.
Numerous past empirical studies have extensively covered environmental sustainability. They have provided a sustainable framework and various policy implications for environmental protection and sustainable economic growth in the literature; the growth-environmental pollution nexus can be mentioned in the scheme of an inverted U-shaped environmental Kuznets curve (EKC). The environmental quality-growth relation in three stages was defined by Grossman and Krueger. 70 Since the 1990s, the nexus of environmental-growth was used to determine by this curve. Grossman and Krueger 70 have used this curve to examine the North American Free Trade Agreement's environment-growth link. Different analytical analyses initially discussed the EKC's premise for investigating the connection between climate and economic growth and overlooked the role of the other related variables.72–76
The three different stages of the EKC framework show that economic growth initially worsens the quality of the environment at a threshold level, but after a certain maximum point, the curve moves downward; thus, CO2 emissions-economic growth nexus is negative. Panayotou 64 first defined the indicators of pollution- GDP growth nexus under the EKC scheme. The EKC framework is discussed by Stern et al., 76 Ekins, 77 and Gani 78 and evaluated the effects of economic growth on environmental quality. Subsequently, Dinda 30 and Stern 29 discussed this EKC hypothesis in their empirical analysis.
Since the EKC theory was presented in the 1990s, researchers, economists, and environmentalists have focused their attention on the environment-growth nexus under EKC's framework in their theoretical and empirical analyses. 79 The income inequalities and growth (inverted U shaped) nexus is widely discussed in the past literature and was initially developed by Kuznets in 1995. 80 This idea was supported by various researchers in their analysis to identify the environment and its relationship with income in the EKC scheme (followed by Grossman and Krueger, 70 Selden and Song, 26 and Vincent 81 ) Meadows et al. 82 highlighted environmental sustainability awareness for the first time in the 1970s, but in the 1990s, Grossman and Krueger, 70 Panayotou, 64 and Selden and Song 26 described the environmental issues resulting from rapid economic growth and development. These studies have also tested and confirmed the EKC hypothesis. The income-environment relationship under the scheme of the EKC has also been examined by numerous empirical studies.84–88 These analyses have supported the EKC in their analyses by using different techniques. Based on the assessments of economic growth and GHG emissions under the premises of the EKC hypothesis, Apergis and Ozturk, 18 Al-Mulali et al. 5 and Jebli et al. 92 have included various additional explanatory variables in their analysis.
The empirical studies of Tugcu et al., 88 Mensah, 89 Acaravci and Ozturk, 90 Apergis and Ozturk, 18 Al-Mulali et al., 91 and Jebli et al. 92 have included various additional explanatory variables in assessments of carbon emissions-growth nexus. These studies included energy efficiency, energy dependency, and economic structure as the control variables with economic growth to observe the EKC hypothesis's growth-environment relationship. They found that economic growth activities can significantly increase the level of GHG emissions. Lise 93 have also tested this hypothesis for Turkey and India and have not found any CO2 emission- growth nexus. The empirical findings of Robalino-Lopez et al. 87 do not support Ecuador and Venezuela's EKC hypothesis.
Various prior literature includes various indicators of CO2 emission, e.g., growth, the structure of energy use (renewable versus non-renewable), financial development, technological innovation, liberalization of trade and urbanization, and under the EKC premises. However, many countries have recently supported the EKC hypothesis, which asserts the globalization, economic, growth-CO2 emission nexus. Generally, the production of goods and services and its growth cannot be achieved without impacting environmental quality and without consuming energy sources. So, Shahbaz et al. 94 have applied the methodology of a NARDL model for Japan to find the nexus between globalization, environment, and energy-growth between 1970 and 2014. Accordingly, to their results, the environment's quality is significantly worsening, a rapid growth and development processes as a result of globalisation's growth and expanded use of fossil fuels. Recently, Shahbaz et al. 1 have used panel data analysis between 1970 and 2012 for China. Their research investigated EKC hypothesis and the correlations between globalization and CO2 emissions were also examined. The findings suggest a substantial decline in CO2 emissions from globalisation.
Moreover, Shahbaz et al. 95 examined the EKC hypothesis over 1970–2010 for Turkey, and they also verified the EKC hypothesis: increases in the rate of globalization significantly decrease CO2 emissions. Shahbaz et al. 96 explored the intensity of energy, globalization, and carbon emissions nexus for the 19 African countries throughout 1971–2012. Their research supports the existence of the EKC hypothesis for the Algeria, Congo Republic, Zambia, Cameroon, Morocco, and Tunisia. Additionally, the study Shahbaz et al. 97 for the 25 developed countries examined the globalization-carbon emissions relationship during 1970–2014. The findings show that globalization is significantly increasing CO2 emissions.
Recently, Haseeb et al. 98 have shed light on the nexus between CO2 emissions and its essential components: growth, globalization, energy use, financial development, and urbanization for Russia, India, Brazil, South African, and China nations. They have tested the EKC hypothesis and confirmed the EKC for these countries. Their findings show that CO2 emissions significantly decrease with an increase in globalization. However, Shahbaz et al. 99 in their study, used the test “Bayer and Hanck cointegration” and “vector error correction model” (VECM) to examine the effects of globalization on CO2 emissions for India from 1970 to 2012. Environmental quality was found to be positively associated with globalization. Nonetheless, to the best of our knowledge, many researchers have given less attention to globalization, energy sources, and CO2 emissions for the countries of South Asia. Thus, this study is based on past research using the EKC hypothesis with a few additional variables to fill the gap with a chronological empirical analysis.
This analysis utilizes these theoretical aspects and assesses economic growth, energy use, environmental pollution, globalization, and other variables under the EKC method scheme. This analysis used the most recent data (1972–2015) with the latest econometrics techniques, and to fill the previous literature gap, a robust model is used in the empirical literature. Thus various econometrics techniques such as heterogeneous co-integrated panels (with cross-sectional dependence tests), panel unit root tests, the panel co-integration test (the Kao and Fisher), the Fully Modified OLS (FMOLS) test, the test of Granger causality, and “the Innovative Accounting Approach” (VDM and IRF) are used in our analysis. Additionally, the results for selected South Asian economies from 1972 to 2017 showed the long-run association between CO2 emissions, growth, energy, and globalization under EKC's framework.
Methodology
This paper examined the fuel consumption and growth-led CO2 emission concerning the EKC hypothesis. Using data from 1972–2017 for selected South Asian countries such as Bangladesh, India, Nepal, Pakistan, and Sri Lanka, this paper is used World Development Indicator (WDI) 100 data to implement the panel time series analysis.
Theoretical framework and hypothesis
This study tries to identify the effects of globalization, energy-growth, and technological change in south Asian countries and the extent to which the sustainable environmental agenda influences this causal relationship. It is observed that due to technological advancements and modern usage, the consumption of energy increases globally. The empirical studies of Apergis and Ozturk,
18
Al-Mulali et al.,
91
and Jebli et al.
92
have included various explanatory variables in GDP assessments and emissions of GHG under the scheme EKC hypothesis. Furthermore, this analysis comprises and tests on below two hypotheses. Hypothesis1: There is an inverted U-shaped Environmental Kuznets curve (EKC) association between CO2 emissions and GDP growth for the selected South Asian countries. Hypothesis 2: It is expected that globalization can be harmful to the country's economic growth, which could be a sustainable pollution haven hypothesis across the countries.
The environmental degradation-growth nexus can be described in the EKC hypothesis (with an inverted U-shaped). Grossman and Krueger 70 followed up on the work of Kuznets and described the environmental quality-growth nexus in three stages. The author discussed environmental degradation issues due to natural resource depletion. Environmental quality has been significantly reduced by countries attempting to achieve the highest economic growth in this first stage. Beyond this initial stage, the economies' main goal is to attain sustainable economic growth and welfare of the economy with technological innovation (clean environmental-based technologies) and to develop environmental policies to mitigate CO2 emissions. Thus, economies (after reaching the highest level of income per capita) wish to move from poor environmental conditions to a clean environment for sustainable economic growth. 65 The analysis of EKC hypotheses regarding incomes, pollution, and other essential variables in a GDP square function has been used by various policymakers and researchers in the area of environmental economics.
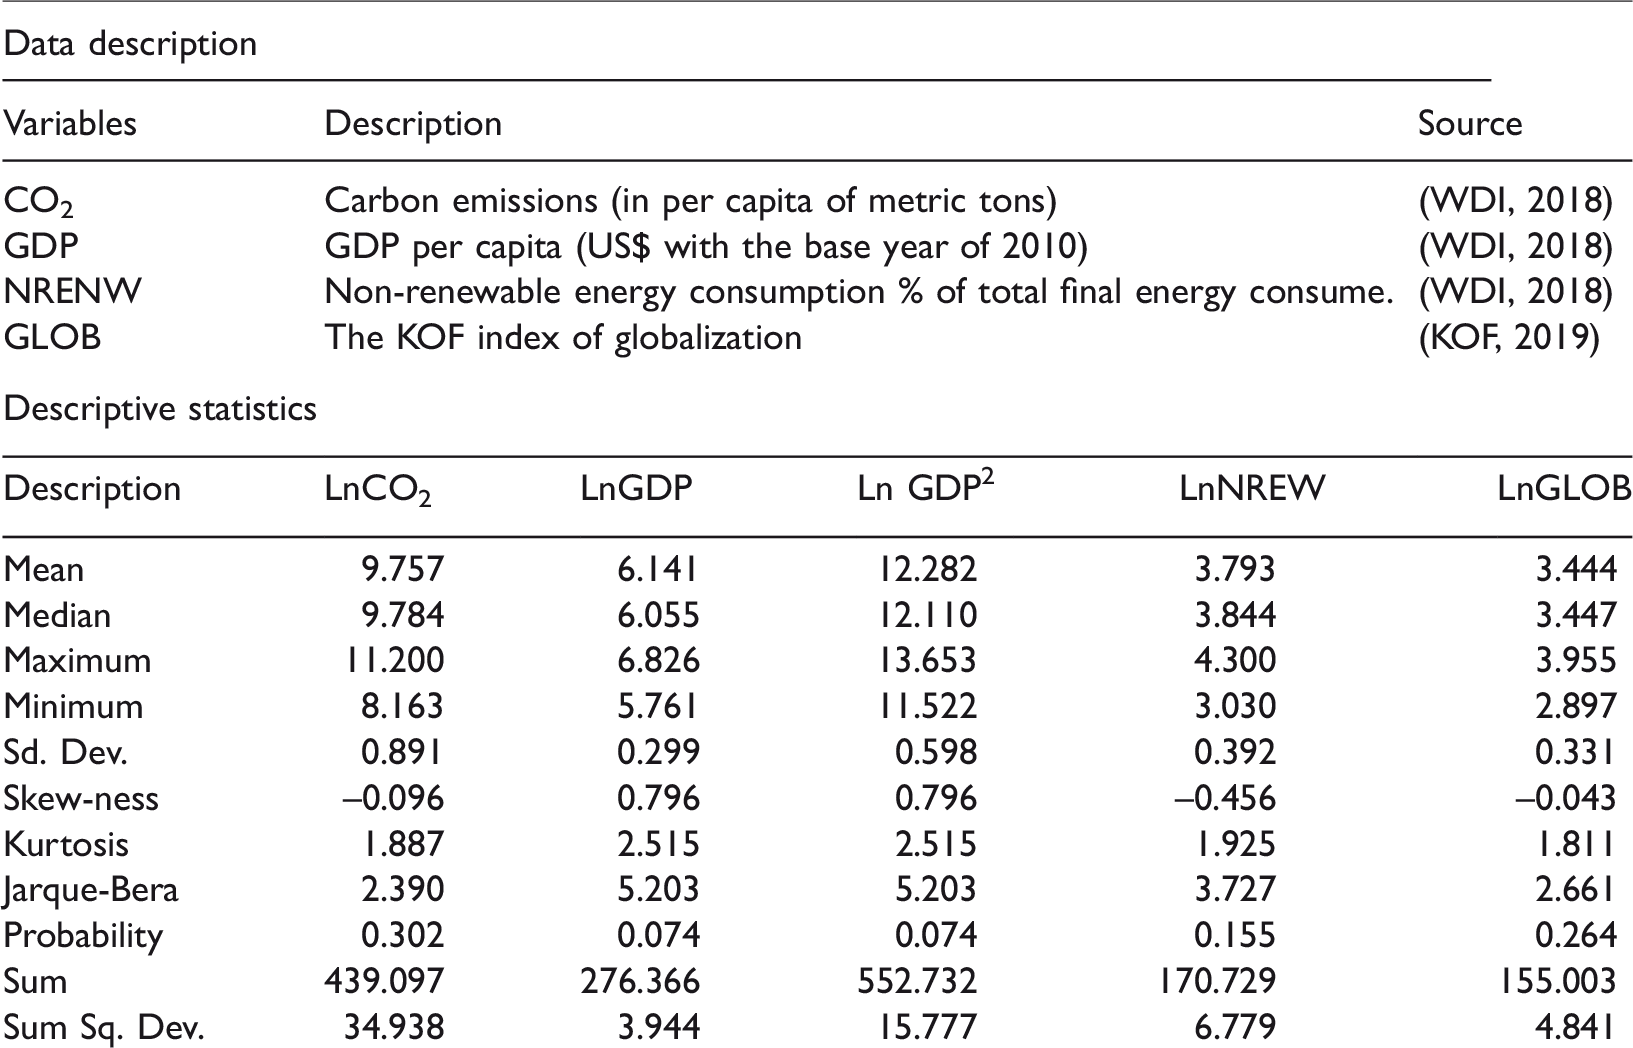
Summary of data description and descriptive statistics.
To analyze the growth-environmental pollution nexus, this study applied EKC's theoretical framework in equation (1) (Grossman and Krueger
70
) The theoretical framework of the EKC framework is used in the following econometric model:

This study has included a few additional explanatory variables in assessments of GHG emissions- economic growth nexus for premises of the EKC hypothesis. Where CO2it shows the carbon emission (per capita) level (environmental pollution), Yit shows GDP (per capita) income (economic growth), and other influential macroeconomic variables are indicated by Xit. To make the model consistent and efficient with a meaningful interpretation, we have thus; the natural log is used for the equation (1).

The influence of non-renewable energy sources, GDP growth, and globalization on CO2 emissions in the selected South Asian countries through 1972–2017 are mentioned in equation (3) and can be written as follows:

Before testing the co-integration method, it is necessary to identify the statistical properties of the model regarding stationary. In the model, it is essential to assess the unit root's presence due to dependent and independent variables with its long-run association. Thus, following the co-integration test, the order of integration may be the same for all the employed variables. Thus, various unit root tests have been designed in this study.102,103 For this purpose, the prerequisite in time series econometrics analysis is unit root test. 104
This study used various unit root tests to control the problem of non-stationary data in the time series data. The regression results will be biased or may calculate a spurious regression if time series variables are not stationary. Maddala and Wu 104 suggested that multiple unit root tests might be employed to control the problem of individual regression inaccuracies across the cross-sections. This study finds no evidence regarding the presence of unit root in the panel data series after applying the cross-section independence test. The two essential subgroups of unit root analysis are divided into line with cross-sectional independence.
(a) Homogenous (common unit root process) case
The panel Levin–Lin–Chu (LLC) 105 is the more common test compared with the other two tests developed by Breitung 106 and Hadri. 107 Identical or homogenous cross-sections are the assumption of this group. The extension of the Augmented Dickey-Fuller (ADF) approach is the LLC test; the assumption of homogeneity (in cross-sectional independence) is incorporated in the autoregressive coefficients under the test of ADF. Bildirici et al. 108 proposed that this non-stationary test is comparatively superior to common panel unit root tests.
(b) Heterogeneous case
Homogeneity in panel data analysis is a very restrictive assumption, and the dynamic properties of the same variable for all series are difficult to calculate; following the assumption of homogeneity can guide to spurious findings. Thus, based on Maddala and Wu, 104 an additional alternative (two) tests are used by many researchers, namely the approaches of Fisher-ADF and Fisher-PP (Philips Perron). In order to permit heterogeneity across the panel, this study uses another alternative test, namely the Im et al. 109 has designed the test of IPS. This study identifies the problem of cross-section dependence; four significant CD tests for robustness are employed. The study applied the (Breusch and Pagan, 110 Pesaran, 111 Baltagi et al. 112 ) (divided by LM test) then finally the Pesaran 113 test of CD. The findings of the CSD test are presented in Table 3. Besides, the findings of the panel unit root were reported in Table 4.
This study used the non-parametric approach designed by Pedroni 115 in the model to overcome the endogeneity and serial correlation problem. The severe issues of autocorrelation and endogeneity (which can generate nuisance problems and bias the results of coefficient estimates from panel data regression) may have arisen in the panel least square regression; therefore, this study used the FMOLS approach to identify the long-run parameter estimates. Granger causality is used to identify the causal correlation between the dependent variable and the explanatory variables with its lagged values. This study used the panel Dumitrescu and Hurlin 114 causality test. Based on the Innovation Accounting Approach (IAA), the next step is consists of two methods, including the “Variance Decomposition Method” (VDM) and the “Impulse Response Function” (IRF). This empirical analysis accounts for these sequential steps to provide robust statistical inferences, and these findings will offer appropriate suggestions to policymakers in a given set of economies.
Data description
This paper examined the energy use and growth that led to CO2 emission nexus under the EKC hypothesis in selected South Asian countries such as Bangladesh, India, Pakistan, Nepal, and Sir Lanka through 1972 to 2017. This paper used CO2 emission as a proxy of environmental degradation measured in metric tons per capita. The GDP per capita (based on constant 2010 US$) is used as the proxy of economic growth. Besides, energy per capita is used to measure non-renewable, while the EKC hypothesis is the measure of the square term of GDP. Similarly, the energy consumption (i.e., non-renewable) proxy is used to measure the percentage of total final energy consumption. Next, to measure globalization's impact on environmental degradation, the globalization index is an important explanatory variable. Furthermore, social globalization index amalgamation, economic and political globalization index are employed for the globalization index. This paper follows the preceding subsequent values to fill the data gaps for the model's mentioned variables.
Environmental pollution and CO2 emission are strongly affected by economic growth and development. The growth-environmental degradation nexus is not a focus of the early stages of economic growth, environmental issues are not sufficiently considered, and advanced technologies have-not been accessible to solve these issues. 30 Consequently, as per capita income increases, the level of environmental degradation also increases. The nexus of CO2 emissions, economic growth and energy sources has been considered significant by numerous researchers. Various explanatory variables are also incorporated in the analysis of the emission, growth and energy consumption nexus, such as trade openness, financial development, population, and other factors. This well-studied topic uses different time period frameworks for different countries, with different methodologies and different controlled variables in various empirical analyses. The findings of these studies conflict with each other and vary according to the country assessed. The tri-variant nexus between CO2 emission, growth and energy has been significantly explored by various researchers.31–47
Empirical results and discussion
The descriptive statistics are essential for explaining the crucial features of the statistical data. The statistical results of descriptive statistics of the explanatory variables are given in Table 1.
The statistical findings of Cross-Sectional Dependence (CSD) are reported in Table 2. To find CSD's presence between the panel data, we have used four tests: Pearson LM Normal, Pearson CD Normal, Breusch-Pagan Chi-square, and Friedman Chi-square. The findings of CSD show that in a panel data analysis, the cross-sectional dependency found between the data and significance of p-values are rejected the null hypothesis. The acceptance of the alternative hypotheses verified the cross-section reliance among these South Asian countries.
The results of the residual cross-section dependence test.
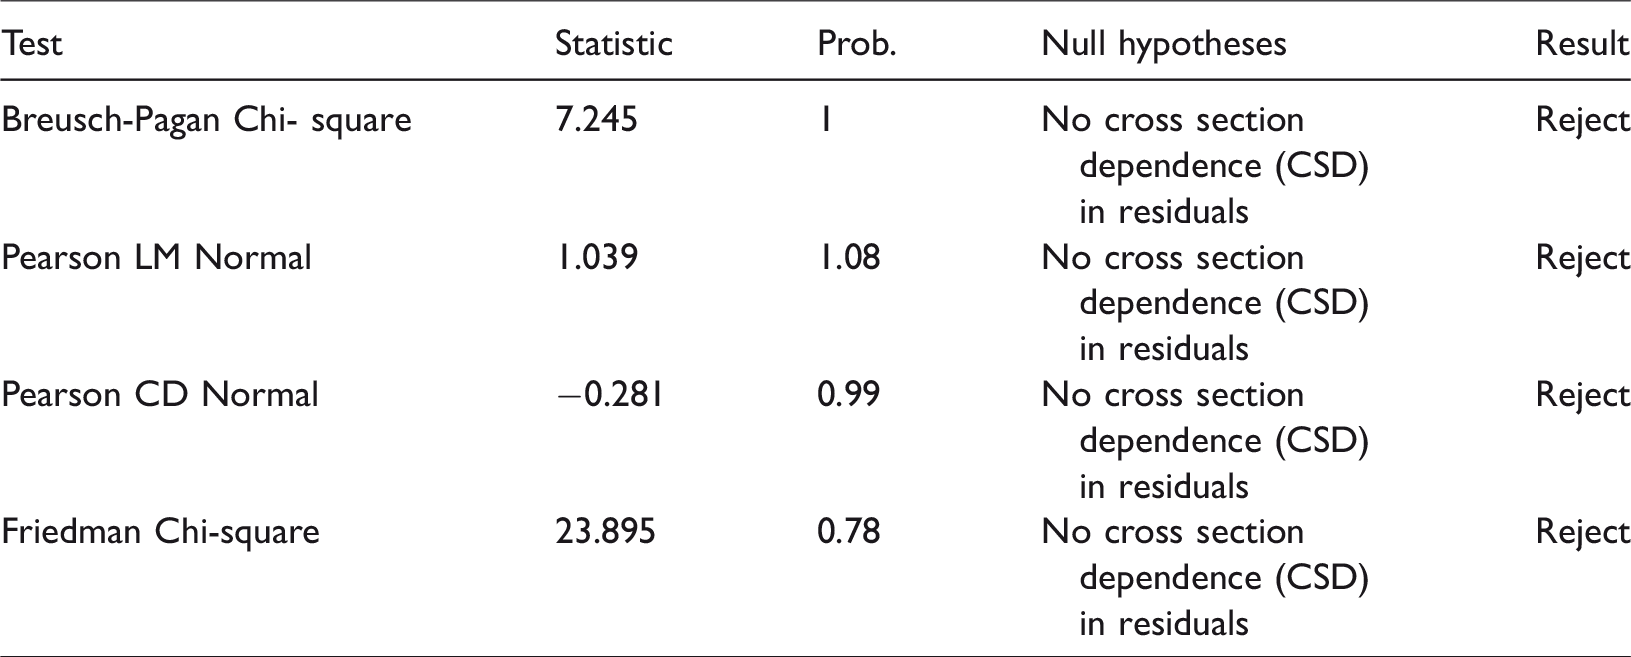
Table 3 reports the unit root result by using the tests of Im et al., 109 Breitung, 106 and Hadri, 107 respectively. The cross-section dependence test can be used to detect the heterogeneity in the panel model. Thus to control the heterogeneity across the panel model, this study used an alternative IPS test designed by Im et al. 109 Table 3 reports the results of the Hadri, 107 Breitung, 106 and Im et al. 109 tests, as all variable found stationary at the level in line with Hadri 107 and Im et al. 109 while some variables are not stationary at the level in line with Breitung 106 test. Also, except for the Breitung 106 test, all the variables are found stationary at the level in line with Im et al. 110 and Hadri 108 tests.
Panel unit root test analysis.
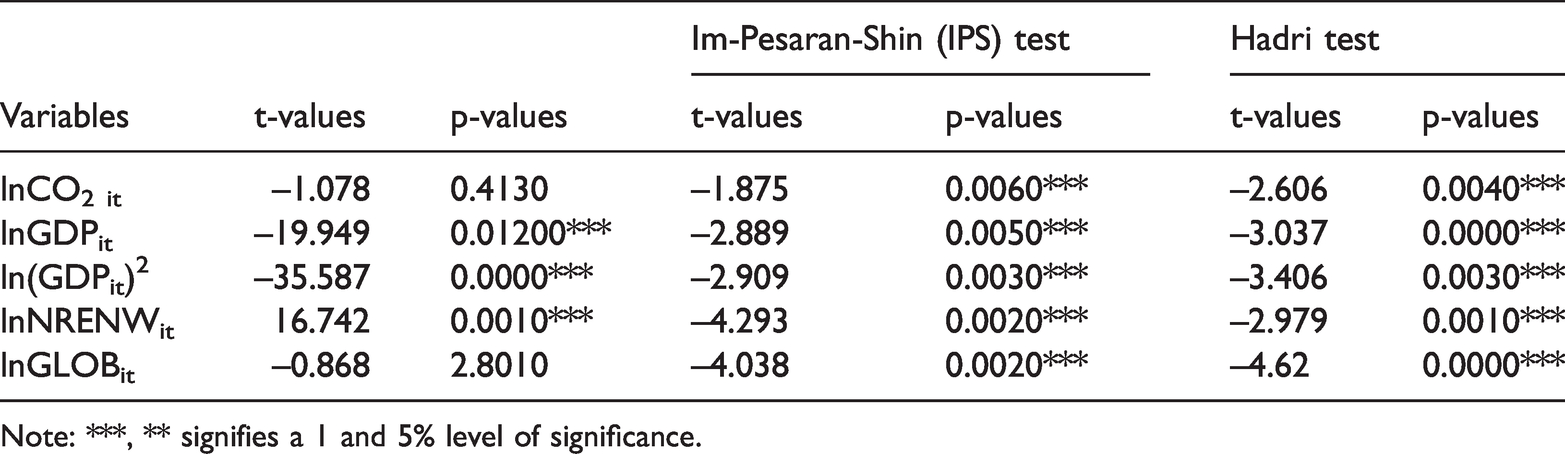
Note: ***, ** signifies a 1 and 5% level of significance.
Different co-integration tests, i.e., Pedroni115–116 and Kao panel co-integration tests and FMOLS, are used in this study. The results of panel v-statistic, panel rho-statistic, panel Phillips–panel ADF-statistic and Perron (PP) (within dimension method) statistic is reported in Table 4. These cointegrated tests are based on “Engle and Granger, 117 where different methods, namely group ADF-test, group PP-statistic and group rho statistic, are also used in this analysis. All the variables are co-integrated according to the findings, and there is a long term association among the variables. According to the results of the Kao t-statistic, the long-term association was found among all these variables. The long-run nexus between CO2 emissions, GDP growth, non-renewable energy, and globalization index in the selected South Asian countries. The studies of Zeshan and Ahmed, 52 Apergis and Ozturk, 18 and Ahmed et al.118–119 are supported the results of this empirical analysis.
The statistical results of the Pedroni and Kao co-integration.

Note: SIC is used to select the lag length criteria. Where *** and ** signify 1 and 5% levels of significance, respectively.
This study investigated growth driven emissions for the South Asian countries under the scheme of the EKC hypothesis. This study's results fully support the inverted EKC hypothesis, and the findings of the study show that growth activities significantly increase GHG emissions. The findings of various previous empirical studies have provided consistent results for the framework of the EKC hypothesis (Zambrano-Monserrate et al., 120 Awad and Abugamos, 121 Keho, 53 Nassani et al., 56 and Rahman 122 and Shahbaz et al. 1 The EKC test for Canada was examined by He and Richard 123 from 1948 to 2004; their findings could not support more for the EKC hypothesis regarding environmental pollution-growth nexus. Ang 32 and Iwata et al. 124 have tested this hypothesis and confirmed the EKC's existence for China and France. Various prior studies of Copel and Taylor, 125 Halicioglu, 126 and Jalil and Mahmud 127 have also used economic growth and environment with trade to identify the EKC hypothesis. The empirical results of Jalil and Mahmud 127 and Ang 128 show that trade significantly increases CO2 emissions for China, Turkey, and Malaysia. The empirical analyses of Shahbaz et al. 129 and Uddin et al. 130 for Indonesia and Sri Lanka, respectively, indicate that economic growth is significantly increasing the level of CO2 emissions by energy consumption. The CO2 emissions-growth relationship fully supported the EKC (inverted U-shaped) in all of the studies mentioned above. An inverted U-shaped EKC curve was found in the context of short and long-term analyses. Consequently, it is concluded that the discussions on energy and growth have driven CO2 emission nexus supporting the positive connection between environmental quality and the use of energy for South Asian countries.
The nexus between CO2 emissions and its three essential components: energy use, globalization, and economic growth, are used in this study. Thus Kao, Pedroni co-integration, and FMOLS tests were used to identify the associations among these variables. The full FMOLS findings indicate that these variables significantly increase environmental degradation in South Asian regions. Moreover, these findings showed that GDP growth, non-renewable energy, and globalization index significantly influence the CO2 emissions in the South Asian regions. Tables 5 and 6 have reported the results of full FMOLS and country specific, respectively.
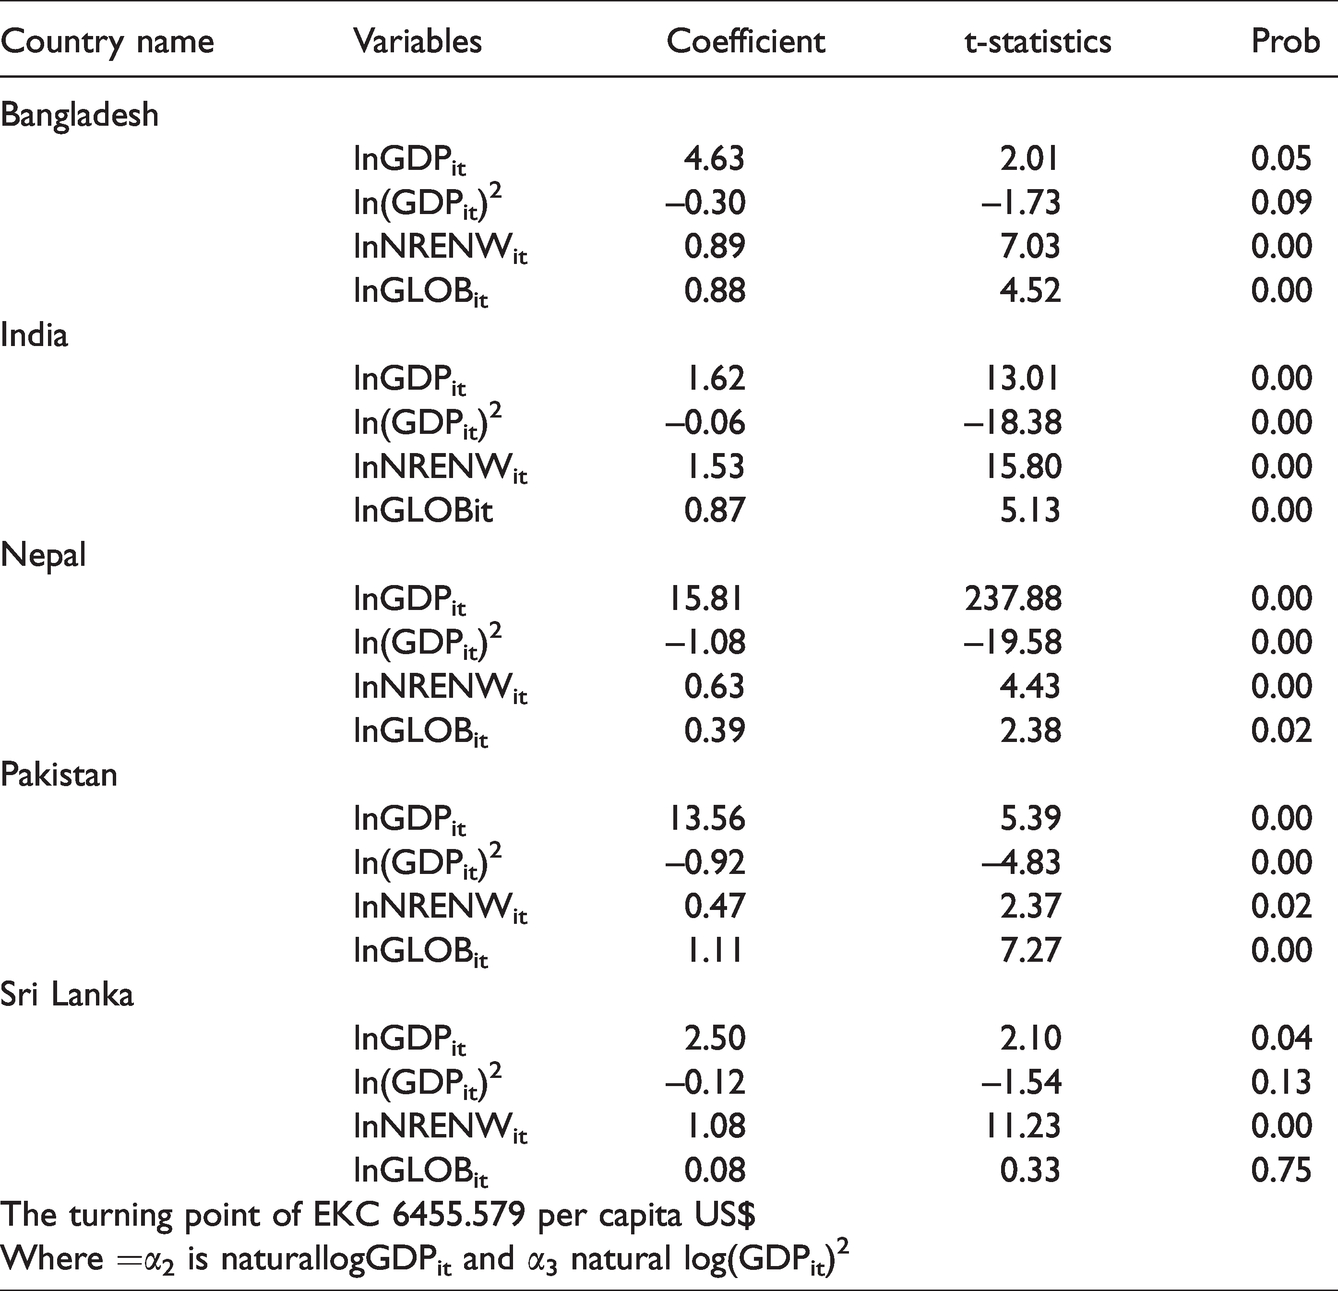
The statistical findings of FMOLS technique (country-specific long-run elasticities).
The statistical findings of FMOLS technique: Full Panel.

The full panel of FMOLS findings in Table 6 indicates that these variables significantly increase South Asian regions' environmental degradation. Furthermore, these economies' empirical results suggest that fossil fuel is substantially increasing the CO2 emissions in this region. Thus, full FMOLS results show that if there is a unit change in non-renewable, it will lead to a 0.84 unit change in CO2 emissions holding all other variables being constant. The findings of Liu and Dietz, 13 Soytas and Sari, 131 Tao et al., 14 Shahbaz et al., 84 Saboori and Sulaiman,132,133 Ahmed et al.,118,119 and Nasreen et al. 22 are supported the results of this study. Furthermore, all these five economies are predominantly involved in emissions-intensive energy consumption, and increased future demand and environmental degradation are anticipated for these economies.
Akbostanci et al.,
134
Jalil and Mahmud,
127
Narayan and Narayan,
50
Jaunky
51
discussed the energy pollution and economic growth (under EKC) nexus besides, Soytas et al.,
34
Ang,32,128 Apergis and Payne,
39
Sadorsky,135,136 Apergis et al.,
137
Hatzigeorgiou et al.,
138
Hamit-Haggar,
139
and similarly Ozcan
140
and Le and Quah
54
also discussed the nexus of energy sources, growth and environmental quality. The positive (+) and negative (–) values of GDP and
Additionally, the FMOLS results for the country specific shows that in Bangladesh, globalization index and non-renewable energy have a significantly positive impact on the GHGs and destroy the environment's level. Similarly, this study's findings support EKC's evidence because the GDP and GDP square values are positive and negative, respectively. Thus, the results of FMOLS show that if there is one unit change in non-renewable and globalization, it will lead to a total of 0.89 and 0.88, respectively, in the unit change in CO2 emissions if all other variables are constant. The findings are supported by the results of Shahbaz et al., 1 Shahbaz et al. 94 Furthermore, results show that the level of CO2 emission significantly increases by.463 if there is a 1% increase in the level of growth, and a 1% increase in GDP square substantially decreases the level of CO2 emission by.030 if there is no change in other variables. For Bangladesh, the GDP growth is the most significant contributing variable in the destruction of the environment. Whereas according to the results of FMOLS, India indicates the use of energy, globalization, and GDP growth rate significantly increases the level of CO2 emissions.
The values of GDP and
This study gives us vital information about future policies and suggestions to government agencies to estimate FMOLS. Thus, this study employed the Dumitrescu-Hurlin test 114 to determine the causal relationship between energy, GDP, GDP square, and globalization. Table 7 reported the statistical results of the Dumitrescu-Hurlin test (Granger causality test). The bidirectional causality is moving from energy use to GDP. The uni-directional causality is running from CO2 to GDP, GDP2 to CO2, GDP to Globalization, GDP2 to Globalization, non-renewable to Globalization, and non-renewable to GDP2.
Panel causality Dumitrescu-Hurlin test (full panel).

The findings of VDM are reported in Table 8 in the context of selected South Asian countries. The change in a variable due to its contribution through various exogenous variables and innovative shock can be accounted for by this method. Furthermore, regarding CO2 emission between 1972 and 2015, the significant endogenous contribution of CO2 is 49.73 percent due to innovative shock. These results reveal that in the Asian region, the (GDPit) sources of energy and globalization were dominant elements for CO2 emission. The findings of VDM are consistent with the regression analysis findings, and for the next ten years, all these variables are included in the proposed framework. The graphical representation of the “impulse response function (IRF)” illustrated in Figure 1 explains that when the shock is given to one variable, then the other factor's response. The lower and upper bounds values can show the one standard deviation’s values. The graphical analysis of the impulse reaction function represents the variable and their response, respectively. The reaction of CO2 emission to energy consumption is positive, which shows that energy increases the level of environmental degradation. Globalization, growth, and CO2 emission are positively related to each other in an increasing trend. The response of CO2 emission to energy use is positive initially, reaching a steady state beyond the 9th period of the sample. The role of growth rate and the GDP square toward emission of CO2 are positively reaching a constant state throughout the sample.
The results of the Variance Error Decomposition forecast model.

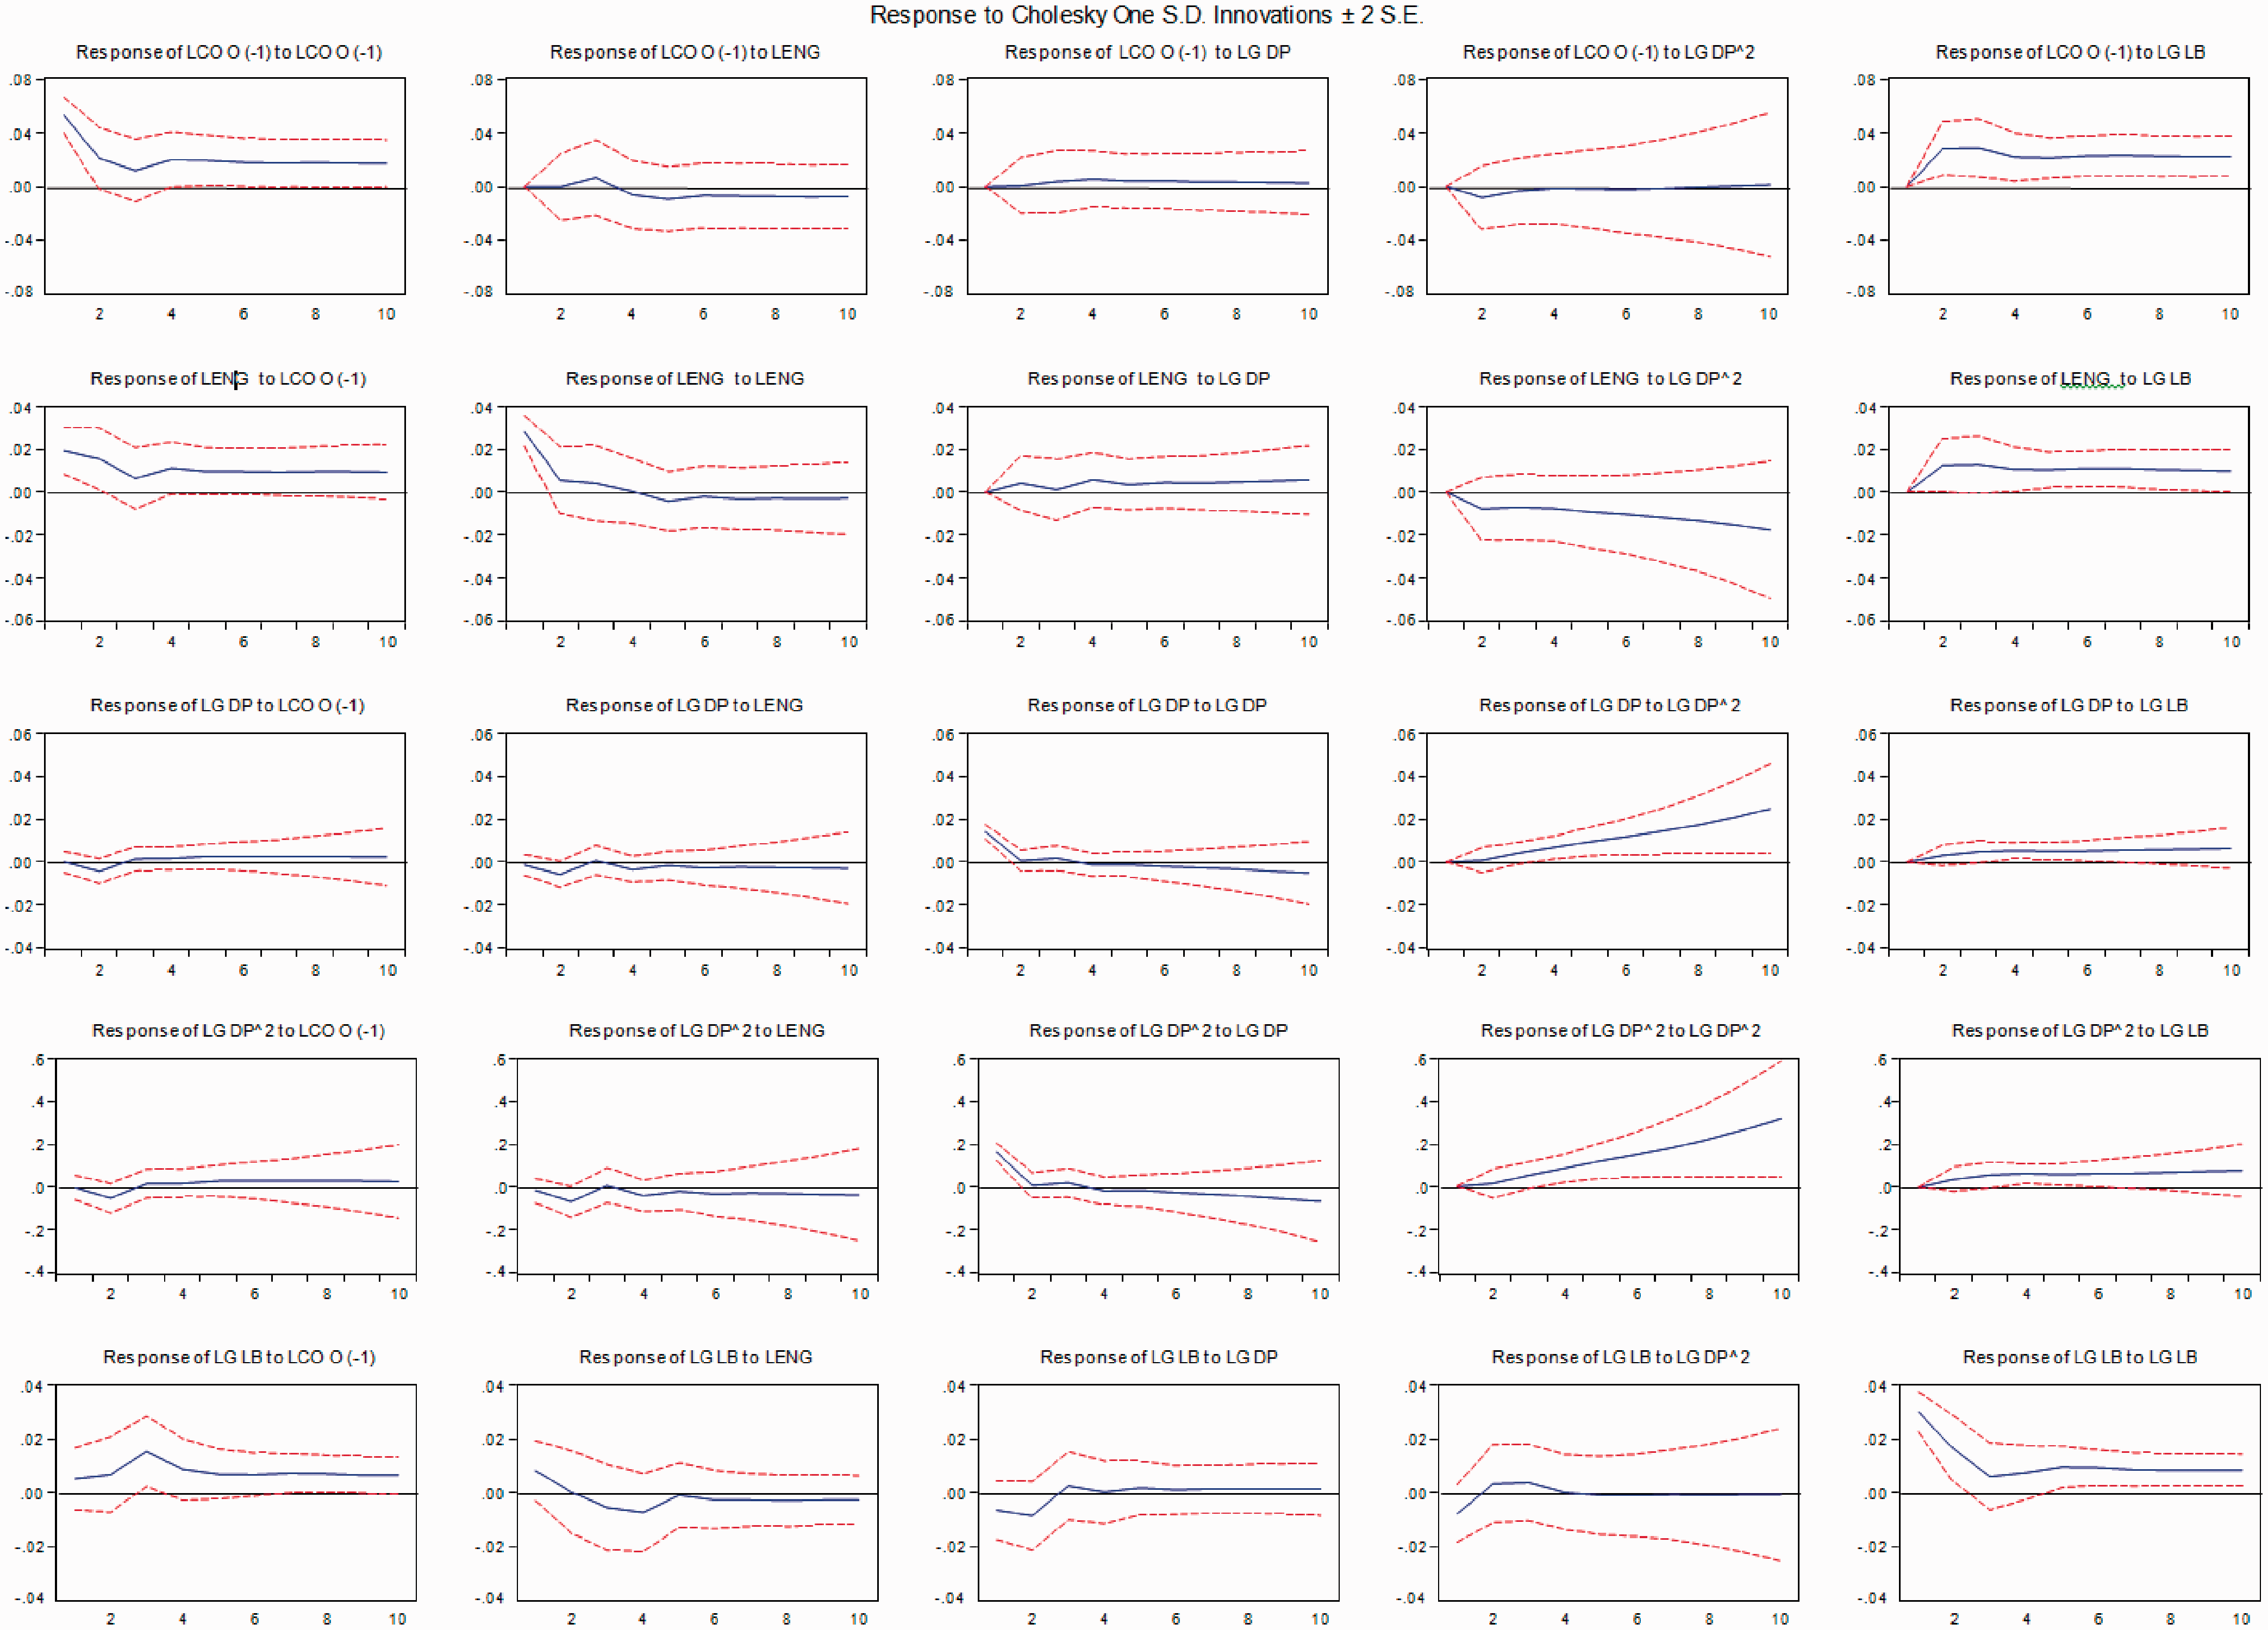
Impulse response function.
Discussion of analysis and EKC
This study try to examine the relationship between energy, environment, growth, and other variables under the premises of the EKC framework to evaluate an inverted U-shaped relationship between energy, growth and globalization with CO2 emissions in a panel of selected South Asia countries. Thus Kao, Pedroni co-integration and FMOLS tests were used to identify the associations among these variables. The full FMOLS findings indicate that these variables significantly increase environmental degradation in South Asian regions. Moreover, these findings showed that GDP growth, non- renewable energy and globalization index significantly influence the CO2 emissions in the South Asian regions. The full panel of FMOLS findings that these variables significantly increase environmental degradation in South Asian regions. Furthermore, the empirical results for these economies suggest that fossil fuel is substantially increasing the CO2 emissions in this region. This study gives us vital information about future policies and suggestions to government agencies with the estimation of FMOLS. Various econometrics techniques in this study such as heterogeneous co-integrated panels also included unit root tests (panel), the Kao and Pedroni panel co-integration test, the test of Fully Modified OLS (FMOLS), and the Innovative Accounting Approach. This study also employed Dumitrescu-Hurlin test 114 to find out the causal relationship between energy, GDP, GDP square and globalization.
The empirical studies of Velthuijsen and Worrell, 141 Shi, 142 Acaravci and Ozturk, 90 Saleem et al., 143 Tugcu et al., 88 Mensah, 89 Apergis and Ozturk, 18 Al-Mulali et al, 91 Muhammad et al., 144 and Jebli et al. 92 have included various additional explanatory variables in assessments of economic growth and GHG emissions under the premises of the EKC hypothesis. These studies included energy efficiency, energy dependency and economic structure as the control variables with economic growth to observe the growth-environment relationship under the EKC hypothesis. Their results show that economic growth activities significantly increase GHG emissions. Lise 93 have also tested this hypothesis for Turkey and India and have not found any relationship between growth and CO2 emission. The results of Robalino-Lopez et al., 87 using time series techniques,do not support the EKC hypothesis for Venezuela and Ecuador.
The link between growth and environmental pollution has been well defined by Grossman and Krueger 70 in their analysis indicating that as per capita income increases SO2 also increases, but it decreases with increases in the per capita income after a certain point. Subsequently, Shafik and Bandyopadhyay 145 examined the GDP growth driven environmental pollution nexus and confirmed the presence of the inverted U-shaped EKC. Panayotou 64 first defined the indicators of the environmental pollution and GDP growth nexus in the presence of the EKC. In recent years, various researchers have found that non-renewable energy is the main source of environmental degradation. Environmental pollution can be increased through combustion of fossil fuels. Economic growth and non-renewable energy driven carbon emissions are well studied in the existing literature, e.g., Apergis and Payne 38 and Jalil and Mahmud 127 for Central America and China, respectively; Nasir and Rehman 146 for Pakistan; Kanjilal and Ghosh 147 and Shahbaz et al. 148 for Tunisia; Seker et al. 149 for Turkey; Javid and Sharif 150 and Ahmad et al. 151 for India and Rafindadi 152 for China and Japan.
The study based on the Innovation Accounting Approach (IAA), which consists of two methods including the “Variance Decomposition Method” (VDM) and the “Impulse Response Function” (IRF). The response of carbon emission to impulses of time series variables can be modeled by a Impulse Response Function” (IRF) model. The “Impulse Response Function” (IRF) method is used to predict the interactions among all above-mentioned variables over a period of time. In other words, the impulse response function is used to determine the associations among the study variables. If shocks are given to a specific variable, then the IRF technique shows the magnitude of the correlation between the selected variables beyond the specified time period, which identifies the response of one variable when a shock is given to another variable. The results illustrate the response of CO2 emission when one SD shock is given to the other explanatory variables. The overall statistical results from IRF indicate that growth, non-renewable energy consumption and globalization vary if shock is given to the carbon emission variable. They also show that non-renewable energy use is the dominant resource in this region for GDP growth and found also that globalisation spur CO2 emission in this region. The overall findings of the IRF showed that the sources of energy consumption, economic growth, CO2 emission and globalizations should be included in the projected framework for the next 10 years. We used Innovation Accounting Approach (IAA), and Impulse Response Function is the part of IAA approach. Whereas, Yihdego and Webb 153 used transfer function-noise (TFN) model for IRF, our study based on IRF based on IAA with graphical representation. Graphical illustration of our study based on IRF is revised and interpretation of the results according to IAA approach in detail.
Conclusion
This analysis utilizes these theoretical aspects and assesses economic growth, energy use, and globalization and affluence within the environmental Kuznets curve analysis framework. The long-run association between CO2 emissions, real GDP growth, the square of GDP growth, energy sources, and globalization in selected South Asian economies from 1972 to 2017. Various econometrics techniques in this study, such as heterogeneous co-integrated panels, also included unit root tests (panel), the Kao and Pedroni panel co-integration test, the test of Fully Modified OLS (FMOLS), the Dumitrescu-Hurlin test, and the Innovative Accounting Approach. The full panel of FMOLS findings shows that these variables significantly increase environmental degradation in South Asian regions. Furthermore, the empirical results for these economies indicate that fossil fuel and energy use are substantially increasing the CO2 emissions and resulting in GHG issues in this region. These South Asian countries are facing severe environmental degradation challenges. Moreover, these findings showed that GDP growth, non-renewable energy, and globalization index significantly influence the environment's quality in the south Asian region. The full FMOLS findings indicate that these variables significantly increase environmental degradation in the South Asian region. The country-specific FMOLS test findings are also consistent with the full FMOLS results because in the south Asian countries, the key determinants of CO2 emission are GDP growth, energy consumption, and globalization.
Moreover, to detect the growth-environment association, the EKC frame was used. Moreover, this study examines the globalization, growth-energy relationship, which sheds light on the emission relationship in the South Asian economies background. A variety of studies have noted that economic growth and CO2 emissions are highly associated with each other according to the EKC framework but several studies do not support the growth-induced CO2 emissions hypothesis. This study has fully supported the existence of the EKC hypothesis in this selected South Asian region. The conflict between globalization and environmental degradation can revisit by sustainable development policies. Additionally, massive dependence on fossil fuel energy consumption is not environmentally friendly to this South Asian region's sustainable development. However, these countries under the “South Asian Association of Regional Cooperation” (SAARC) block can overcome environmental degradation through global cooperation. Policies for environment friendly energy use can significantly control the emissions and increase GDP growth. In contrast, the expansion of globalization increases energy use.
The study recommends policy implications in terms of vital initiatives to control CO2 emissions and regional integration to control environmental degradation in this region. To improve environmental quality from an energy policy standpoint, policymakers should focus on clean energy policies. Improving energy efficiency, investing in renewable resources, boosting the utilization of cleaner energy sources, and decreasing energy intensity are the main options to mitigate carbon emission.
Footnotes
Declaration of conflicting interests
The author(s) declared no potential conflicts of interest with respect to the research, authorship, and/or publication of this article.
Funding
The author(s) received no financial support for the research, authorship, and/or publication of this article.