



Abstract
The escalation in demand for textile products increased the use of fresh water and treatment of wastewater; which escalates the search for suitable and energy-efficient technology for wastewater treatment. Solar assisted technology (i.e. solar desalination) for the textile industry wastewater treatment is proved to be an affordable technology. The only drawback of solar desalination is its low productivity which is the major hindrance in the global acceptance of the system. In the present study, an ingenious improvement in form of a parabolic concentrator-based solar desalination system (PCB-SDS) is designed to overcome low productivity, and the simultaneous use of source textile industry wastewater for its treatment makes this study more realistic. The performance of the designed system was examined for three different brine depths i.e. 20%, 40%, and 60% for two different processing step i.e. Dyeing and Degumming. System performance was evaluated in terms of energetic, exergetic, pollutant removal, and economic analysis. The maximum output of the system was found to be around 7440 and 8330 mL/day on clear sunny days with textile dyeing wastewater (TDyWW) and textile degumming wastewater (TDgWW) at 60% depth respectively. Daily average energy and exergy efficiency of system varies in the range 39.8–51.9 and 3.6–4.8% respectively. The degumming wastewater shows 85% COD removal, whereas, around 90% of TDS and hardness removal was also recorded. The dyeing processed wastewater showed 80% COD removal efficiency, ≅90% TDS, and hardness removal. The cost per liter of distillate output produced from designed PCB-SDS was found to be 0.014 $/L.
Keywords
Introduction
Energy and drinking water are two of the major requirements on this earth. Energy demand will increase two to three folds till 2050 due to rising global population and expansion in developing economics. 1 Therefore, to overcome this issue Nelson 2 suggested exploring all possible methods of energy production and deals with climate and natural resource problems. The other very important challenge which world is facing today is freshwater demand.3,4 By the year 2025, it is expected that around one third of the world’s population will face a severe shortage of freshwater water supply and the rest will face a vital requirement of freshwater. Industries are one of the major consumers and producers of freshwater and wastewater, respectively.
Textile industry is one of the major industries, which consumes a huge amount of water and produces a very bulky and polluted type of wastewater to the surroundings.5,6 Due to decreasing water bodies, water level, and besides legislation overuse of water in the industry increases the demand of reuse. The demand of low energy-intensive treatment technology is required to solve the problem forindustrial wastewater. Although a number of physical, chemical, biological, solar, and hybrid treatment processes have been cited in various literature with economic and efficient ways,7–11 a most efficient technology is still being eyed.
Therefore, to decrease the requirement of energy consumption for textile industry wastewater treatment and fulfill the requirement of freshwater; solar energy can be a possible and trusted option in the future. Different solar energy treatment options for wastewater treatment are electrolysis, 12 photo-catalysis, 13 microbial desalination, 14 advanced oxidation process 9 and desalination.15,16 Beside other technologies, solar desalination can prove to be most cost-effective, efficient and promising for the treatment of wastewater for freshwater generation with fewer contaminants.
Solar desalination technology is utilized in the recovery of pure water from saline water but there was very few works reported till date on the use of solar desalination in industrial sector wastewater treatment. Al-Othman 17 with his co-authors tried to stimulate fulfillment of energy requirements of multistage flash driven desalination system through parabolic trough collector. The results revealed that use of two parabolic trough collectors with total area of 3160 m2 can fulfill 76% of total energy demand and the rest can be completely fulfilled with solar pond. The aim of their study was to produce 1800 m3/day of distillate. Hence, it can be concluded that desalination can be a future for industrial wastewater treatment plant.
Asadi et al. 18 conducted a study on the treatment of wastewater (sanitary and palm oil mill). The reduction in chemical oxygen demand (COD) and heterotrophic plate count (HPC) was reported to be 86.83% and 86.75% respectively. In the same manner, sludge based wastewater was passed through laboratory designed solar still The reduction in COD was observed from 4052 to 9 mg/L on first and 11847 to 566 mg/L on the fifth day of experiment. 19
Baalbaki et al. 20 uses solar still as an affordable water treatment method for pharmaceutical industry. High rate of degradation of ampicillin (AMP), naproxen (NPX), and carbamazepine (CBZ) was observed beyond threshold temperature. Ibuprofen (IBU), CBZ, and NPX require both temperature and sunlight to degrade effectively. But, till date utilization of textile industry wastewater for treatment with solar desalination technology is not cited as per author’s knowledge.
The main objective of this study was to examine the possibility of using designed solar parabolic concentrator based desalination technologyfor the processing of textile industry wastewater in place of saline water make this study more novel and applicable. However, the treatment of industrial wastewater that has both organic and inorganic pollutants is a major challenge. In fact, the presence of minerals and salinity disrupts biological treatment processes. The proposed method is perhaps one of the most appropriate methods for managing such wastewater.The experimental analysis was carried out during summer with three distinct brine depths which was set according to the size of basin/absorber i.e. 20%, 40% and 60%. The tests were conducted during month of May 2019 in Katra (J&K), India. A comparison between treatment efficiency, distillate output productivity with energy and exergy efficiency for the designed system is judiciously presented with economic analysis.
Hence, here in this article integration of solar desalination for textile industry wastewater treatment is proposed; which is solution for both energy and freshwater demand. This technology is totally dependent on renewable energy i.e. solar and will prove to be effective technology in future.
Experimental setup and procedure
This section is divided in four subsections: detailed designing, construction and instrumentation, experimental procedure and uncertainty propagation. In the next section, detailed design, construction and instrumentation have been discussed. The discussion on detailed experimental procedure of experimental investigation is presented through the Experimental procedure section. In the last subsection, uncertainty in measuring instrument and performance parameters has been discussed in the last section i.e. the Uncertainty propagation section.
Solar desalination system design, construction and instrumentation
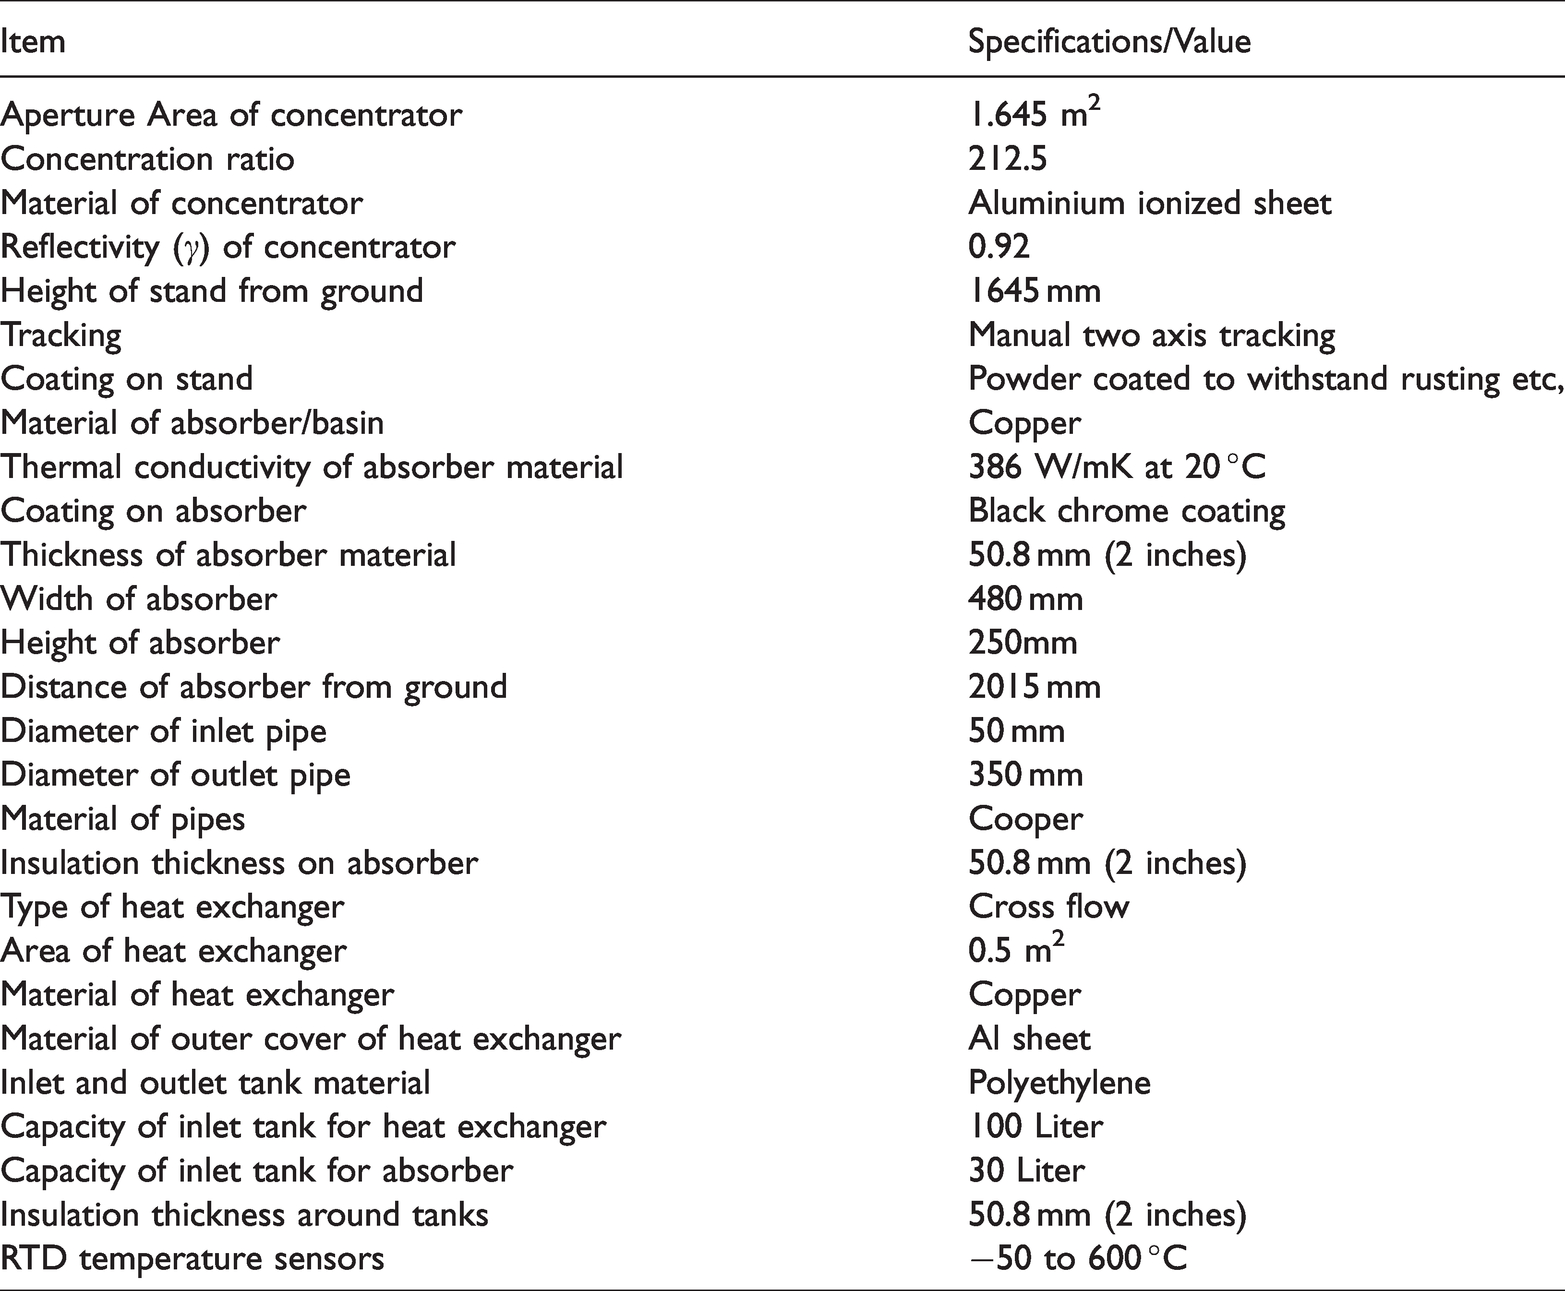
The experimental investigation of the system has been carried out at Katra (Shri Mata Vaishno Devi University,), (J&K) India (Latitude 32.9915°N,Longitude 74.9318°E). The schematic diagram/layout design of parabolic collector based solar desalination system (PCB-SDS) is shown through Figure 1. The parabolic collector was manually adjusted to two axis mode one from east to west and other from north to south. The collector was rotated every hour at 4° from east to west since 0600 hrs in the morning to 1900 hrs till late evening. The absorber is used to grab all reflected solar radiation from the reflector. Absorber was fixed at focal point of the parabolic collector, painted with black colour to absorb maximum amount of solar radiation incident on the surface. To remove the heat losses all sides of absorber except from bottom was insulated with rock wool of 50.8 mm (2 inches) thickness. The collected steam is transferred to heat exchanger through proper channel where the water vapour get condensed and collected for further use. Table 1 illustrate the designed parameters of the PCB-SDS.
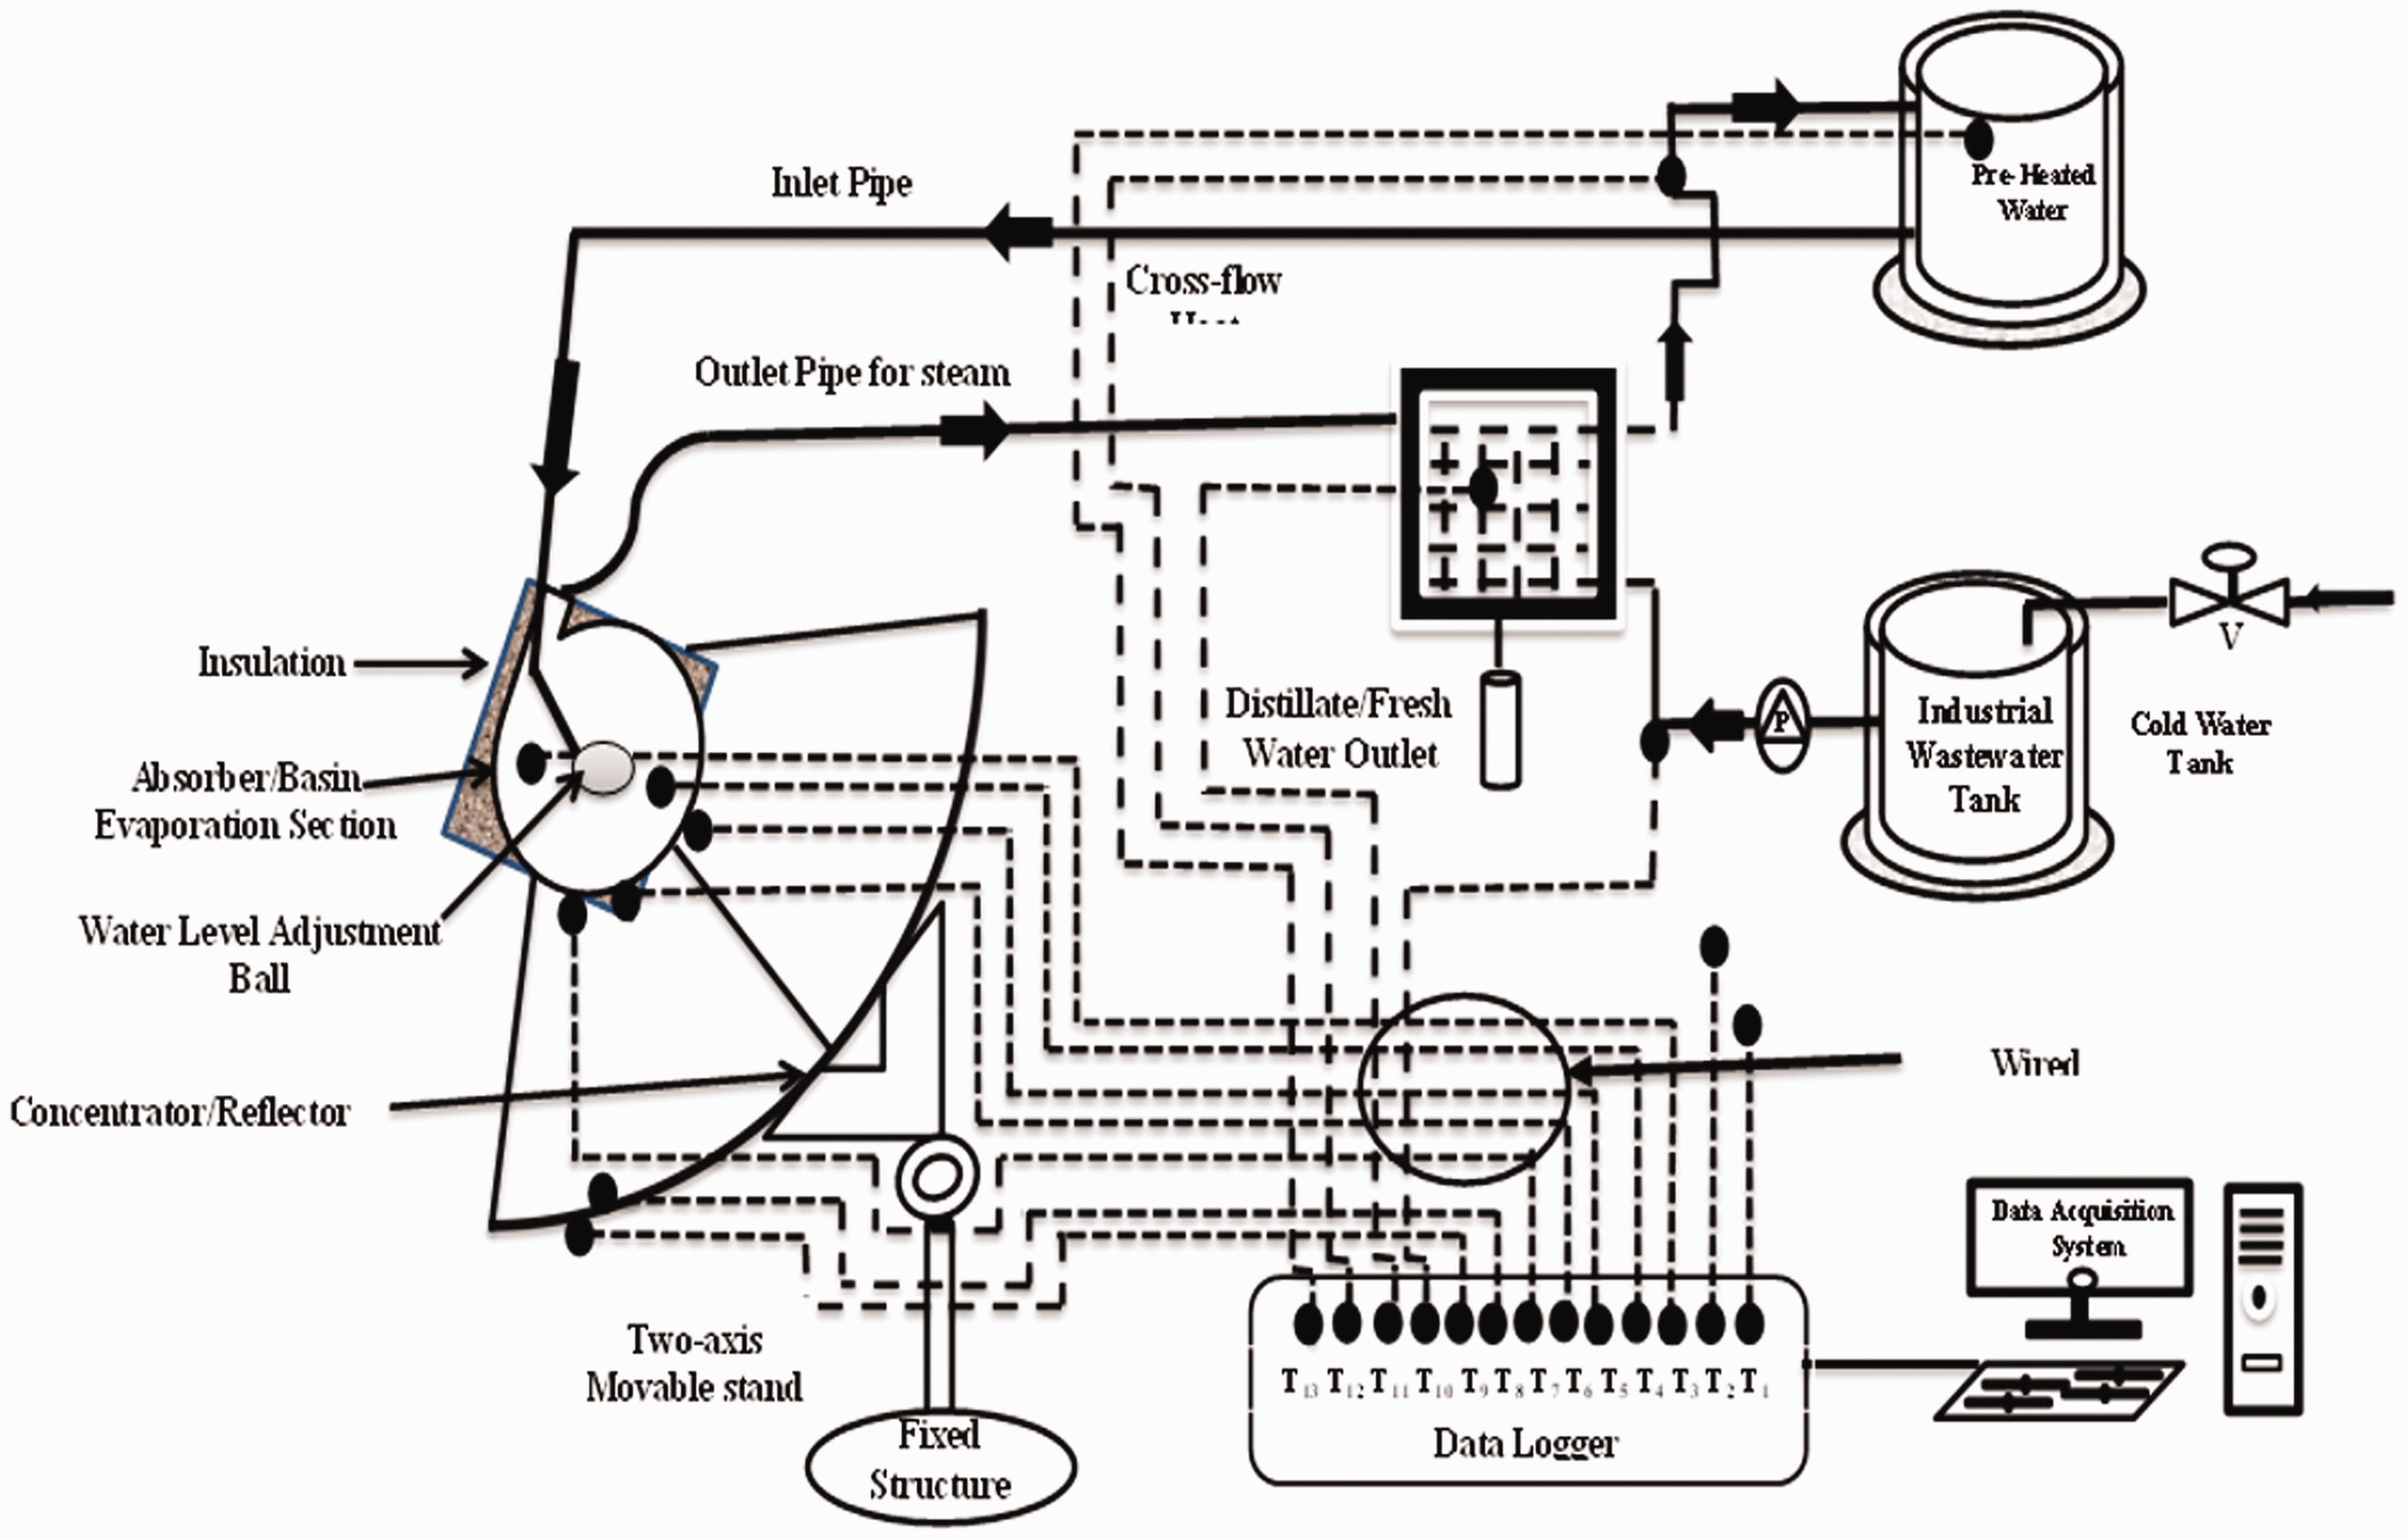
Schematic view of experimental setup.
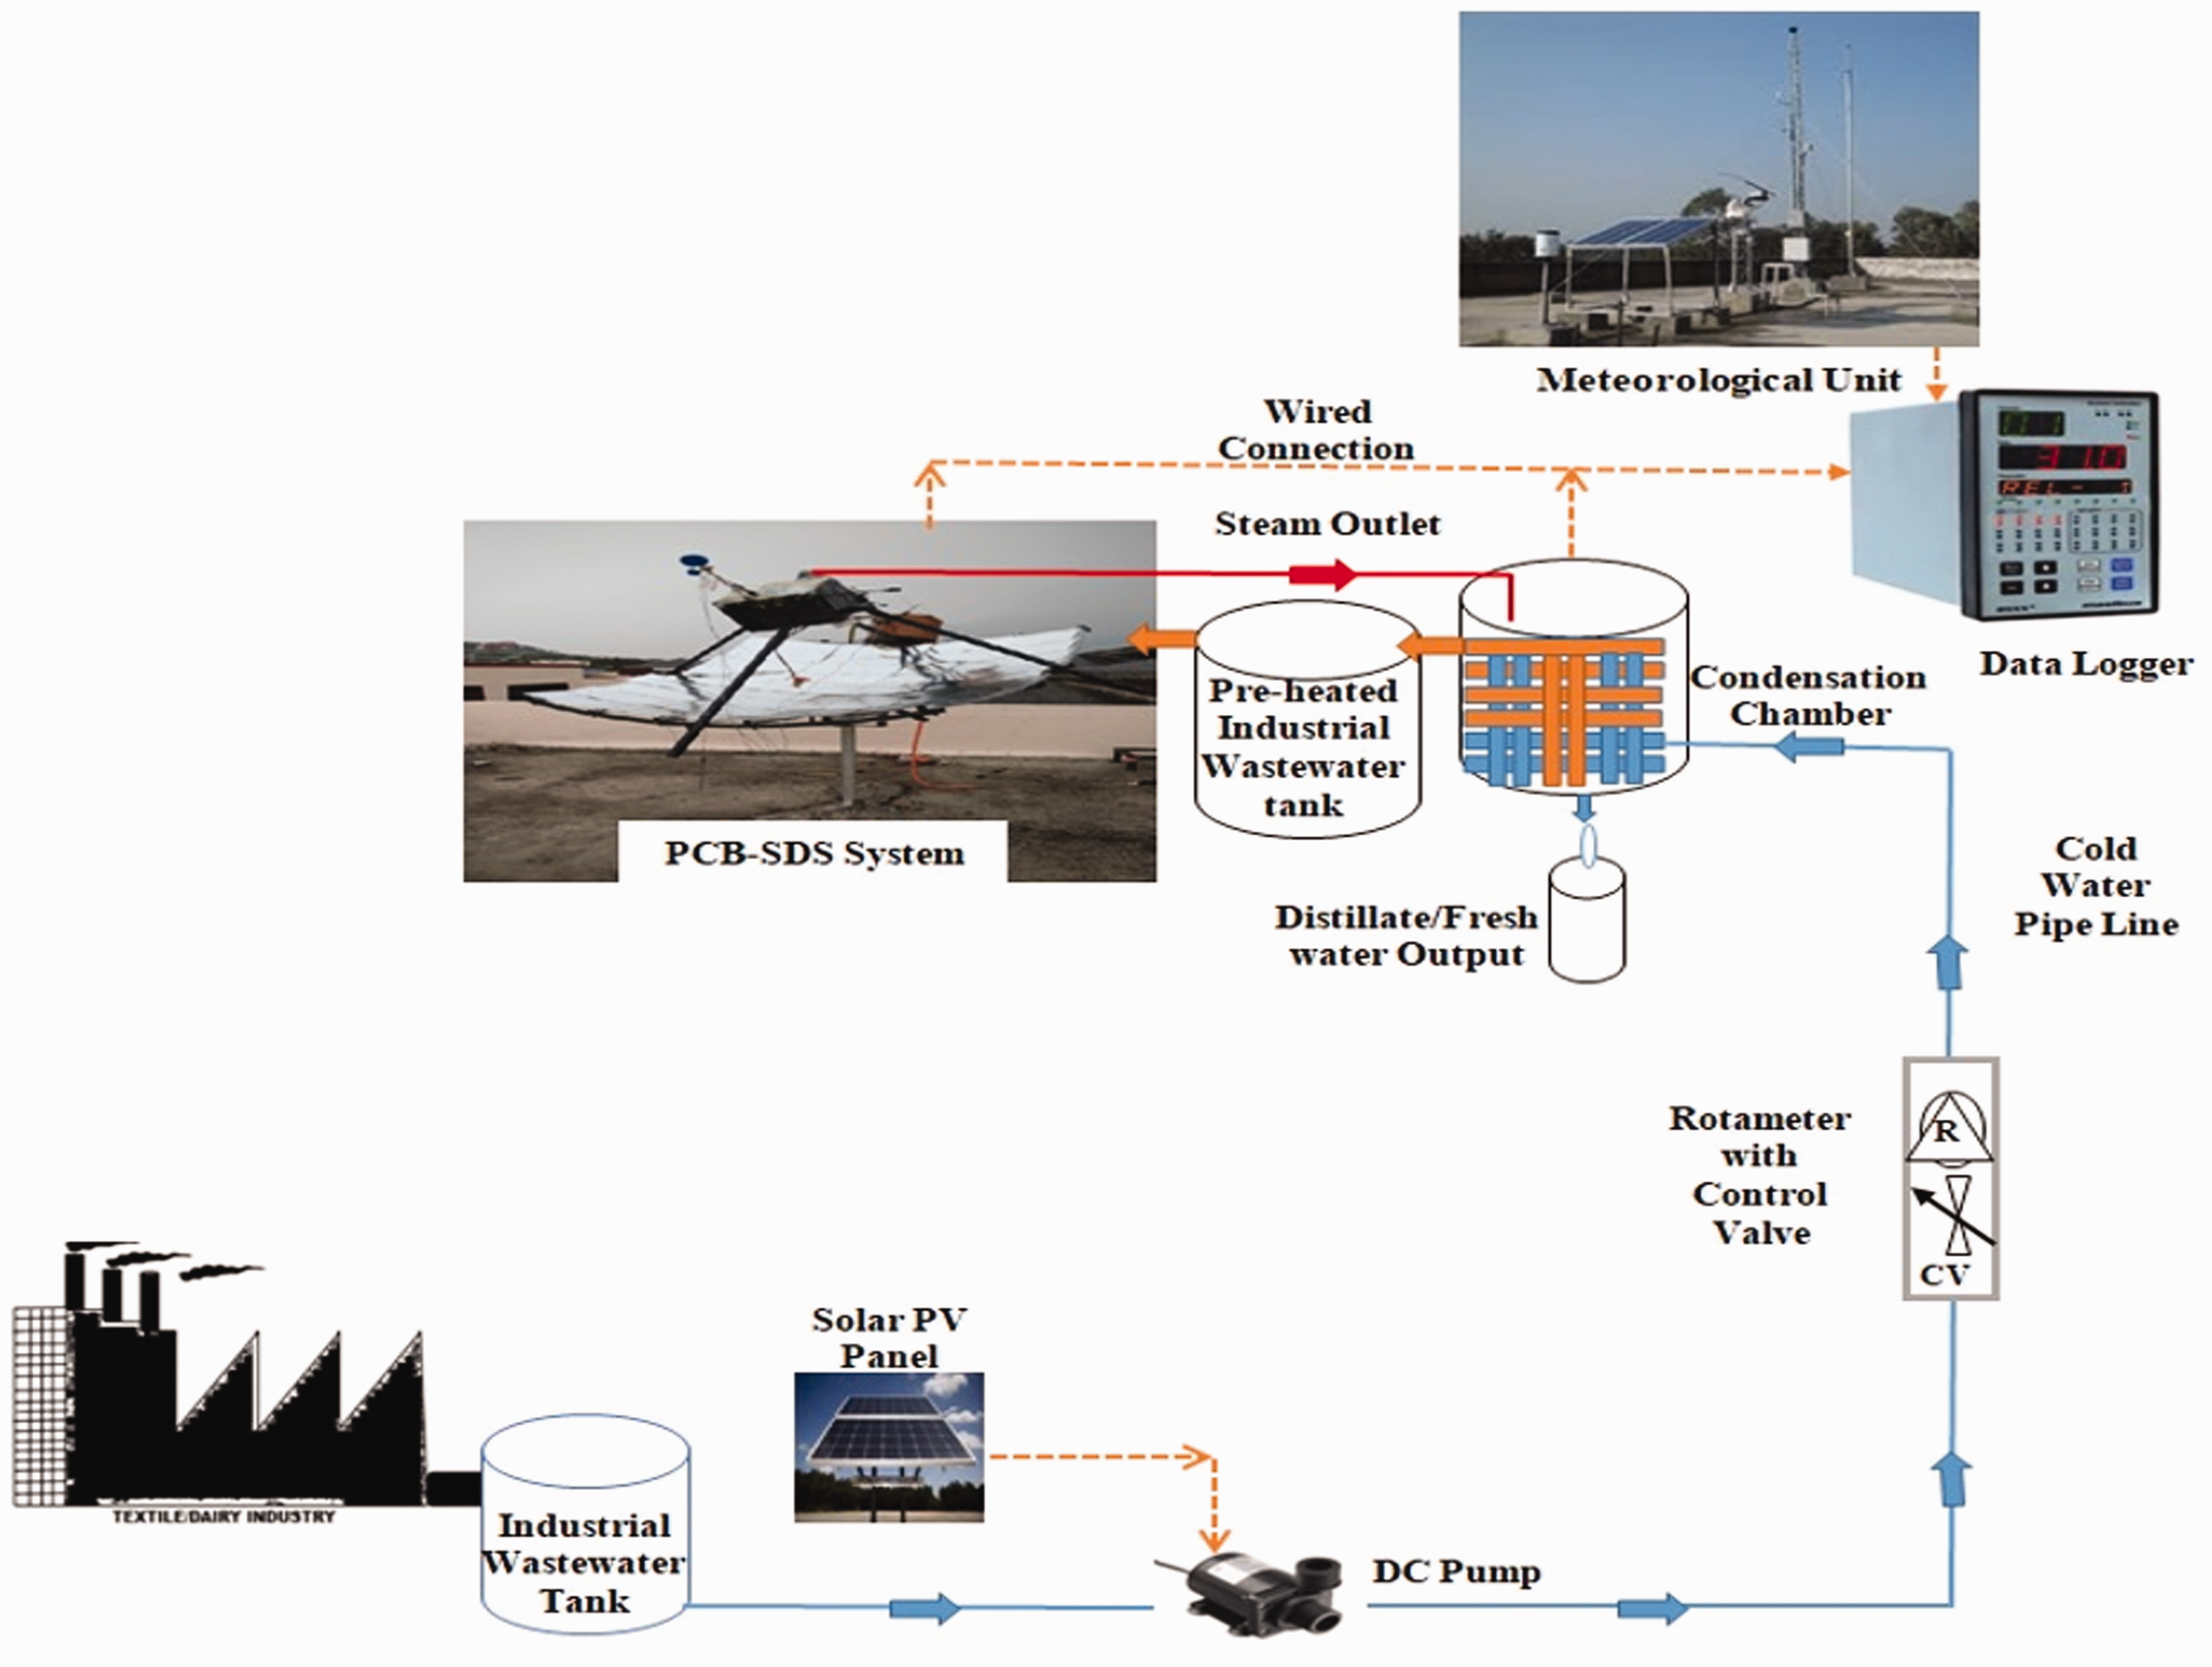
Experimental rig arrangement.
Design specification and dimensions of PCB-SDS system.
The schematic view of the designed investigational system is shown through Figure 1. The arrangement of different components used in experimental are shown through Figure 2.
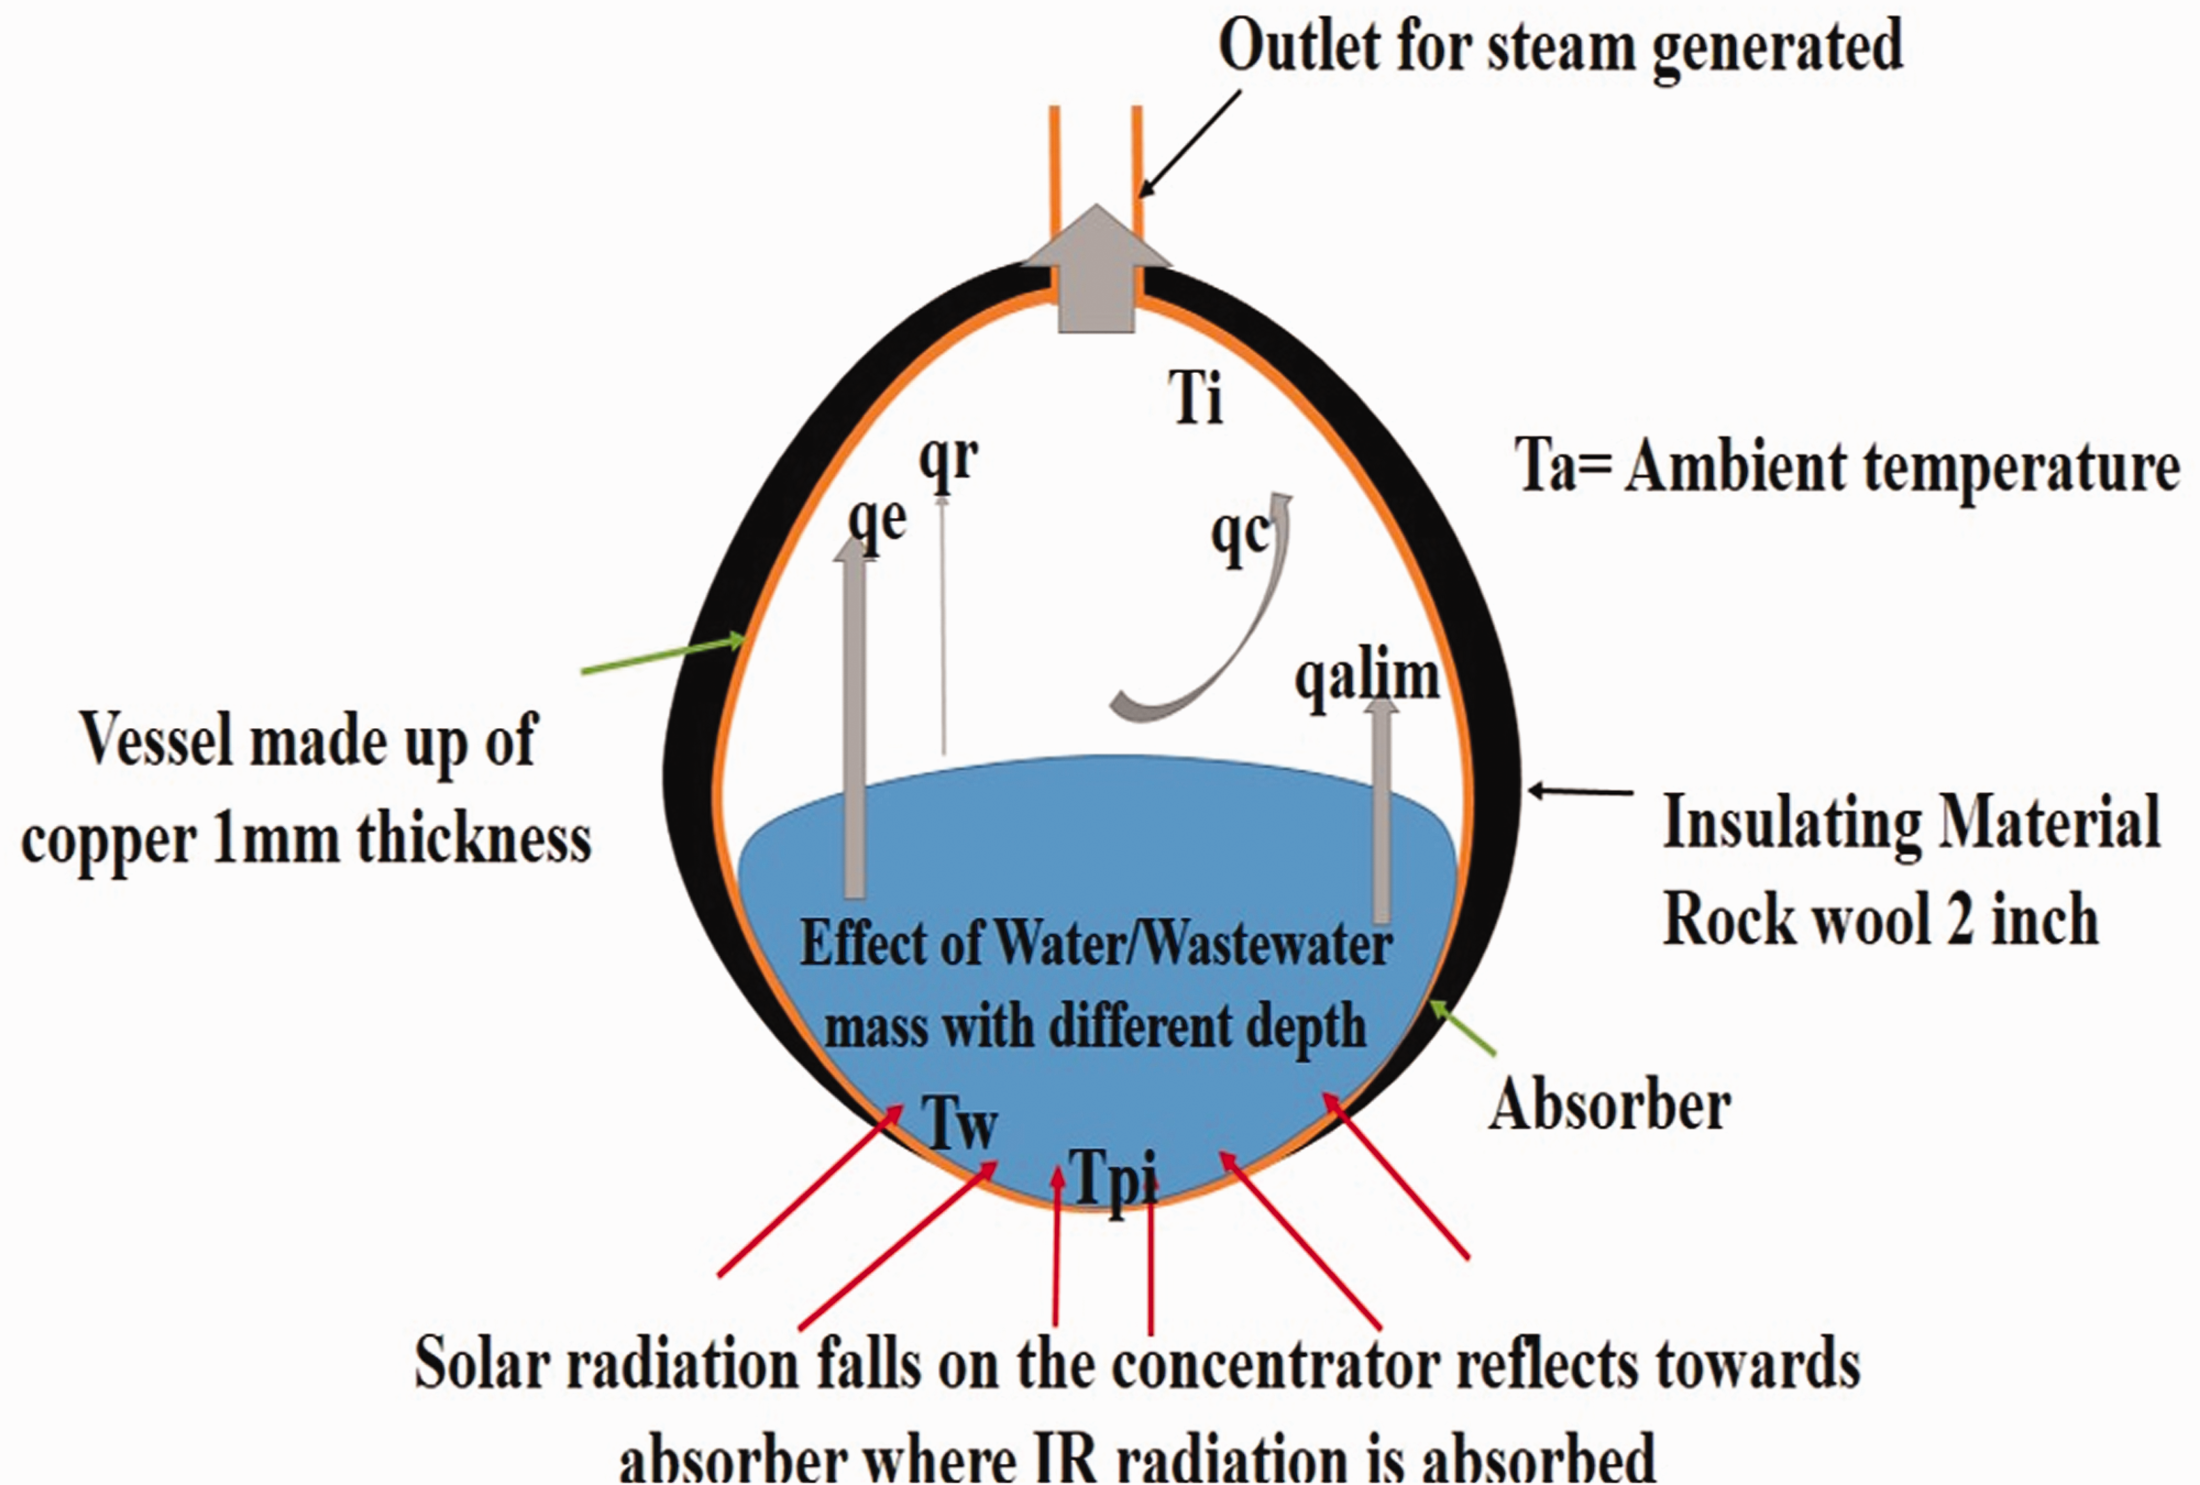
Energy balance inside the absorber used for the system.
The temperature values at different state points of the system were recorded. The position of temperature sensors at various points of system can be well understood through Figure 1. T1 measures ambient temperature, Temperature sensor T2 measures wet bulb temperature, Temperature sensor T3 and T4 measures the water temperature of the basin (absorber), Temperature sensor T5 measures the lower surface temperature of the absorber, Temperature sensor T6 and T7 measures the temperature difference or losses from outer surface of the absorber and after insulation to the surrounding respectively, whereas, Temperature sensor T8 and T9 measures the temperature difference of reflective surface from front and back. All temperature measurements were logged in Masibus 85xx + 24 channel data logger after every minute. The solar radiation, wind velocity and other environmental parameters were taken from SRRA station (QC V1.2 2014–3) installed at University campus.
Experimental procedure
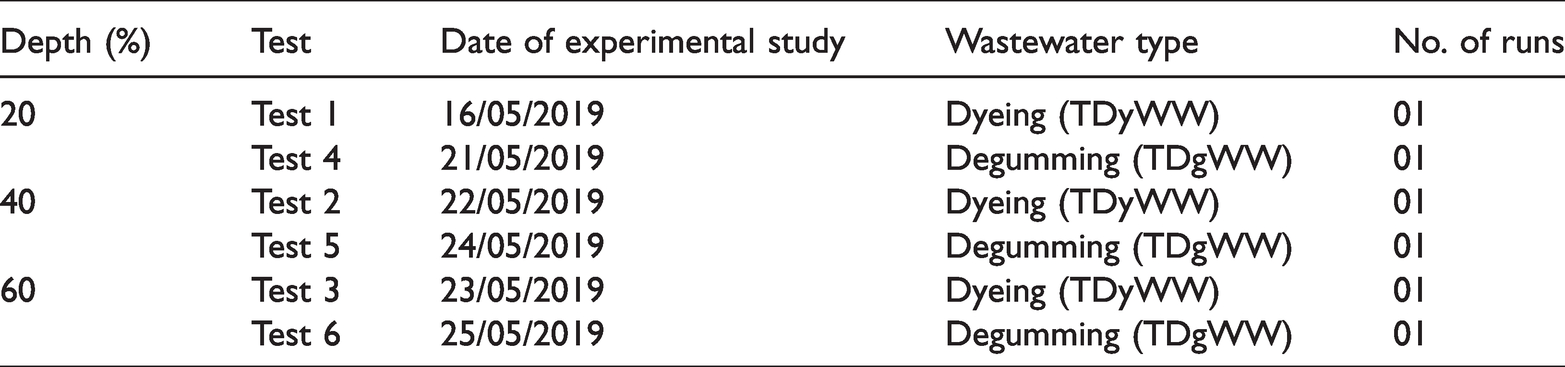
In this study, wastewater after two processing steps was taken from textile industry namely dyeing (TDyWW) and degumming (TDgWW) with three depths (20%, 40% and 60%) in the constructed PCB-SDS. Six cases of solar still are tested: (test-1) TDyWW was taken with 20% depth, (test-2) TIDyWW was considered with 40% depth while (test-3) comprises of TDyWW with 60% depth. And, test-4: absorber/basin was filled with TDgWW with 20% depth, test-5: TDgWW with 40% depth and test-6: TDgWW with 60% depth was considered. Table 2 summarizes the detailed experimental setup for each test.
Experimentation details.
Below detailed experimental procedure was carried out:-
At the start of every experimental measurements, the experiment setup was cleaned, all measuring instruments checked, wastewater was filled inside an inlet tank, heat exchanger was cleaned properly, absorber and pipes was cleaned with water from back pressure so that no impurities remain present inside the system which will impact the environmental pollutant parameters, insulation was checked. Parabolic trough collector was manually tracked every hour and adjusted accordingly in two axis path. During every measurement, it was ensured that data was collected at the same time and data logger is logging the measured values SRRA records solar data, ambient temperature, and wind velocity. The distillate output is collected and measured carefully through measuring cylinder and recorded; and analysis of distillate output was done for pollutant removal. Each time when reading was logged step 2, 3 and 4 is repeated. Different environmental pollutant parameters are analysed in the experimental laboratory at the end of every day.
Uncertainty propagation
In this section uncertainties arising during the experimental procedure are studied. Some of these values are obtained from instrument supplier and instrument data sheet. In most of the cases, an essential quantity that cannot be directly evaluated is rather determined as a function of variables that are measured directly i.e.
It is assumed that the calculated parameters were mainly dependent on the recorded (measured) value. The instrument utilized for recording of temperature wereMasibus 85xx + data logger with temperature sensors (RTD) type (range −50 – 600 °C) with maximum uncertainty of ±1.2 °C and accuracy of ± 0.10 °C. SRRA station was utilized for recording and collection of solar radiation data with maximum uncertainty of ≤10 W/m2. Measuring flask was calibrated based on a standard during the experiments and output results stated in this work consider the calibration result data. Based on the above equation the uncertainty of the energy and exergy efficiency varies in the range of ±1.5–2.1% and 0.3–08% respectively.
Selection, collection and characterization of industrial wastewater
Selection and collection of industrial wastewater with its pollutant level is covered in this section to be utilized as water input in the system for treatment and distillate/freshwater output. This section is subdivided in two parts. In the first part (next section), importance and region is discussed based on which industrial wastewater was selected for treatment in designed PCB-SDS. The collection methodology and characterization of industrial wastewater was explained in the Collection and characterization of wastewater collected from textile industry section with instruments used for the heavy metal analysis.
Selection criteria of industrial wastewater
The selection of industrial wastewater in the present study was done on different aspects i.e. high wastewater generation, the production of wastewater from the particular industry should be very large with high pollutants level and should be novel/unique enough to be used in solar desalination system, from previous literature. Keeping these properties in mind, textile industry has been selected to be used in the present study which is novel in its type, as no work was reported till date on the use of textile industry based upon author’s knowledge and literature survey.
Collection and characterization of wastewater collected from textile industry
The wastewater was collected from two processing steps in the textile industry situated in Panipat District at Haryana, India. The composite method was applied for collection of wastewater from two different points. Table 3 illustrates the analytical characteristic of collected wastewater from two different steps: Degumming (TDgWW) and Dyeing (TDyWW). The samples of wastewater was filtered through sieve of 1 mm size to remove large particles and stored in sterile bottles at 4 °C for further contamination and degradation. Temperature, pH, total dissolved solid (TDS) and hardness was selected as study parameters by following standard protocol of American Physical Health Association, 2012. 22 Hardness was analysed by titrimetric method and chemical oxygen demand (COD) by reflux method. Concentration of heavy metals are also analysed by Inductive Coupled Plasma-Optical Emission Spectrometry method (ICP-OES) (Model: Perkin-Elmer-Optima 5300 V; Serial No. 077N508240) (APHA 2012). 22 All experimental parameters are done using Lab grade chemicals from Hi-Media, Mumbai. The studied parameters are analysed in triplicates.
Physio-chemical parameters of TDyWW and TDgWW samples.
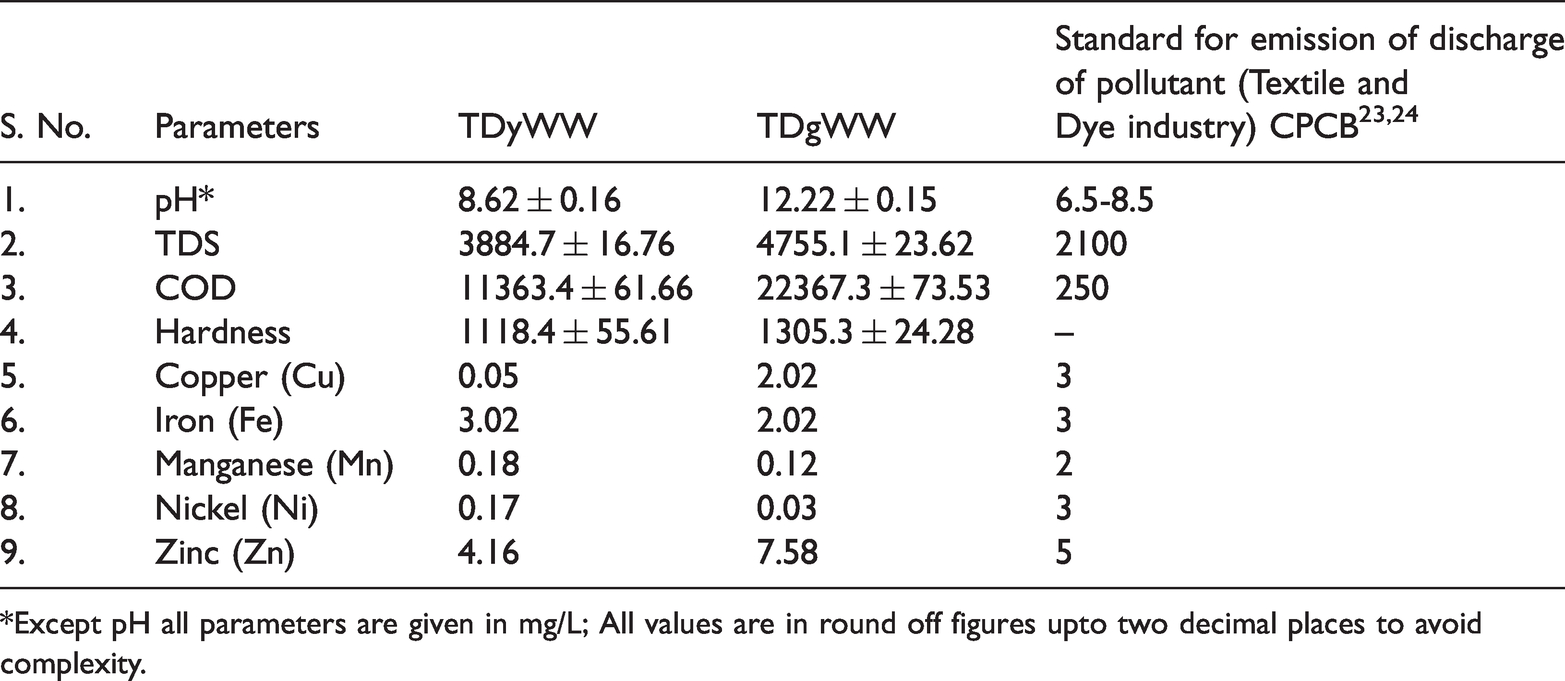
*Except pH all parameters are given in mg/L; All values are in round off figures upto two decimal places to avoid complexity.
Energy, exergy, pollutant removal and economic analysis
In this section, energy, exergy and economic analysis of PCB-SDS are presented. While analysing the thermal analysis of the system following assumptions were made (Figure 3):
There is no steam leakage from the system. Basin material heat capacities are negligible. Conductive losses are negligible.
Energy analysis
Energy efficiency of any system is interpreted in terms of first law of thermodynamics.The area of designed parabolic dish collector is very small which results in very less radiative losses and convective heat losses. In this regard, the daily productivity (Pd) in kg/day of the system and total energy efficiency (ηen,total) is calculated using equation is also very small
3


Where, Ph is represented as hourly productivity in kg/h; hfgsw represents latent heat of vaporization of water for daily average data; Concentration ratio, (C) is given by (
Where, 

Exergy analysis
The second law of thermodynamics is utilized to estimates the capability of energy to do work which is known as Exergy.
Petela, generalized the equation for exergy balance for closed system as
26

For all test cases, the exergy output of the distillate output (freshwater) for solar desalination system is computed as
27

Whereas,
Exergy input to the designed solar desalination is computed as
26

Where,
The exergy efficiency 
The exergy efficiency of the total system for whole day is computed as
28

Pollutant removal analysis
The removal efficiency of pollutant from the system is calculated in terms of initial and final parameter
7

Where, initial pollutant parameter is denoted by
Economic analysis
The main objective of all solar desalination system is to increase the distillate (freshwater) output and reduce the cost of its productivity per liter (CPL). Therefore, to examine the CPL from the designed system the unit is economically examined and the procedures for economic analysis for all test cases are calculated as follows 29
The first annual cost (FAC) of the designed solar desalination system is governed by
20

Where, CRF and CC are the capital recovery factor and capital cost of the designed solar desalination system, respectively.
The capital recovery factor which is estimated from
3

Where, i is the annual rate of interest which is fixed by the local governments and n denotes the life time of solar desalination in years which is assumed to be 15 years. 30
The annual salvage value (ASV) of the solar desalination system is computed by
31

Where, SFF represents the sinking fund factor for a desalination system and S represents the salvage value of the solar desalination. S is computed by
3

SFF is computed by
31

The annual maintenance cost (AMC) is supposed to be 10% and is computed as
31

The total annual cost is calculated as
31

Lastly, the cost per liter (CPL) of the distillate/freshwater yield is determined by
31

Where,
Results and discussion
This section presents a comprehensive discussion of various results obtained during the experimental analysis. Based on the experimental data, energy, exergy and pollutant removal efficiency of the system has been evaluated with the help of set of equations (2) to (10). In this section various input and output parameters such as solar radiation, distillate output productivity, effect of depth and different temperature approaches on absorber has also been presented and discussed for different tests.
Variation in solar radiation and ambient temperature
The variations in solar radiation and ambient temperature versus time for Test 1–3 and Test 4–6 are well presented through Figure 4(a) and (b) respectively. Each test was carried out on different days with different environmental conditions.
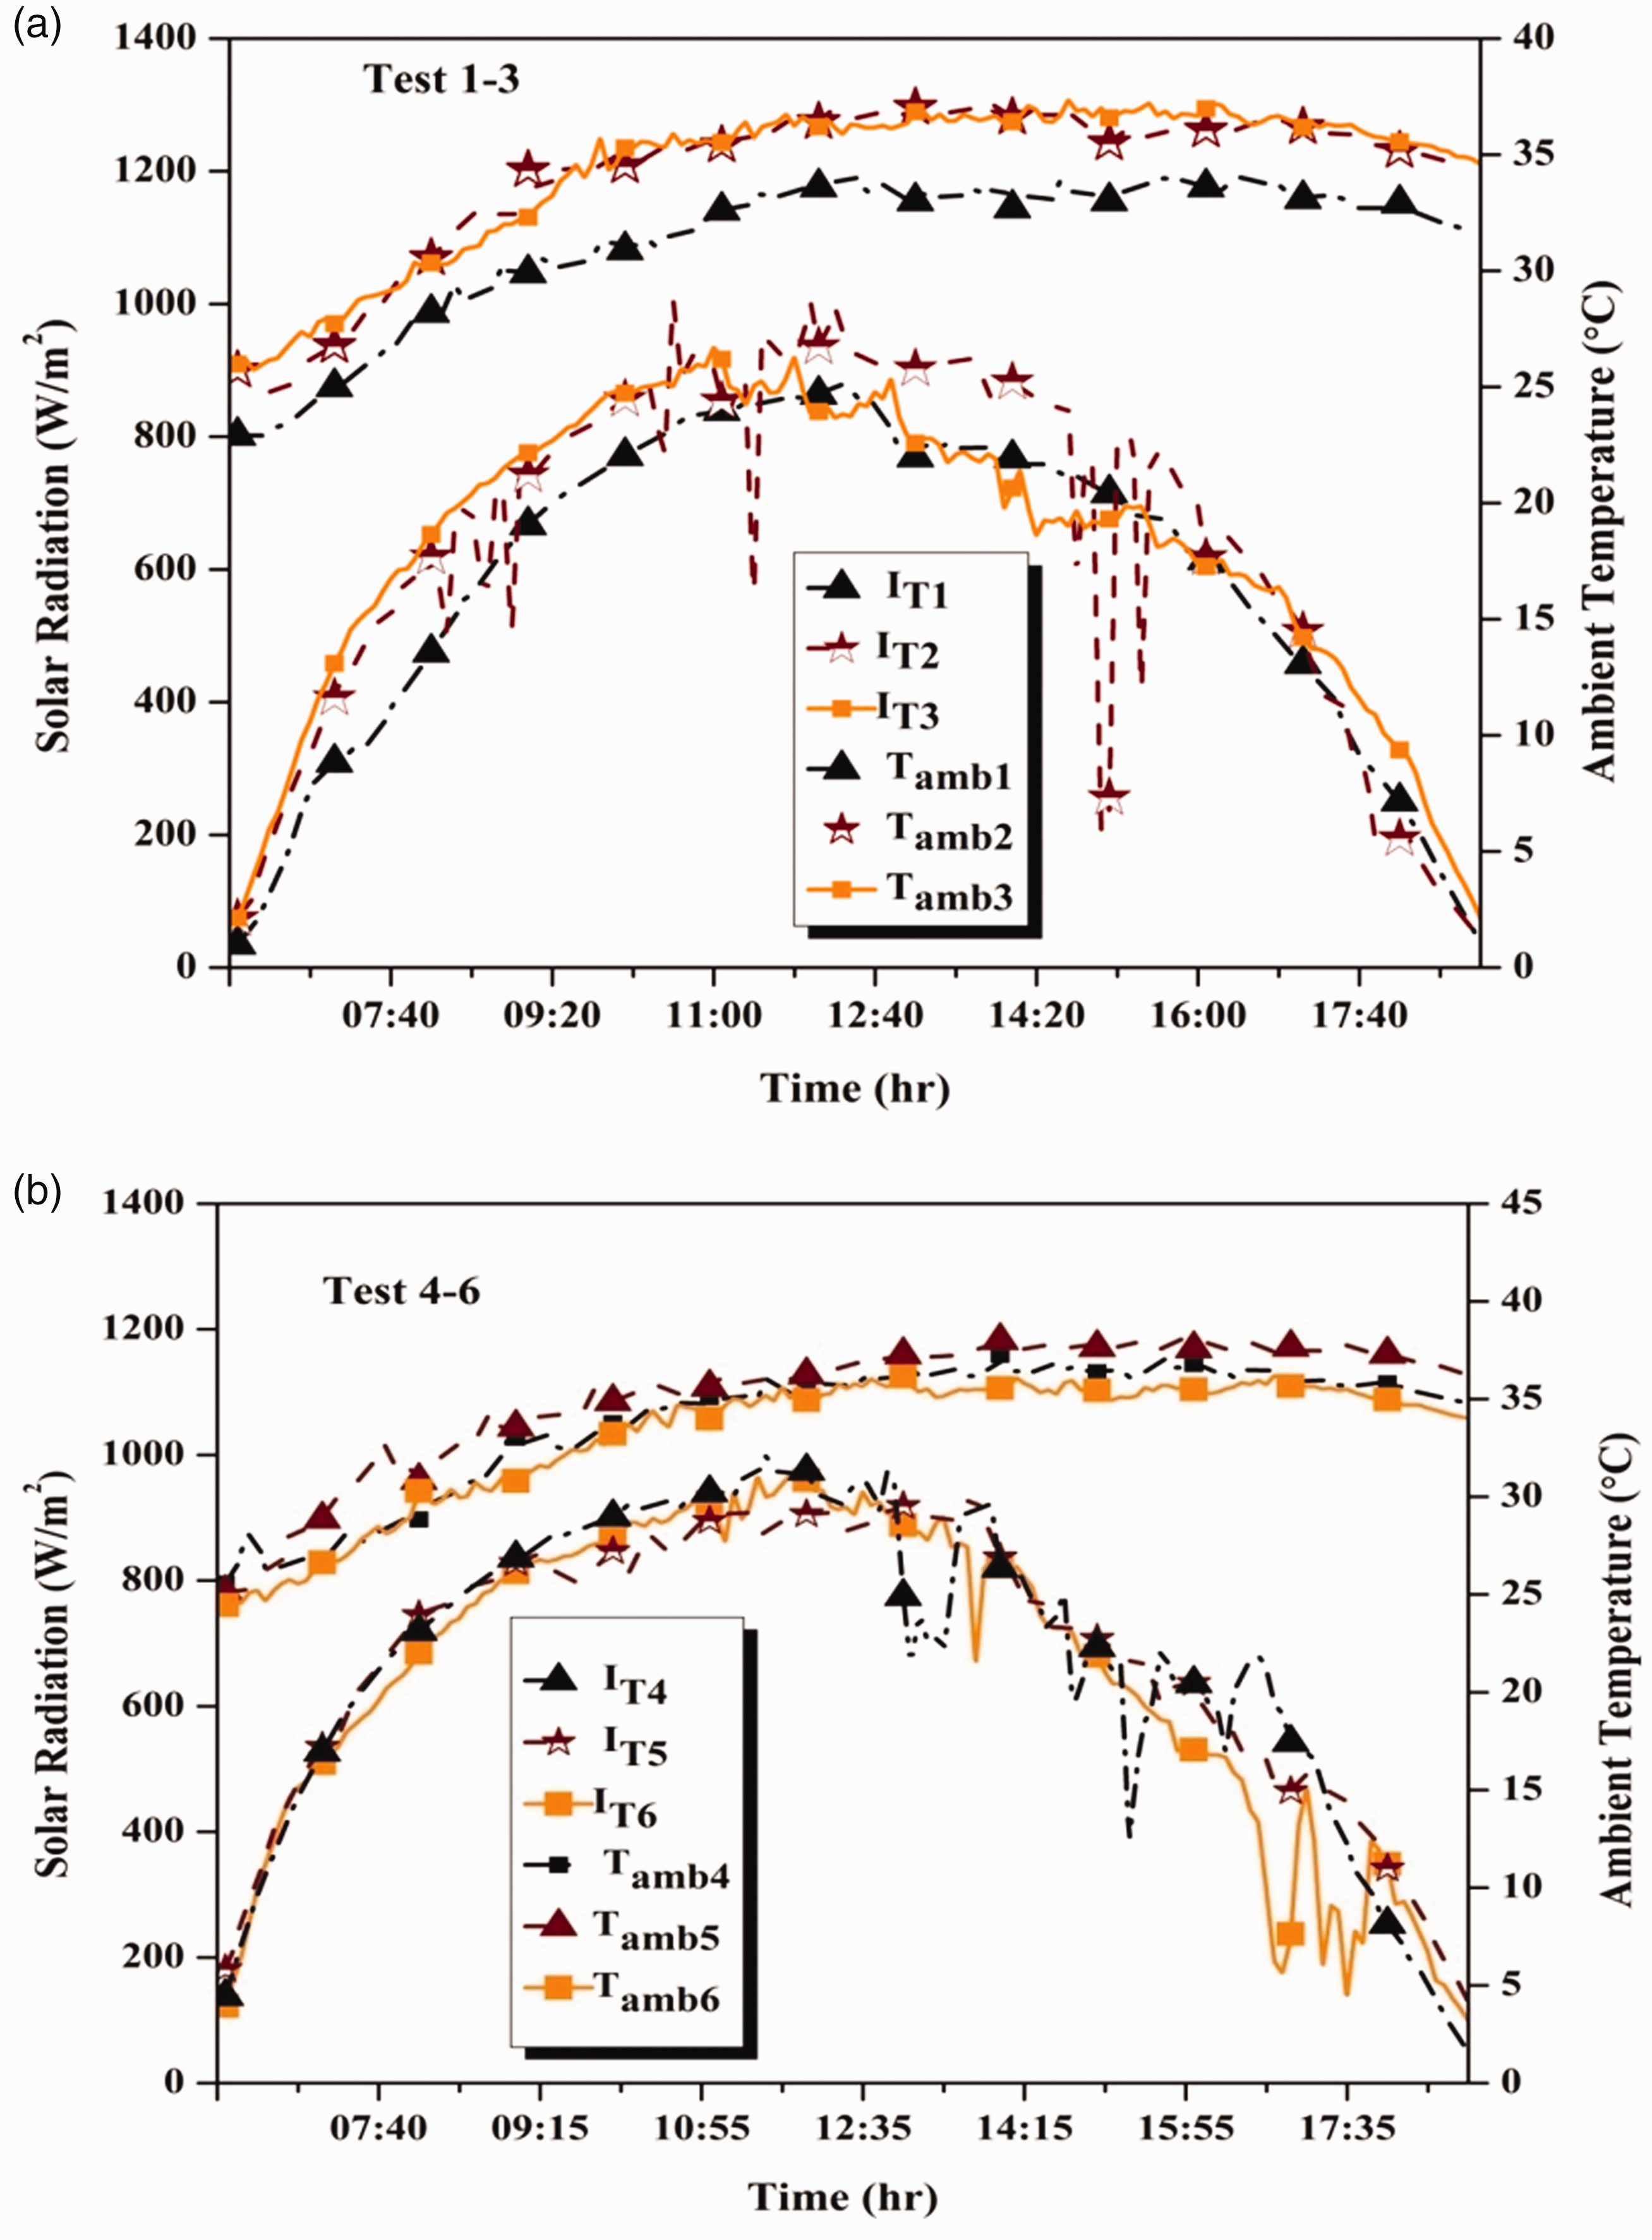
Solar radiation and ambient temperature fluctuations verses time during different test (a) Test 1–3 (b) Test 4–6.
It can be clearly observed from Figure 4(a) that solar radiation was found almost constant during selected days for test-1 to test-3. It can be seen that some dramatic fluctuations in solar radiation was observed between 0900 to 0920 hrs, 1100 to 1130 hrs and 1500 to 1600 hrs, during test-2. This trend in solar radiation is noticed because of the clouds during that particular interval of time. The highest value of solar radiation for test-1, test-2 and test-3 was 879.0 W/m2 at 1220 hrs, 993.6 W/m2 at 10:35 and 918 W/m2 at 1150 hrs respectively.
The large variation was observed during test-4 and test-6 was as almost negligible variation is noted during test-5. It has been observed that for sudden drop in solar radiation was observed during 1235 to 1300 hrs for period of 25 min during test-4.During test-6 fluctuation was observed during 1630 to 1700 hrs due to cloud effect. The highest value of solar radiation for test-4, test-5 and test-6 were 998.0 W/m2 (at 1140 hrs), 935.8 W/m2 (at 1350 hrs) and 968.8 W/m2 (at 12:00 Noon) respectively.
The range of variation of ambient temperature for Test-1, Test 2, Test 3, Test 4, Test 5 and Test 6 were 22.9–34.0 °C, 25–37.5 °C, 25.9–37.3 °C, 24.4–36.0 °C, 25.3–36.9 °C and 25.5–38.1 °C respectively.
Solar desalination system temperatures for different tests
The distillate output and performance of PCB-SDS was greatly influenced by different system tempertaure nodes like wastewater
The variation in wastewater
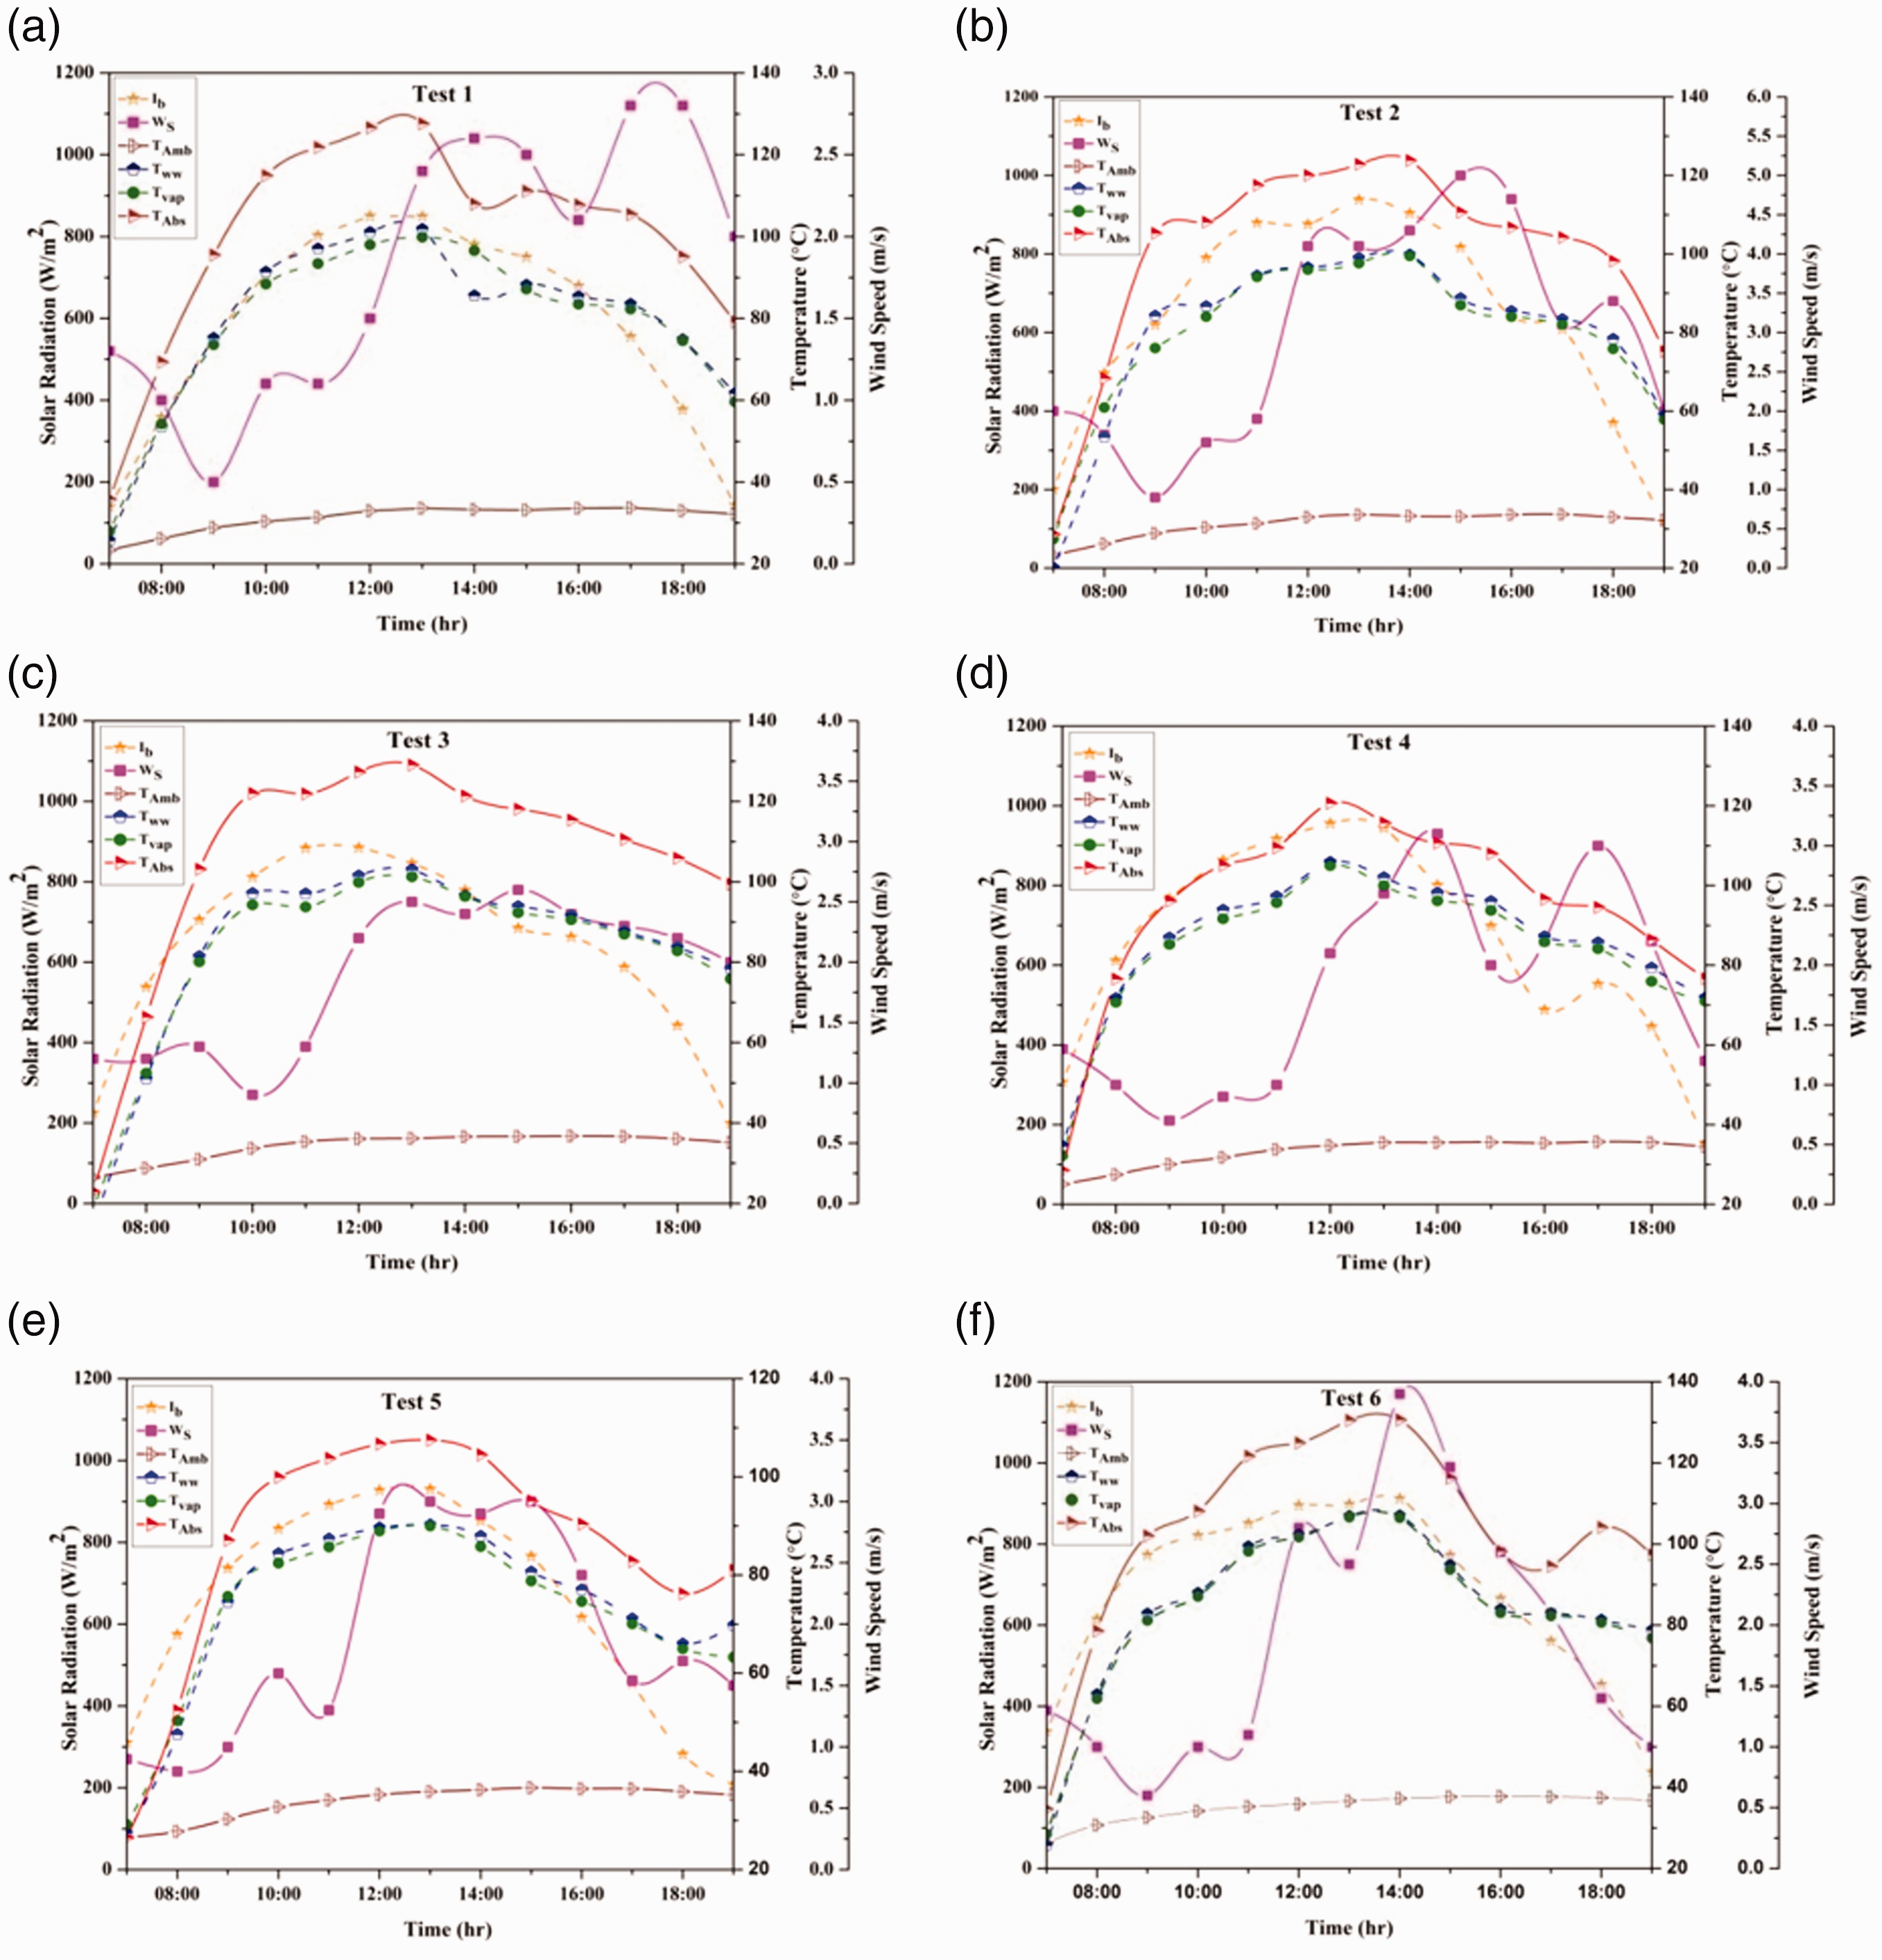
Designed solar desalination temperatures, wind speed, ambient temperature and solar radiation during different tests (a) Test 1 (b) Test 2 (c) Test 3 (d) Test 4 (e) Test 5 (f) Test 6.
The same trend is followed during test-4, test-5 and test-6 respectively. The highest enlighted absorber surface (
The wind speed
Distillate output/freshwater productivity for different tests
The main objective of the solar desalination (PCB-SDS) system is the production of portable water from industrial wastewater with maximum efficiency at low cost. Therefore, in present study with designed PCB-SDS,the variation in productivity (freshwater) at different depth with both type of wastewater is presented and discussed in this section.
The difference in freshwater production for all test cases is presented in Figure 6(a). Figure 6(a) indicate that the hourly production gradually increases from 0800 hrs until it reaches maximum between 1200–1400 hrs for different tests, before decreasing with time. The maximum hourly production rate was 970, 1040, 1050, 1110, 1060 and 1120 mL/hr during test-1, test-2, test-3, test-4, test-5 and test-6 respectively. Moreover, same trend has been observed during all tests in hourly fluctuations due to change in solar radiation intensity during that time period. It can be clearly observed from the figure that such situation occur in test-1 and test-4. This was due to decrement in solar radiation in the preceding hour as it decreased the absorber temperature which resulted in low evaporation temperature in next hour. The total daily distillate production for PCB-SDS was found minimum with test-1 and test-4, average productivity with test-2 and test-5, whereas the developed system gave maximum productivity with test-3 and test-6, which corrobates the temperatures at different depth as presented in Figure 5. This was due to the fact that after receiving solar radiation from concentrator at the lower surface of basin that results in high temperature. 4 The low heat capacity was noted in low depth which resulted in low heat storage capacity whereas, higher water mass stores high energy. This results in high heat delivery to the water in absorber and resulted in high distillate yield. This was also due to the fact that on regular addition of water in basin with low water depth, require high heat to maintain boiling temperature whereas, with high depth this problem is rectify due to high heat storage. In comparison and as reported earlier low depth produces high distillate output.32,33 Thus, author recommends that this system is suitable enough for utilization with high water mass which can be a solution in coming future for large industries. The figure also depict that the overall distillate productivity was lower with TDyWW due to low pollutant load than TDgWW. This reveals that depth of water in the absorber should always in between 50–60% of the total height of the absorber. Although, depth more than 60% also affects the output badly due to high initial start-up time of the system which leads to decrement in the efficiency.
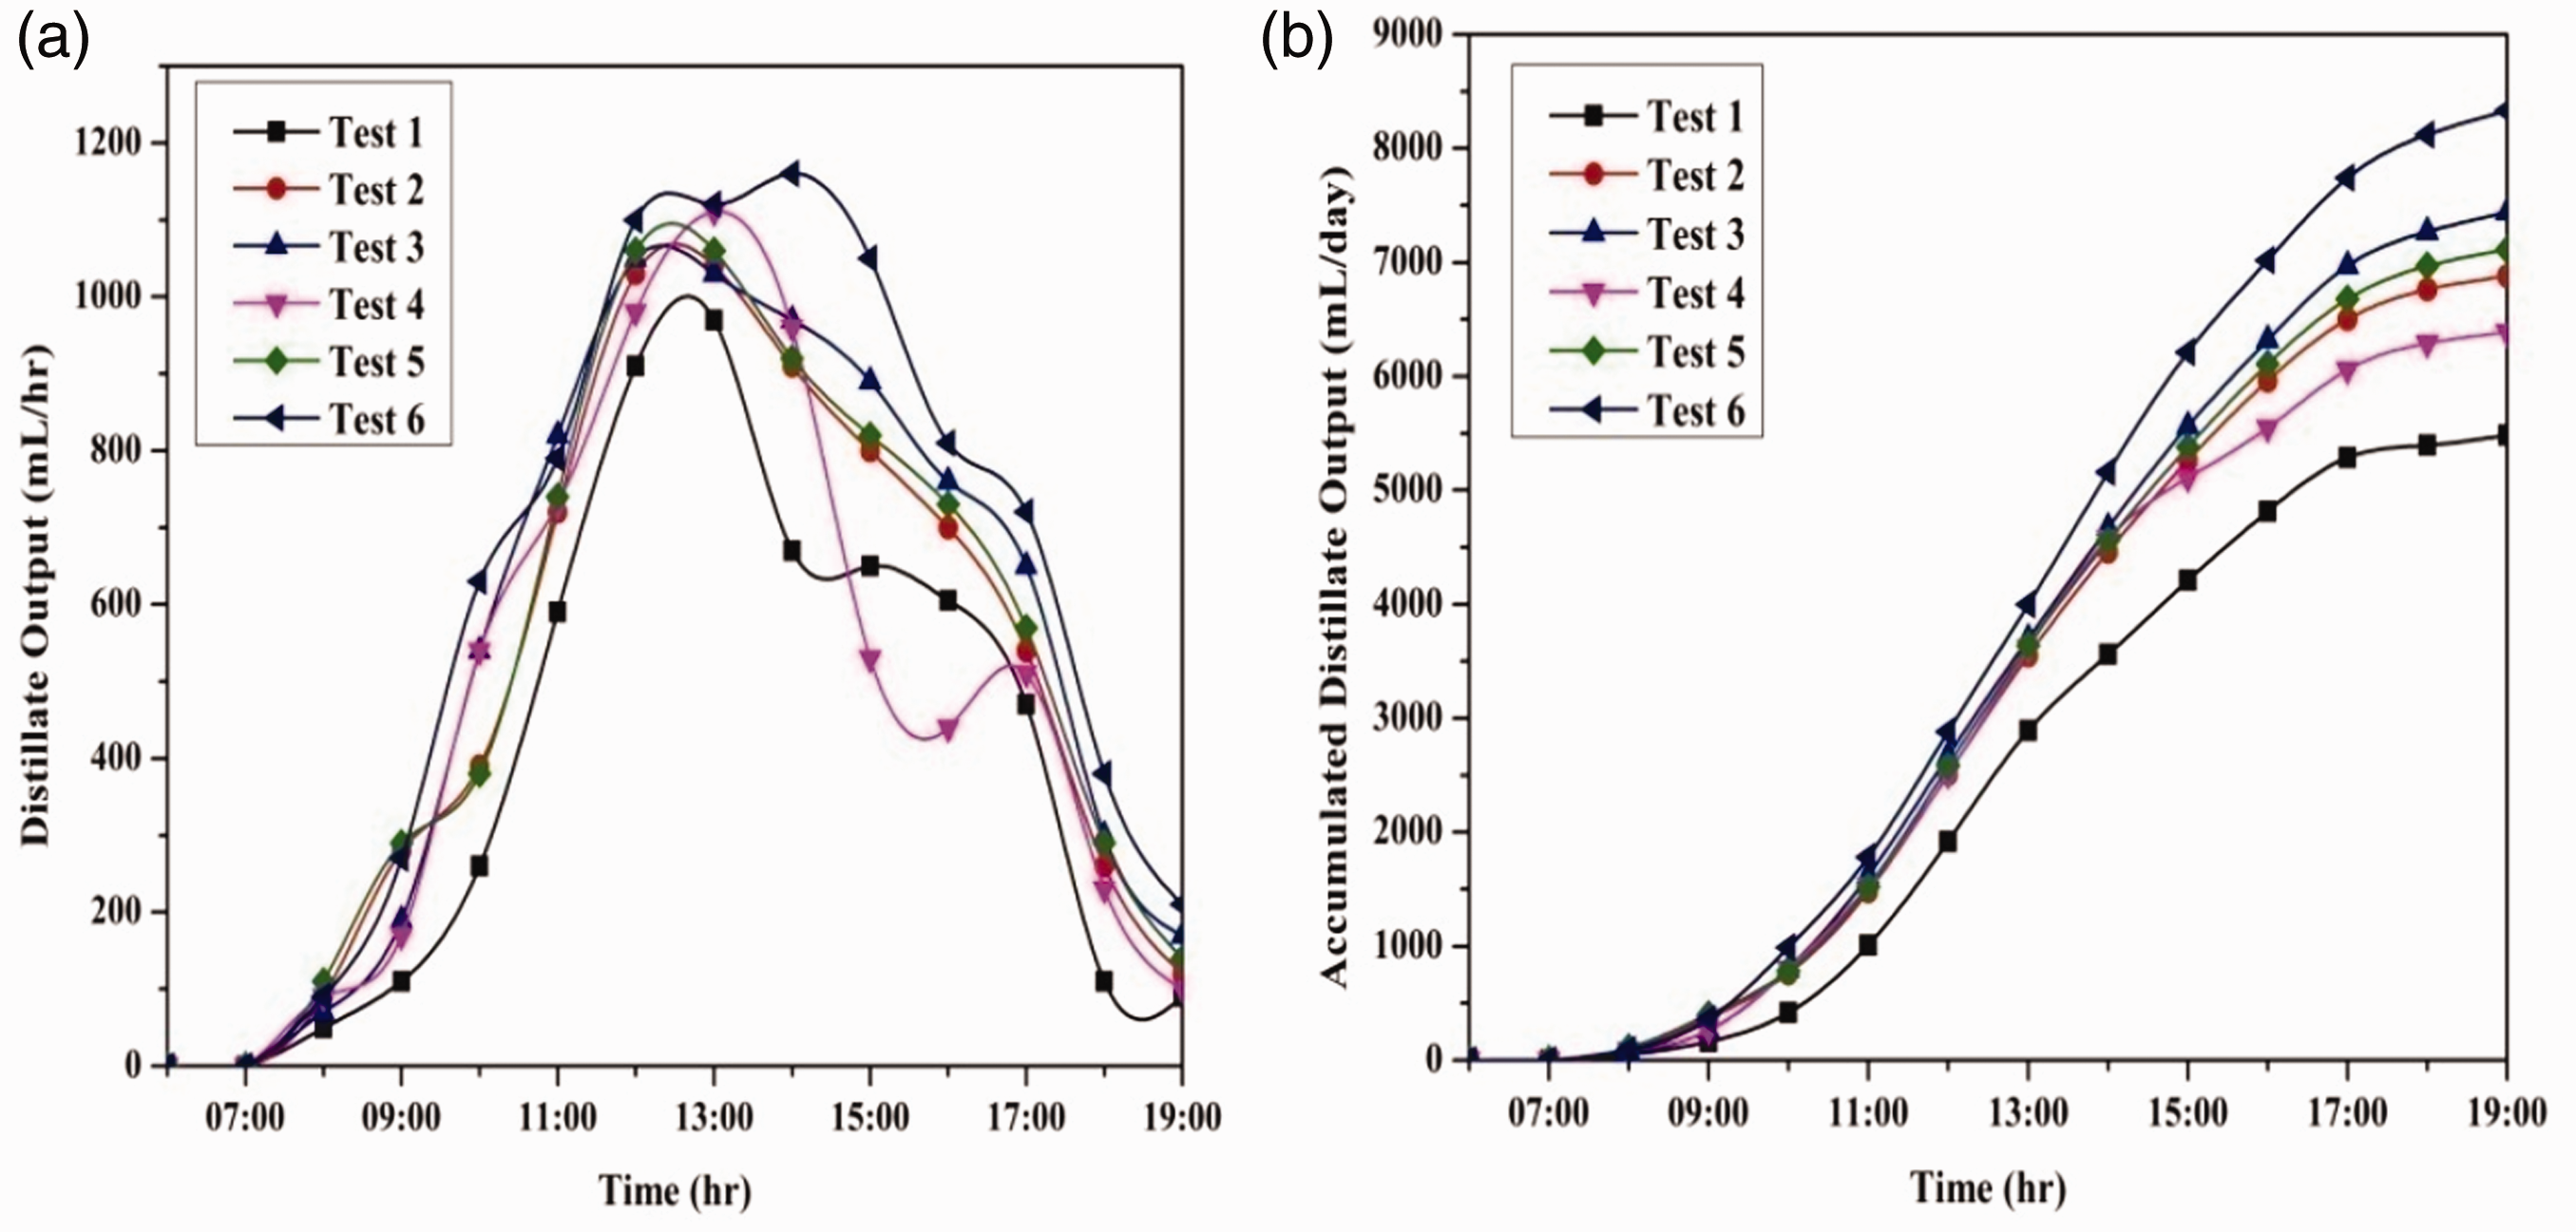
Evolution of the distillate output (a) hourly (b) accumulated with time for test-1, tes-2, test-3, test-4, test-5 and test-6.
Figure 7 present a cross-correlation between the total accumulated mass flow rate of distillate water in mL/day from designed PCB-SDS with textile industry wastewater and different test cases. Figure 6(b) confirms the highest distillate productivity from PCB-SDS actually increases significantly over increasing depth of wastewater. The maximum distillate yield was 8330 mL/day for test-6 from developed system was achieved. Moreover, minimum distillate water collected daily was achieved by (test-1) and was found to be 5485 mL/day.The review of some previous work with summary of their other efficiency is presented in Table 9. Comparing the concentrator type of solar desalination with the present study shows that PCB-SDS has quite good performance with a nearly equal time period. The parabolic dish based still produces 6112 mL/day whereas; 34 parabolic concentrator coupled single slope, solar still produces 3500 mL/day 1 and 6675 mL/h m2 was produced from parabolic trough solar desalination system. 35 In order to compare other systems all the effective meteorological, geographical, and technical parameters are mandatory.

Daily water distillate water (freshwater) production for different tests.
Efficiency of the system
In this particular section, assessment of the designed PCB-SDS based on energy, exergy and pollutant removal efficiency of the system is discussed. The assessment of the desalination system in terms of energy and exergy efficiency is an important parameter to develop and increase the system performance and decrease the losses. The pollutant removal efficacy of the system describes the capability of the system to be used in industry and the quality of water to match the high standards for future use in different applications
Energy efficiency
In this section, energy efficiency for eachtesthas beenevaluated and its variation with corresponding depth is presented through Figure 8. It can be seen that total energy efficiency of the developed system operated for 60% depth attained highest value of 51.93% for test-6. While for 40% and 20% depth the highest energy efficiency of 46.48% for test-5, 43.38% for test-4. The energy efficiency of the developed system operated for TDyWW and TDgWW was found best at depth of 60%. Thus, 60% depth is an optimum depth among selected depths for wastewater treatment. The lowest values of energy efficiency i.e. 39.83%, 45.69% and 49.45% were obtained for test-1 (20% depth), test-2 (40% depth) and test-3 (60% depth) respectively. It can be noticed that energy efficiency escalates progressively since morning till attaining its greatest value in mid afternoon and then starts declining gradually till sunset. It can be noticed that energy efficiency of the designed system increased with increase in depth of distillate output. It was because of higher energy storage capacity with higher depths. Figure 8 depicts that energy efficiency of developed system operated for 60% depth was higher in comparison of same system worked for 20% and 40% depth. It is due to the fact that high depth stores high energy in comparison to 20% and 40%. This can also be due to the change in absorber position according to sun direction while tracking. Low depth in basin does not allow much solar energy to transfereffectively as wastewater in basin is not uniform and changes frequently on changing the direction of dish and absorber according the sun.
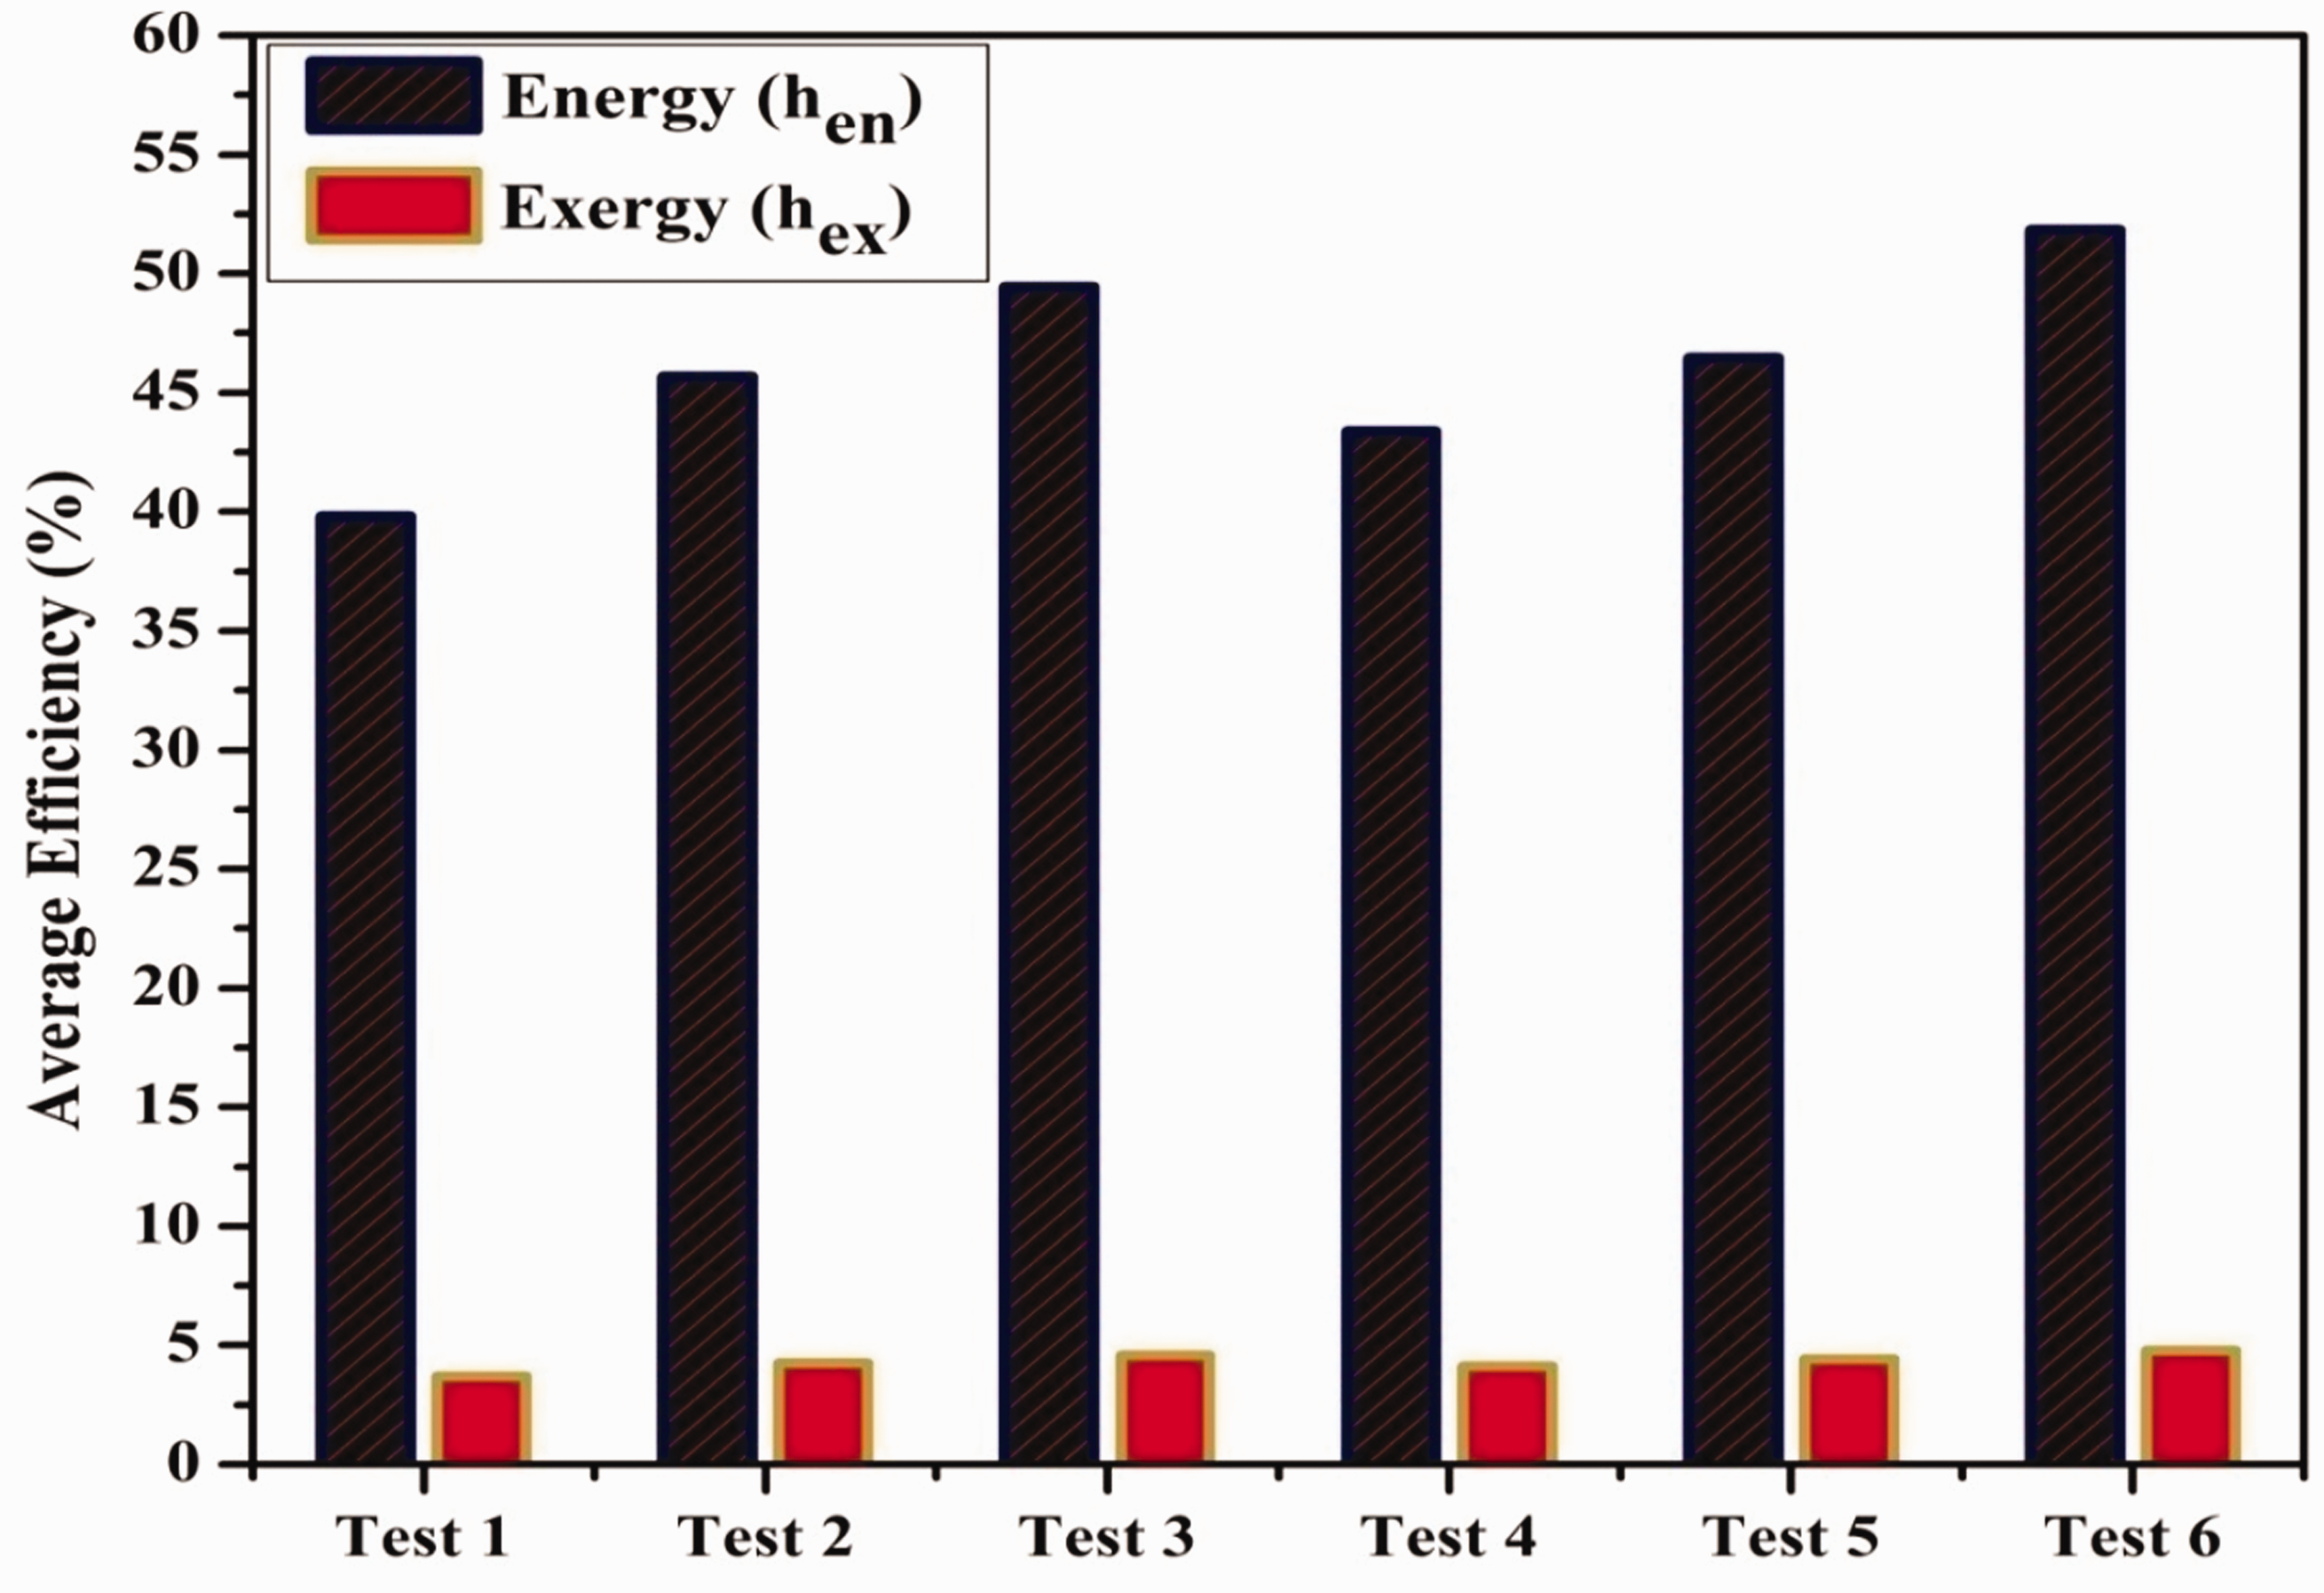
Comparison of average daily energy and exergy efficiency of designed PCB-SDS for different test cases (depths).
Exergy efficiency
The daily average exergy efficiency of the PCB-SDS for all test cases is illustrated in Figure 8. Exergy output for all test cases increases gradually to reach its utmost value in afternoon and again starts declining till it reaches zero in late evening. Figure 8 indicates that the daily average exergy efficiency of test-3 and test-6 was greater than the other test cases. Moreover, the daily average exergy of the PCB-SDS with test-6 was greater than test-3. Such findings can be attributed to the noticeable rise in absorber temperature and distillate output productivity as stated previously for the PCB-SDS with test-6 and accordingly enhances the evaporative exergy rate as compared to the designed system with test-5, test-4, test-3, test-2 and test-1. The daily average exergy efficiency of the PCB-SDS for test-1 and test-4 was 3.69% and 4.12% respectively and 4.25% and 4.42% for test-2 and test-5 respectively with an increase of about 4.59% and 4.8% for test-3 and test-6 respectively. However, the average exergy efficiency of the PCB-SDS for test-3 and test-6 was found maximum due to highest distillate output.
For better understanding, the abovementioned results, a breakdown of distillate output, energy and exergy efficiency of the designed system are presented through Table 9 with comparison from other previous literatures.
Pollutant removal efficiency
To determine the removal efficiency of the designed system both types of processed wastewater were passed through the designed solar still to determine the potentiality of system. The significant physio-chemical parameters including pH, TDS, COD and hardness for both process wastewaters are given in Table 4.
Pollutants reduction from dyeing wastewater (TDyWW) and degumming wastewater (TDgWW) at different depth ratio during test 1–6.

*Except pH, all values are in mg/L; R*= Reduction (%).
Results showed that both processed wastewater have positive removal efficiency in terms of selected parameters. Based on pH results for both wastewaters, it was found that the condensate quality meets the potable water (discharge water) quality and is depicted through Table 3.
The maximum removal of TDS was found with test-3 and test-6 i.e. 60% brine depth with both selected samples. The TDS in degumming wastewater decreased from 4755 mg/L to 419.3 mg/L. In dyeing wastewater, TDS decreased from 3885 mg/L to 27.6 mg/L.
Furthermore, COD for both types of wastewater was found that quality of output is not severely affected by input quality. This shows that the increase in input COD doesn’t affect the output values. It was observed that using designed solar still for the textile industry wastewater taken from source, the COD of the degumming wastewater decreased from 22367 mg/L to 3439 mg/L and that the COD of the dyeing wastewater decreased from 11363 mg/L to 2219 mg/L with test-3 and test-6 i.e. 60% brine depth. In both samples, it has been observed that the removal efficiency of COD is highest for both the wastewater (TDgWW and TDyWW) with test-3 and test-6 i.e. 60% brine depth. This shows that the system works more efficiently between 40–60% depth ratio (test-2, test-3, test-5 and test-6).
The hardness of the degumming wastewater decreased from 1305 to 120.7 mg/L at maximum side, whereas, for dyeing wastewater reduces from 1118 mg/L to 13.3 mg/L.
The removal efficiency of the heavy metals was also examined for both wastewaters. Because, it causes many health related issues like cancer, skin, allergic etc. Both wastewaters were examined before and after treatment in terms of heavy metal and found that designed system capable of removing heavy metal too from the wastewater. It was observed that heavy metal removal is maximum upto 90–95% for all the selected metals. The samples were digested before and after treatment before analysis through ICP, the reduction observed for both the wastewater i.e. TDgWW and TDyWW were given in Figure 9.
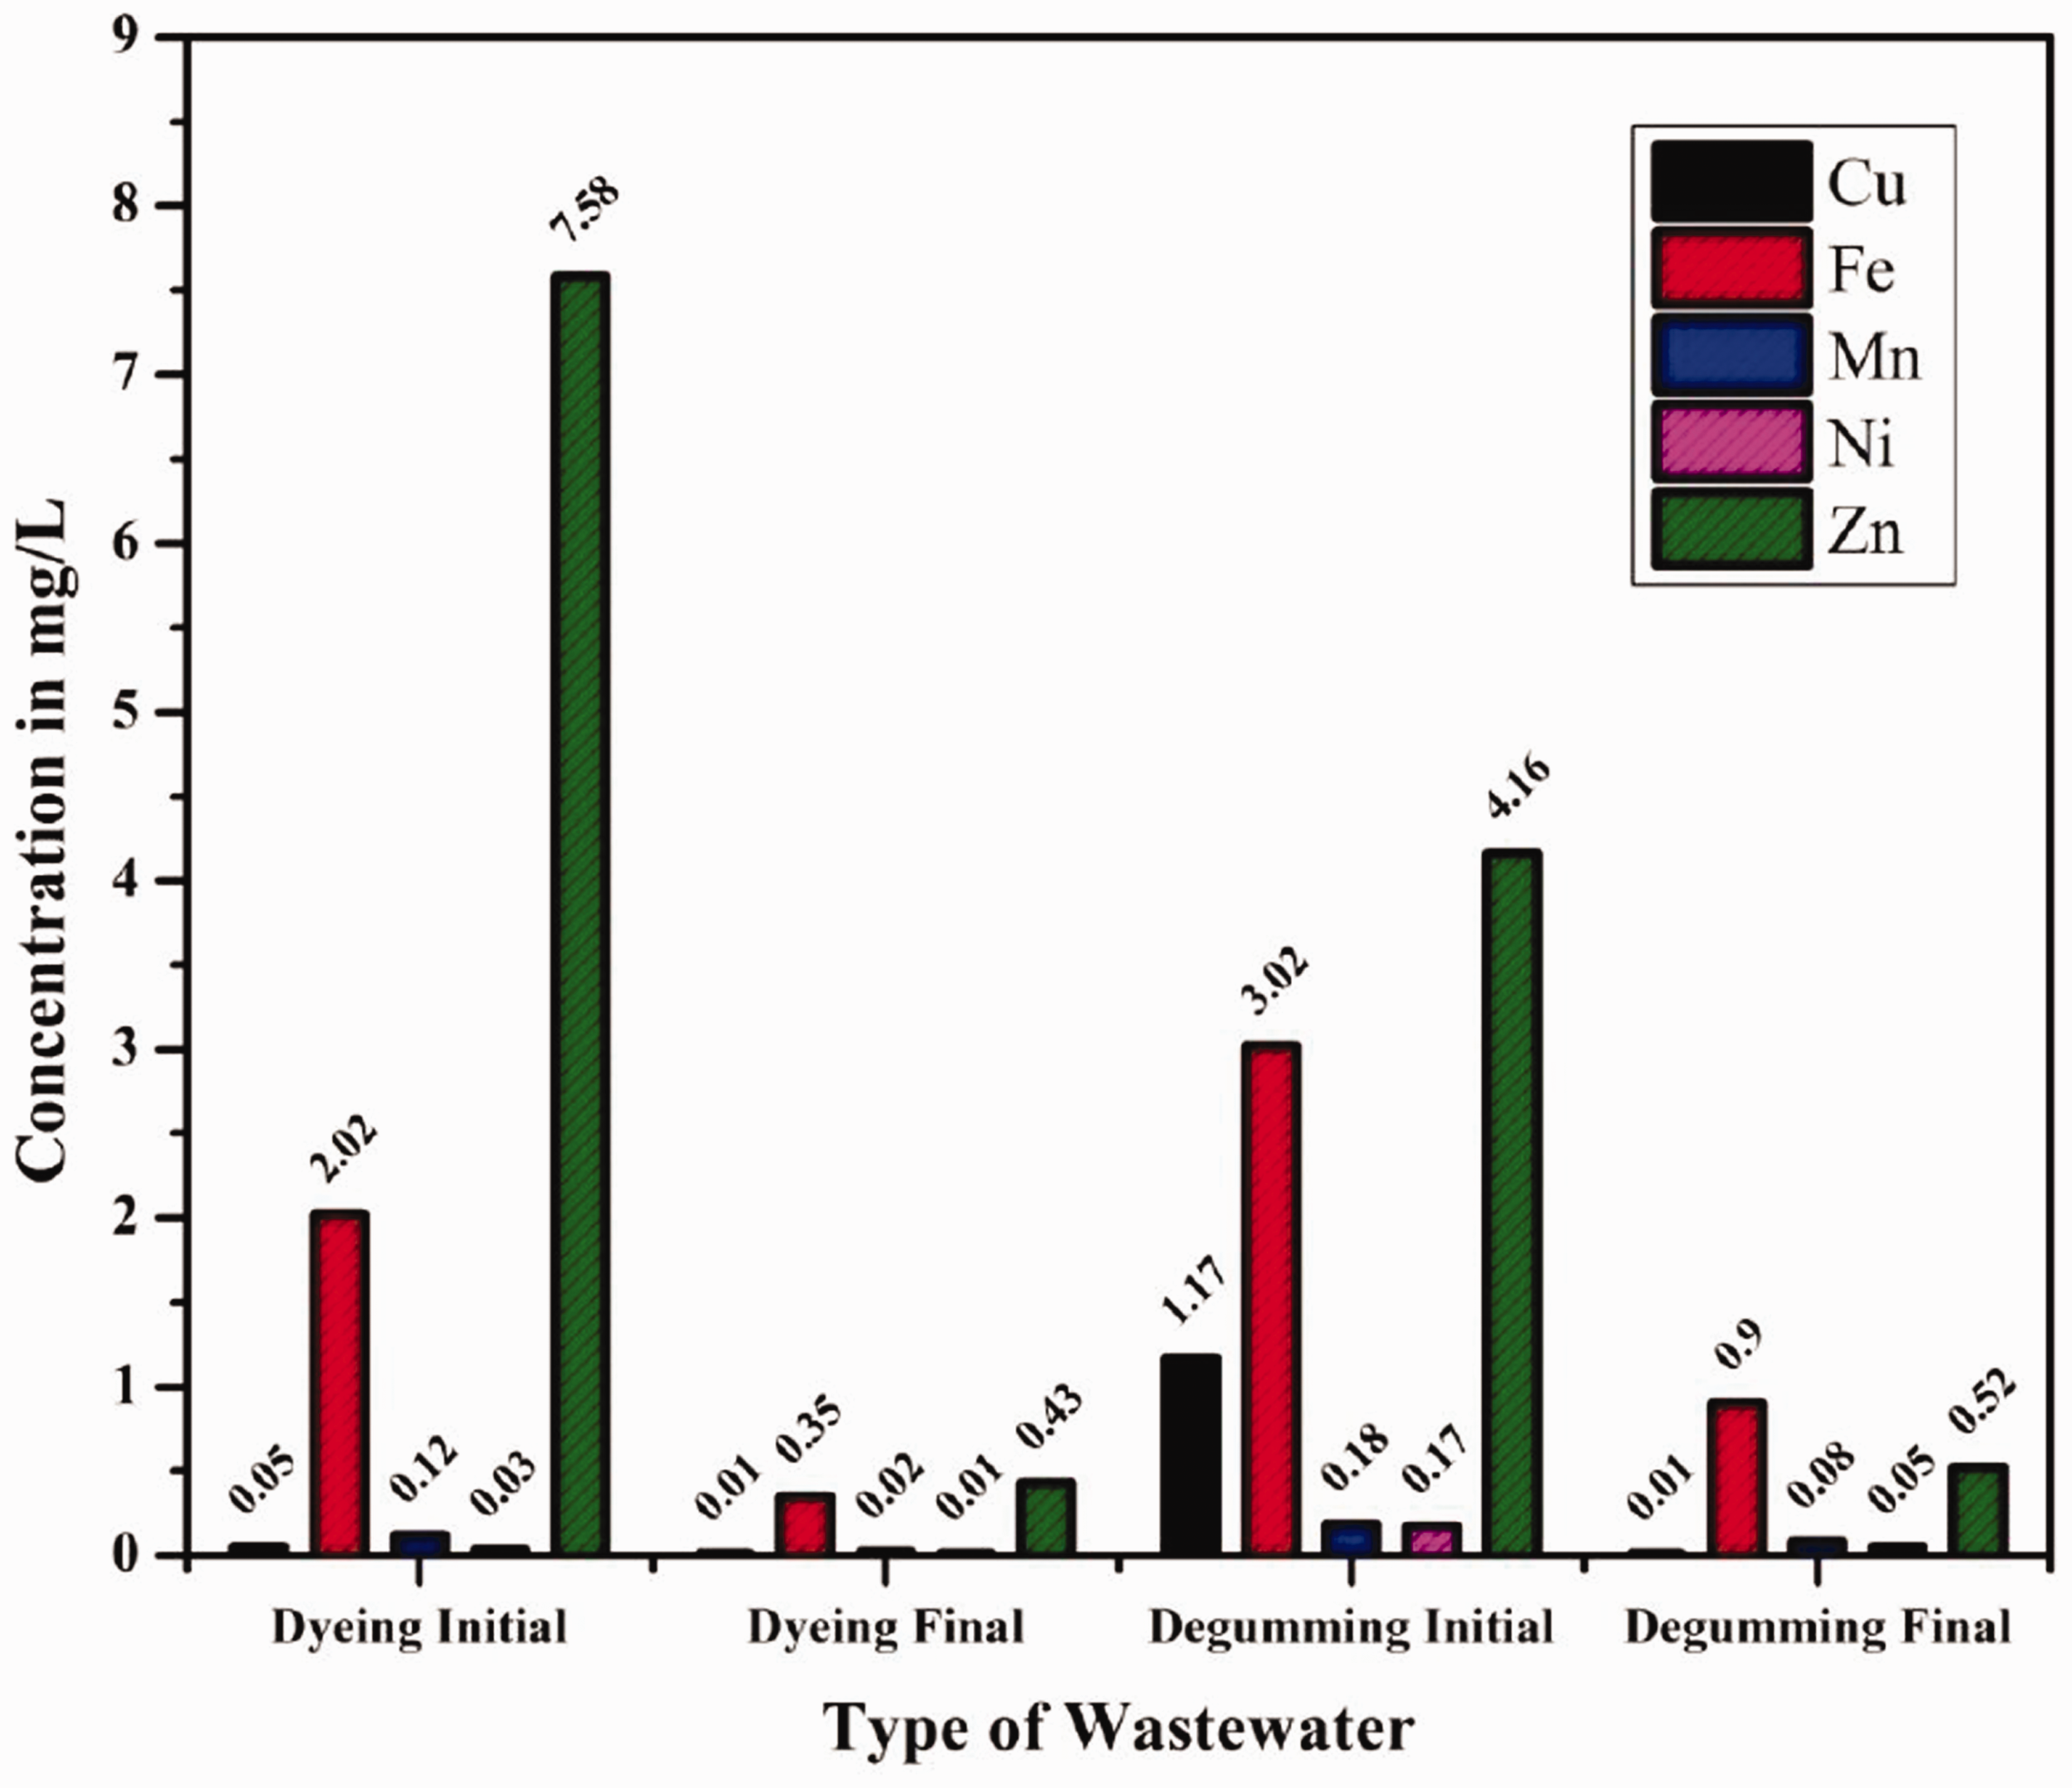
Heavy metal removal efficiency for degumming and dyeing wastewaters after desalination.
Few researcheshas reported the treatment of textile industry wastewater through solar and algae as sustainable approach. And, reported with TDS, COD and other parameters removal with efficient reduction but when compared with the present study the efficiency is low. Manenti et al. 5 treated the real textile industry dyeing wastewater with solar assisted advanced oxidation processes (AOP) and resulted with 69% reduction in COD. Pathak et al., 36 worked with Chlorella pyrenoidosa an algal species for reduction of different parameters for dye removal and finds that 50% removal in TDS was reported after 15 days which is insignificant in compare with the present study. Pathak et al., 37 in another study worked with the same algal species for textile wastewater and finds about 67.8% reduction in BOD, 85%, 81.6% and 36.3% reduction is find with total dissolved solids, nitrate and phosphate respectively. This is still low in compare with the present study. The present study when compared with different available literature (Table 5) find more effective than other renewable treatment system (solar or algal species). The reduction find with AOP is less and algal treatment of the wastewater requires more time as compared with the solar combined system.
Comparative analysis of wastewater parameters for textile industry with various renewable based techniques with current study.

Hence, the treatment results showed that the system was capable enough for treatment of industrial wastewater and could be able to decrease the energy required during conventional treatment methods in less time.
Economic analysis
The economic analysis of any solar system is a major parameter in designing the system. The cost of any solar desalination system is entirely depending on the distillate output productivity. Hence, to analyse the economics behind the designed solar desalination system (cost analysis) is performed in this section. In this regard, it was concluded that selection of place of installation directly affects the overall system operation cost as well. The distillate output produced from designed PCB-SDS was usually considered as a function of variable cost. As, function of capital and amortization cost fixed cost of the system is calculated. It was found that there is relation between variable costs of the systems and operating and maintenance cost of the designed PCB-SDS. 39 The economic parameters are calculated on the basis of Indian situation and presented through Table 6.

The system was installed in Katra (Shri Mata Vaishno Devi University,), (J&K) India (Latitude 32.9915°N,Longitude 74.9318°E) where it was assumed that system operates and produce distillate output for 300 days in a year. 41 Table 7 illustrate the cost investment for construction of PCB-SDS. Table 8 illustrate the detailed cost analysis of the designed PCB-SDS for distillate output in dollar per liter ($/L).
Capital cost investment of the designed PCB-SDS.
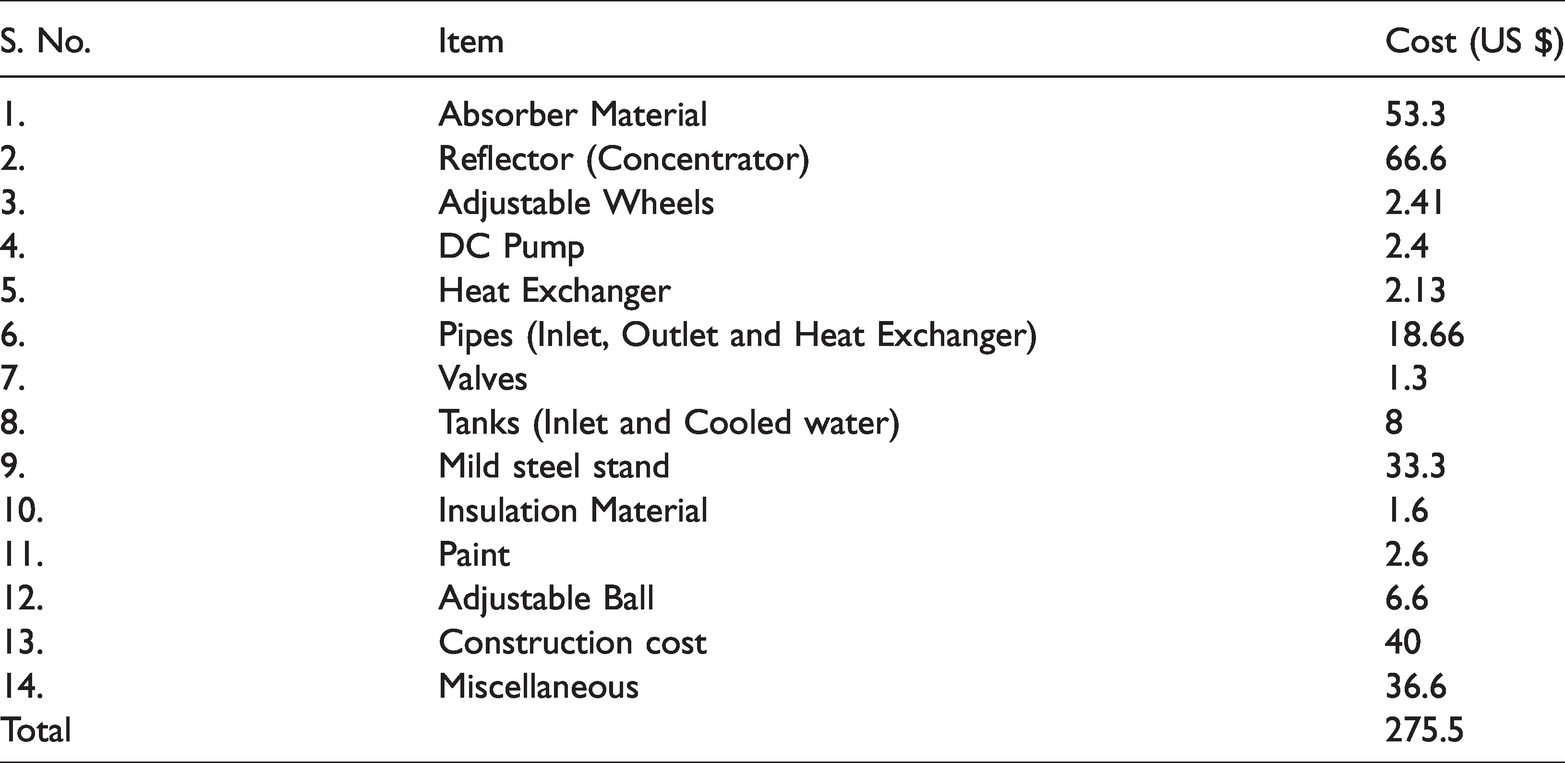
Cost analysis of the designed PCB-SDS.
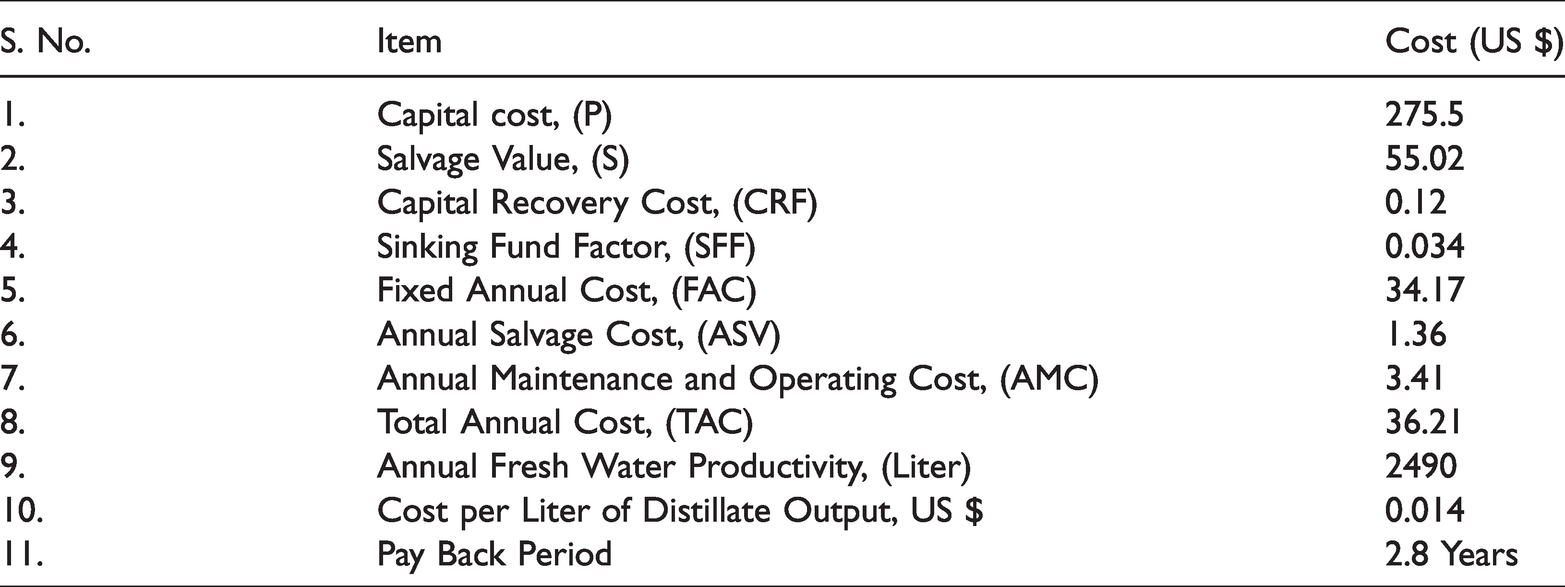
Here, in this section while calculating the per liter distillate output production from PCB-SDS test-6 was taken into consideration due to high distillate output. The comparison between the present distillate output, efficiency in terms of energy and exergy with previous literature was illustrated through Table 9.
Comparison of the previous work and the present work.
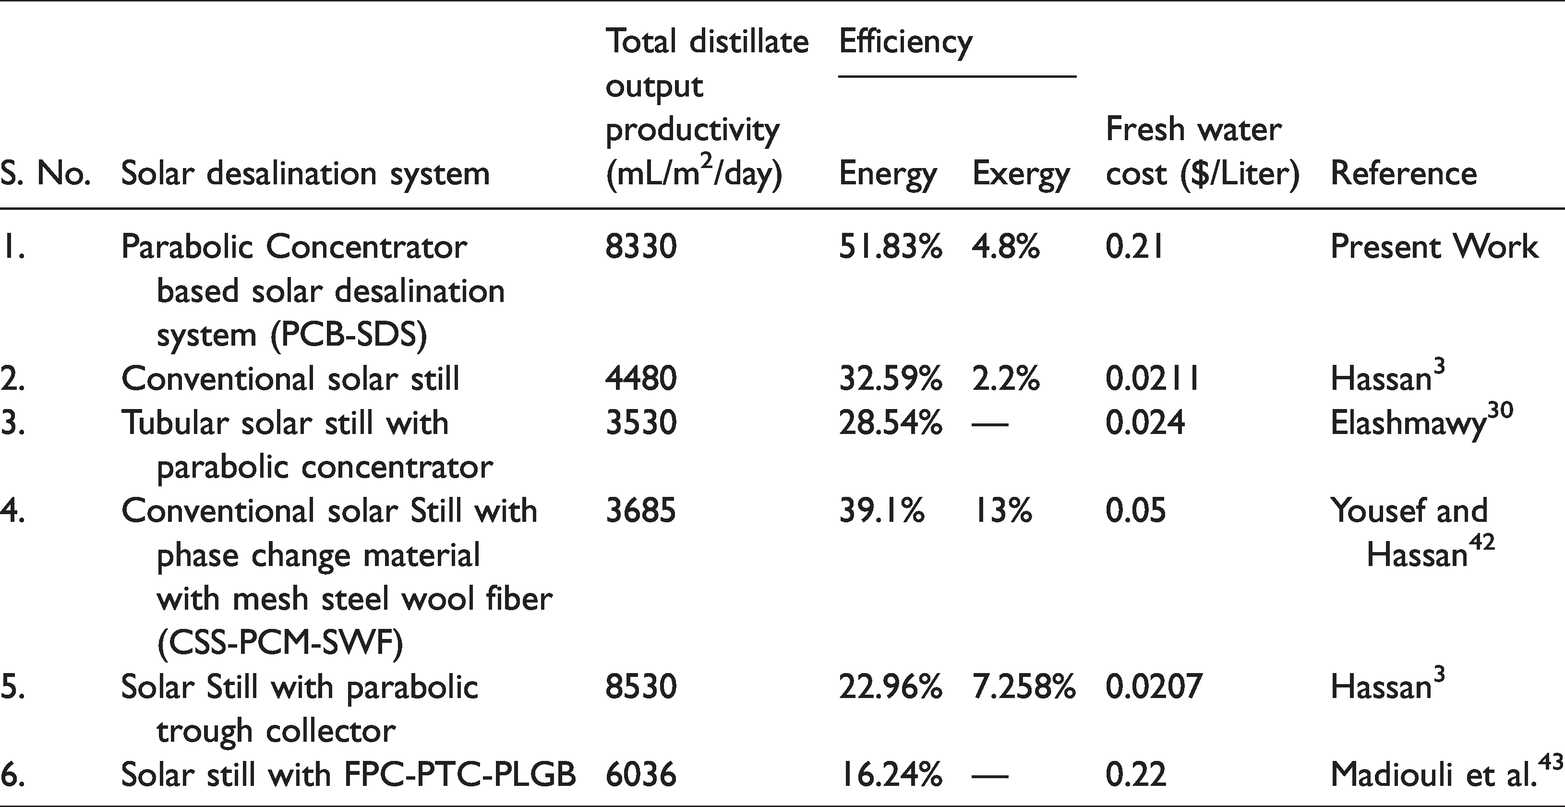
It was observed from present work that distillate output was high and cost was lower than the previously designed systems this was due to high solar radiation in Jammu and Kashmir region of India. The cost of per liter distillate output productivity is 0.014$ this was due high productivity, cheap material, construction and labours cost.
Conclusion
The performance of the concentrator based desalination system filled with textile industry wastewater has been experimentally investigated. Thus on the obtained results a conclusion can be drawn that solar desalination can prove to be economical and affective system for industrial wastewater treatment. Distillate output of the system was found to be in the range of 5485–8330 mL/Day. The energy and exergy efficiency varied in the range of 39.83–51.93% and 3.69–4.8% respectively.The processed wastewaters showed 80–85% COD removal efficiency, ≅90% TDS and hardness removal. The cost per liter of distillate output produced from designed PCB-SDS is found to be 0.014 $/L.
Challenges and future recommendation
The current experimental work is relatively unique in terms of using textile processing steps wastewater. There are many improvements which are needed to be integrated in the current system for improved efficiency and its application in real industry. According, to the present study following recommendations can be drawn for its usefulness in future applications:
The system should be integrated with advance tracking units with photovoltaic panels to fulfil required electrical power. The reflector materials can be improved for much more reflectivity. The system should be installed at the point of wastewater generation to reduce the dependency on conventional treatment plants and reduction in overall treatment cost.
Highlights
Performance of parabolic concentrator based solar desalination system was analysed
Real textile industry wastewater taken from was utilized for treatment
High depth shows increased distillate output productivity and removal efficiency
The energy and exergy efficiency varies in the range of 39.8-51.9% and 3.6-4.8%
Pollutant removal efficiency was obtained in range of 77-90%.
Footnotes
Declaration of conflicting interests
The author(s) declared no potential conflicts of interest with respect to the research, authorship, and/or publication of this article.
Funding
The author(s) received no financial support for the research, authorship, and/or publication of this article.
