



Abstract
The fundamental goal of sustainable urban development is to maximize human well-being with minimum ecological consumption. The ecological intensity of urban well-being (EIWB) achieves an effective linkage among economic, social, and ecological systems, and it is an effective indicator for evaluating urban sustainable development. This study analyzed the spatio-temporal evolution characteristics and driving effects of the ecological intensity of urban well-being over 2000–2019 in the Yangtze River Delta. It was found that as the ecological consumption per unit well-being output decreased gradually, the improvement in well-being level and the increase in ecological consumption were increasingly delinked, and regional EIWB and its sub-dimensions tended to fluctuate. Urban EIWB was dominated by low and lower levels, urban economic well-being (ECWB) was increasingly dominated by the lower type, and urban social well-being (SOWB) and environmental well-being (ENWB) were dominated by the low level. The resource consumption, technology, and well-being effects distinctively inhibited the decrease in regional EIWB and the economic effect exerted an obvious boosting function, whereas environmental consumption effect, scale effect, and efficiency effect had no obvious impact. The variation in urban EIWB was mainly driven by two-factor dominance, featuring economic and technological effects.
Keywords
Introduction
The rapid development of industrialization and urbanization has not only brought remarkable achievements to the social and economic development of Chinese cities, but also brought serious risks and challenges to cities, such as ecological degradation, resource shortage, and environmental pollution,1,2 which have restricted the sustainable development of the urban ecological environment, and caused the urban social economy to be in an awkward situation of “high economic growth and low well-being growth."3 As one of the regions with the fastest economic growth and the most developed industry in China, the Yangtze River Delta region is also facing severe urban resource and environmental pressures ranging from soil contamination,4 air pollution,5 water pollution,6 to excessive energy consumption,7 which resulted in a heavy ecological environment load, a sharp contradiction between economic growth and the ecological environment system, and a decline in quality of life and the happiness index of urban residents. Accompanying the change of the principal contradiction in Chinese society, people's need for a beautiful ecological environment has become an important aspect of the principal contradiction in society. To ensure and improve people's well-being and enhance people's green well-being, the Chinese government always adheres to the concept of sustainable development, clearly proposes building a resource-conserving and environment-friendly society, actively integrates the construction of ecological civilization into regional economic and social development, and strictly implements the ecological environment protection system to build a beautiful China. In the context of high-quality integration development, the Yangtze River Delta is striving to construct an ecological, green, and low-carbon integrated development demonstration zone, and to build an ecologically livable and happy city featuring an excellent ecological environment, good quality of life, and a high degree of happiness.8 To realize the harmonious and simultaneous development of the urban economy, society, and ecological system, it is imperative to improve the performance of ecological well-being and to optimize the distribution system of ecological consumption and well-being. Ecological well-being, which organically combines the ecological environment effect with social and economic well-being and unifies the benefits of economic operation processes, resource operation processes, ecological operation processes, and social operation processes, can reflect the well-being performance of ecological consumption and evaluate the effectiveness of the construction of ecological civilization. Undoubtedly, the calculation of the ecological intensity of urban well-being and identification of its driving factors are prerequisites for achieving green and sustainable urban development. Our review firstly describes the mutual interactions between the ecological environmental systems and socioeconomic systems, which provides the foundation for the calculation of ecological-well-being, secondly, clarifies related definition and calculation of ecological-well-being, then, analyzes related influencing factors of ecological well-being. Different from other researches focusing on single dimension of well-being evaluation, the large-scale comparison of ecological well-being, and overall analysis of driving factors of ecological well-being. This study steps further by incorporating multidimensional well-being evaluation index, considering local heterogeneous driving factors, and taking one of the most developed urban agglomeration in China as a case. The remainder of this paper is organized as follows. The next section is the literature review. Then, the index evaluation system and methodology, as well as the EIWB formula are introduced. Finally, empirical results, discussion, conclusions, and policy implications of the study are presented.
There are mutual interactions between the ecological environmental systems and socioeconomic systems.9–11 Given the complexity of, and links between ecological, social, and economic systems, sustainable economics holds that an economic system is a subsystem of the ecological system, economic growth is only an intermediary means to promote human well-being, while the ecological system is the material basis and guarantee to provide services and utilities for human beings.12–15 The synergies between ecosystem and social system is the foundation for health and sustainability, which contributes to enhancing human well-being through health values interventions and improvement of ecosystem services and conditions.16,17 The Millennium Ecosystem Assessment systematically illustrates the interacting relationships between ecosystems and human well-being, on one hand, ecosystems underpin human well-being through supporting, provisioning, regulating cultural services, changes in ecosystem services affected all components of human well-being, on the other hand, with changing human conditions of driving, actions for the betterment of human well-being result in the changes of the constituents and determinants of human well-being, thereby influencing the capacity and resilience of ecosystems to deliver services.18–20 Michalos et al.21 vividly characterized the relationship among the domains of well-being using the circular mandala, where well-being is at the core and surrounded by three concentric circles symbolizing different domains, while the external environment circle encompassed and affected all other domains and provided ecosystem resources for sustenance, and there is an interaction among all the circles. Barbier22 further pointed out that the essence of green economic transformation and development is to promote the conservation and sustainable use of ecosystems and their contributions to human well-being. However, whether ecological consumption can be effectively transformed into improving human well-being and whether the decoupling of ecological resource consumption and human well-being needs to be accurately measured.
Ecological well-being is derived from the extension of well-being connotation and the popularization of the ecological movement makes a powerful bridge between nature and society and represents the coordinated relations between ecosystem services, environmental stress, and human well-being.23,24 The calculation of the ecological intensity of urban well-being and identification of its driving factors are prerequisites for achieving green and sustainable urban development. Daly25 first introduced the value quantity of social well-being per physical quantity of ecological environment consumption to characterize ecological well-being. By extending the ratio relationship between ecological environment consumption and well-being, Dietz et al.26 developed the ratio of infant survival to the ecological footprint per capita and the environmental system indicator to evaluate ecological well-being. Prescott-Allen27 developed the Wellbeing/Stress index to reflect ecological well-being performance, where stress is measured by the composite index of ecosystem health, while well-being is measured through the composite index of objective well-being. Similar indicators, including the ratio of satisfaction outputs to environmental input,28,29 the Happy Planet Index (HPI),30 the Environmentally Responsible Happy Nation Index,31 the Index of Environmental Efficiency of Well-being (EWEP),32 the Index of Ecological Well-being Performance (IEWP),33 and the Ecological Intensity of Human Well-being (EIWB)34,35 have been empirically developed to evaluate ecological well-being performance. Moreover, by referring to the input-output evaluation method of ecological efficiency, the single-stage and network data envelopment analysis (DEA) model was used to evaluate ecological well-being efficiency.8,36–38
The relationship between ecological consumption and well-being is complex and varies with the spatio-temporal scale and socio-environmental context. There existed a U-shaped curve relationship between economic growth and ecological well-being performance, ecological well-being performance presented the changing trend of dropping first and then rising.35 It was found that economic growth had relatively little impact on the ecological environment intensity in undeveloped countries.39,40 The relationship between EIWB and the economic development of most central and eastern European countries developed in a sustainable direction.41 The relationship between different types of ecosystem services and human well-being presented a highly heterogeneous form and directionality at different spatial scales in mainland China.42 Kassouri & Altıntaş43 found that a substantial tradeoff is present between human development and ecological footprint in 13 MENA countries. Likewise, Ibrahim et al.44 noted that the socio-ecological system's (SES) efficiency depends on food production and environmental performance in 24 countries of Sub-Saharan Africa. Also, quintile regression proved that human development and SES efficiency are related whereas, female proletariat and carbon emission negatively affect SES efficiency. Moreover, to analyzes the welfare index, which is an indicator of the quality of life, to check if any methodological issues exist in terms of social-ecological and economic sense Yakovenko et al.45 used data from the Voronezh region. In doing so, they identified several groups of factors that can affect the quality of life and the health or wellbeing of the nation. It helps in analyzing the social and ecological wellbeing in the region. Hickel46 tried to correct the problems related Human Development Index (HDI) in terms of ecological limitations. They suggest that the sustainable development index (SHI) is much better than HDI because robustness and sustainability are present in this index. Similarly, Yue et al.47 tests a new indicator called “Sustainable Total Factor Productivity” in 55 countries to determine its convergence and changes. They found that there is a downward trend in total factor productivity growth. Also, 19 countries show positive “Sustainable Total Factor Productivity”, whereas, in 55 states, a steady-state convergence level is noted. Additionally, Leviston et al.48 provided social psychology prospective “Nexus Webs framework” to better understand the nexus between human wellbeing and ecosystem. They pointed out that ecosystem health can also get affected by human wellbeing. Malay49 provided a new method to articulate better the indicators for the gross domestic product (GDP) and financial indicators. They found that conceptual and accounting type articulations are present between hands. Moreover, ecological well-being performance exhibited significantly positive spatial autocorrelation.50,51 Besides, the evolution of ecological well-being performance was influenced by the interactions among the organizational mode of factors and behaviors, including urbanization, globalization, environmental regulation, knowledge capital, etc.52–54
Kohsaka et al.55 applied City Biodiversity Index (CBI) for 14 cities and reported the limitations of CBI, such as, (i) lack of data and scale should be included after deep considerations; (ii) the scores varies across profile of cities and bio-differences; (iii) there is still a large room of advancement in social-ecological dimension; (iv) boarder range and scope of ecosystem need to be extended. Besides, the reduction of urban areas biodiversity may cause the degradation of urban well-being, the CBI can be composited as an aspect of urban ecological well-being evaluation in future study.56,57
Although extensive studies have been conducted on ecological well-being, there are still some gaps to advance. First, studies on ecological well-being focus on a global or national scale, and there are relatively few studies focused on the characteristics of the ecological intensity of well-being at the city level, while cities serve as an important carrier of ecological civilization construction. Second, the linkages between ecological consumption and human well-being are gradually developing, while the spatio-temporal evolution patterns, influencing factors, and driving modes of the EIWB are seldom analyzed from the dynamic process perspective of the contributions of factors. Third, current studies generally adopt single or few composite indicators to quantify ecological consumption and urban well-being, which ignores the multidimensional characteristics of urban well-being and ecological consumption. Therefore, this study takes the Yangtze River Delta as the study area, constructs a comprehensive evaluation index system of ecological consumption and urban well-being, analyzes the spatio-temporal evolution characteristics of urban ecological well-being performance characterized by the EIWB, and identifies the contributing factors and driving modes in the decline of the EIWB. In concise, the main contribution is lying that previous researches generally adopt single or few composite indicators to quantify ecological consumption and urban well-being, which ignores the multidimensional characteristics of urban well-being and ecological consumption. We selects both resources consumption and environmental pollution to characterize ecological consumption. While the comprehensive evaluation index system of urban well-being is evaluated from three dimensions of economic, social, and environmental well-being. Besides, the contributing factors and driving modes of each cities’ ecological well-being is identified from the spatial heterogeneous perspective.
Index evaluation system and methodology
Evaluation index system of urban ecological consumption
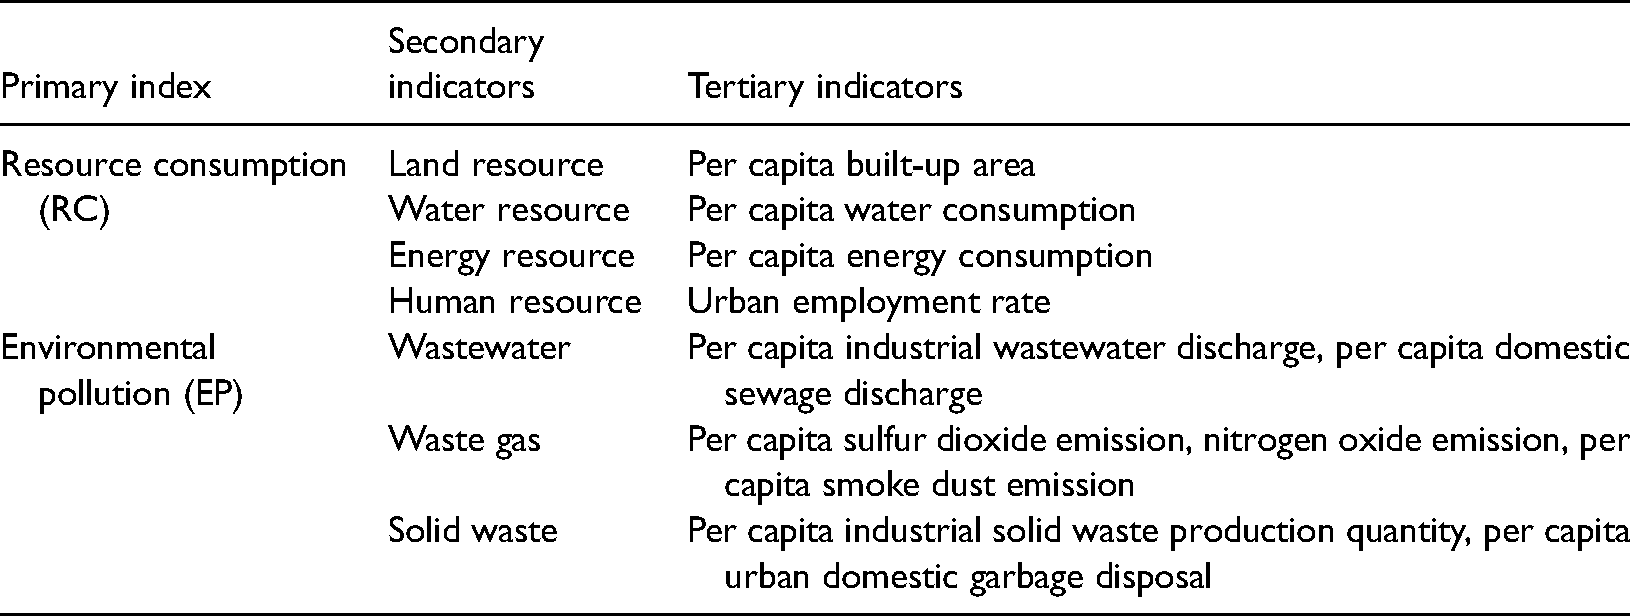
Ecological consumption is synthesized by resource consumption and environmental pollution.35,39 Indicators of land resources, water resources, energy resources, and labor resources are commonly used to characterize resource consumption.58–60 Indicators of wastewater discharge, waste gas discharge, and solid waste discharge are usually selected to characterize environmental pollution.61,62 According to the existing research and the availability of relevant data, this study comprehensively evaluates ecological consumption from both aspects of urban resource consumption and environmental pollution (Table 1). Since few indicators are selected in the tertiary indicators and the secondary indicators are equally important, the entropy-TOPSIS evaluation method is used to evaluate resource consumption and environmental pollution index by performing dimension reduction.
Comprehensive evaluation index system of ecological consumption.
Evaluation index system of urban well-being
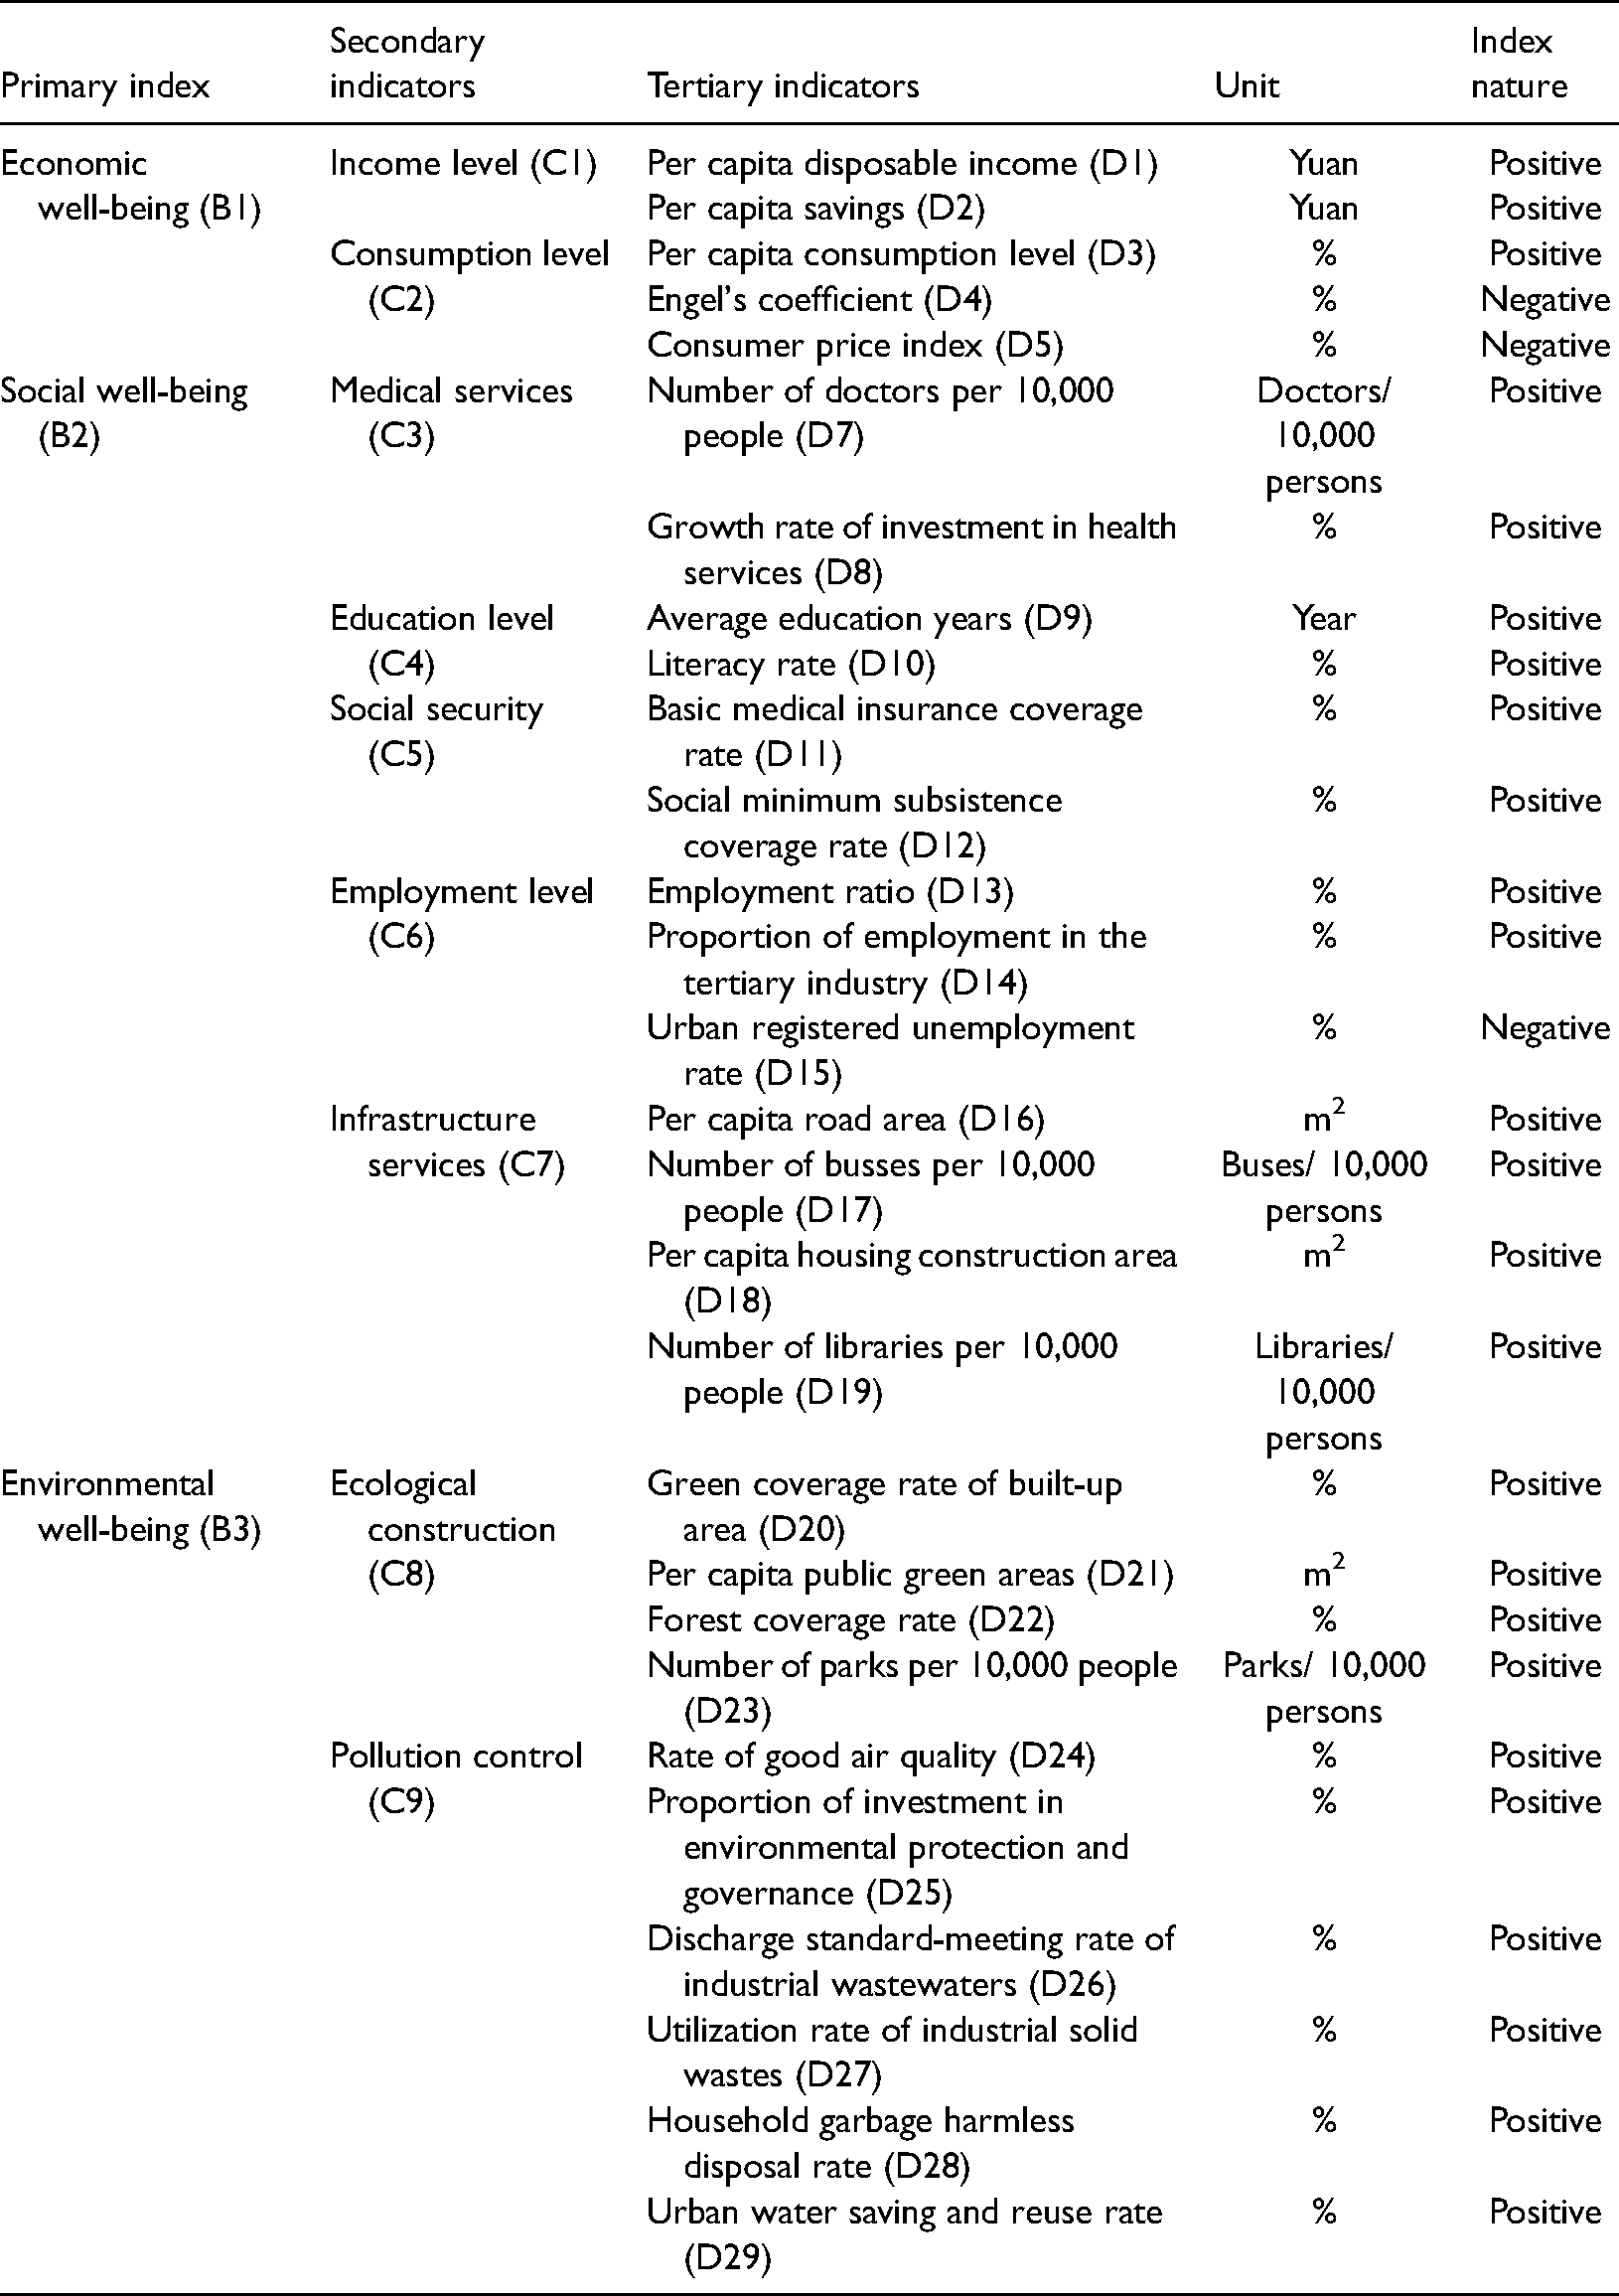
Several indicators of well-being have been proposed, such as the Physical Quality of Life Index,63 the United Nations Human Development Index,64 the Social Progress Index,65 and the Better Life Index,66 etc. The Human Development Index (HDI) is extensively used to measure the well-being level of human development.67,68 In addition, the questionnaire data of personal subjective feelings are also used to evaluate the cognition of well-being, which easily causes statistical bias.69,70 The most effective measurement of well-being is to integrate subjective feelings and objectivity indicators,71 but which cannot be integrated and analyzed from the perspective of spatio-temporal evolution. Therefore, this study mainly uses objective indicators to evaluate the urban well-being level. With the progress of the social economy and the improvement of living standards, residents’ needs tend to be diversified, and the connotation of well-being is increasingly extensive. Accordingly, the measurement of well-being extends to a wealth of indicators such as consumption convenience, transportation accessibility, environmental amenity, entertainment diversity, reasonable housing price, stable employment, and adequate medical care.3,72 It can be judged that urban well-being should be characterized from multidimensional composite indicators. Hence, three dimensions of economic, social, and environmental well-being were constructed to comprehensively evaluate urban well-being levels. After eliminating indicators with a high correlation coefficient, the final indicators are determined, as shown in Table 2. On this basis, the entropy-TOPSIS evaluation method was used to synthesize the tertiary indicators into indexes of economic well-being, social well-being, and environmental well-being, respectively.
Comprehensive evaluation index system of urban well-being.
Entropy—TOPSIS method
The objective of urban well-being evaluation is to identify the development level and contribution degree of the three dimensions of well-being (economic, social, and environmental). TOPSIS is an effective technique for optimizing ranking by calculating the relative distance of alternatives from positive and negative ideal solutions.73 It has the advantages of no special requirement for sample size, not influenced by reference sequence order, and small distortion of information and flexible operation.74 Hence, the combination entropy-TOPSIS method can effectively avoid the influence of the sub-dimension index on urban well-being and rank urban well-being. There are five steps to execute the TOPSIS process.75–76 Step 1: Construct the normalization evaluation matrix. Step 2: Use the entropy weight method to calculate the weight of the normalization indicators and determine the weighted judgment matrix. Step 3: Calculate the negative and positive ideal solutions for the evaluation targets. Step 4: Calculate the Euclidean distance between each target value and the positive and negative ideal solutions. Step 5: Calculate and rank the closeness coefficients of each target.
LMDI decomposition method
The Kaya Identity is adopted to decompose the relationship between EIWB and the effects of resource consumption, environmental pollution, well-being efficiency, technological innovation, economic development, urban scale, and well-being level. The following Kaya Identity with the square term is used to identify the contributions of different factors:77–79
According to the LMDI method, the change effect of 







The calculation of the EIWB
The ecological intensity of well-being can be characterized by the pressure caused by the unit human well-being in the environment. According to this connotation of the ecological intensity of well-being, the ecological intensity of urban well-being could be measured by the ecological consumption needed for the unit urban well-being output, where ecological consumption is composed of natural resource consumption in the ecological system, and environmental pollution is caused by economic activities. The EIWB is a reverse indicator; the higher the value of EIWB, the lower the urban ecological well-being efficiency. The formula is as follows:
Data source
The outline of the plan integrated development of the Yangtze River Delta issued in 2019 points out that the Yangtze River Delta includes the Shanghai, Jiangsu, Zhejiang, and Anhui provinces. Hence, 41 cities were selected as study units based on the administrative divisions of 2018 (Figure 1). The study period was confined between 2000 and 2019 based on data availability. All indicators were derived from the Shanghai Statistical Yearbook (2001–2020), Zhejiang Statistical Yearbook (2001–2020), Jiangsu Statistical Yearbook (2001–2020), Anhui Statistical Yearbook (2001–2020), the statistical yearbook of prefecture-level cities, China City Statistical Yearbook (2001–2018), China Statistical Yearbook on Environment (2001–2018), and the Statistical Bulletin on National Economic and Social Development of prefecture-level cities. To avoid the influence of the dimensions of different indicators, all indicators were preprocessed with per capita, or in terms of proportion. In addition, some economic indicators such as GDP, consumption, and income are converted to eliminate price inflation based on the year 2000. The average education years (AEY) are calculated as
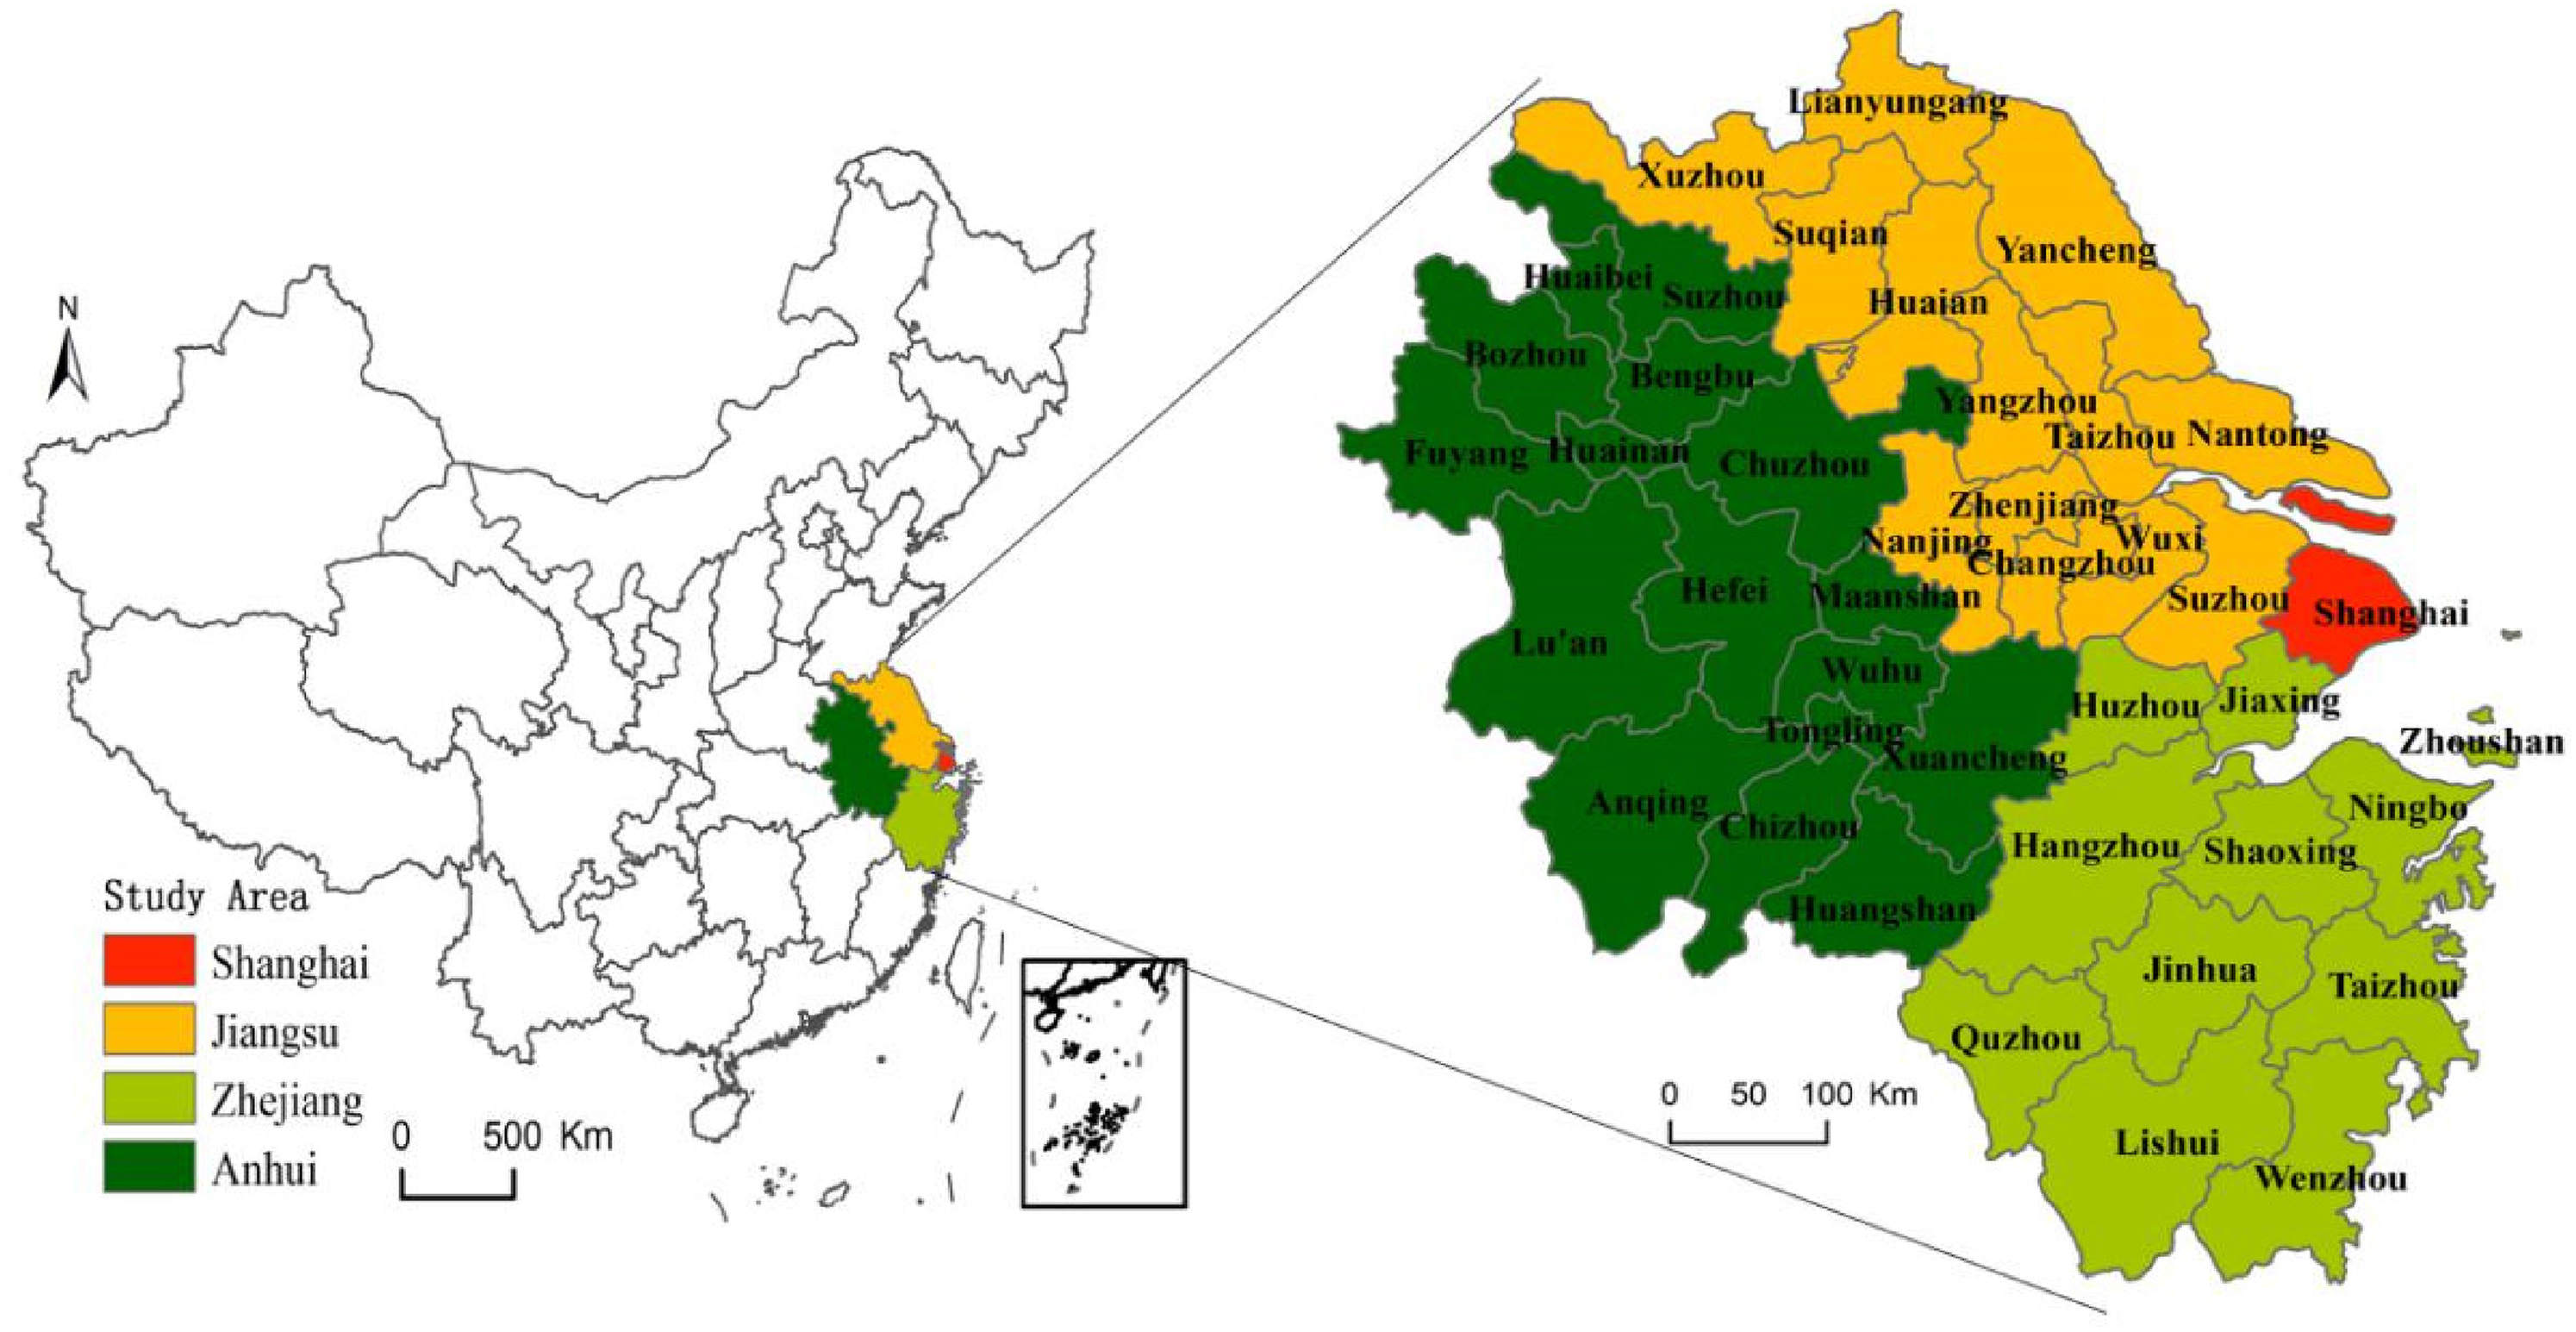
The study area.
Empirical results and discussion
Temporal evolution analysis of regional EIWB
Based on the entropy TOPSIS method, regional EIWB and its sub-dimensions were calculated, as shown in Figure 2. Shanghai maintained the highest EIWB value compared to other regions before 2008, which tended to drop continuously by an annual average rate of 3.77% due to the improvement of the ecological system service efficiency per unit well-being output. The variation in the magnitude of EIWB in Jiangsu was relatively small, declining from 0.280 in 2000 to 0.254 in 2019, with an annual average rate of 0.51%. The EIWB of Zhejiang province tended to decline from 0.307 in 2000 to 0.197 in 2019, with an annual average rate of 2.30%. The EIWB of Anhui province experienced a variation trend of rising first and then dropping with fluctuation, becoming the region with the highest EIWB level.
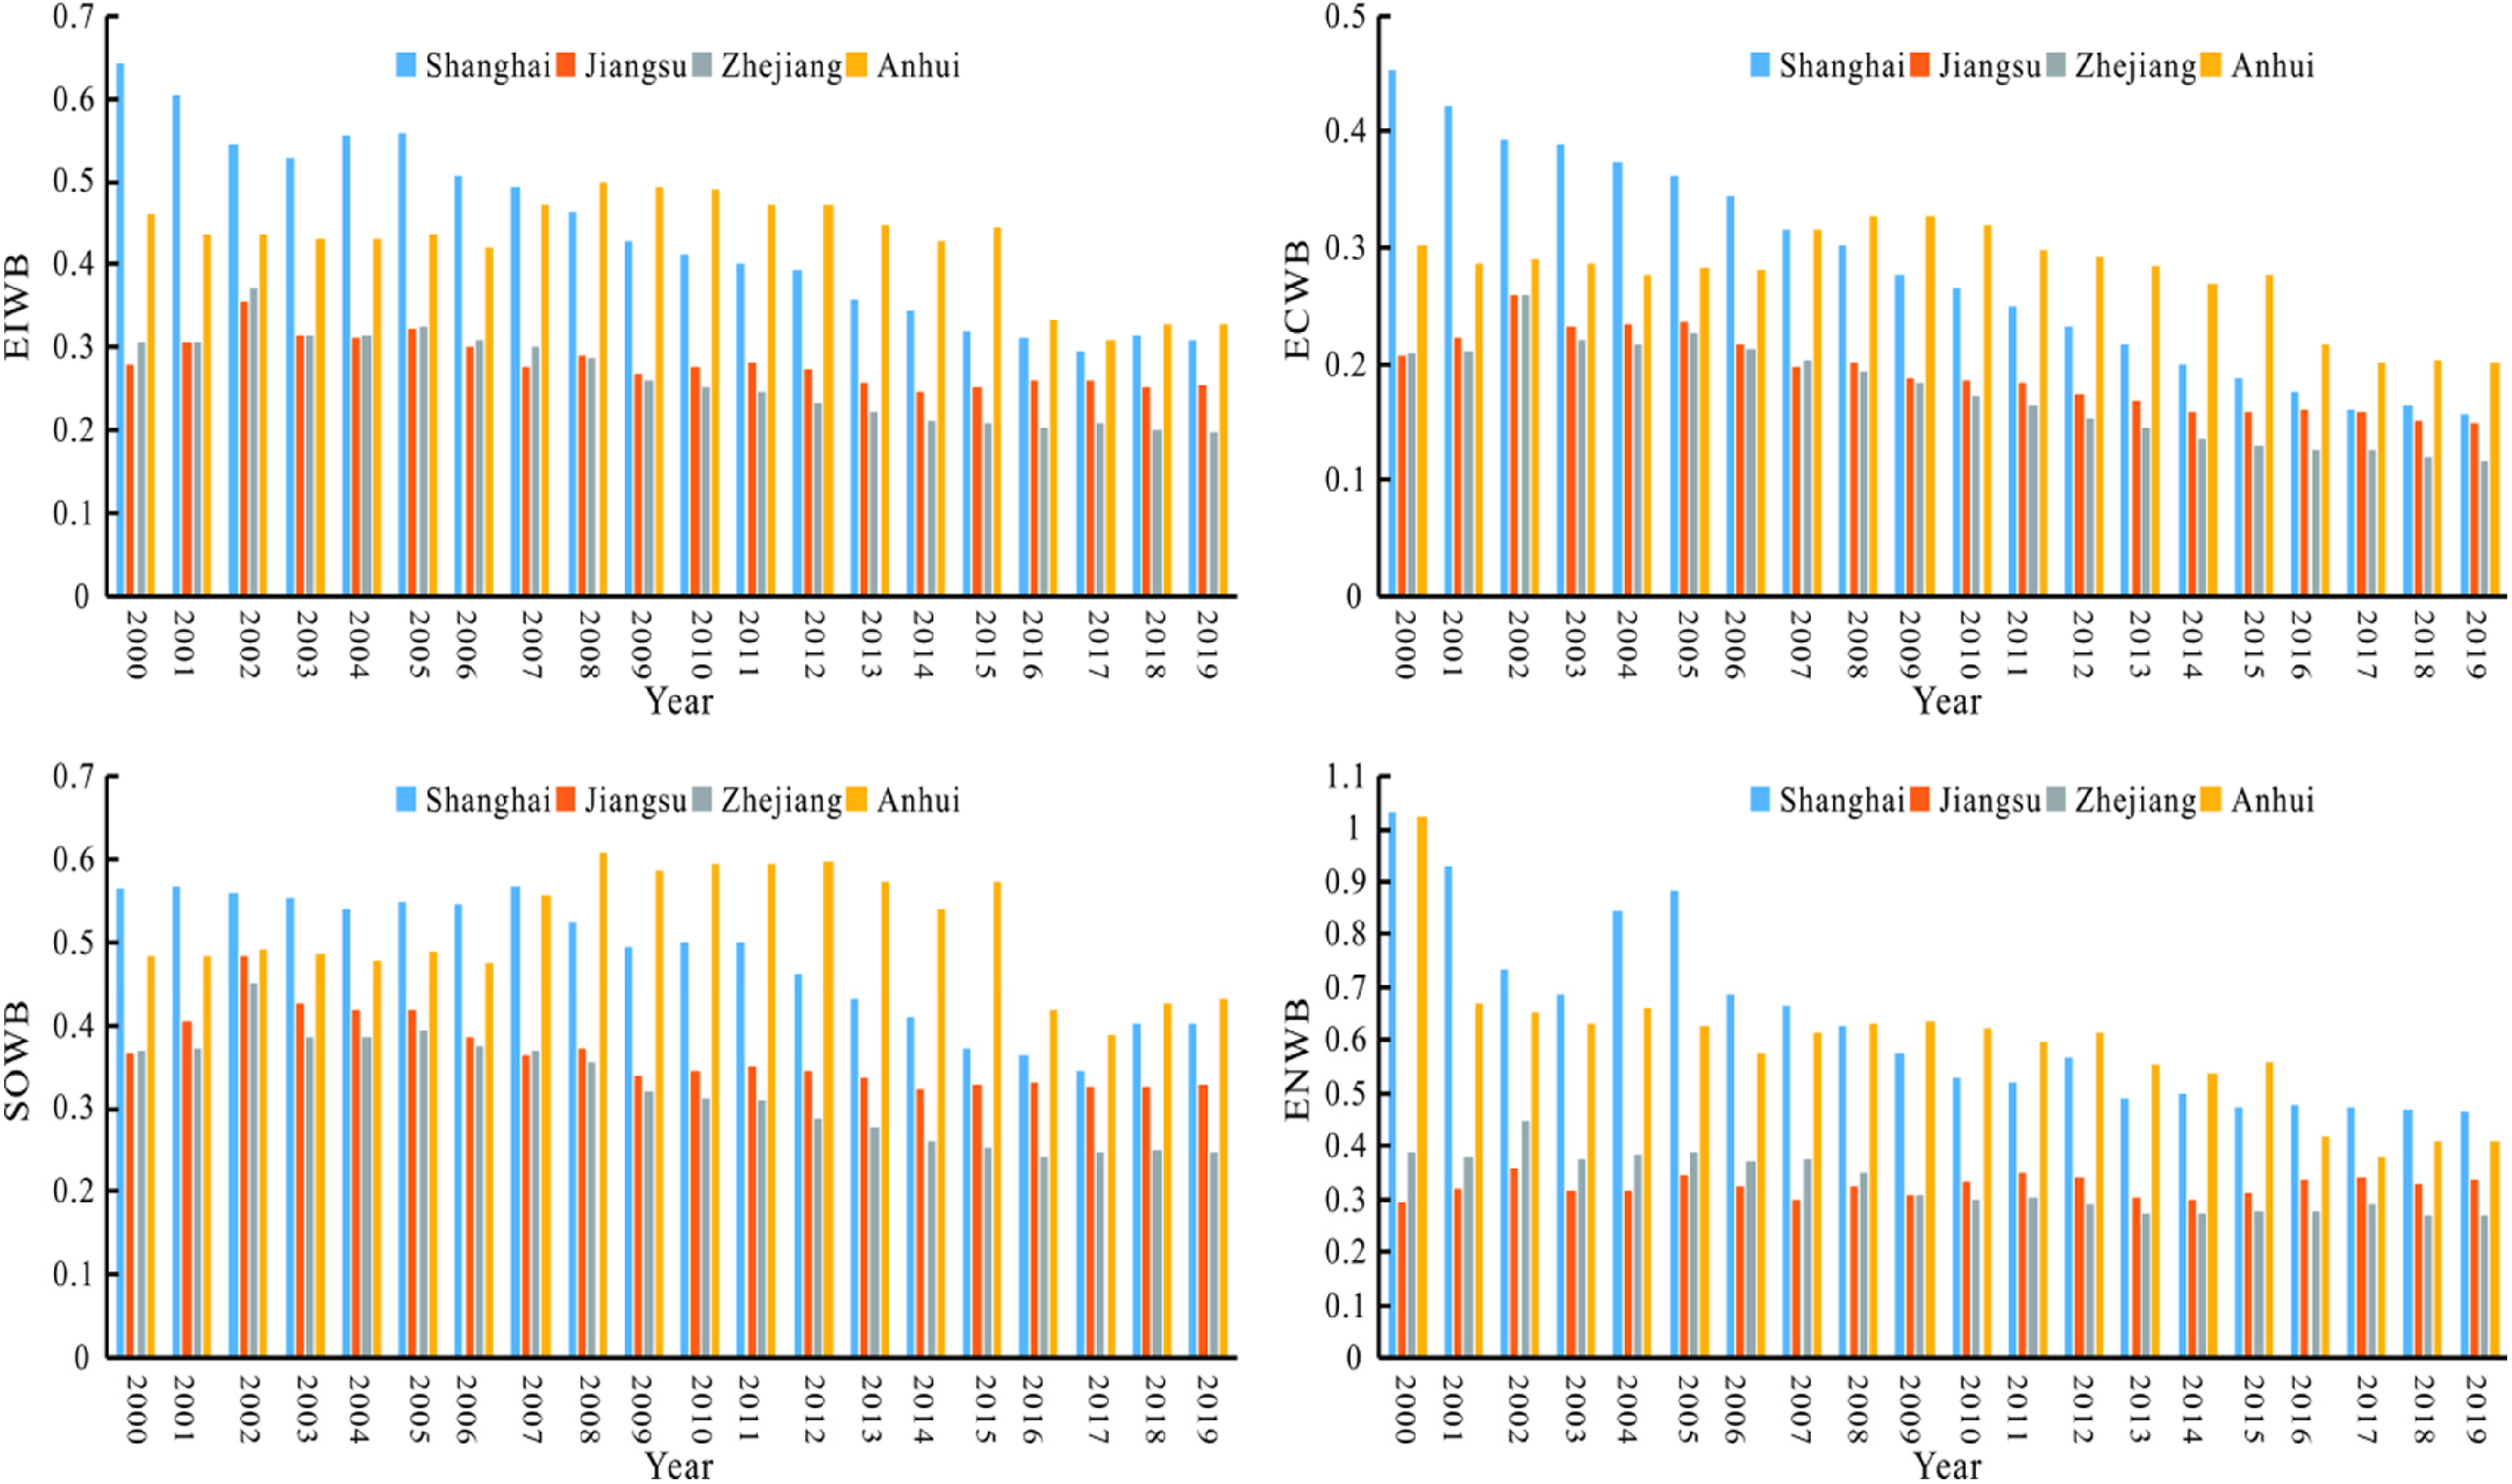
Regional difference changes in the ecological intensity of provincial well-being and its dimensions.
The variation trend of ECWB was generally consistent with that of EIWB; both Shanghai, Jiangsu, and Zhejiang provinces experienced obvious downward trends, except for Anhui province, which first increased and then dropped, which reflected that the level of regional economic development was an important factor that affected the regional difference and temporal variation of regional ECWB. In terms of the SOWB, Shanghai scored the first in the early stages, keeping the highest level of ecological intensity of social well-being, and ushered in a peak period in 2007; however, after 2007, it was substituted by Anhui province. Similar to the variation of EIWB and ENWB, the SOWB of Anhui province showed an inverted U-shaped curve. ENWB was relatively higher than the other dimensions. The ENWBs of Shanghai, Zhejiang, and Anhui provinces have dropped steadily since 2005, with annual average rates of 3.94%, 2.63%, and 2.97%, respectively. Jiangsu province generally experienced an increase at a rate of 0.72%, which was accompanied by sharp rises and falls in fluctuation.
Spatial differentiation analysis of regional EIWB
To facilitate the comparison of regional differences, regional EIWB and its sub-dimensions were divided into five types: higher level (>0.8), high level (0.6∼0.8), medium level (0.4∼0.6), low level (0.2∼0.4), and lower level (≤0.2). The spatial evolution patterns of the five time points in 2000, 2005, 2010, 2015, and 2019 are shown in Figure 3.
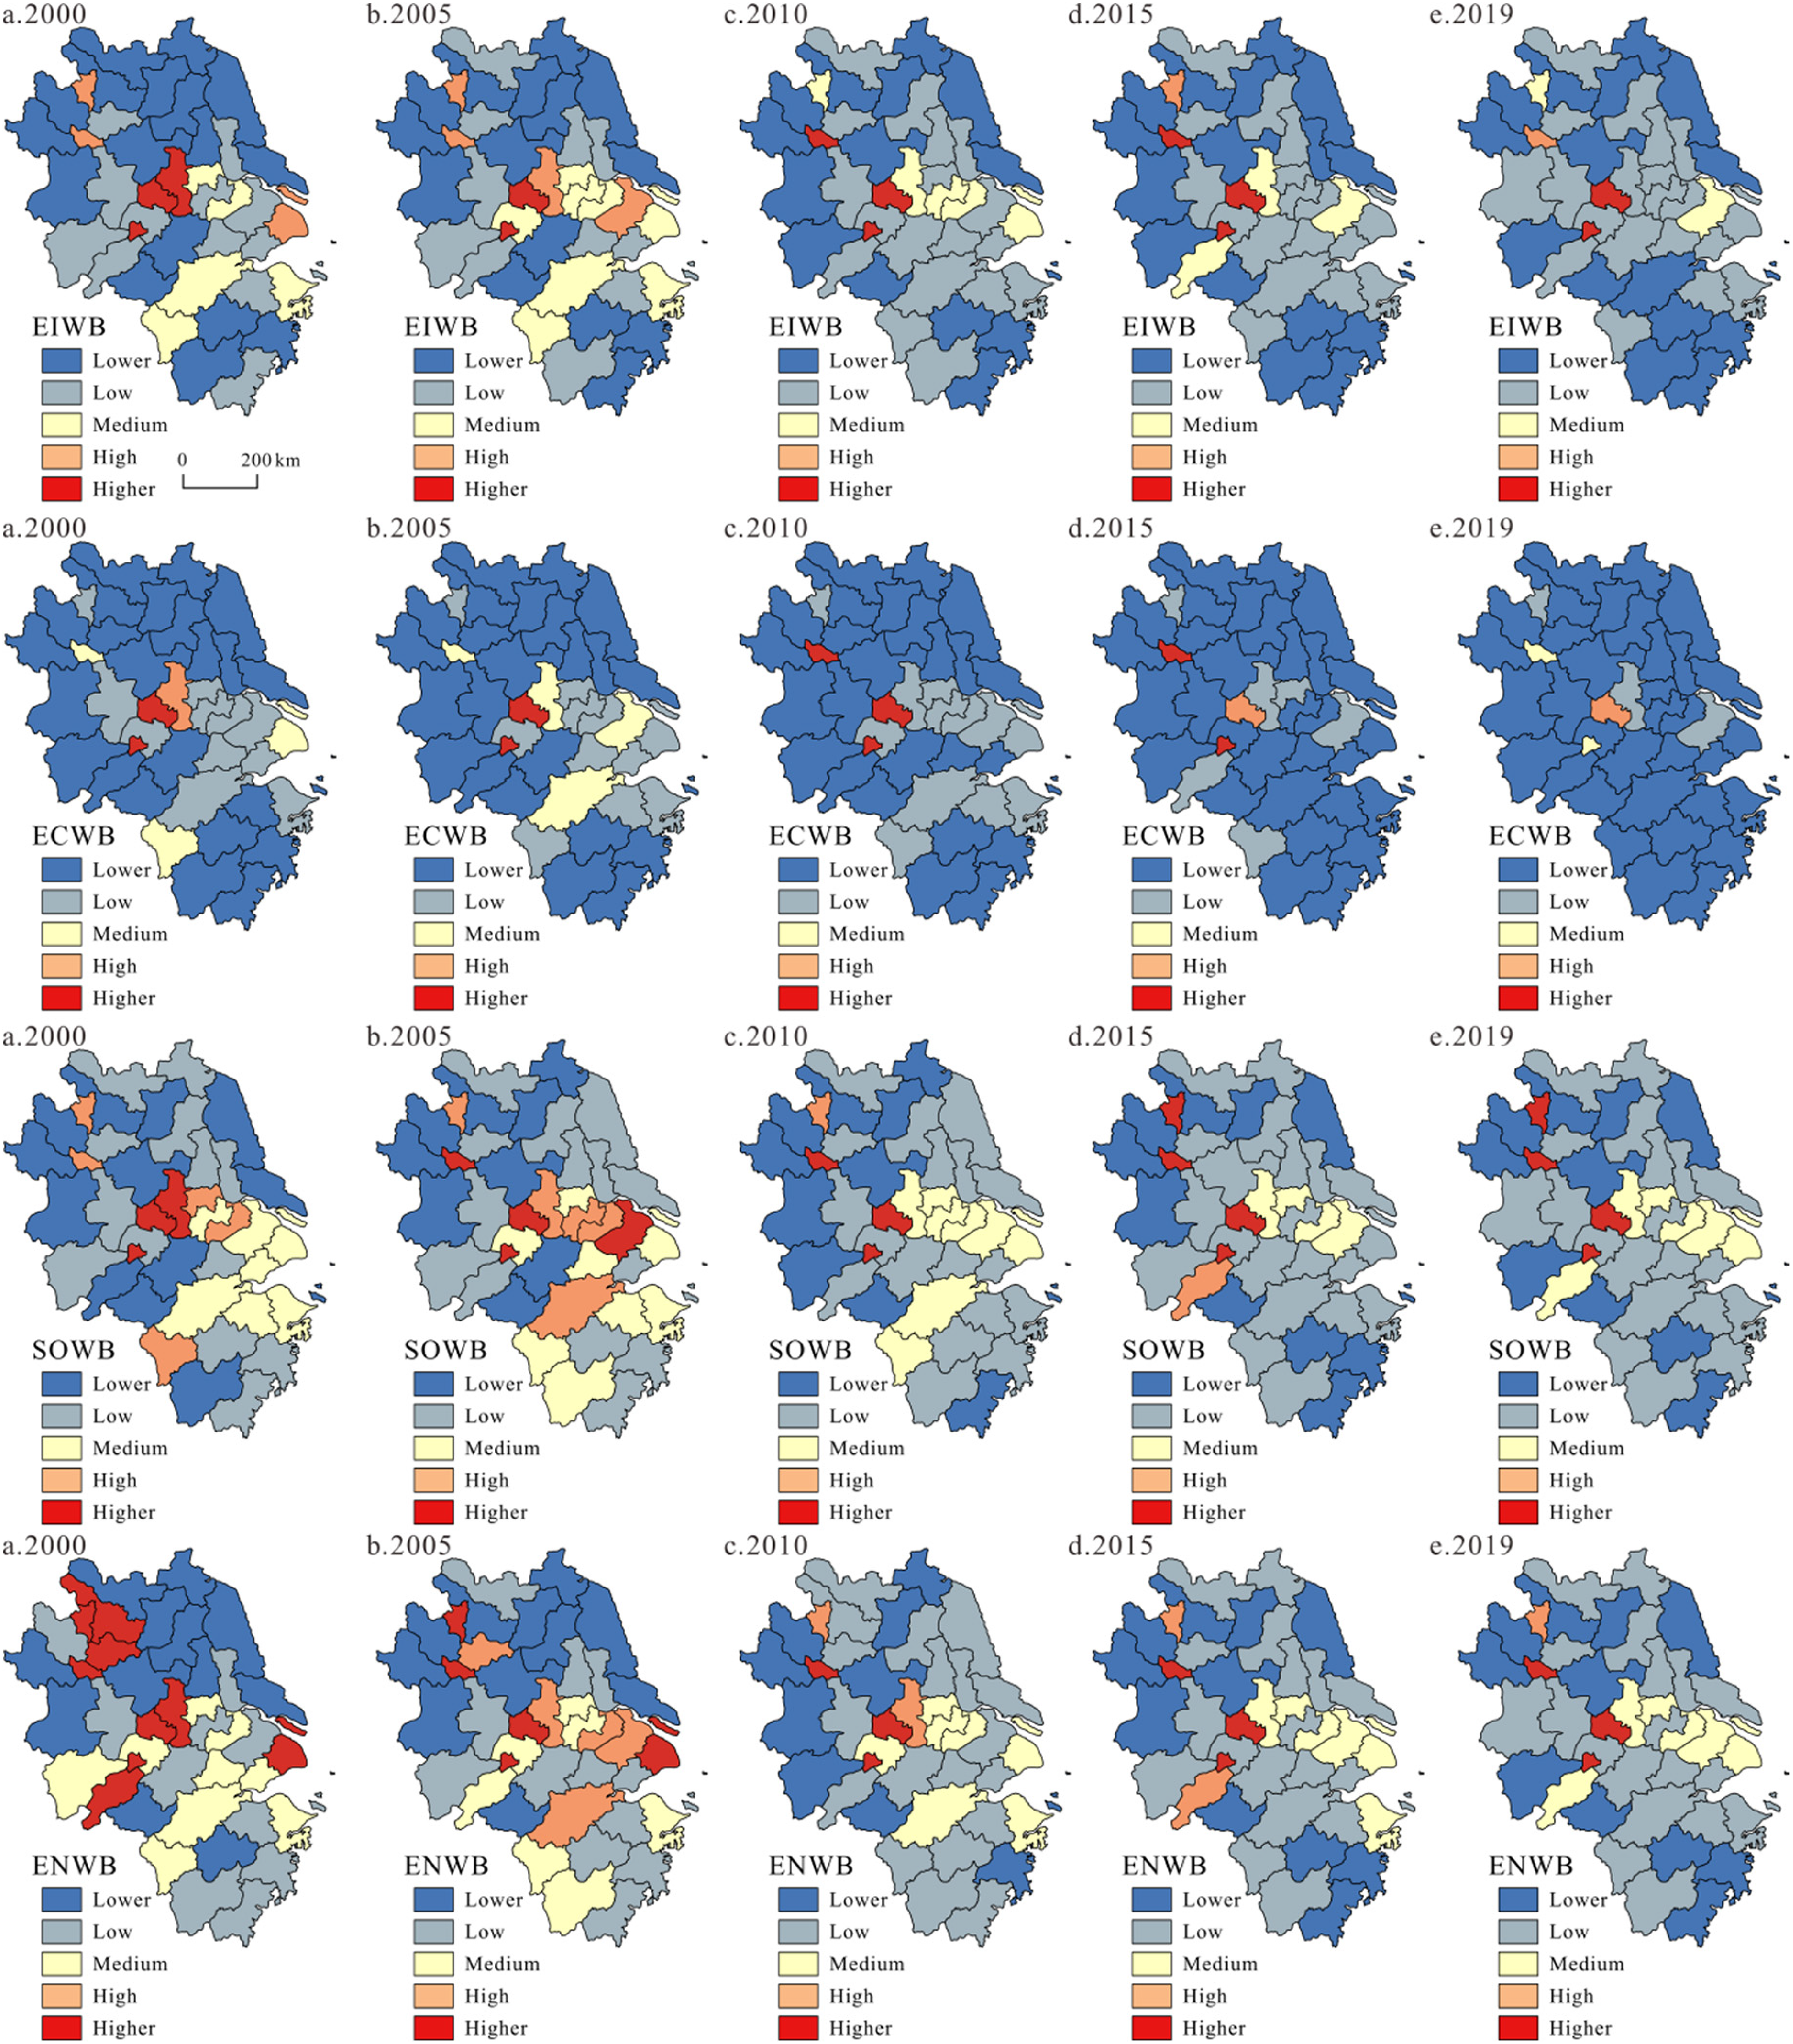
Spatial differentiation pattern of urban EIWB and its sub-dimensions.
Overall, the EIWB of most cities in the Yangtze Delta constantly declined from 2000 to 2019 and was increasingly dominated by the low and lower types. Specifically, in 2000, there were a total of six high and higher level EIWB cities, including Huainan, Huaibei, Ma’anshan, Tongling, Nanjing, and Shanghai, and in 2019, only the resource-type cities of Huainan, Ma’anshan, and Tongling in Anhui province remained high and had higher EIWB because of excessive consumption and extensive utilization of natural resources. These cities had a pattern of high ecological intensity and low well-being. The number of medium EIWB cities decreased from six in 2000 to two in 2019. In 2000, the low and lower EIWB types accounted for 31.71% and 41.46%, respectively, and were mainly distributed in the north of Jiangsu and Anhui provinces and the south of Zhejiang province. In 2019, the number of low EIWB type cities increased, accounting for 48.78%, and the lower EIWB type accounted for 39.02%. The total proportion of low and lower types was as high as 87%, which suggested that most cities had decoupled economic growth from ecological consumption and brought more social welfare.
The spatial pattern of ECWB was increasingly dominated by the lower type, with the proportion of lower-type cities increasing from 58.54% in 2000 to 85.37% in 2019. Ma’anshan evolved from a higher ECWB type to a high ECWB type, Tongling transformed from a higher ECWB type to a medium ECWB type, while the ECWB of Huainan fluctuated from medium type to higher type, and then dropped into medium type in 2019. Only Huaibei, Suzhou, and Nanjing were attributed to low-type ECWB in 2019. It could be judged that the efficiency of the transformation of economic growth to well-being level became higher than the growth rate of ecological consumption, and the efficiency of ecological well-being had been effectively improved.
With the improvement of social services such as medical health, education level, infrastructure construction, and employment, social well-being tended to improve in all cities; the low and lower SOWB types accounted for 75.61% of the region in 2019. The medium, high, and higher SOWB types were primarily distributed in the south of Jiangsu province, and in the north of Zhejiang province before 2005, then shrunk to the south of Jiangsu province, while the resourced-based cities including Huainan, Huaibei, Ma’anshan, and Tongling in Anhui province, remained at a higher level due to the low transformation efficiency of production to social services. The low SOWB type gradually became the dominant mode, accounting for 31.71% in 2000 to 48.78% in 2019. The lower-type SOWB cities tended to decrease from 13 in 2000 to 11 in 2019 and were mainly concentrated in the economic development level of backward marginal cities.
The ENWBs of various cities have declined greatly since 2000 due to the effective ecological environment construction and environmental protection that created a good living environment for urban residents and effectively improved the environmental well-being efficiency. Specifically, cities belonging to the medium, high, and higher ENWB types decreased from 18 in 2000 to 10 in 2019 and were mainly distributed along the Yangtze River Basin and the resource-based cities in the north of Anhui province. The spatial scope of low-type ENWB cities changed from the initial concentrated distribution in the north of Jiangsu province to a scattered distribution in the marginal and adjacent cities of the province. The number of low-type ENWB cities increased from 26.83% in 2000 to 48.78% in 2019, becoming the dominant type. Generally, the environmental well-being efficiency of cities in Zhejiang province was higher than that of most cities in the Anhui and Jiangsu provinces.
Analysis of the driving effect of the variation of EIWB
According to the LMDI decomposition procedure, the driving factors for the overall ecological intensity of well-being in the Pan-Yangtze River Delta region from 2000 to 2019 were decomposed. Since ecological intensity is a reverse indicator, the relative contribution rate of each factor was reversed by multiplying the negative 1.
The decomposition results were then calculated and plotted (Figure 4). Resource consumption intensity exhibited a positive driving effect on the variation in EIWB, and the average annual contribution rate was 75.76. Although its contribution rate generally increased year after year, the inter-annual growth rate was relatively slow. This was due to social and economic progress and the promotion of cleaner production, recycling, and utilization technology, effectively improving resource utilization efficiency, reducing resource consumption, and weakening the positive contribution of the resource consumption intensity since 2016, which contributed to the decrease in EIWB.
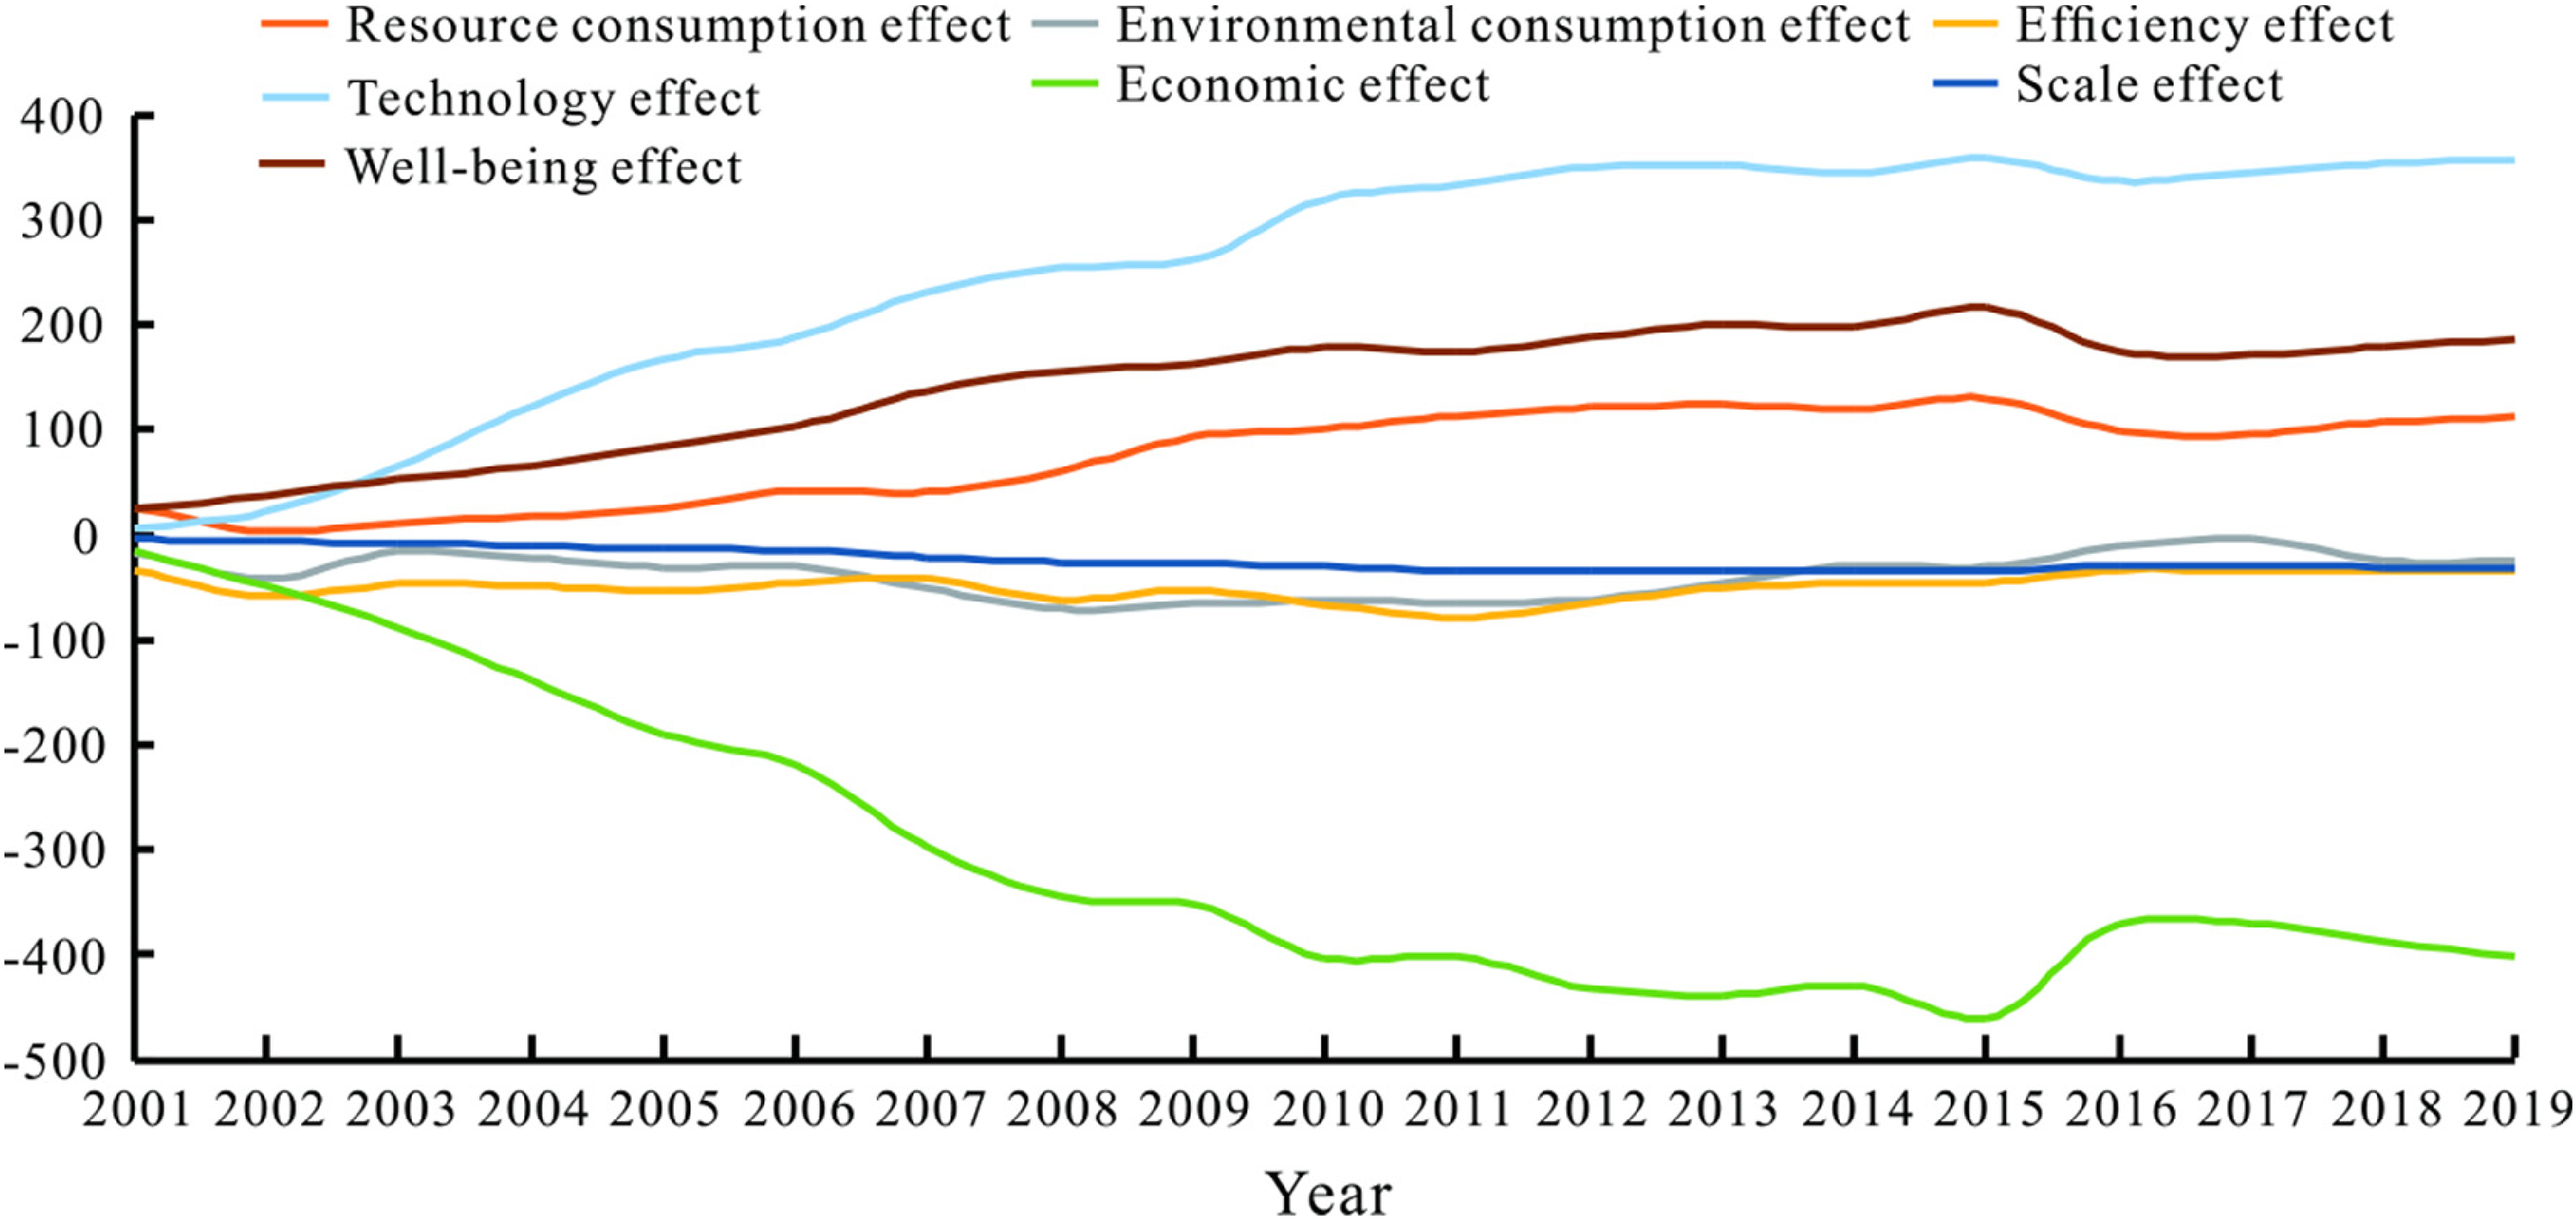
The variation of different factor's contribution rate to regional EIWB in the Yangtze River Delta from 2000 to 2019.
Environmental consumption intensity had a negative impact on the variation in EIWB, and the average annual contribution rate was −37.14. This was due to the formulation of strict environmental control policies and the implementation of effective environmental pollution prevention measures, thus greatly reducing the negative environmental impacts caused by environmental pollution.
The contribution direction of well-being efficiency on the EIWB was negative, and the average annual contribution rate was −49.15. With the development of the social economy and the promotion of ecological civilization construction, urban economic, social, and environmental well-being has improved, which reduces ecological consumption per unit of well-being output, thus raising ecological well-being efficiency and decreasing EIWB.
The contribution of the technology effect to EIWB was positive and gradually enhanced, with an average annual contribution rate of 250.70. This technology effect was characterized by the ecological consumption per unit of GDP output and was a reverse indicator. Although the ecological consumption per unit of GDP output decreased constantly since 2000, the acceleration of urbanization and agglomeration of mass production and living activities consumed large amounts of resources, produced large amounts of waste, and exacerbated ecological environmental pressure, which promoted the increase of EIWB.
The economic effect exhibited a negative and enhanced impact on EIWB, with an average annual contribution rate of −304.70. With the continuous improvement of the economic development level, the improvement of income and consumption level brought residents greater material satisfaction and improved the overall quality of life and satisfaction of residents. In addition, urban infrastructure construction and people's livelihood security system have been improved, and the research and development of cleaner production technology have been invested, which has contributed to the decrease in EIWB.
The scale effect had a negative impact on EIWB, but its impact intensity was low, with an average annual contribution rate of −24.13. This was due to the agglomeration effect, scale economy, and resource reallocation effect brought about by population agglomeration offsetting the resource consumption and environmental damage effect. In addition, the process of population urbanization promoted the transformation of economic society and improved consumers’ demand for environmental quality, which had a positive impact on residents’ green consumption behavior, the government's environmental regulation behavior, and enterprises’ green production behavior.
The well-being effect had a gradually enhanced positive effect on EIWB, with an average annual contribution rate of 141.49. This well-being effect was the reciprocal of the well-being level and was a reverse indicator. During the entire study period, the well-being level tended to increase year by year; thus, the well-being effect tended to decrease year by year and made an increasingly important contribution to the variation of EIWB.
Analysis of the dominant driving mode of regional EIWB
The absolute contribution rates of different effects were calculated based on the LMDI decomposition of cities EIWB. The relative contribution intensity was divided into four types: lower (0%–10%), low (10%–20%), high (20%–30%), and higher (>30%). The spatial difference pattern of contribution intensity is mapped in Figure 5 (because the contribution intensity of the scale effect was lower than 10%, it was not mapped). The lower and low contribution intensity types of the resource consumption effect accounted for 78.05% and 17.07%, respectively. Only Taizhou (Jiangsu) and Ma’anshan City were considerably driven by the resource consumption effect. High and higher contribution intensity types of environmental consumption effect were mainly distributed in the north and south of Anhui province and the south of Zhejiang province, including Jinhua, Suzhou (Anhui), Fuyang, and Lishui city. The contribution intensity of the efficiency effect was generally lower than 30%, among which the cities with the lower type accounted for 80.49%, while the contribution intensity of the efficiency effect in Jinhua city is approximately 27.70%. The contribution intensity of the technology effect was relatively high, with high and higher types accounting for 24.29% and 36.58%, respectively. The high and higher types were distributed downstream of the Yangtze River and in the southeast coastal cities, most of which had experienced a relatively high level of economic development. The contribution intensity of the economic effect was generally high, with higher type accounting for 65.85%, and only Hangzhou and Jinhua city belonged to low and lower types. The contribution intensity of the well-being effect was lower than 30%, and there were seven low-type cities distributed in the Anhui province.

Spatial pattern of the contribution intensity of different effects to EIWB in the Yangtze River Delta.
To further reveal the heterogeneous driving mode of the city's EIWB, the least square error (LSE) method was used to extract the dominant driving factors, and the driving modes of single, two-factor, three-factor, and four-factor were obtained, as shown in Table 3.
The driving modes and factors of regional EIWB in Yangtze River Delta.

Note: A, B, C, D, E, and F denote the resource consumption, environmental consumption, efficiency, technology, economy, scale, and well-being effects, respectively. The order of the letters represents the size of contribution rate.
Suqian city was dominated by a single economic effect that contributed approximately 67.62%. Suqian had made great achievements in economic development with an average annual GDP growth rate of 11.56% and formed an industrial structure dominated by the tertiary industry, which consumed fewer resources, produced less environmental pressure, and accumulated more economic, social, and environmental well-being.
Cities belonging to the two-factor dominance mode accounted for 56.10% and could be divided into two types. The first type of city was jointly dominated by economic and technology effects, which could be further divided into two categories: cities with dominant technology effects, including Shanghai, Wuxi, Suzhou, Nanjing, and Hefei, and cities with dominant economic effects, including Anqing, Zhoushan, Huaibei, Huzhou, Jiaxing, etc. Taking Shanghai as an example, Shanghai was the most developed city in the Yangtze Delta region and had taken the lead in entering the post-industrial stage, characterized by the optimization of industrial structure and a high level of technical innovation. Benefiting from rapid economic development and the improvement of technological innovation capacity, Shanghai achieved a gradual decline in EWIB from 0.641 in 2000 to 0.309 in 2019. The second type of city was dominated by economic, resource consumption, economic, and environmental pollution effects, which were represented by Huai’an and Fuyang, respectively.
Nine cities belonged to the three-factor dominance mode. The cities of Xuancheng, Chuzhou, and Tongling are jointly driven by economic, environmental pollution, and efficiency effects, while Huangshan, Taizhou, Chizhou, and Yancheng city are jointly influenced by economic effects, resource consumption, and technology effects. These cities were dominated by economic effects. Due to the resource-dependent economic growth mode, Ma’anshan was driven by resource consumption, technology, and economic effects. Due to heavy water pollution, soil pollution, and air pollution, Jinhua was mainly influenced by environmental pollution, efficiency, and technology effects.
In the four-factor dominance mode, the contribution rates of the four driving factors tended to be balanced. However, there were still some differences, where the variation of EIWB of Hunan, Lishui, Lu’an, Bozhou, and Bengbu was mainly driven by economic effects, while the variation of EIWB in Taizhou, Suzhou, and Hangzhou was dominated by resource consumption, environmental pollution effect, and technology effect, respectively.
Discussion
Compared with the existing studies, this study aimed to identify whether the improvement of urban ecological well-being in rapid urbanization areas was dominated by ecological consumption or the well-being conversion efficiency of economic growth, comprehensively evaluate urban well-being from three dimensions: economy, society, and environment, and dynamically and spatially analyze the driving factors of urban ecological well-being performance improvement process. Although the EIWB in the Yangtze River Delta has exhibited a continuous downward trend since 2000, illustrating the gradual decoupling between ecological resource consumption and well-being improvement, the ecological consumption effect, especially the excessive resource consumption effect, tended to be enhanced, which would offset the positive contribution of economic growth and impair the well-being level. Similarly, the improvement in ecological well-being performance of most cities was dominated by the economic growth effect but was also accompanied by high resource consumption and low well-being output efficiency, meaning that most cities were on the verge of the well-being threshold of economic growth. This was due to the rapid economic growth being exchanged under the extensive economic growth model characterized by high resource consumption, high energy input, high environmental pollution, and low benefit. This has caused urban development to suffer from traffic jams, housing shortages, rising prices, air pollution, and other urban diseases, and resulted in urban residents facing survival pressure, ecological pressure, and health crises. Moreover, due to the declining marginal utility of economic growth and the loss of accumulated material wealth converted into urban well-being, the rise in urban well-being levels did not keep pace with rapid economic growth, and most cities encountered the well-being threshold to varying degrees.
There exists a heterogeneity ability to improve urban well-being performance between developed and underdeveloped cities. Although the ecological intensity of well-being was equally subordinate to a low-level type, the spatial distribution of the constituents and determinants of well-being was grossly unequal. With the use of clean production technology, the improvement of energy efficiency, and more attention to improving urban well-being constituents, developed cities will achieve a continuous decline in the ecological intensity of urban well-being. While the economic growth of undeveloped cities exerts less environmental pressure, it has a limited effect on improving the level of urban well-being components. Hence, it is foreseeable that with the increasing convergence of high-quality resources into developed cities, the unbalanced geographical pattern of urban ecological well-being performance will further differentiate.
It is necessary to realize that there are still some limitations to this study. First, due to the restriction of data availability and the lack of a uniform evaluation standard for well-being and ecological consumption, the index system selected herein may not be accurate and affect the objective accuracy of the evaluation results. Moreover, the objective well-being evaluation system adopted in this study ignores subjective feelings and cognitive evaluations of individual perception. Hence, the combination of subjective and objective well-being is more suitable for a comprehensive evaluation of urban well-being in future research. Besides, the biodiversity index can be used as an aspect of urban ecological well-being evaluation. Second, due to geographic proximity and similarity of socioeconomic conditions, the ecological intensity of urban well-being may exhibit significant spatial dependance, and the present analysis of spatial patterns and decomposition effects of regional EIWB does not take into account spatial autocorrelation; for further study, it can introduce spatial econometric methods to identify the spatial spillover of EIWB. Besides, the ecological intensity of economic well-being, social well-being, and environmental well-being can also be decomposed by means of LMDI to discern the impediment of ecological well-being performance.
Conclusions and recommendations
Conclusions
In contrast to neoclassical economics or traditional economics, the ecological consumption and the conversion of ecological consumption into well-being level through the economic system are considered as the two important driving factors of the change in well-being level, the contribution and effect of these two factors in the change of well-being levels in the Yangtze River Delta urban agglomeration since the new century was analyzed using the LMDI factor decomposition method. The following conclusions were drawn.
Regional EIWB and its sub-dimensions all presented a trend of decline to different degrees each year. In Shanghai, due to the gradual decrease in the natural capital consumed per unit well-being output and the decoupling of well-being and ecological consumption, the EIWB and its sub-dimensions all showed an obvious decreasing trend. In Jiangsu province, the EIWB presented a fluctuating downward trend due to the improvement of social well-being, lagging behind the growth rate of ecological consumption, and a gradual increase of ENWB. In Zhejiang province, the EIWB and its sub-dimensions generally dropped, except in 2002 and 2005. In Anhui province, the EIWB, ECWB, and SOWB tended to increase until 2015, and then decreased in recent years, while the ENWB presented a fluctuating downward trend. The EIWB of all cities tended to decrease and evolved into the dominant types of low and low levels. Urban ECWB experienced a relatively fast annual declining rate and was increasingly dominated by the lower type. The evolution of urban SOWBs exhibited large fluctuations; the medium, high, and higher types mainly clustered around the axis of Nanjing, Shanghai, Hangzhou, and Ningbo before 2010, and then were dominated by the low type since 2010. The differentiation pattern of urban ENWB changed greatly, with the lower type evolving upward into low type, with high and higher types evolving downward into low and medium types, and then was dominated by the low urban ENWB type. The LMDI decomposition showed that the decrease of regional EIWB in the Yangtze River Delta region was distinctively inhibited by resource consumption, technology, and well-being effects, and was mainly driven by the sustainable enhancement of economic effects, and was almost unaffected by environmental consumption, scale, and efficiency effects. The contribution intensity of different effects to urban EIWB exhibited a few agglomerated flake-shaped and block-shaped distribution characteristics in space. The variation in urban EIWB was mainly driven by two-factor dominance, featuring economic and technological effects, while the economic effect usually tended to be more dominant.
Recommendations
Improving urban ecological well-being performance is necessary to achieve high-quality integration development in the Yangtze River Delta, and potential policy recommendations are proposed as follows.
To avoid suffering from urban well-being threshold, The Yangtze River Delta should strive to foster a fair, orderly, and equal development pattern featuring the coordination of government allocation, fair market competition, and social transfer payments, to transform the economic growth mode from extensive GDP-oriented growth to smart development-oriented growth to the quality of life, and to transform the consumption mode from a materialistic consumption pattern to a functional consumption pattern. To give full play to the positive effect of economic growth and inhibit the negative impact of resource consumption, it is necessary to promote economic efficiency by using clean, low-carbon, and green production technology and improving green technology systems; it is necessary to optimize the structure of energy utilization and increase the efficiency of energy utilization through the recycling of renewable energy, conserving energy, and reducing emissions. Simultaneously, it is necessary to minimize the environmental consumption of per unit well-being output by strengthening environmental pollution regulations and developing environmental pollution control technology. Under the basic principle of improving people's well-being as the ultimate goal, the government should incorporate well-being performance, ecological and environmental protection, and governance effectiveness into the performance assessment and evaluation system of local governments. Local governments need to strengthen social security and improve people's livelihoods. In particular, southwest Anhui, northern Anhui, north Jiangsu, and other undeveloped cities should further improve residents’ education, employment, health care, pension, housing, and other material and non-material conditions, compensate for the shortcomings of residents’ livelihoods, and improve the sense of well-being of residents. In addition, it is necessary to construct a coordinated supervision system for the ecological environment and strengthen the networked co-governance and co-protection of the ecological environment, as well as narrow regional well-being gaps to promote ecological and green integration development demonstration zones in the Yangtze River Delta.
Footnotes
Acknowledgements
We thank the academic editors and anonymous reviewers for their kind suggestions and valuable comments.
Declaration of conflicting interests
The author(s) declared no potential conflicts of interest with respect to the research, authorship, and/or publication of this article.
Funding
This work was supported by Humanities and Social Sciences Youth Foundation, Ministry of Education of the People's Republic of China (NO. 20YJCZH080), Social Science Foundation of Jiangsu Province (NO. 20SHD009), the Yangzhou University Qing Lan Project, and the Yangzhou Lv Yang Jinfeng Project in 2021.
ORCID iD
Suleman Sarwar https://orcid.org/0000-0002-4791-0293
Zaijun Li 