



Abstract
This paper takes Jiangsu as an example to measure the carbon emissions from the electric power industry from 2002 to 2017, builds an extended STIRPAT model to quantify its driving factors, and uses the Monte Carlo method to simulate the evolution of carbon emissions in multiple scenarios from 2018 to 2030. The results show that: (1)Population scale, urbanization level, GDP per capita, industrial added value, and electricity consumption intensity promote the increase of carbon emissions in the electric power industry. (2)Trade openness and the transmission level of other provinces play a role in reducing carbon emissions. (3)Under the baseline scenario and the green development scenario, the carbon emissions of the electric power industry have shown a continuous growth trend, but the growth rate of carbon emissions has slowed down significantly under the green development scenario.
Introduction
According to the Emissions Gap Report 2020, 1 the world is heading for a 3.2°C temperature rise this century. Since global warming has a profound impact on economic development and human health, taking urgent action to deal with it has been listed as a sustainable development goal. China, the country with the largest carbon dioxide emission at present, actively responds to climate change. At the seventy-fifth UN General Assembly, President Xi Jinping promised that China would strive to achieve the peak of carbon dioxide emissions by 2030 and achieve carbon neutrality by 2060. According to Responding to Climate Change: China‘s Policies and Actions, 2 to strengthen green transformation, China incorporated the response to climate change into national economic and social development plans, curbed the haphazard development of high-emission projects, and promoted industry systems for efficient energy conservation. The role of the market was also attached with great importance. On July 16, 2021, the national carbon market started online trading, involving 2162 power generation companies and 4.5 billion tonnes of carbon dioxide emissions. China's carbon neutrality strategy of 2060 not only promotes its own high-quality development, but also provides powerful impetus for global climate governance.
During the period of 1978–2018, China's GDP grew at an average annual rate of 9.4 percent in real terms, and energy consumption and environmental pollution were behind the rapid growth in the economy, the average annual growth rate of electricity consumption in the same period was 8.65%. According to the calculation, the annual growth rate of carbon emission in China's electric power industry was 7.91% from 2000 to 2017. Therefore, the work of emission reduction in China's electric power industry is facing great pressure. Jiangsu, the country's second largest power generating province, generated 491.474 TWh electricity in 2017, with coal fired power accounting for 92.17 percent of the total, according to the National Bureau of Statistics of the People‘s Republic of China. Although it meets people's demand for electricity, this has resulted in 353.5287 million tons of related carbon emissions. Therefore, it is necessary to accurately identify the driving factors of the historical evolution of carbon emissions, simulate the potential evolution trend of carbon emissions in the future, and formulate emission reduction policies with operability.
Many scholars have carried out relevant research on the factors affecting carbon emissions in electric power industry. Table 1 shows the main characteristics of representative literature. From the perspective of the research area, it is mainly concentrated in China as a whole and provinces. From the perspective of research methods, it can be summarized as index decomposition model, structural decomposition model and econometric model. Among them, as the optimal decomposition method in the index decomposition method, the Logarithmic Mean Divisia Index (LMDI) method is widely used in the study of factors affecting carbon emission changes in the electric power industry. There are few other index decomposition methods. Yan et al. 3 adopted Generalized Divisia Index Model (GDIM) to decomposing the factors affecting carbon emissions in China's electric power industry. Steenhof 4 adopted the Laspeyres decomposition method to decomposing the influencing factors of China's electric power industry carbon emission intensity changes from 1980 to 2002 into generation mix, fossil fuel mix, energy efficiency of generation, transmission and distribution losses, and auxiliary consumption of power. Compared with the index decomposition method, there are relatively few literatures using econometric methods and structural decomposition methods to study the factors affecting carbon emissions in China's electric power industry. Zhao et al. 5 used the co-integration model, Meng et al. 6 constructed the logarithmic linear equation, Yan et al. 7 and Cui et al. 8 both constructed the STIRPAT model to study influencing factors of carbon emissions in China's electric power industry. Luo et al. 9 and Wang et al. 10 adopted SDA method to study the influencing factors of carbon emissions in China's electric power industry. From the perspective of influencing factors, it can be attributed to scale (including electricity consumption, GDP and population, etc.), structure (including thermal power structure, power generation structure and electricity production geographic distribution, etc.), and technology (including emission factor and energy intensity, etc.).
Summary of the main characteristics of representative literature.

Summary of the main characteristics of representative literature.
In 2017, the National Development and Reform Commission issued the Notice of the General Office of the National Development and Reform Commission on Comprehensively Promoting Trans-provincial, Trans-regional and Regional Power Transmission Price Reform, proposing to further promote the inter-provincial power market transaction. At present, Beijing-Tianjin-Hebei-Shandong, Jiangsu-Zhejiang-Shanghai and other regions are facing the obvious power supply tension, and the role of inter-provincial power transmission will become more prominent. In 2017, Jiangsu consumed 580.8 billion kW·h of electricity and generated 488.5 billion kW·h of electricity. The difference between power generation and power consumption ranked first in above regions. The contradiction between supply and demand in Jiangsu is the most prominent. Examining the impact of inter-provincial power transmission on Jiangsu's carbon emissions will help comprehensively identify the factors affecting the evolution of carbon emissions.
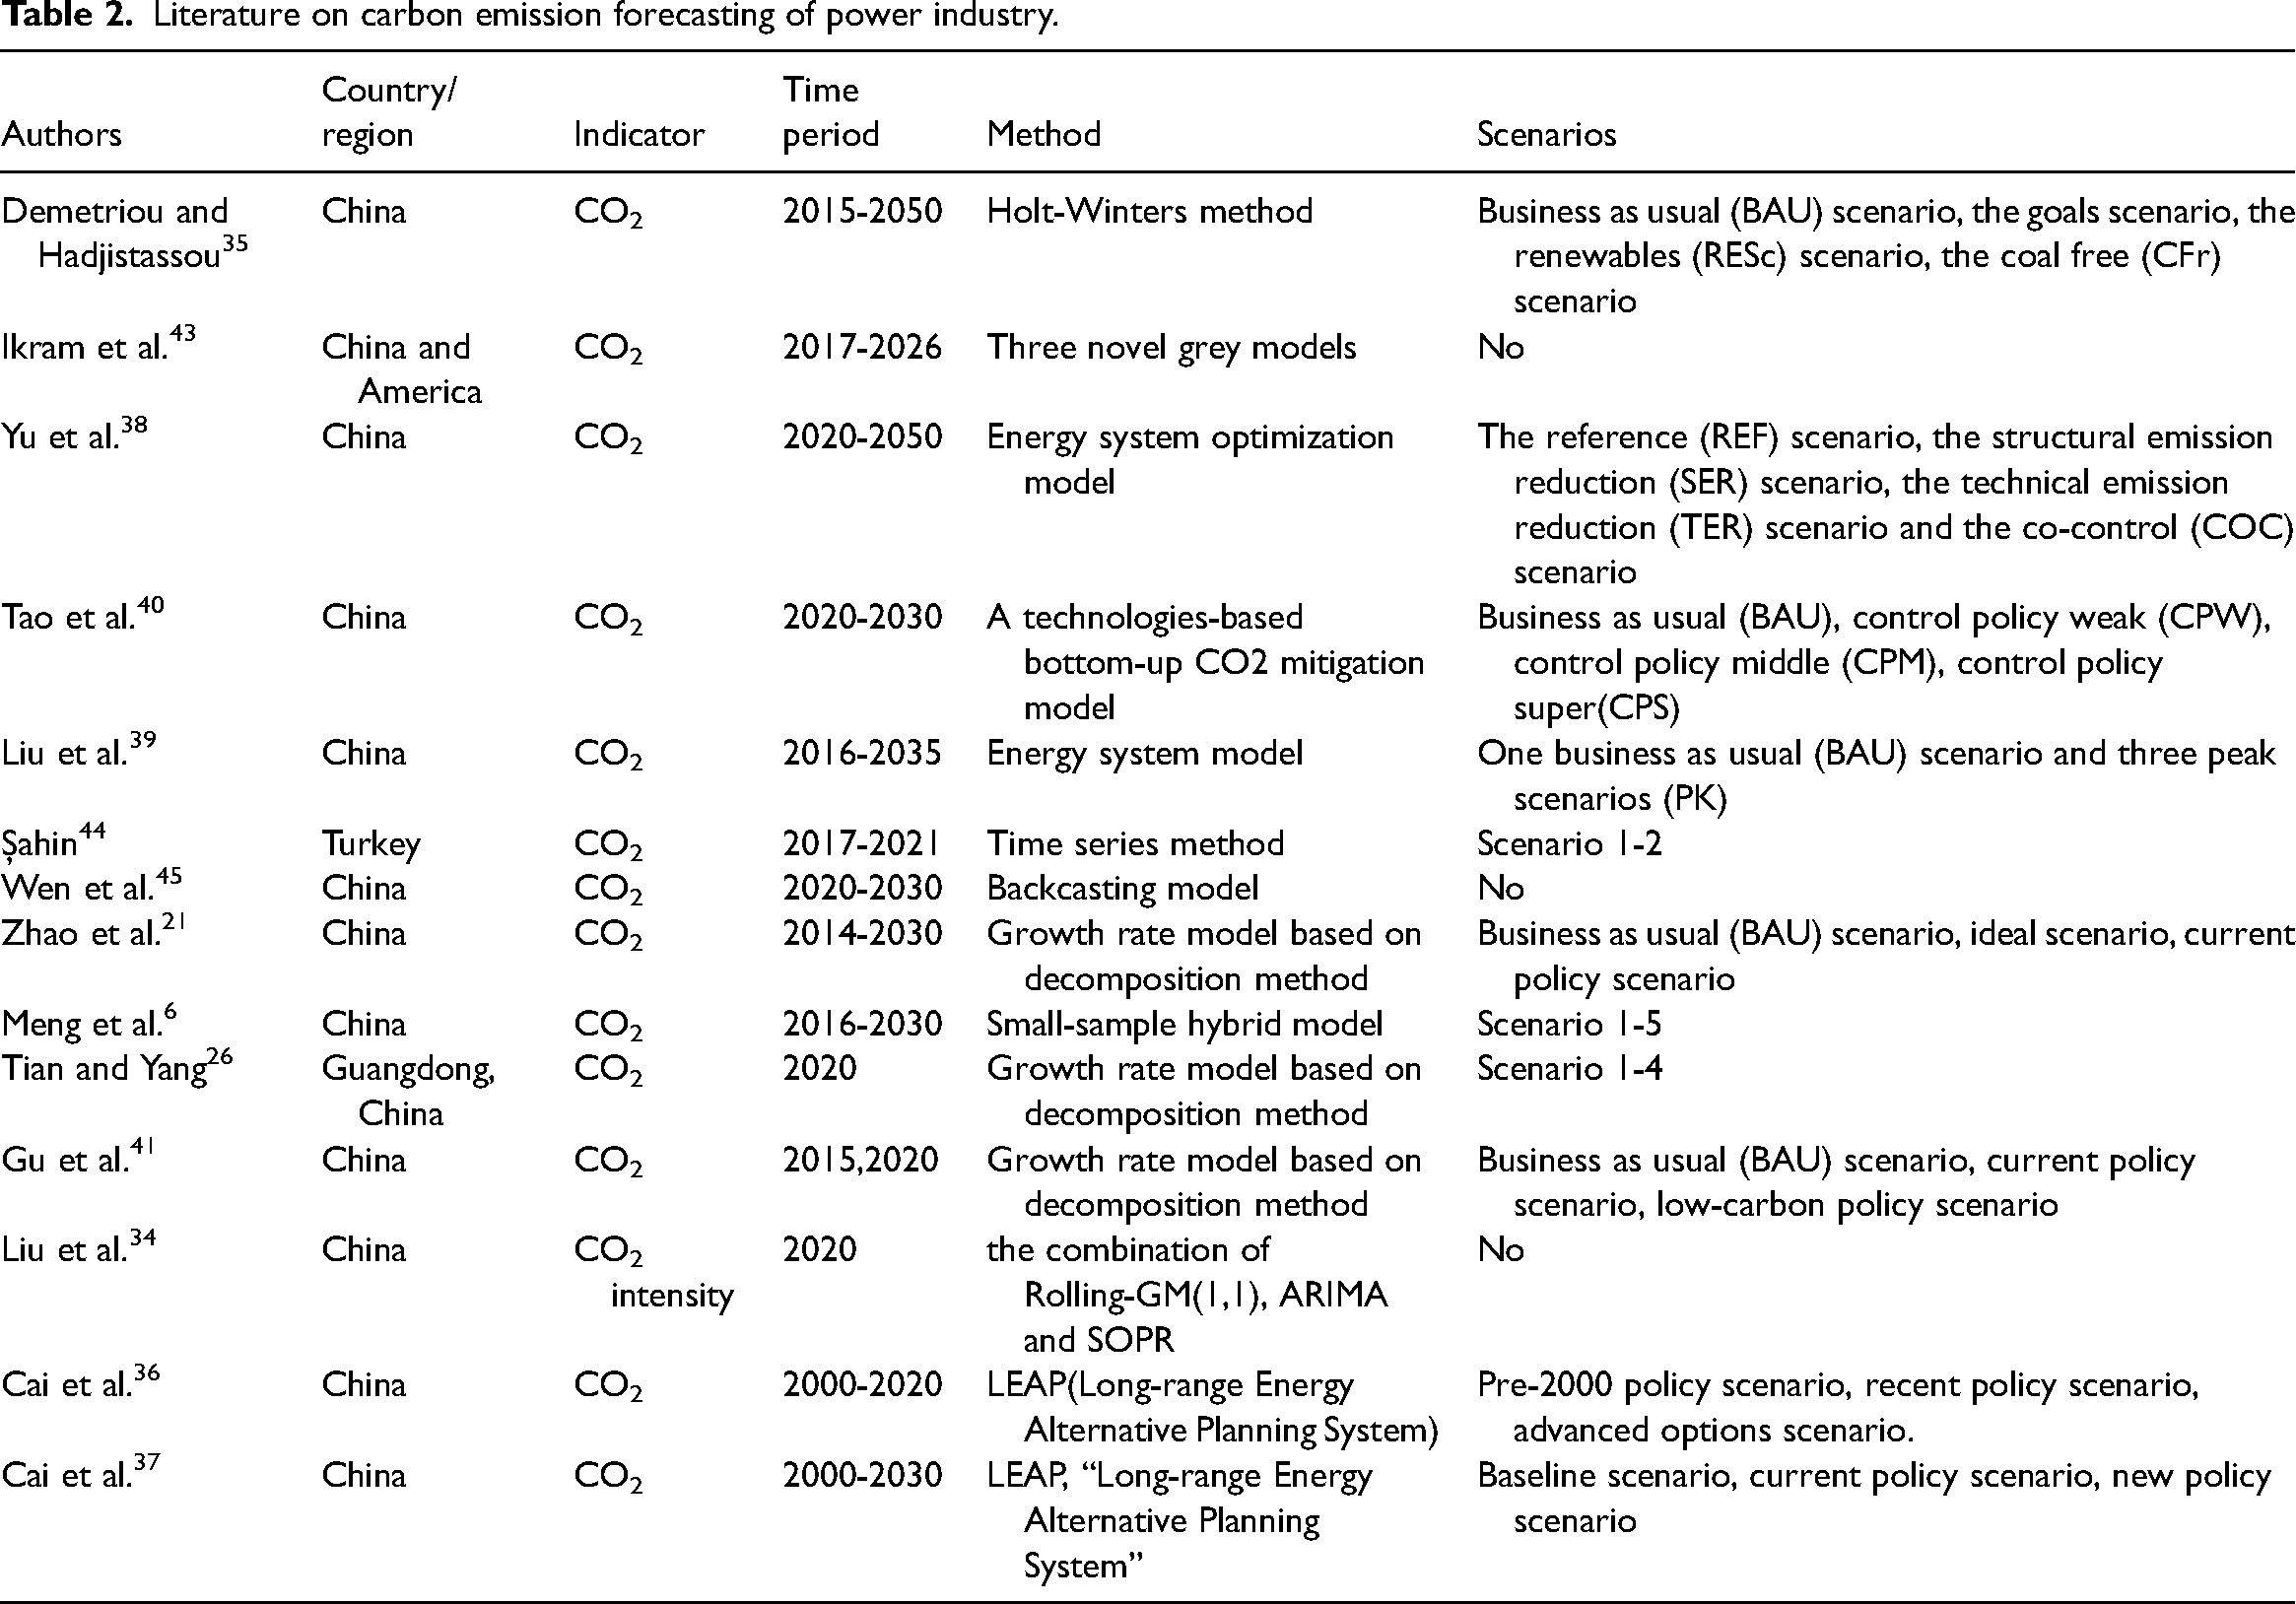
Measurable goals are a recommended standard, especially for those aimed at facilitating energy transition, and setting quantitative targets that must be met over time is becoming commonplace. 33 The prediction of the future evolution trend of carbon emissions helps to grasp the size and time of the peak carbon emissions. This will help us adjust our energy policy dynamically. Table 2 shows the relevant literature on carbon emission forecasts in the electric power industry. It can be seen that the research area is mainly China as a whole, and the forecast indicators are mainly carbon emissions. The forecasting methods mainly include the time series methods,34,35 LEAP models,36,37 and Energy system models38–40 etc. Some scholars have set up different scenarios to predict the future evolution of carbon emissions in the electric power industry.26,41 However, existing scenario analysis assumes that the future rate of change of carbon emission factors is a fixed single value, which is not in line with reality, and should be uncertain and a range of values. Monte Carlo method, put forward by Metropolis and Ulam 42 is an analysis method to deal with uncertainty. It randomly selects and combines variables according to a certain probability, and then measures the target variable. If the scenario analysis is combined with the Monte Carlo method, the evolution trend and probability of carbon emissions in the electric power industry under different policy scenarios can be calculated, and based on the actual situation of the region, a scientifically feasible emission reduction path can be identified.
Literature on carbon emission forecasting of power industry.
Jiangsu is the China's second largest power generating province. We hope to take Jiangsu province as a typical case, and study the influencing factors of carbon emission from the power industry, especially the power transmission. Based on this, this paper takes Jiangsu as the research object, measures carbon emissions in the electric power industry, and builds a STIRPAT model to identify the factors affecting the historical evolution of carbon emissions. Furthermore, we use Monte Carlo method to simulate the future evolution of carbon emissions under multiple scenarios, and judges scientifically feasible emission reduction paths. The main contributions of this paper are in the following two aspects: (1) Firstly investigate the impact of the inter-provincial power transmission on the historical evolution of carbon emissions in Jiangsu's electric power industry. The result provides a theoretical basis for China to speed up the construction of inter provincial power transmission. (2) Combine the scenario analysis method with the Monte Carlo method, consider the future evolution trend of carbon emissions in the electric power industry under uncertain condition, which provides a scientific basis for choosing the best emission reduction path.
Carbon emission measurement of electric power industry
Since thermal power generation is the main source of carbon emissions from the electric power industry in Jiangsu, this paper will not consider the carbon emissions generated by other forms of power generation. The carbon emission calculation model of the electric power industry constructed in this paper is shown in formula (1).
The IPAT model was proposed by Ehrlich and Holdren
47
to explain the relationship between population, wealth and environmental pressure, as shown in formula (2): Population ( Economic development level ( Technology ( Openness (


Take the logarithm on both sides of formula (5) to get formula (6)

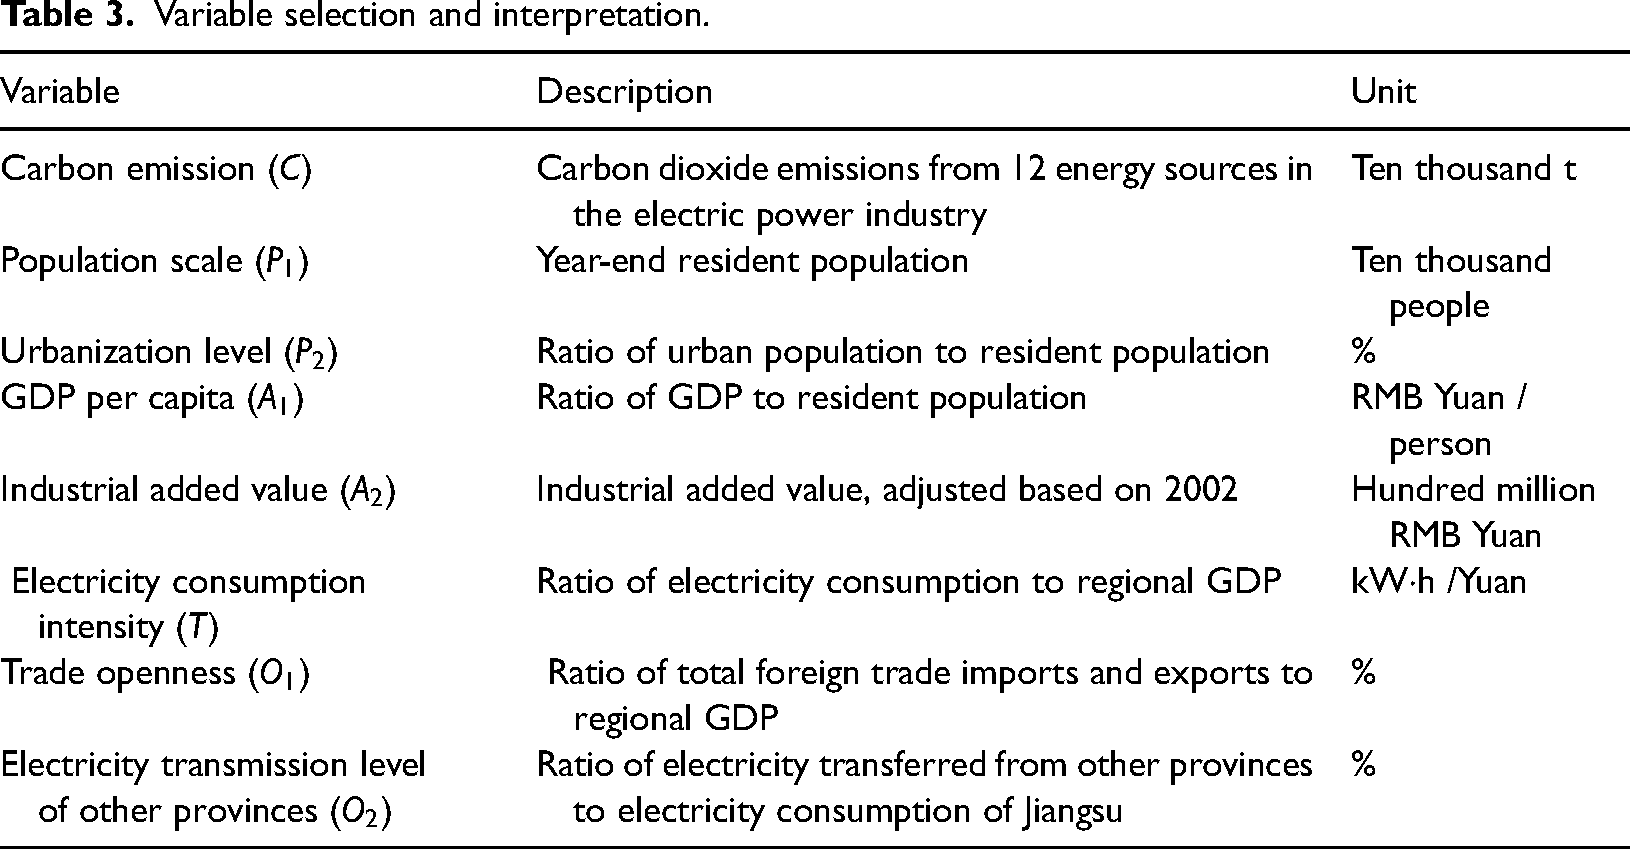
Variable selection and interpretation.
Based on formula (5), set the rate of change of the population scale (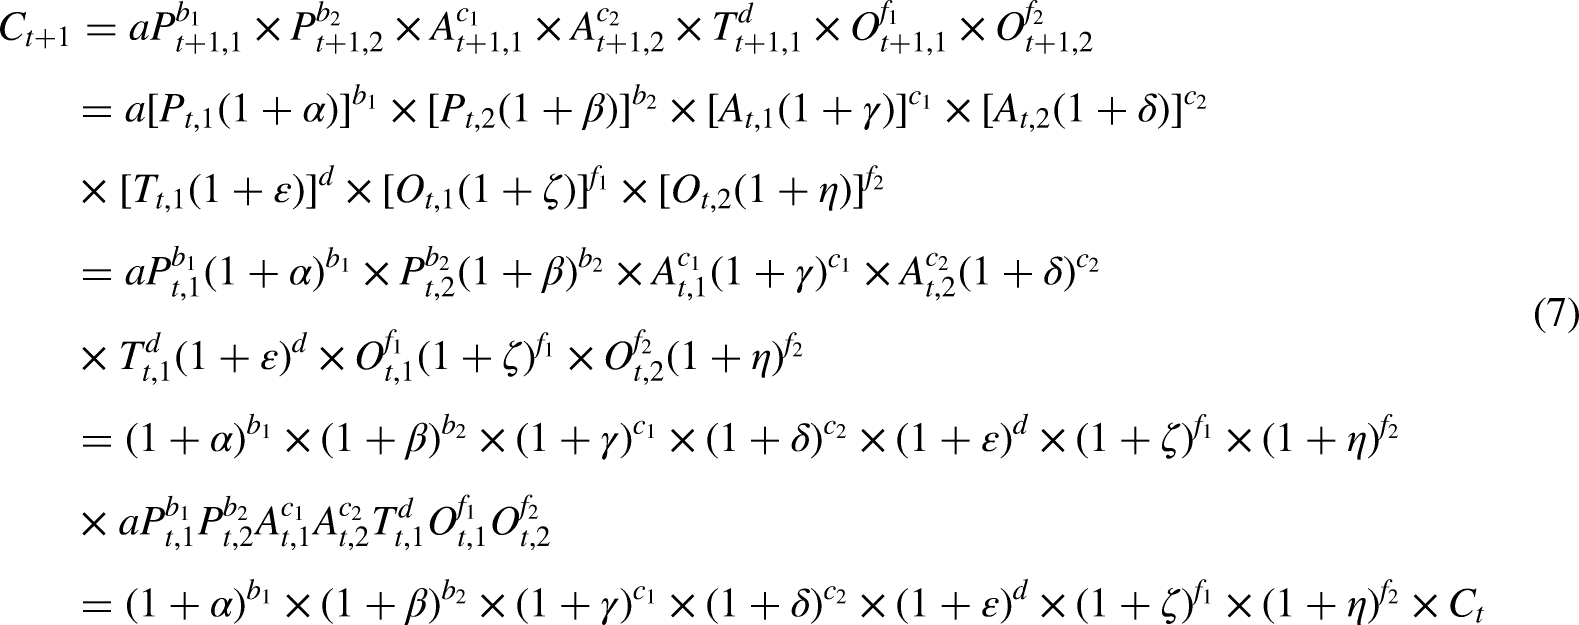

The time span of the data involved is 2002–2017. The relevant data sources and explanations are as follows:
The energy consumption used to measure carbon emissions in the electric power industry comes from the China Energy Statistics Yearbook, and the average low calorific value, carbon content per calorific value, and carbon oxidation factor refer to
46
research results. Resident population, urban population, industrial added value, regional GDP, and electricity consumption are sourced from the official website of the National Bureau of Statistics of China. In order to eliminate the influence of price factors, the industrial added value and regional GDP are deflated at constant prices in 2002. Electricity transmission of other provinces comes from the Jiangsu Energy Balance Sheet in the China Energy Statistical Yearbook. The total amount of foreign trade imports and exports is derived from the Jiangsu Statistical Yearbook, in which the total foreign trade imports and exports are converted into RMB Yuan at the exchange rate of the year, and then adjusted at the constant prices in 2002.
Empirical results
The evolution of carbon emission
Based on formula (1), the carbon emissions of the electric power industry in Jiangsu from 2002 to 2017 are calculated, and the evolution trend is shown in Figure 1. Overall, the electric power industry's carbon emissions are on the rise, from 10735.26 ten thousand tons in 2002 to 35352.87 ten thousand tons in 2017, with an average annual growth rate of 8.27%. Among them, there was a downward trend in 2008 and 2014.

Changes in carbon emissions of the electricity power industry in Jiangsu (2002-2017).
In order to eliminate the influence of multicollinearity between explanatory variables on the regression results, this paper uses the principal component regression method. Standardize results
Principal component extraction summary.

Principal component extraction summary.
The cumulative contribution rate of the first two eigenvalues
Initial factor loading matrix.
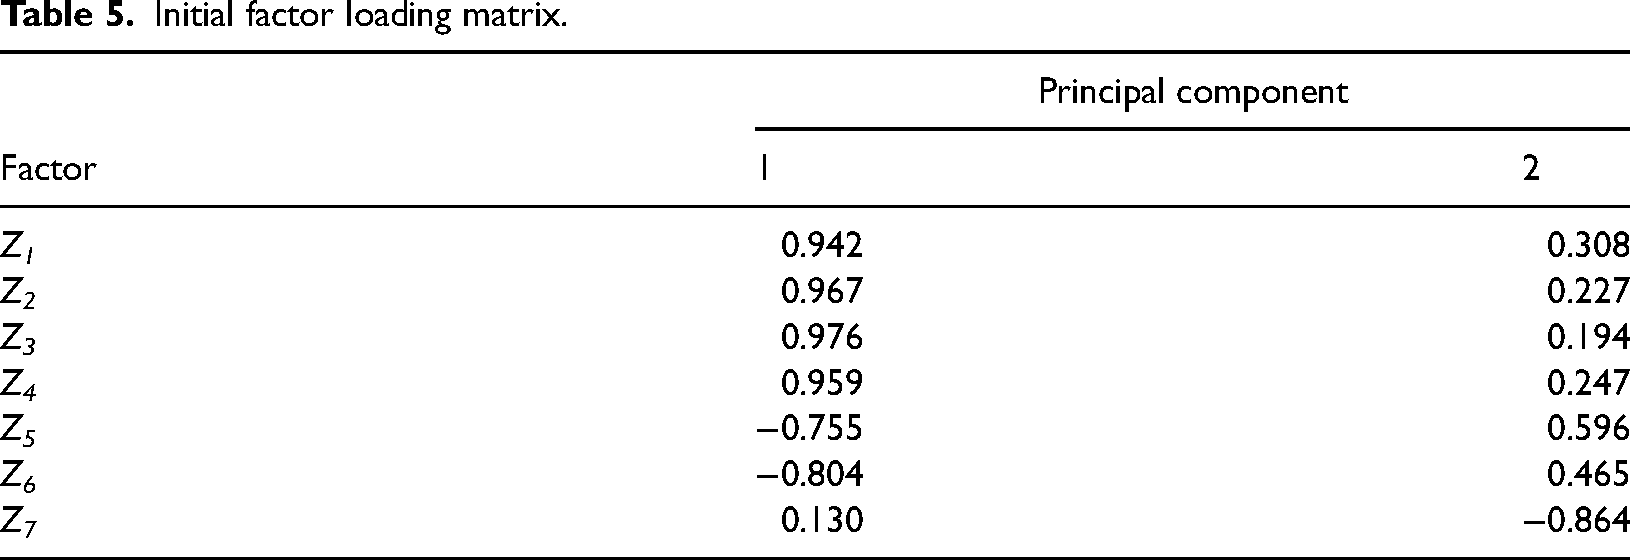
The standard orthogonalized eigenvectors corresponding to the two eigenvalues are shown in formulas (9) and (10):

The feature vector.

Therefore, the first principal component 

γ‘s regression results on F1 and F2.

Note: *, **, *** indicate significant at the level of 10%, 5%, and 1% respectively.
It can be seen from the regression results that the constant term is approximately 0, The coefficient of population scale is the largest, indicating that the expansion of population size and the increase in demand for electricity for production and living are the main factors that stimulate the growth of carbon emissions in the electric power industry. The level of urbanization is another important factor that promotes the increase of emissions. The impact of urbanization in Jiangsu on the carbon emissions of the electric power industry is more reflected in stimulating the construction of electricity facilities. The intensive effect brought about by the urbanization process is not obvious, and it cannot reduce electricity consumption. GDP per capita also plays a positive role, indicating that there is no decoupling between economic growth and carbon emissions. Although divided by the three industries, Jiangsu has realized the “three-two-one” industrial structure since 2015, but by industry, the manufacturing industry still accounts for the highest proportion of output value, and the manufacturing industry has not fully transformed to the high-end, which has a great impact on electricity consumption and carbon emissions. The coefficient of industrial added value is positive, because industry, especially heavy industry, needs to consume a lot of electricity, which will stimulate electricity production and carbon emissions. In recent years, Jiangsu has eliminated backward production capacity and developed high-end manufacturing industries. However, the output value of high-end manufacturing does not occupy an absolute position. Therefore, industrial development still has a high dependence on electric energy. There is a positive relationship between electricity consumption intensity and carbon emissions in the electric power industry. Electricity consumption intensity is a technical indicator that reflects the power consumption per unit of GDP. Its coefficient is positive, indicating that the more power consumption per unit GDP, the more total carbon emissions from the power industry. Jiangsu is still in the stage of economic transformation, and high-end industries with low resource consumption and low environmental pollution are not dominant. Economic development still has a high demand for electric energy. The coefficient of electricity transmission level of other provinces is negative, indicating that electricity transmission of other provinces can alleviate the pressure on electric supply in Jiangsu, thereby reducing carbon emissions. As a receiving place for “North-South Power Transmission” and “West-East Power Transmission", Jiangsu absorbs power from Sichuan, Shanxi and other places through UHV power transmission projects, thereby easing its pressure of power generation. The coefficient of trade openness is negative, indicating that Jiangsu has relatively strict environmental control in import and export trade. Jiangsu encourages the import of advanced technology and equipment, and relies on foreign trade to drive economic transformation and reduce energy consumption per unit of economic growth.



Based on the STIRPAT regression results, combined with formula (8), the change rate of carbon emissions in the electric power industry c is obtained, which can be expressed by formula (17).
Monte Carlo simulation is widely used in the analysis of uncertain events. This method uses random numbers to solve calculation problems. It can randomly select values for reference variables and the target variable is calculated after combined. When the value interval of the variable and the most likely value result are determined, but the shape of the probability distribution is not timed, the triangular distribution is suitable for random selection of variables. 53 The most likely potential change rate of each factor is its intermediate value, and the relationship between the maximum, intermediate and minimum values is constructed based on the triangular distribution. This paper uses Matlab software to simulate the trend of carbon emission.
In the baseline scenario, it is assumed that the future annual average rate of change of each driving factor continues the past change characteristics. Referring to the research results of Shao et al., 54 the average annual potential change rate of each factor from 2018 to 2030 is determined by referring to its average annual change rate in 2002–2017, 2005–2017, 2010–2017, and 2015–2017. The maximum and minimum values of the potential rate of change of each factor select the maximum and minimum of the above four periods. For the two average annual rates of change in the middle, the closer the cycle, the more significant the impact on the future, so select the average annual rate of change in the recent period has become the median value of the potential rate of change. Table 8 shows the setting of the potential annual average change rate of each factor in the baseline scenario.
The potential annual average change rate of each factor in the baseline scenario (%).
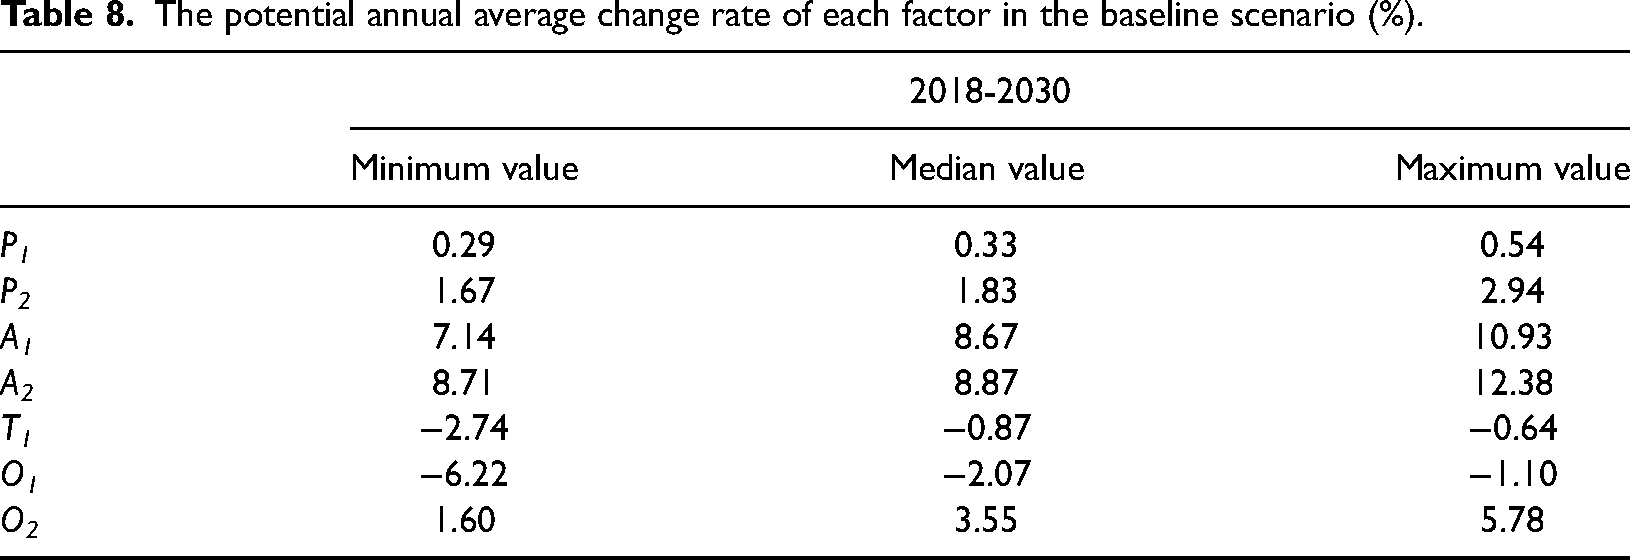
The potential annual average change rate of each factor in the baseline scenario (%).
Figure 2 shows the evolution trend of carbon emissions distribution under the baseline scenario. It can be seen from the figure that the carbon emissions of the electric power industry are showing an increasing trend. In 2018, the carbon emissions range is 362.40–376.68 million tons, and the most probable carbon emissions are 368.89 million tons. By 2030, carbon emissions range is from 487.87–806.29 million tons, and the most probable carbon emissions are 610.46 million tons. This means that population, economy, technology, trade openness and so on continue to change the trends of the past, and the carbon emissions of the electric power industry in Jiangsu will continue to grow. Therefore, social and economic policies must be adjusted to reduce carbon emissions.
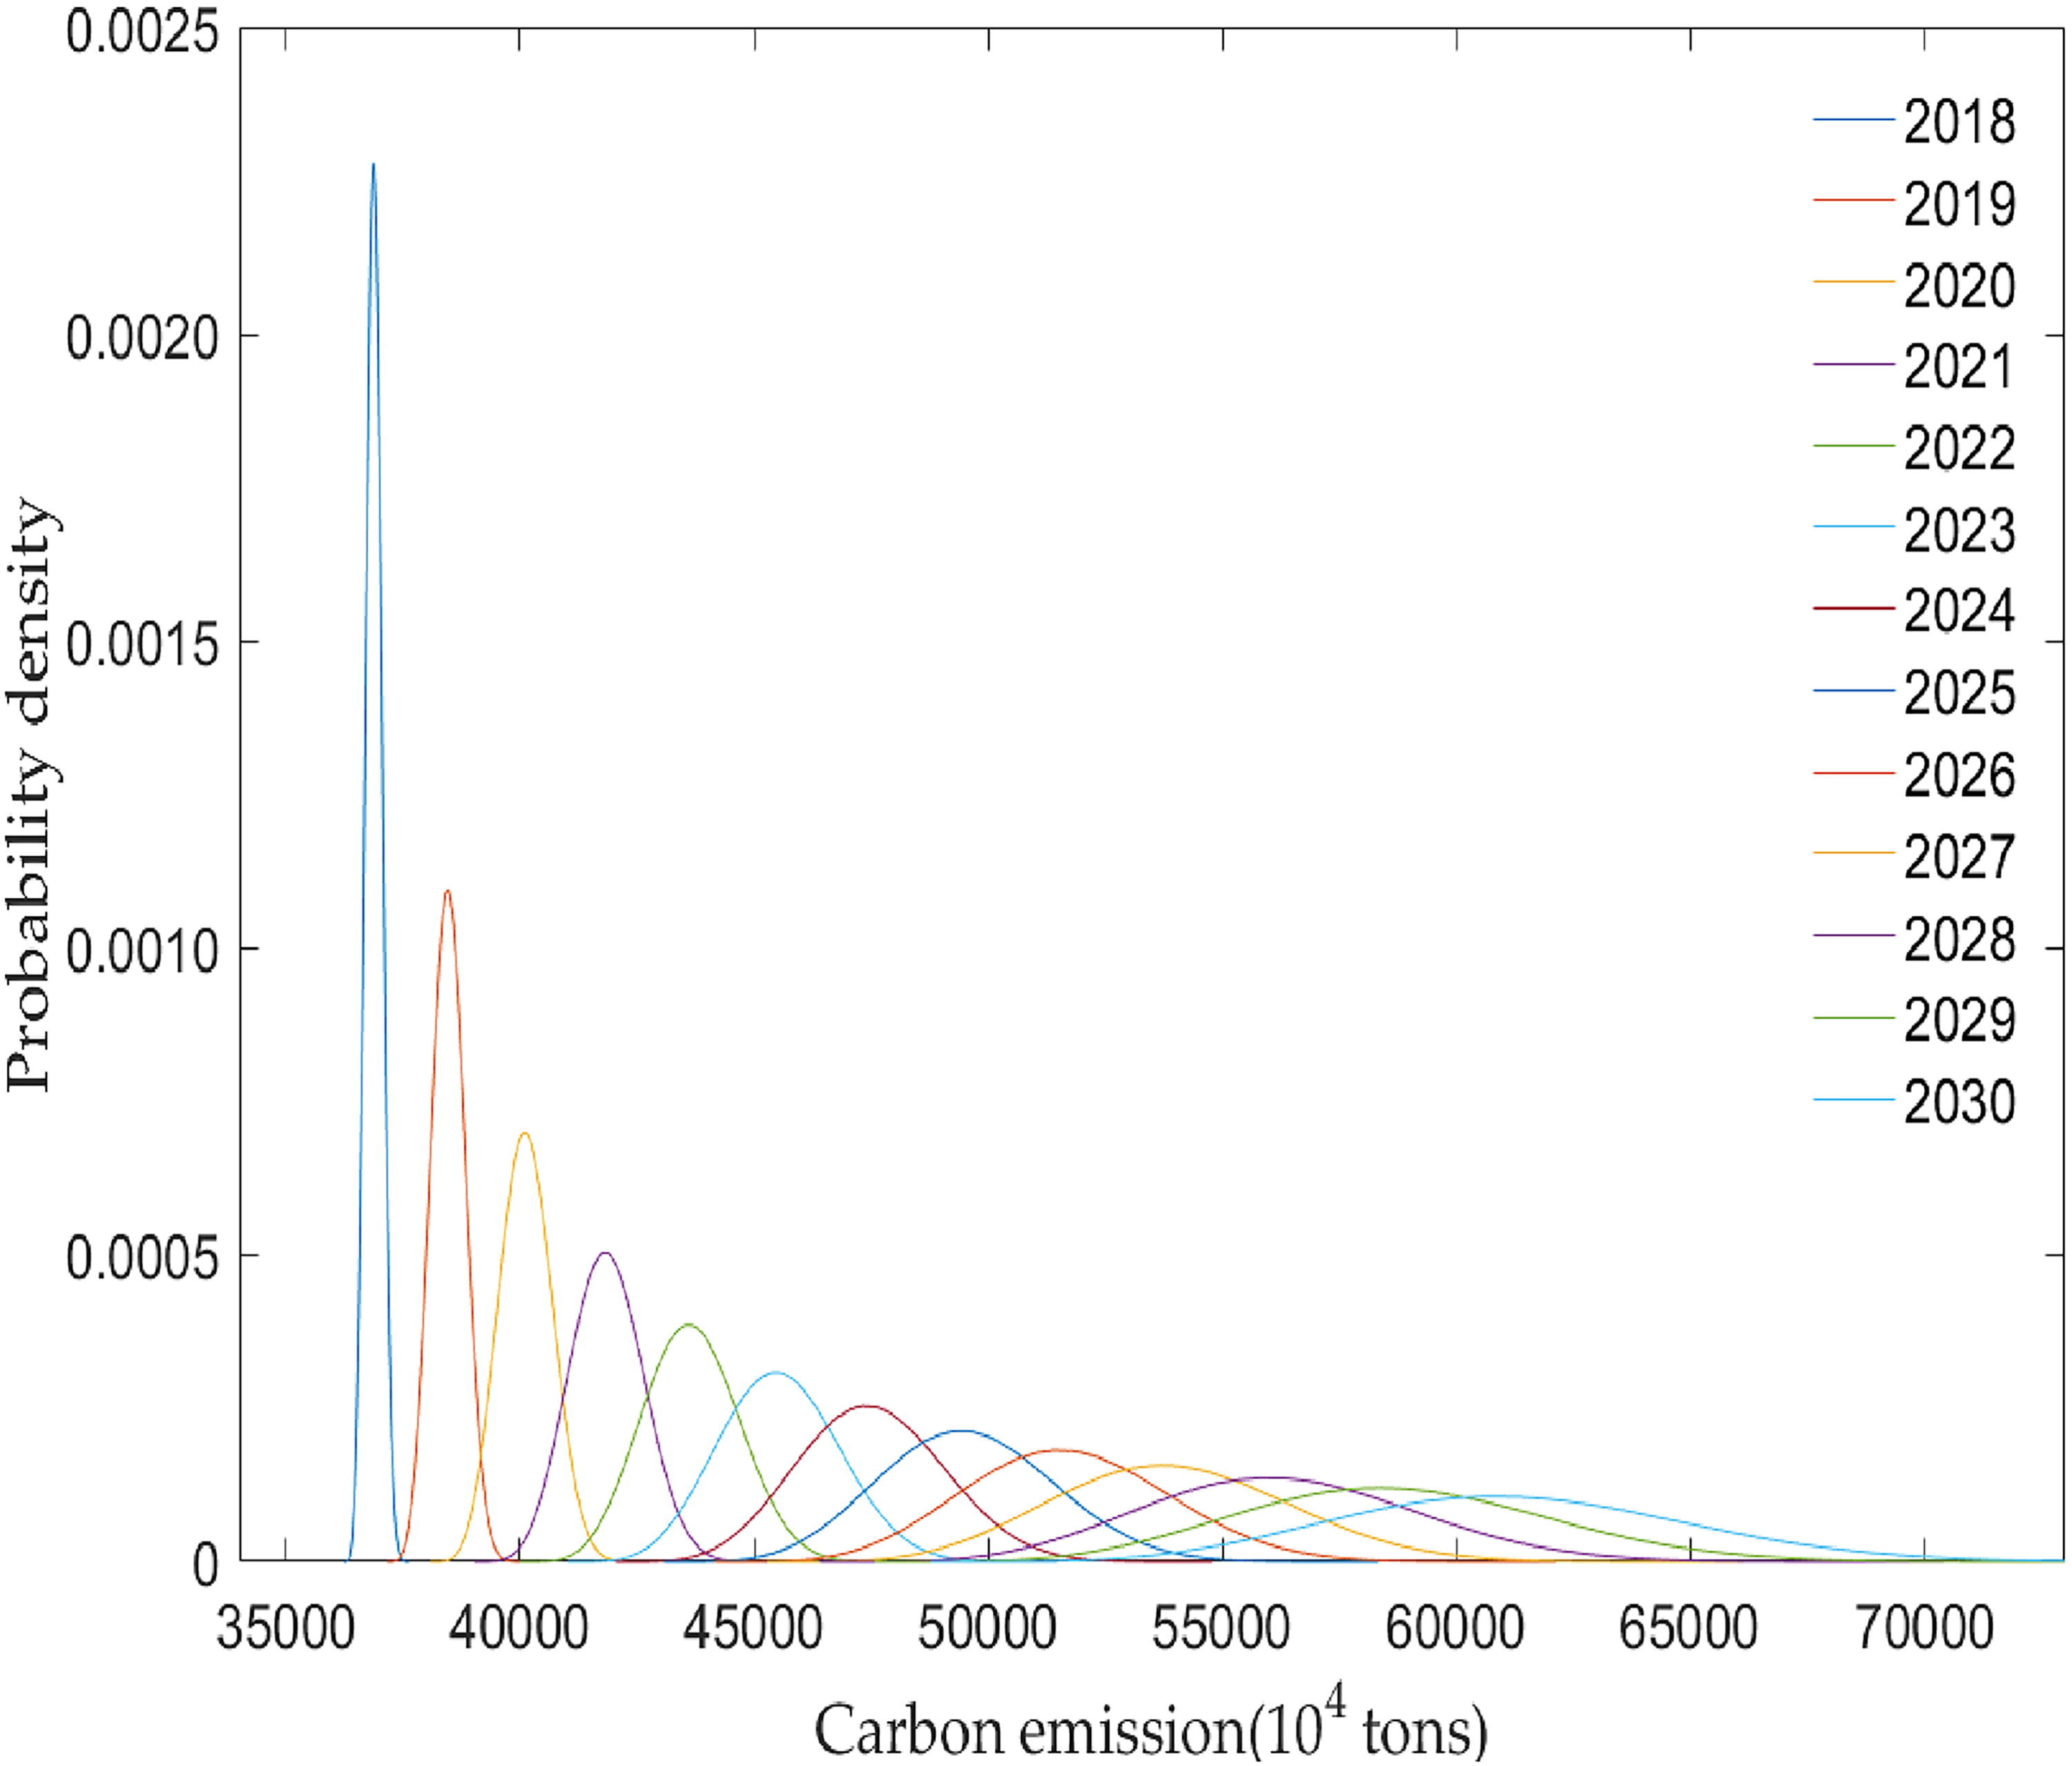
The evolution trend of carbon emissions distribution under the baseline scenario.
The green development scenario assumes that various indicators will change with reference to recent development trends or planning documents, that is, population scale and urbanization level are reasonably advanced, the economy is operating in accordance with the new normal, energy utilization rate has risen, and the electricity utilization rate is appropriately increased, etc. to strengthen environmental protection.
(1) Population scale (2) Urbanization level (3) GDP per capita (4) Industrial added value (5) Electricity consumption intensity (6) Trade openness (7) Electricity transmission level of other provinces
“The Thirteenth Five-Year Plan for Population Development of Jiangsu Province“ proposes that the resident population will reach 82 million in 2020. Since the resident population at the end of 2017 was 80.293 million, the average annual change rate of population from 2018 to 2020 is calculated to be 0.70%. “The Jiangsu Province Urban System Plan (2015–2030)“ proposes that the resident population in 2020 and 2030 will be 85 million and 90 million, respectively. From this calculation, the average annual change rate of population from 2021 to 2030 is 0.57%. The above average annual change rate is taken as the median value of the potential change rate from 2018 to 2020 and from 2021 to 2030, and the maximum and minimum values are obtained by increasing and decreasing by 0.1 percentage points on the basis of the median value, respectively.
“The Jiangsu Province Urban System Plan (2015–2030)“ proposes that the urbanization rate in 2020 and 2030 will be 72% and 80%, respectively. Since the urbanization rate in 2017 is 68.8%, we can calculate the annual average change rate of urbanization is 1.53% and 1.06% in 2018–2020 and 2021–2030 respectively. The above average annual change rate is taken as the median value of the potential change rate from 2018 to 2020 and from 2021 to 2030, and the maximum and minimum values are obtained by increasing and decreasing by 0.5 percentage points on the basis of the median value, respectively.
“The Outline of the 13th Five-Year Plan for National Economic and Social Development of Jiangsu Province“ sets the average annual growth rate of regional GDP during the “13th Five-Year Plan” period to be about 7.5%. From the previous paper, we can get the average annual change rate of population from 2018 to 2020 is 0.70%, so the average annual change rate in GDP per capita from 2018 to 2020 is 6.75%. From 2021 to 2030, based on Sheng and Zheng
55
's research on the feasible growth path of China's GDP and Jiangsu's important economic position, the economic growth rate of 5.76% in the high plan is selected as the average annual GDP growth rate of Jiangsu during this period. From the previous paper, the average annual change rate of population from 2021 to 2030 is 0.57%, so the average annual change rate of Jiangsu's GDP per capita from 2021 to 2030 is 5.16%. The above average annual change rate is taken as the median value of the potential GDP per capita change rate from 2018 to 2020 and from 2021 to 2030. With reference to the variation of GDP per capita growth rate in the study of Lin and Liu,
56
the maximum and minimum values are obtained by increasing and decreasing by 1 percentage point on the basis of the median value, respectively.
In recent years, due to the increase in labor costs, the impact of environmental remediation and inefficient industrial investment, the growth of Jiangsu's industrial economy has slowed down. Jiangsu urgently needs to realize the transformation of growth power, namely to promote industrial upgrading with talent, information, technology and other factors. Coupled with the impact of “re-industrialization” in developed countries, Jiangsu's industrial economy has generally faced greater downward pressure. 7% is regarded as the average annual change rate of industrial added value in Jiangsu from 2018 to 2020. With reference to Zhang and Shi
57
's predictions on the growth range of China's industrial added value above designated size in 2020 (5.4–5.8%), assuming that the average annual change rate of Jiangsu's industrial added value from 2021 to 2030 remains at the level of 5.8%, this is taken as the median value of the potential change rate. The maximum value and the minimum value are obtained by increasing and decreasing 1 percentage point on the basis of the median value, respectively.
“The Thirteenth Five-Year Plan for Electric Power Development in Jiangsu Province“ predicts that the electricity consumption of the whole society will increase by 4.9% annually during the Thirteenth Five-Year Plan, while the average annual economic growth rate during the Thirteenth Five-Year Plan period is set at 7.5%. The average annual change rate of electricity consumption intensity from 2018 to 2020 is −2.42%. It is assumed that this indicator will maintain the past trend of change from 2021 to 2030. Therefore, this change rate is taken as the median value of the potential change rate of electricity consumption intensity from 2018 to 2030. With reference to the change range of energy intensity growth in the study of Lin and Liu,
56
the maximum and minimum values are obtained by increasing and decreasing by 0.5 percentage point on the basis of the median value, respectively.
The average economic growth rate of Jiangsu during the 13th Five-Year Plan period is set at about 7.5%. In 2017, the total foreign trade import and export volume of Jiangsu has an average annual change rate of 4.09%, compared to the 2015 data. Assuming that the effect of exchange rate changes is not taken into account, the economy will grow at the planned rate from 2018 to 2020, and the total foreign trade import and export volume will continue the growth trend of 2015–2017. And the average annual change rate of the “trade openness” indicator for 2018–2020 is calculated −3.17%, taking it as the median value of the potential change rate from 2018 to 2020. It is assumed that the trade openness from 2021 to 2030 maintains the development trend of 2018 to 2020. The maximum value and the minimum value are obtained by increasing and decreasing 1 percentage point on the basis of the median value, respectively.
“The Thirteenth Five-Year Plan for Electric Power Development in Jiangsu Province“ predicts that the electricity consumption of the whole society will increase by 4.9% annually during the 13th Five-Year Plan. In 2017, Jiangsu transferred electricity from other provinces, compared with the 2015 data, the average annual change rate was 12.72%. Assuming that the electricity consumption in Jiangsu will grow at the expected rate from 2018 to 2020, the electricity transferred from other provinces will continue the growth trend of 2015–2017, and the average annual change rate of the transmission level of other provinces from 2018 to 2020 is calculated to be 7.45%, which is regarded as the median value of the potential change rate. Assuming that 2021–2030, the electricity diversion situation remains the same as the previous period, and the median value of the potential change rate of the transmission level of other provinces is still 7.45%. The maximum value and the minimum value are obtained by increasing and decreasing 2.5 percentage point on the basis of the median value, respectively.
Table 9 shows the setting of the potential annual average change rate of each factor in the context of green development.
The potential annual average change rate of each factor in the green development scenario (%).
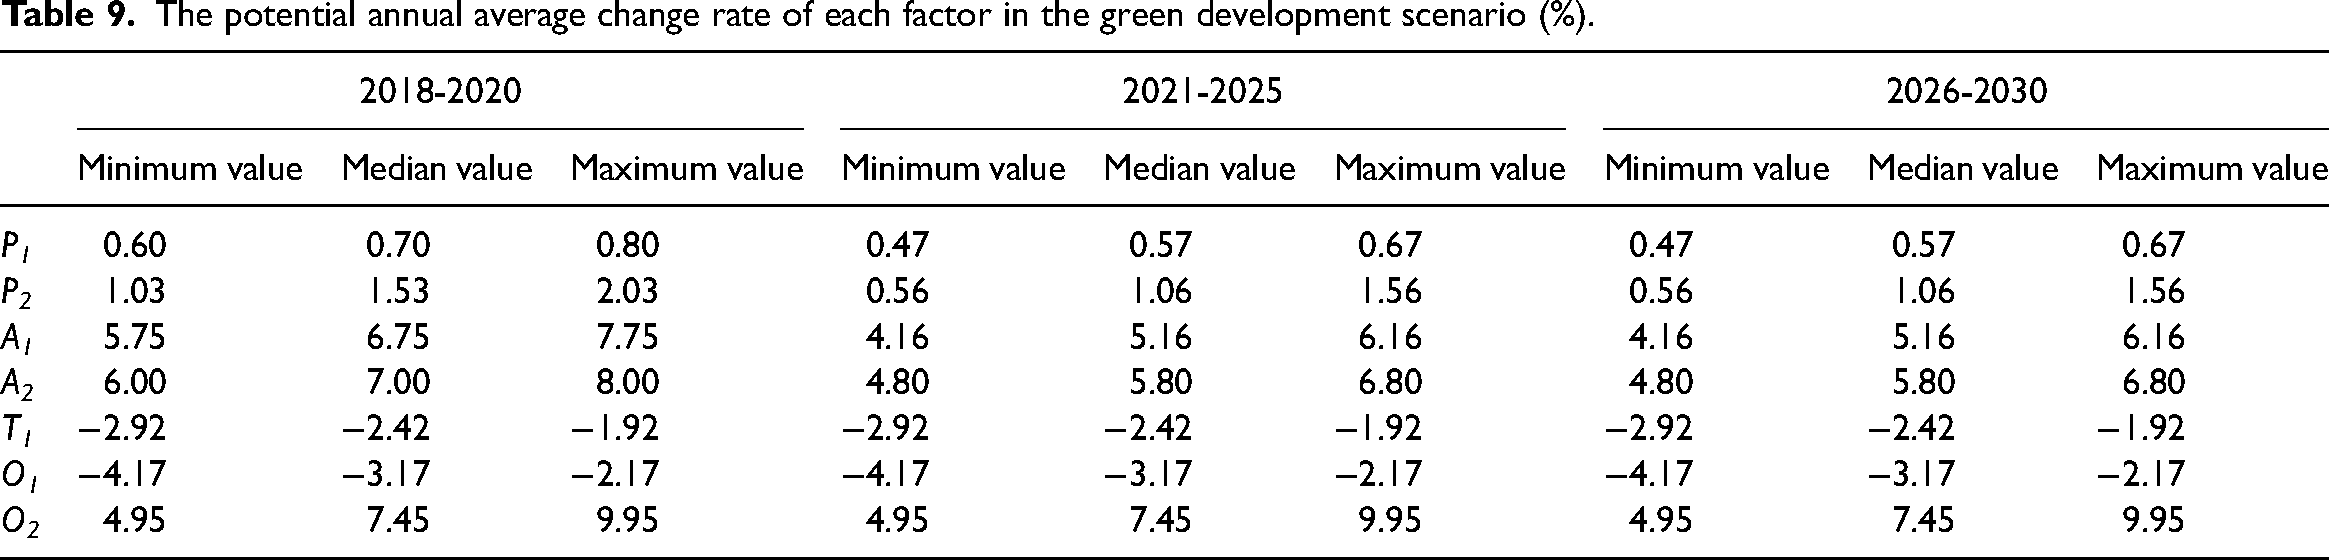
The potential annual average change rate of each factor in the green development scenario (%).
Figure 3 shows the evolution trend under the green development scenario. Under the green development scenario, the carbon emissions of the electric power industry in Jiangsu are still showing a continuous growth trend. The carbon emissions in 2018 ranged from 356.99–369.43 million tons, and the most probable carbon emissions were 363.02 million tons. The range of carbon emissions in 2030 is 377.04–523.53 million tons, and the most probable carbon emissions are 440.76 million tons. From 2018 to 2030, the most likely annual change rate of carbon emissions is 1.63%. Compared with the baseline scenario, the growth rate of carbon emissions has slowed down significantly. It can be seen that, guided by the concept of green development, the government actively adopts macro-control policies to respond to environmental changes, which can slow down the growth trend of carbon emissions in Jiangsu's electric power industry, but the turning point of emissions from growth to reduction has not yet appeared.
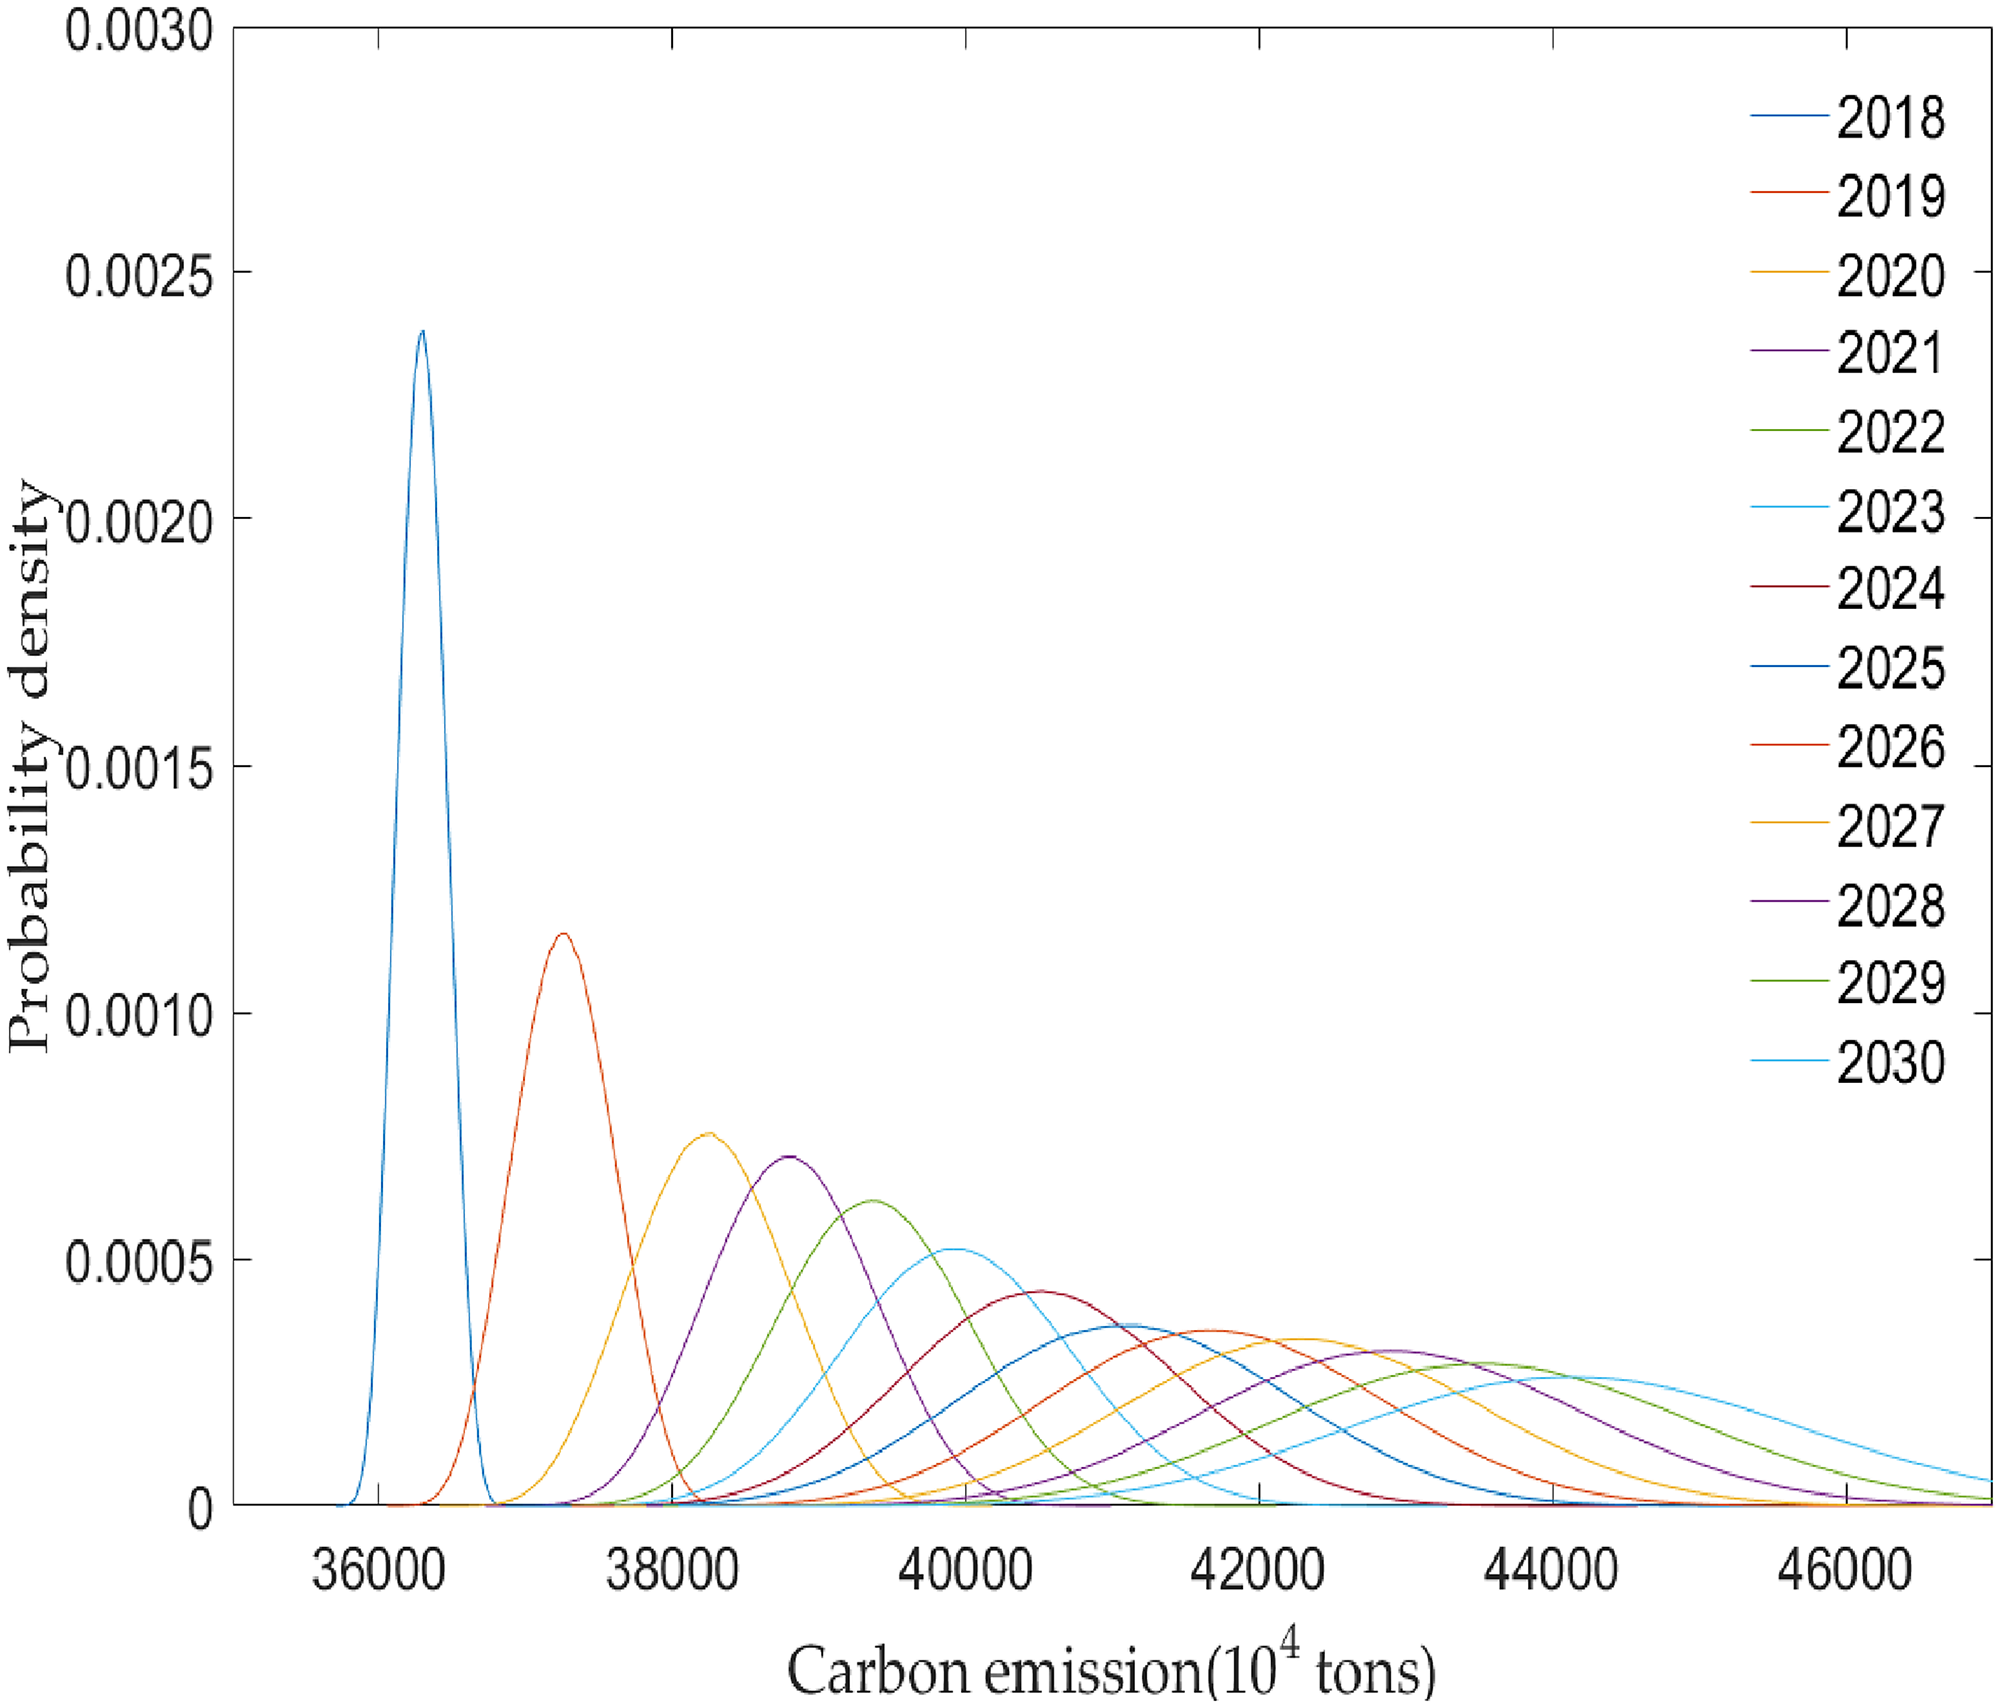
The evolution trend of carbon emission distribution of Jiangsu's electric power industry from 2018 to 2030 under the green development scenario.
The high-quality development scenario assumes that governments will increase support for foreign trade, promote high-quality economic development through “bringing in” and “going out"; increase the construction of electricity facilities between provinces, improve system design and power market reforms, further promote the cross-regional deployment of energy. In terms of technology, we will promote the transformation of industrial structure and improve energy efficiency. In this scenario, the average annual change rate of each factor is as follows (assuming the fluctuation of the potential change rate of each factor is the same as the green development scenario).
(1) Population scale (2) Urbanization level (3) GDP per capita (4) Industrial added value (5) Electricity consumption intensity (6) Trade openness (7) Electricity transmission level of other provinces
Under the premise that the economy has reached a relatively high level, the change in population scale is relatively stable. This paper assumes that the population scale change trend under the high-quality development scenario is the same as the green development scenario.
The green development scenario has assumed that Jiangsu is focusing on the development of new urbanization and emphasizing “energy saving, intensivism and ecological protection “. It is assumed that the urbanization level change trend under the high-quality development scenario is the same as the green development scenario.
China has launched “made in China 2025” as the action program of “manufacturing power strategy". Promoting the transformation of manufacturing to high-end is conducive to maintaining the medium-to-high speed of economic growth. It is assumed that the development trend of GDP per capita from 2018 to 2025 is the same as the green development scenario. After 2025, with the upgrading of the industrial structure brought about by technological breakthroughs, the economy will usher in a new round of growth. It's assumed that the average annual change rate of GDP per capita from 2026–2030 increases by 1 percentage point compared to the green development scenario and 6.16% is used as the median value of the potential change rate.
Jiangsu promulgated the “Made in China 2025 Jiangsu Action Plan”, which required the promotion of intelligent manufacturing and the capture of key technologies in various fields to improve the manufacturing level. It is assumed that the potential annual change rate of Jiangsu's industrial added value from 2018 to 2025 is the same as that of the green development scenario. After 2025, Jiangsu will make breakthroughs in the field of advanced manufacturing, the manufacturing industry will transition to high-end, and the industrial economy will usher in a new round of growth. Assuming the potential change rate of industrial added value increased by 1% compared with the green development scenario in the same period.
Through technological research and development and industrial restructuring, the energy consumption per unit of economic growth is reduced. However, it will take some time for the technology to develop, break through, and mature. Assuming that the change trend of electricity consumption intensity from 2018 to 2020 is the same as that of the green development scenario, the technical effects will gradually become prominent from 2021 to 2025. The potential change rate of electricity consumption intensity is reduced by 0.5 percentage points from the green development scenario during the same period, and −2.92% is recorded as the median potential change rate. Assuming further breakthroughs in the technical field after 2025, 0.5 percentage points are subtracted from −2.92%, and −3.42% is used as the median value of the potential change rate of electricity consumption intensity.
It is assumed that the changing trend and scenario of trade openness in 2018–2020 will be the same. From 2021 to 2025, assuming that foreign trade is supported by policies, the trade openness will increase by 1 percentage point compared to the scenario, with −2.17% as the median value of the potential change rate. From 2026 to 2030, due to the upgrading of manufacturing industry to enhance China's international competitiveness in trade, change China's position in the international division of labor, and stimulate the development of foreign trade economy, assuming a further increase in trade openness by 1 percentage point, and −1.17% is used as the median value of the potential change rate.
According to the national grid planning and deployment, the AC synchronous power grids in North China, Central China, East China, Northeast China, and Northwest China will be integrated into the eastern and western power grids in 2020; in 2025, the eastern and western power grids will be combined into one synchronous power grid. The construction of this national energy Internet will help Jiangsu to further absorb electricity from other regions. Assuming that the change trend of the electricity transmission level of other provinces from 2018 to 2020 is the same as that of the green development scenario, the electricity transmission level of other provinces in 2021–2025 will increase by 2.5 percentage points on the basis of the green development scenario, taking 9.95% as the median value of the potential change rate; In 2026–2030, after the establishment of the national synchronous grid, it is assumed that the electricity transmission level of other provinces will be further increased by 2.5%, with 12.45% as the median value of the potential change rate.
Table 10 shows the setting of the potential annual average change rate of each factor under the high-quality development scenario.
The potential annual average change rate of each factor under the high-quality development scenario (%).
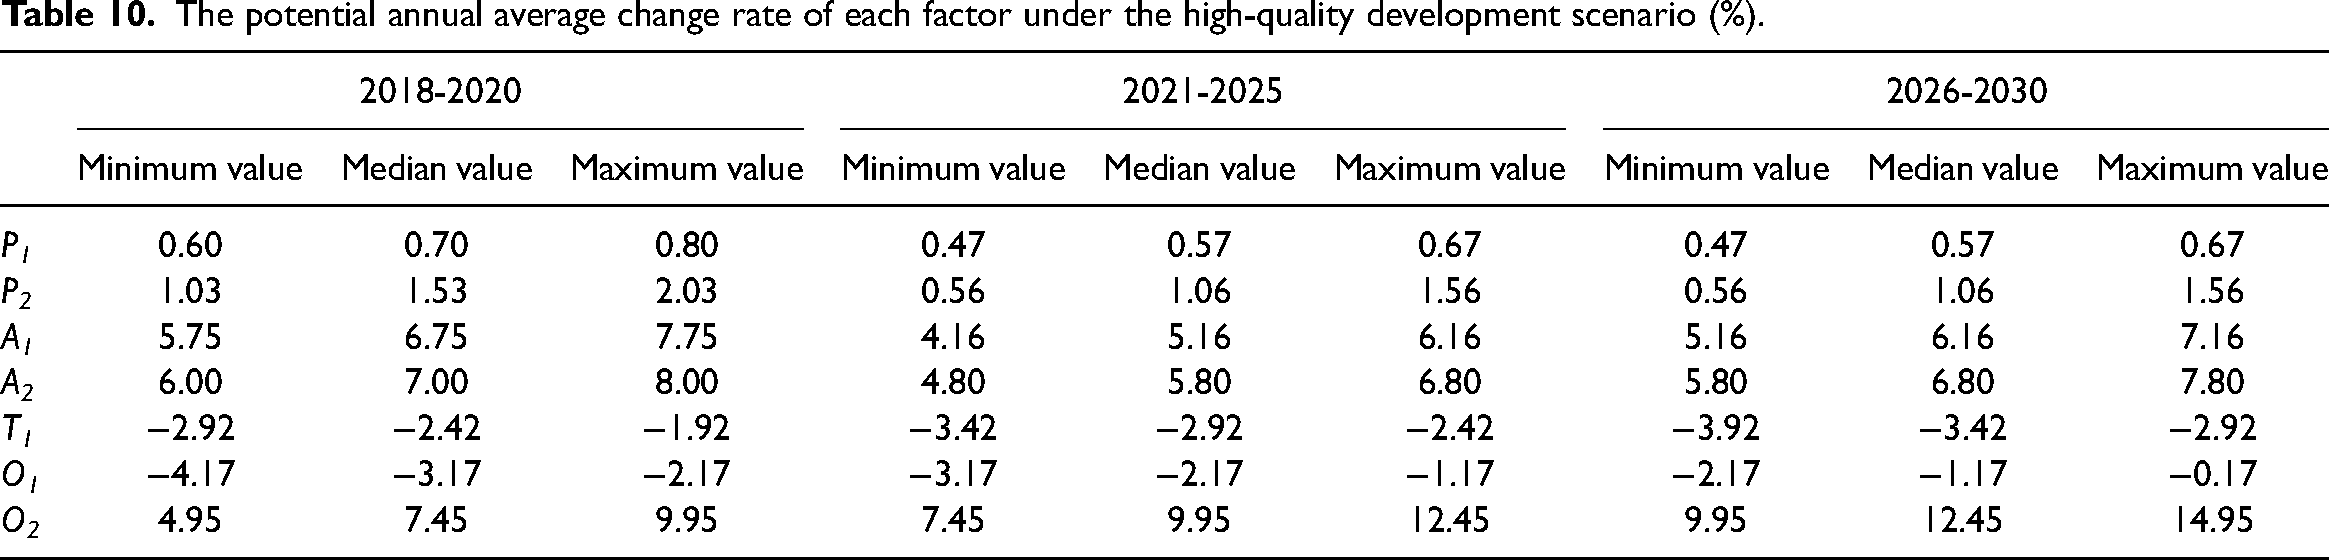
The potential annual average change rate of each factor under the high-quality development scenario (%).
Figure 4 shows the evolution trend under the high-quality development scenario. Under this scenario, the carbon emissions of the electric power industry in Jiangsu show a trend of increasing first and then decreasing. The range of carbon emissions in 2018 is 357.50–368.46 million tons, and the most probable carbon emissions are 362.92 million tons. The range of carbon emissions in 2025 is 350.85–434.95 million tons, and the most probable carbon emissions are 390.80 million tons and reach a peak. The range of carbon emissions in 2030 is 333.43–449.35 million tons, and the most probable carbon emissions are 386.17 million tons. The annual average change rates of carbon emissions with the highest probability in 2018–2025 and 2025–2030 are 1.06% and −0.24%, respectively. The inflection point of this scenario appears after 2025.

The evolution trend of carbon emissions distribution under the high-quality development scenarios.
Based on the extended STIRPAT model, this paper analyzes the driving factors of carbon emissions from the electric power industry in Jiangsu from 2002 to 2017, and uses the Monte Carlo method to simulate the evolution trend from 2018 to 2030. The results show that: Firstly, population scale, urbanization level, GDP per capita, industrial added value, and electricity consumption intensity promote the increase of carbon emissions in the electric power industry in Jiangsu. Among them, the effect of the population scale and urbanization level is relatively significant. Secondly, trade openness and the transmission level of other provinces play a role in reducing carbon emissions. Among them, the effect of the transmission level of other provinces is relatively significant. Thirdly, under the baseline scenario and the green development scenario, the carbon emissions of the electric power industry in Jiangsu have shown a continuous growth trend, but the growth rate of carbon emissions has slowed down significantly under the green development scenario. Fourthly, the carbon emissions will reach an inflection point in 2025 under the high-quality development scenario, and the expansion of the electricity transmission and the improvement of energy efficiency have gradually become more prominent in reducing carbon emissions.
Based on different scenarios, the policy recommendations proposed are as follows:
According to the baseline scenario, if the past development model is followed, the carbon emissions of the electric power industry in Jiangsu will continue to grow, so the policy should be adjusted in time. Combined with the analysis of driving factors, it can be seen that the formulation of emission reduction policies can focus on population, urbanization, industrial structure, and foreign trade. From the perspective of population and urbanization, Jiangsu should adhere to people-oriented, green and low-carbon concepts in urban and rural construction, form a moderately population agglomeration pattern, and reasonably plan electricity supporting facilities to minimize electricity waste.
According to the green development scenario, adopting measures such as reasonable population planning, improving energy utilization, and strengthening electricity transmission can significantly slow down the growth rate of carbon emissions in the electric power industry. From the perspective of technology and industrial structure, (1) The government should accelerate the adjustment of industrial structure, develop the tertiary industry and high-end manufacturing, abandon the extensive economy, and reduce the electricity required for unit economic growth; (2) Insist on the strategy of innovation-driven development, strengthen cooperation with universities and scientific research institutions, and encourage research in areas such as energy saving and emission reduction, intelligent production.
According to the high-quality development scenario, under the premise of the government's promotion of the transformation of the industrial structure, the vigorously increasing of the electricity transmission, and the expansion of foreign trade, the electric power industry in Jiangsu has a large room for emission reduction. From the perspective of foreign trade and electricity transmission of other provinces, (1) Jiangsu should vigorously develop foreign trade, and realize the upgrading of foreign trade with the strategy of “quality imports and quality exports”. On the one hand, it is necessary to strengthen ties with traditional foreign trade markets such as the United States, the European Union, and Japan, actively introduce high-tech and concepts, and strengthen international cooperation in energy technology and environmental management. On the other hand, it is necessary to guide the manufacturing industry to transform from a production-oriented one to a production-service-oriented one, make production intelligent and green, and encourage the export of high-quality and high-value-added products, reduce the production of high-energy-consuming products; (2)Ensure cross-provincial electricity transmission through UHV AC and DC projects and ease the pressure on electricity supply in Jiangsu; accelerate grid integration, and establish a national energy Internet; reform the electricity price formation mechanism and promote power trading marketization to optimize resource allocation.
Carbon emission is a global environmental problem, which is related to global sustainable development. The study of carbon emissions in other regions, such as the Asia Pacific, is indeed of great significance to global sustainable development. We will consider the carbon emissions of the world in the follow-up research.
Footnotes
Acknowledgement
This research is supported by Introduction of Doctoral Research Start-up Fees (2021) (No.: 1042932103).
Declaration of conflicting interests
The author(s) declared no potential conflicts of interest with respect to the research, authorship, and/or publication of this article.
Funding
The author(s) disclosed receipt of the following financial support for the research, authorship, and/or publication of this article: This work was supported by the Introduction of Doctoral Research Start-up Fees (2021) (No.: 1042932103).,
