



Abstract
The global rise in energy consumption makes managing energy demands a priority. Here, the potential of Information and Communication Technology (ICT) in controlling energy consumption is still debated. Within this context, the main objective of the current study is to measure the impact of ICT, its potential benefit, and environmental factors on household electricity demand in Taiwan. A panel of data from 20 cities in Taiwan was collected during the period 2004–2018. We adopted PMG estimation and applied the DH-causality test for analysis. The estimation results show that ICT, carbon emissions, and climate change will drive household electricity demand in Taiwan in the long term. However, ICT has a higher potential to reduce electricity demand in the short-term period. In addition, the results of the causality test reveal a two-way interrelationship between ICT and electricity demand. Our study also found that climate change indirectly affects the use of electricity through household appliances. We also presented several policy implications at the end of this paper.
Introduction
Information and Communication Technology (ICT) has snowballed in the last few decades, followed by an increase in the application of computer technology, mobile phones, the Internet, and smart-television. Previous studies1–3 stated that the rise in the usage of these applications elevate concerns such as whether digitalization will further increase energy demand, or whether it will decrease it through the application of energy-efficient technologies. Research from Caglar, et al. 4 shows that if ICT is properly applied to the sectors which cause maximum pollution, it contributes to the improvement of overall environmental quality in terms of the ecological footprint. Lange, et al. 2 in their study also describes that the increase of energy efficiency through digitalization and sectoral change from the rise of ICT services have the potential to decrease energy consumption. Interestingly there are also studies which show contrary results stating that ICT has increased electricity consumption5–7 particularly in developing countries, 8 and has also been one of the causes of carbon emissions. 9 There is a disparity in previous study findings and research on the impact of ICT on energy demand still needs more examination, particularly in relation to climate change. These issues are rarely considered in ICT-energy demand nexus studies.
In order to reduce energy consumption within the context of mitigating global climate change and emission reduction, the Taiwanese government seeks to encourage the application of ICT in power generation and building smart grids in every region of Taiwan. Report from Ferry 10 and the research from Yu-Chen, et al. 11 show that the government also encourages application of technology, including ICT, in the industrial sector to reduce carbon emissions resulting from the combustion process. The graph from Figure 1 presents the annual report from EDGAR 12 which illustrates that in 2019 Taiwan experienced a decrease by 1.2% in total carbon emissions from 280.3 Mton in 2007 to 276.8 Mton.
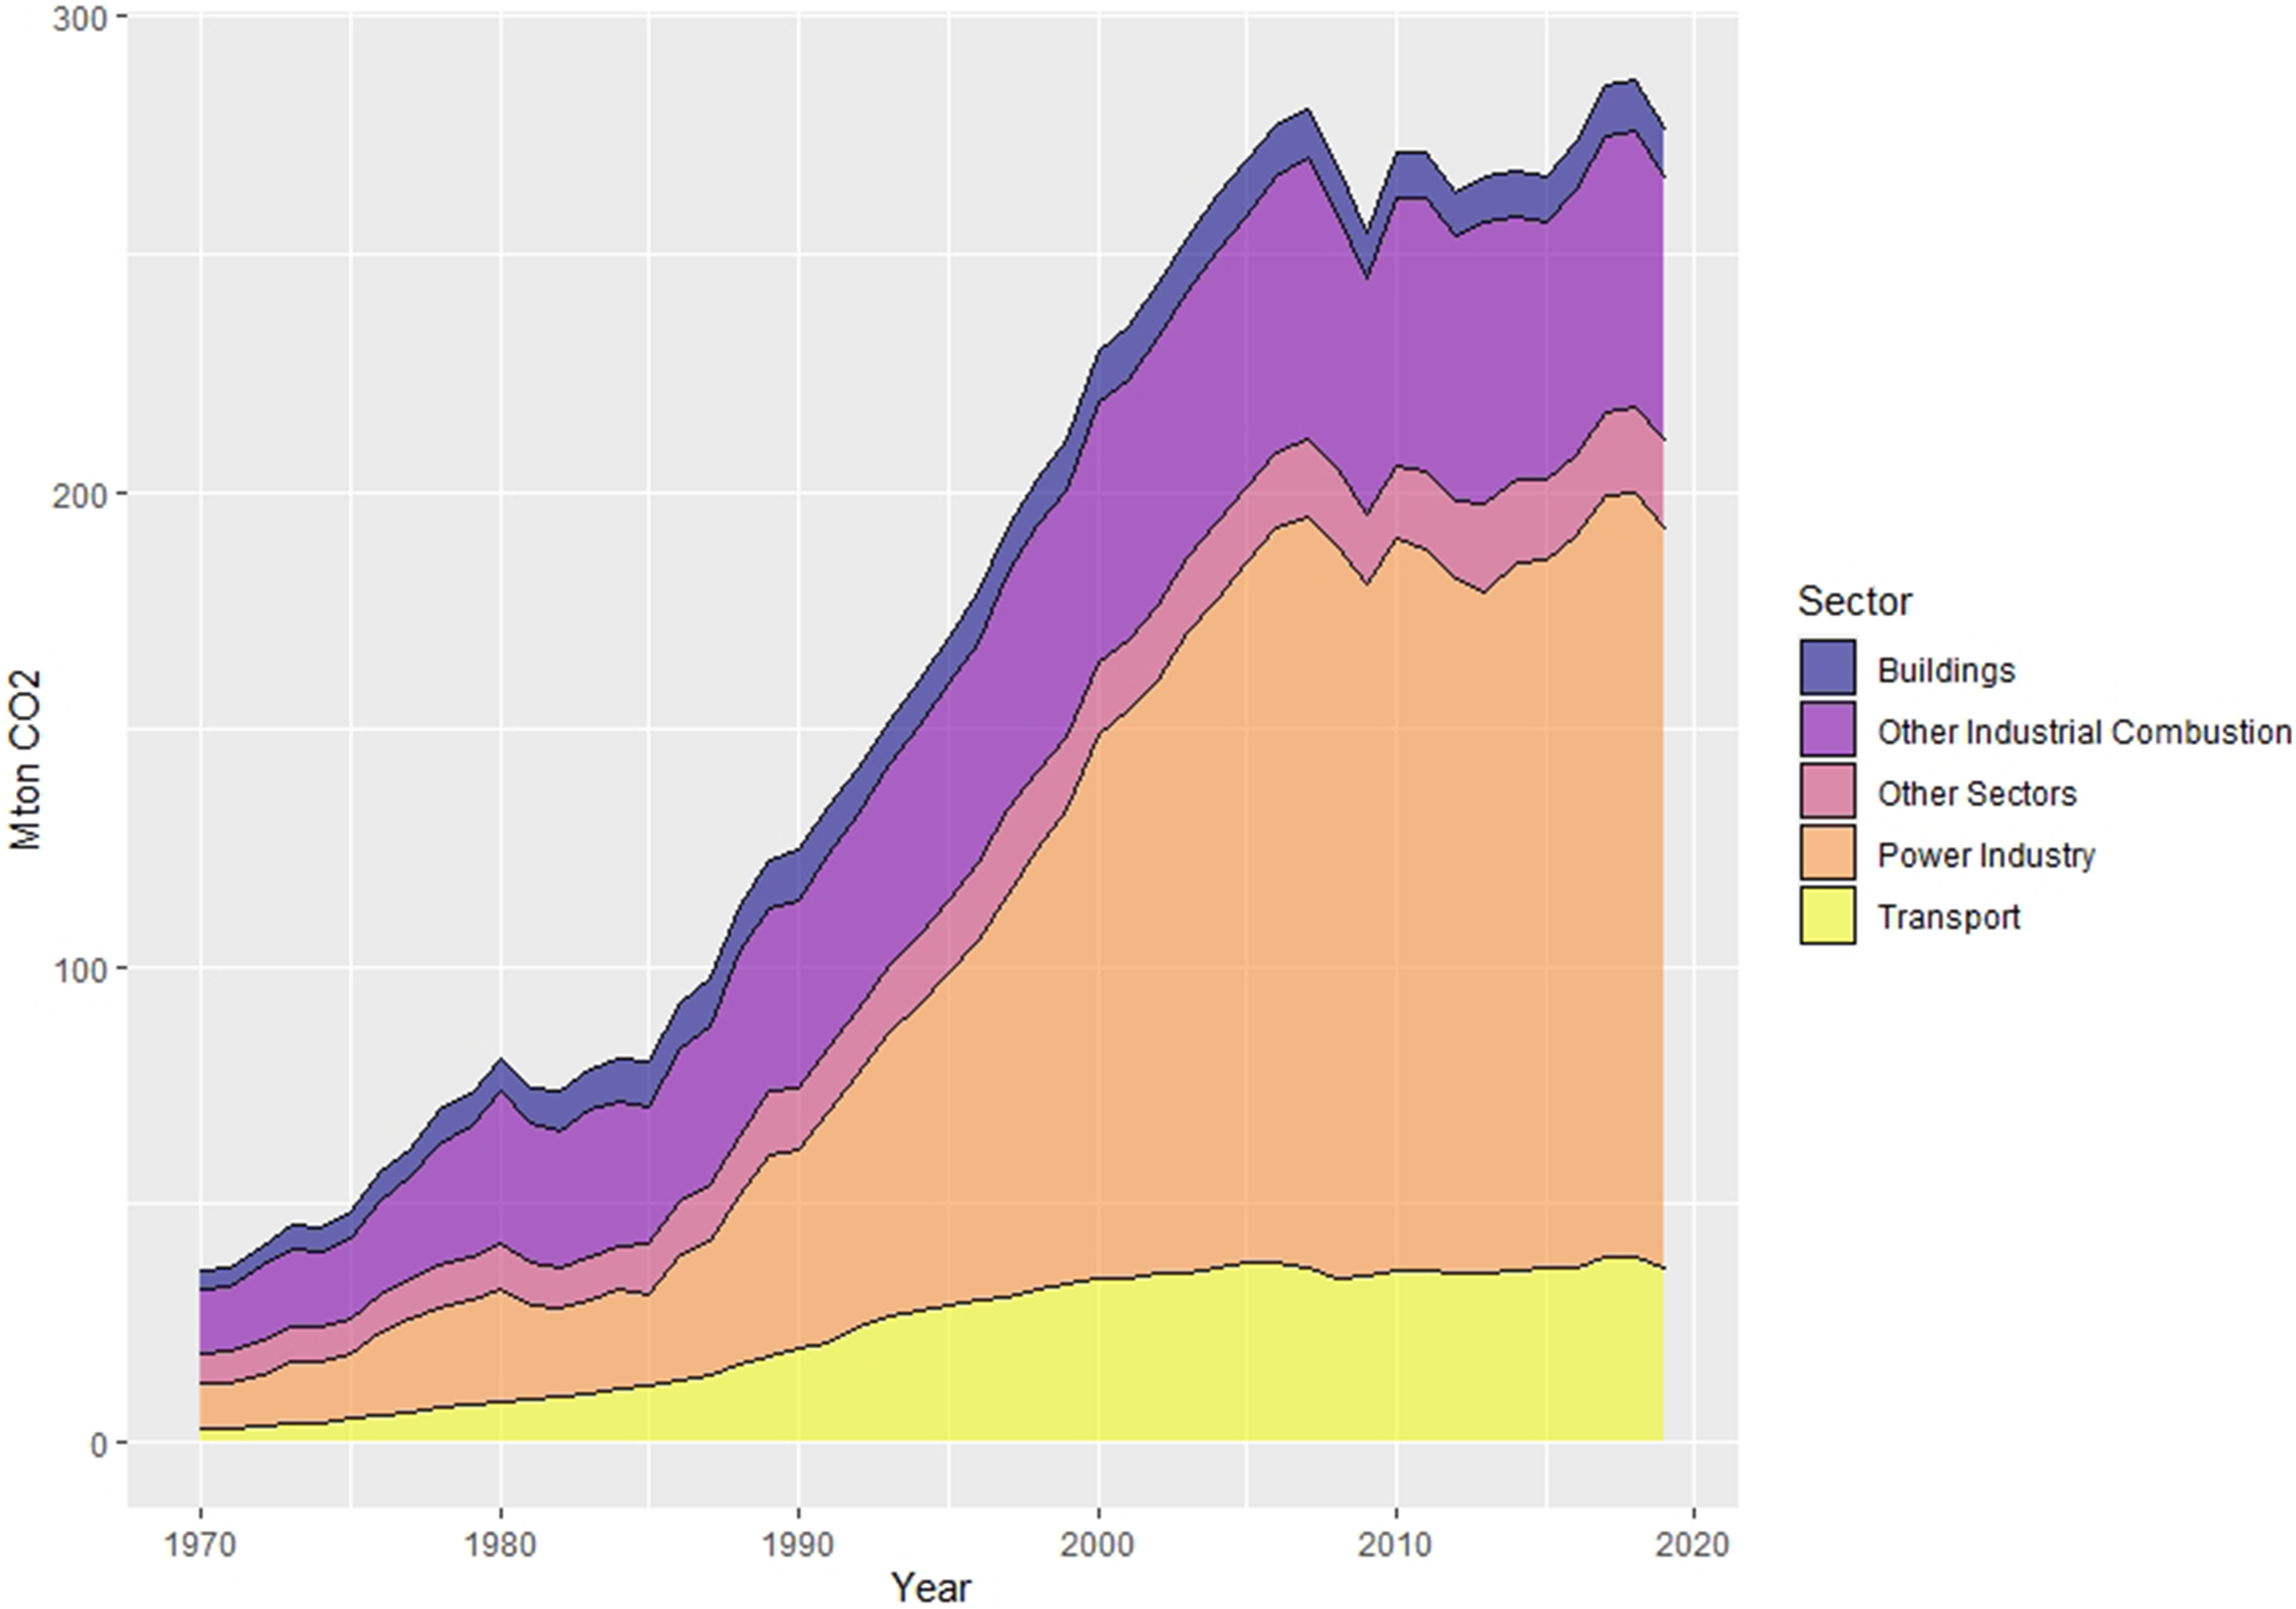
Carbon emissions by sector.
Interestingly the energy demands are seen to rise every year. For instance, BOE 13 reports that from 2004 to 2019, Taiwan experienced a rise in energy consumption by 12.38%. The total energy consumption in Taiwan until 2019 resulted in 84,909.6 103 KLOE. It was found that more than half of the total energy consumption was used for petroleum products and 29.9% was used for electricity needs. In terms of energy consumption by sector, the industrial sector topped the list In 2019, the industrial sector used half of Taiwan's total energy consumption, followed by the transportation sector at 25.2%, the residential sector at 12%, and the rest was the service sector and the agricultural sector.
Figure 2 shows the electricity consumption per sector in Taiwan. As of 2019, the industrial sector still ranks first in the sector with the highest electricity consumption in Taiwan, which is 55.6% of total consumption, then followed by the residential sector with 17.8%, the service sector with 17.6%, the agricultural sector with 1.1% and the last sector is transportation with 0.6%. Interestingly, since 2019 residential electricity consumption has been more significant than the service sector. Besides that, the average annual growth of residential electricity consumption is 1.2%, higher than the service sector with an average of 1.1% per year.

Electricity consumption by sector.
Studying the impacts of ICT on energy consumption is important and unfortunately, there is a lack of research in the past, in terms of the impact of ICT (i.e. Internet facility and TV colour) and climate change on household electrical energy demand.5–7,14 Furthermore, to the best of our knowledge, this is the first study to use data on Internet access and television subscriptions as a proxy for household ICT. The most recent study from Usman, et al. 8 examined the impact of ICT on energy consumption in South Asian countries which used phone subscriptions as an ICT proxy. This has been done in many previous studies.5–7,15,16 Besides that, no previous studies examined the effects of climate change in their ICT-energy demand nexus model.
Based on the energy demand factors from Filippini and Hunt, 17 the primary objective of this study is to examine the effects of ICT, carbon emissions and climate change on household energy consumption in Taiwan. In theoretical terms, this study adds on to the existing literature with respect to the ICT-energy demand nexus by including climate change as an important determinant in the model and describing the potential of ICT in controlling household energy consumption. It provides an alternative model for estimating the ICT-environment-energy consumption nexus using household energy demand factors. It also gives an overview of the impact of ICT in households, environmental quality, and household income conditions on residential electricity demand in Taiwan both for the short and long term. Lastly, through this study we also attempt to make some suggestions in terms of policy change, particularly for the electricity demand in Taiwan.
The remaining paper has been organized as follows. Section 2 presents the brief literature review. Section 3 provides the data and empirical strategies, and section 4 gives the results and discussions. Section 5 discusses the practical and policy implications, then section 6 provides limitations and future directions, and section 7 presents the conclusions.
Literature review
Carbon emissions and energy consumption
Several previous studies have examined the effects of environmental factors on energy demand models.18–21 For instance, Lean and Smith 18 measured the causal relationship between carbon emissions and energy consumption in five ASEAN countries. Their results indicated a positive and significant relationship between carbon emissions and energy consumption. Similar results were also shown by a study conducted by Menyah and Wolde-Rufael 19 in South Africa, where the study results showed the impact of carbon emissions on energy consumption. The study also found the positive and significant impact of carbon emissions on economic growth, both in short term and long term. Saidi and Hammami 20 carried out a study using global panel data from 58 countries. The study utilized a dynamic panel data model, generalized method of moments (GMM), during the time period of 1990–2012. The findings suggest that CO2 emissions have a significant impact on energy consumption for four global panels, and economic growth has a positive impact on energy consumption, which is statistically significant only for the four panels. To add onto these results, Lee and Brahmasrene 22 carried out a study in which they found ICT had a positive and significant relationship with carbon emissions in ASEAN countries. Belkhir and Elmeligi 16 also obtained a similar result by examining the global relationship between ICT and GHG emissions. Interestingly, several previous studies, including those conducted by Ozcan and Apergis, 23 which used data from emerging countries found the opposite results, indicating that ICT is a possible channel for reducing carbon emissions. These findings are supported by research from Al-Mulali, et al., 24 Lu 25 and Zhang and Liu 26 which used data from 77 countries, 12 Asian countries and China's regions, respectively.
The application of environmental factors in the framework of sustainable development was carried out by Zaharia, et al.. 27 The research used two approaches, including panel data and bibliometrics. The bibliometric method was used for literature review studies related to energy, emissions and economics. Panel data was used to analyse the impact of economic variables and carbon emissions on energy consumption in EU countries. The study results confirmed that greenhouse gas emissions, gross domestic product, population, and labour growth positively affect primary and final energy consumption. The study also discovered that rising health-care costs, the female population, the external balance of goods and services, environmental taxes, and renewable energy all reduce energy consumption. Alsaleh and Abdul-Rahim 28 also presented a critical study on the use of renewable energy in reducing carbon emissions. Using a data panel of EU28 members, they discovered that renewable energy in the form of hydropower and bioenergy can help to reduce CO2 emissions. They argued that using renewable energy should be prioritized in order to improve environmental quality. 29
Furthermore, environmental factors such as carbon emissions, renewable energy and climate change are crucial factors in analysing energy demand and economic growth.30–32 In particular, CO2 emissions and climate changes affect household decisions in the use of space heaters, air conditioners, and water heaters, which will then impact electricity usage.17,33,34 However, these factors have not been included in studies using the model of ICT-energy consumption nexus. Therefore, in this study, we try to fill this gap using a more comprehensive electricity demand model based on energy efficiency factors, such as family income to show economic factors, population, environmental factors, and ICT appliances. The purpose is to comprehensively explain the relationship between ICT appliances, environmental quality, and household electricity consumption.
Economic growth and ICT
Previous research has also provided some evidence on the connection between ICT and economic growth. For instance, according to Salahuddin and Alam, 5 Internet usage and economic growth drove electricity consumption in Australia. Interestingly, they found similar positive results when using data from OECD countries. 6 Interestingly, Ishida 14 used ICT investment data and achieved slightly contradictory results, claiming that ICT investment had no significant impact on GDP in Japan. Study from Ishida 14 employs Japan's data from the period 1980–2010. According to the study, ICT investment directly contributes to a moderate decrease in energy consumption but not to an increase in GDP. Similarly, according to a recent study by Usman, et al. 8 found that economic growth positively affected by ICT are only observed in Bangladesh and India, but ICT did not find any significant effects on economic growth in Pakistan and Sri Langka. The research also shown that ICT growth harmed energy consumption in several South Asian countries, including India and Bangladesh, but benefited Pakistan and Sri Lanka. However, environmental factors were not considered in that study.
Majeed and Ayub 35 conducted a study that used data from 149 countries which demonstrated a positive impact of ICT on economic growth. The study also discovered that emerging and developing countries benefit more from ICT than developed countries. From another factors, the growth of mobile phone users, particularly in Sub-Saharan Africa, has driven GDP per capita growth in each region, with a 10% increase in mobile phones boosting GDP per capita growth by 1.2 percent. 15
Energy consumption and ICT
Studies on the impact of ICT on energy consumption have frequently been carried out with various approaches, both using direct effects,36,37 energy efficiency,38–40 and growth approaches.5,6,14,36,37,41,42 The methods used also vary, such as energy and carbon footprint, life cycle assessment, and econometric time series and panel data. 2 Past research2,4,14,31,43,44 provides many insights into the impact of ICT on energy consumption. Also, usage of other forms of energy such as renewable energy can be encouraged by increasing the development of ICT in manufacturing processes. 45 Several studies5–7,46–49 have highlighted the impact of ICT particularly on electricity consumption. In general, the relationship between ICT and electricity consumption at the macro level reveals a positive relationship.6,7 Using the data from emerging countries, Sadorsky 7 presented a positive relationship between ICT and electricity consumption in developing countries, where a 1% increase in Internet users caused an increase in electricity consumption by 0.108%. A similar result was also shown by Salahuddin and Alam, 6 using panel data from OECD countries. The results of the study revealed that a 1% increase in Internet users drove electricity consumption by 0.026%. However, the study by Schulte, et al. 49 proved that the relationship was the other way around. Using data from 10 OECD countries and 27 industries, the results of their study showed a negative relationship between ICT and electricity demand, where a 1% increase in ICT capital reduced electricity demand by 0.23%.
Several studies relevant to our research were conducted by Van Heddeghem, et al., 50 analysing the trend of ICT devices’ electricity use. Based on three categories of ICT from their study; communication networks, personal computers, and data centres, it was found that electricity usage estimates had increased from 3.9% in 2007 to 4.6% in 2012. The growth in electricity consumption from ICT devices was higher than the growth in global electricity consumption. A more specific study examining the relationship between ICT and electricity consumption in a country was conducted by Ishida, 14 who examined the relationship between ICT investment, economic growth and energy consumption in Japan using the ARDL test The study results showed that the elasticity of ICT investment to energy consumption in the long term was −0.155 denoting that the ICT investment is able to reduce energy consumption in the long term. Using the ARDL bound test and Granger causality test method, Salahuddin and Alam 6 estimated the relationship of ICT, electricity consumption and economic growth in Australia for the time series data during 1985–2012. The study results confirmed that Internet use and economic growth lead to increased electricity consumption in the long run. In a broader sense, ICT played a critical role in promoting industrial renewable energy development. These results are also similar to another study conducted in twenty-seven European countries by Alsaleh and Abdul-Rahim. 45 According to their findings, an increase in ICT inputs promoted the growth of the bioenergy industry. These intriguing results confirm the advantages of ICT in the generation of renewable energy.
Another research closely related to our study was conducted by Sadorsky, 7 who used data from 19 developing countries. The methodology used was autoregressive distributed lag (ARDL) with a Generalized Method of Moments (GMM) estimator. The results of the study indicated that ICT has a positive and significant relationship to electricity consumption. The ICT variables used were the Internet users, mobile phones subscribers and number of PCs. Furthermore, using the ARDL panel with PMG estimator, Salahuddin and Alam 6 examined panel data from OECD countries during 1985–2012. The results showed that both ICT and economic growth stimulated electricity consumption in the short and long term. The results of causality testing showed that mobile phones and the Internet caused an increase in electricity consumption. Schulte et al. (2016) conducted subsequent research, covering 10 OECD countries and 27 industries, for 13 years. The study results revealed that ICT was associated with a significant decrease in electricity demand, where a 1% increase in ICT capital reduced energy demand by 0.235%.
Based on the findings from the above-mentioned studies, it can be seen that ICT does not always encourage an increase in electricity use. Several studies, such as Ishida 14 and Schulte, et al., 49 show that ICT can reduce energy demand. However, what needs to be observed is that both studies used ICT investment factors, which are different from other studies that used ICT appliances such as Internet facilities, mobile phone users, and the number of personal computers. The use of ICT appliances will illustrate the direct impact on changes in electricity consumption. Besides, looking at previous studies, the economic factor used is GDP. In our study, however, we prefer to use family income as an economic factor in order to focus on household energy consumption factors as shown in household energy demand model.17,30,51–53
Data and empirical strategies
The data
This study made use of observational data from central and local government periodicals and we were highly reliant on the availability of existing data. It was found that the data for all the selected variables was only available until 2018 and therefore, we made use of balanced panel data collected during the period of 2004–2018. Moreover, some data for the following year was still provisional and subject to change so we excluded it from our analysis. The data was based on 20 locations in Taiwan which included all the cities and counties in four regions, namely, Northern, Central, Southern, and Eastern Taiwan, excluding Fuchien Province. The data from Fuchien Province lacks complete data therefore it was excluded.
We combined data sets from several sources, i.e., the Urban and Regional Development Statistics of Taiwan, the Bureau of Energy from the Ministry of Economic Affairs of Taiwan, the National Statistics Bureau of Taiwan, the Central Weather Bureau of Taiwan, the Emissions Database for Global Atmospheric Research European Union. The electricity consumption data in this study represents the total electricity usage in Taiwanese households. This data is obtained from Urban and Regional Development Statistics, National Development Council. The electricity price data is the average price of electricity for Taiwanese households that we can get in the Bureau of Energy and the National Statistics Bureau. Furthermore, family disposable income and population data are obtained from the National Development Council's Urban and Regional Development Statistics. Table 1 shows a statistical description of the variables used in our study.
Descriptive statistics.

Degree days (DD) is the temperature conditions outside the room. DD is generally used to measure the impact of outdoor temperature on indoor energy use. DD is the sum of Heating Degree Days (HDD) and Cooling Degree Days (CDD).

Empirical strategies
The equation used in this study is based on energy demand model proposed by Filippini and Hunt 17 and in relation with ICT based by Salahuddin and Alam. 6 One of the most important aspects of Filippini's 17 energy demand model is that it incorporates climate change factors, in this case, degree days, as one of the important factors influencing household electricity demand. This is supported by studies conducted by the Filippini and Hunt 51 and Filippini and Hunt 54 using data from the United States, Filippini and Zhang 55 employing the data from China, and OECD countries. 17 As a result, our research aims to take this approach by incorporating climate change factors into our model. Furthermore, unlike previous studies that used mobile phone subscriptions and Internet users as proxies for ICT,5–7 we used the number of TVs in households and Internet facilities in our study. It is to accommodate technological developments that have been increasing at this time, where the use of household equipment is dependent on Internet access in the home and the development of television technology. We contend that by utilizing these various perspectives, this research will provide a new perspective for the study of the impact of ICT on household electricity consumption.
In accordance with the preceding literature, we present our model as follows:
First, we did the cross-sectional dependence test, unit root test, and panel cointegration tests to determine the appropriate autoregressive distributed lag (ARDL) model. Cross-sectional dependence testing was carried out using the CD test for panel-data models from De Hoyos and Sarafidis
56
which adopted three models from Pesaran,
57
Friedman,
58
and Frees.
59
The null hypothesis used in this test is cross-sectional independence. After identifying cross-sectional dependence in the model, the unit root test was carried out using the cross-sectionally augmented IPS (CIPS) test proposed by Pesaran.
60

Furthermore, the panel cointegration test was carried out using the three models proposed by Pedroni, 61 Pedroni, 62 Kao, 63 and Westerlund 64 to get robust results. The use of Pedroni, 61 Pedroni 62 cointegration test makes it possible to obtain various statistical tests so as to produce more robust considerations. Then, another approach is used by Kao 63 where he bases a residual-based cointegration test In addition, the use of the Westerlund 64 test in this study is to accommodate the cross-sectional dependence on the data used.
The ARDL model used in this study is the pooled mean group (PMG) estimator. PMG allows heterogeneity only on short runs compared to mean group (MG), which allows heterogeneity in both short-run and long-run. PMG estimator is also better than fixed effects because it produces a more robust estimate of endogeneity and the existence of unit root.
65
However, we need to bear in mind that the PMG model in this study is determined by comparing the results of three models, PMG, MG and CCEMG. The mean group and pooled mean group are the two most commonly used ARDL models, according to Caglar, et al.
4
and Osman, et al..
66
Pesaran and Smith
67
proposed the MG estimator, whereas Pesaran, et al.
68
proposed the PMG estimator, which denies long-run coefficients equality but allows short-run coefficients and error variances to differ across groups. The long-term coefficients are calculated by the MG estimator by taking the average of the long-term coefficients calculated for each unit. As a result, the long-term and short-run coefficients can vary depending on the unit. While PMG maintains the long-run coefficient constant, it allows the short-run coefficient and error variance to vary with units.
4
The PMG model is written as follows:


Where Δ is the model's first-difference operator, i is the location, t is the time period, and
Based on Lopez and Weber, 69 knowing the causal relationship between variables will provide a clearer idea of the government's policies. Therefore, this study conducted a causality test using the Dumitrescu–Hurlin (DH) Granger causality test
Results and discussions
CD test and panel unit root test
A series of tests were carried out, including cross-sectional dependence test, unit root test, and panel cointegration tests to determine the best ARDL model. For the first step, a cross-sectional dependence test (CD test) was performed.
Cross-sectional dependence test.

The CD test results from Table 2 strongly reject the null hypothesis which is the cross-sectional independence. The correlation of residuals values shown from the three models indicate a cross-sectional dependence under FE specification. The test results also indicate that the three test models, Pesaran, Frees, and Friedman, are all significant at the 1% level.
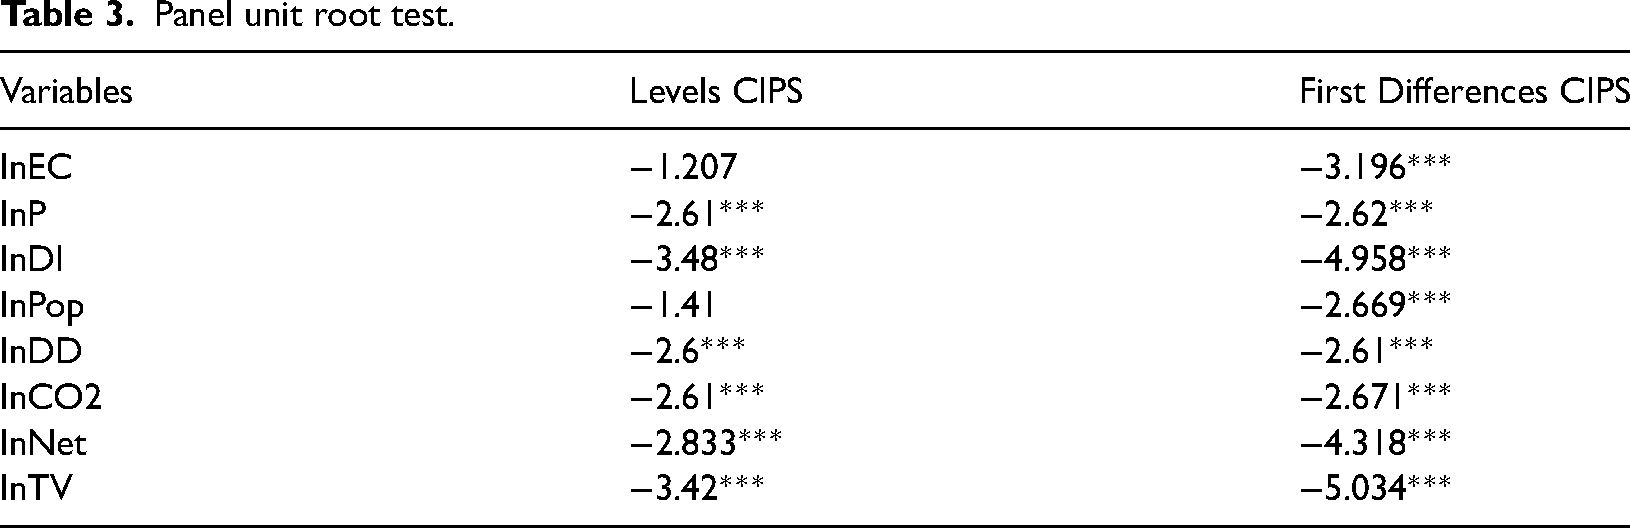
Table 3 presents the results of the panel unit root test. The unit root test using the CIPS model from Pesaran 60 shows that all variables are first-difference stationary.
Panel unit root test.
Panel cointegration test
From Table 4, we can see the results of the cointegration test of the three models used. The cointegration test using the model proposed by Pedroni, 61 Pedroni 62 demonstrates that five of the seven test statistics used are significant at the 1% level, one test statistic is significant at the 5% level, and the panel t does not offer a significance level. It means that six of the seven tests used strongly reject the null hypothesis of the series which are not cointegrated. The cointegration test from Westerlund 64 shows that the Gt test is significant at the 10% level and the Pt test is significant at the 5% level, which means the hypothesis that the series are not cointegrated is rejected. The cointegration test results from Kao 63 also show that three of the five statistical tests used are significant at the 1% level, and one test statistic is significance at the 5%. In other words, the null hypothesis that states no cointegration is strongly rejected.
Panel cointegration test.

Note: - *, ** and *** denote 10%, 5% and 1% levels of significance respectively.
- The lag lengths are selected using AIC.
Estimation result
Several tests were conducted such as the CD test, the unit root test, and the stationary test CD test result shows the cross-sectional dependence on the data used, the stationary test using the CIPS test shows that all the variables used are stationary in the first difference. The cointegration panel test demonstrates that the majority of statistical tests strongly reject the null hypothesis and that there is no cointegration in the series. We could use several ARDL models, including the most popular is MG (Mean Group) or PMG (Pooled Mean Group). Pesaran and Smith 67 proposed the MG estimator, and the PMG estimator was proposed by Pesaran, et al.. 68 To accommodate the cross-sectional dependence on the data panels used, we also employed CCEMG (Common Correlated Effects-Mean Group) model proposed by Pesaran. 70 Finally, after performing the Hausman test we chose to execute PMG estimation.
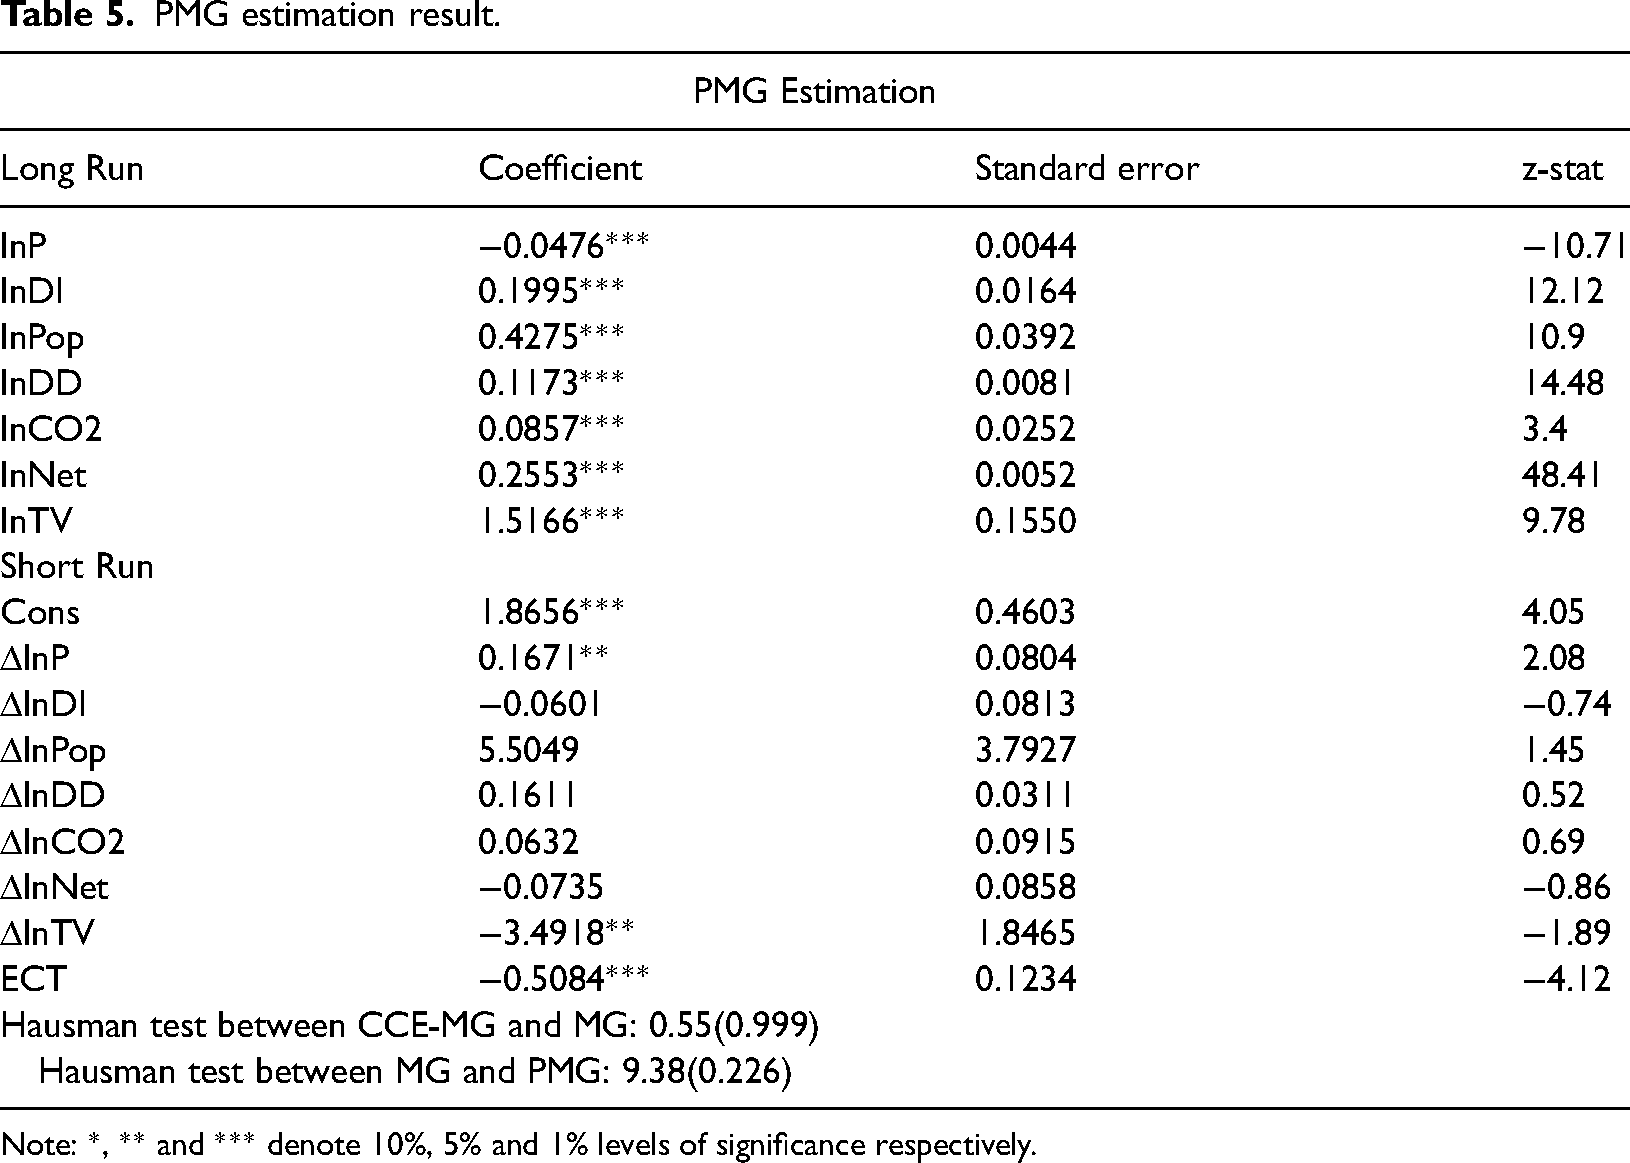
According to the PMG estimation results in Table 5, all of the estimated coefficients in the long term have a significant sign at the 1% level (p < 0.01). As a result, the estimation results of log-log variables confirm the expected results in the long run. The household electricity demand model in Taiwan is price inelastic, specifically −0.047, indicating that rising or falling electricity prices will have no long-term effect on electricity demand in Taiwan. However, it has a positive sign (0.167) in the short term and is significant at 5%, indicating that it is price elastic. It means that any short-term change in electricity prices will affect household electricity demand; for example, a 10% increase in electricity prices will result in a 1.67% increase in electricity consumption.
PMG estimation result.
Note: *, ** and *** denote 10%, 5% and 1% levels of significance respectively.
Aside from price, another economic variable is family income. The estimation results show that income has a positive and significant long-run relationship with household electricity demand at the 1% alpha level. According to the estimate, every 10% increase in household income increases electricity consumption by 2%. This condition, however, varies with the short-term situation, in which the sign on the income coefficient has a negative sign but is not significant. On the other hand, the population showed a positive, persistent, and significant sign at the 1% level. According to the PMG estimate, if the population grows by 10%, household electricity demand will rise by 4.27 percent in the long run. It is consistent with the short term, where there is a relatively large increase of 55%, but the estimation results show that this variable has no significant effect on electricity demand in the short term.
Furthermore, environmental quality indicators such as degree days and carbon emissions show a similar trend in both the long and short term. In the long run, the environmental quality factor has a positive and significant (p < 0.01) effect on controlling Taiwanese household electricity demand. According to the PMG estimates, every 10% increase in degree days and carbon emissions increases electricity consumption by 1.17% and 0.85%, respectively. This amount is nearly identical to the short-term condition, but it has no effect on household electricity demand.
Another factor, ICT, indicated by the percentage of Internet facilities and the percentage of TV users, shows an interesting result. In the long run, ICT has a positive and significant sign (p < 0.01) in determining household electricity demand, with a 10% increase in Internet facilities and TV users increasing electricity consumption by 2.55% and 15.17%, respectively. However, in the short term, both cases show a negative trend, indicating that every 10% increase in Internet and TV users reduces electricity consumption by 0.73% and 34.92%, respectively.
In general, the estimation results from the model used in this study are satisfactory. It is due to the relationship for each variable indicating the expected sign, which is most noticeable in the long run. Meanwhile, the estimation results show some differences in the short term. This is also consistent with previous research findings.4,8 Based on the estimation results, it is clear that several factors play a significant role in influencing Taiwan's energy demand. The first is population growth, which has a positive long-term and short-term impact on the amount of household electricity demand. This is also related to the number of family members who have access to electricity at home. In the long run, it is also clear that the ICT factor plays an important role in encouraging household energy consumption. The magnitude of the coefficient value shown by the variables of Internet facilities and television users in the proposed model demonstrates this. However, in the short term, this condition is the inverse. Environmental factors also play an important role in driving both long-term and short-term electricity consumption. In Taiwan, the climate change factor indicated by degree days has a moderately strong coefficient value in influencing electricity consumption.
The causal interrelationship between ICT and electricity consumption
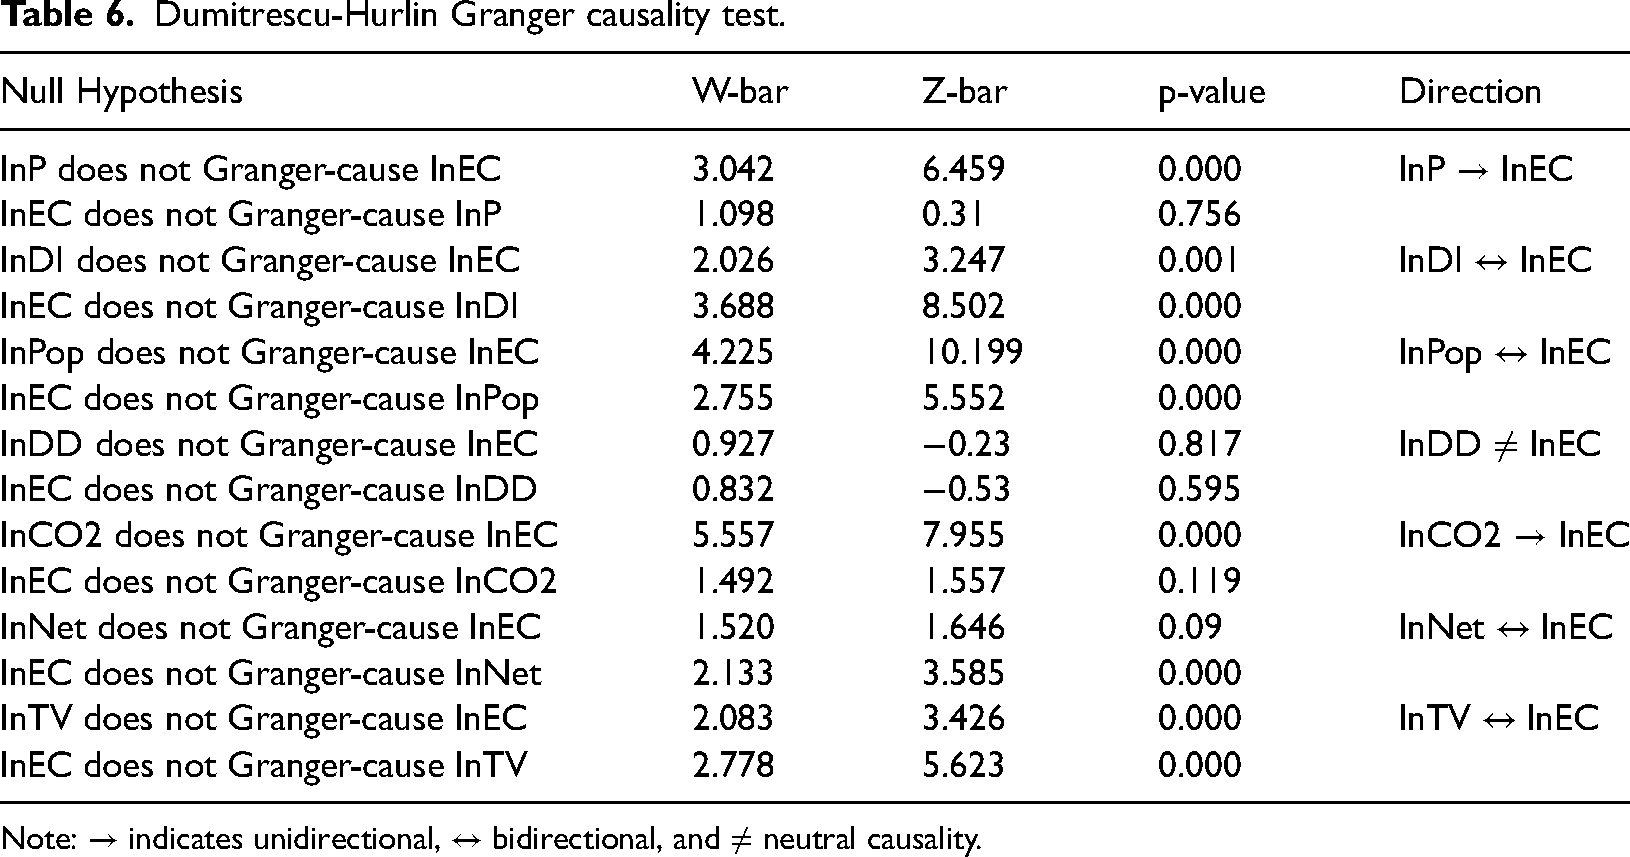
The estimation results of the short-run causality test using the DH-Granger causality test shown in Table 6 illustrate that the variables used in this study have various directional, both one-way, two-way directional, and neutral causality. From Table 6, we recognize that the variables which have a bidirectional causality with electricity consumption include disposable income, population, Internet facilities, and television usage. The bidirectional relationship confirms that an increase in these variables causes an increase in electricity consumption and vice versa. Moreover, the variables that have a unidirectional causality with electricity consumption are the electricity prices and carbon emissions; it shows that these variables have a unidirectional causality, indicating that changes in prices and carbon emissions will cause changes in electricity consumption, but changes in electricity consumption do not change either of them. Another variable, specifically degree days, explicates neutral causality with electricity consumption.
Dumitrescu-Hurlin Granger causality test.
Note: → indicates unidirectional, ↔ bidirectional, and ≠ neutral causality.
Discussion
The estimation results show that the ICT factor indicated by Internet facilities and the number of TVs positively impact electricity demand in the long term. Through this result we contend that in the long run, digitalization will lead to an increase in household electricity consumption. Our finding confirms the results of a study conducted by Salahuddin and Alam, 6 which showed that an increase in Internet users in OECD countries would increase electricity use. Likewise, a study conducted in several developing countries by Sadorsky 7 showed similar results where the ICT positively and significantly affected the electricity consumption. We contend that in the long-term ICT will have a positive effect on electricity demand, and on the contrary, in the short term, ICT will have a negative effect. This result is interesting because it shows the potential of ICT in reducing electricity consumption in the short term. The results of specific short-term estimates distinguish our research findings from previous studies carried out by Salahuddin and Alam 6 and Sadorsky 7 which is found that an increase in ICT will drive the electricity demand.
We also considered family income as an economic factor in this study, and the results show that increasing income will increase household electricity consumption in the long run. However, this rise will have no immediate impact on electricity consumption. This demonstrates that the government needs to continue carrying out campaigns that emphasize using efficient energy at home must always be carried out in order to have a long-term impact. For example, campaigns promoting the use of environmentally friendly household appliances that meet green appliance standards. This energy efficiency campaign should be carried out more aggressively, focusing on higher-income households due to their greater ability to adopt efficient technologies. These findings show that any price changes will have no long-term impact on the electricity demand.
The potential of ICT to control electricity consumption is a good sign for the government's energy efficiency programme. The Taiwanese government constantly encourages the use of ICT in power generation and the construction of smart grids. The government's efforts have yielded positive results as the household energy efficiency programmes are inextricably linked to technological innovation, particularly energy-efficient household appliance technology. Accordingly, the implementation of energy efficiency policies should be carried out in combination with energy conservation programmes. Energy conservation programmes are related to the community's efforts to reduce their energy consumption by adopting energy-saving habits consciously. However, it is not easy because, in practice, energy-saving efforts are often beyond expectations. In other words, household electricity-saving efforts are lower than the proportional level of energy efficiency.30,33
This study also found that the factor of daily climatic change indicated by degree days significantly impacted the electricity demand. It is related to making use of household devices such as room heaters, air conditioners, and refrigerators. These devices are highly reliant on the temperature conditions outside the room. It is generally known that these household appliances require a large amount of electricity. 30 Therefore, unstable climatic conditions will indirectly affect the use of residential electricity through such household appliances. The government should take efforts to control electricity demand, promote energy efficiency policies through technological innovation and carry out environmental control efforts to reduce greenhouse gas (GHG). One of the ways to reduce GHG is through controlling carbon emissions. By controlling carbon emissions, it will impact reducing GHG, and in turn, will have a multiplier result on energy demand and sustainable economic growth.
The results of the Granger causality test from Dumitrescu and Hurlin, 71 which are displayed in Figure 3, reveal a bidirectional relationship between income, population, and ICT with electricity consumption. Our findings prove that there is a feedback hypothesis between these variables. The feedback hypothesis proposes that electricity consumption and the three variables are jointly determined and complement one another. The results suggest that ICT has a two-way causal relationship with electricity consumption. Thus, an increase in the number of Internet facilities and the number of TV users will increase household electricity consumption and vice versa. An increase in electricity consumption will increase Internet facilities and the number of TV users.

Short-run causalities.
Meanwhile, electricity prices and carbon emissions have a unidirectional relationship with household electricity consumption. These results indicate that electricity prices and carbon emissions influence electricity consumption. For carbon emissions, an increase in CO2 levels or carbon emissions in the air will increase household electricity consumption. However, it is not detected in the relationship between degree days and electricity consumption, which shows neutral causality.
Practical and policy implications
Based on the findings of this study, we can summarize several policy implications. Firstly, controlling electricity demand only through the electricity price channel will not effectively reduce household electricity consumption because the results of this study prove that electricity prices in Taiwan are price inelastic. Therefore, regulating electricity demand must be followed by a non-price policy that will stimulate customers to direct attention to their electricity consumption. The family income factor, which is one of the drivers of electricity consumption, can serve as the foundation for the government's decision to target the upper-middle-income group as a target of energy efficiency policies. Moreover, the government can broaden the green tax, particularly on household goods, due to which people will more likely be interested in using environmentally friendly household appliances.
Secondly, environmental factors, mainly carbon emissions, play an essential role in controlling household electricity demand. This study proves that if the government can control carbon emissions, it will impact household electricity demand. The government's priority should be to reduce carbon emissions whether generated from industry, transportation, or households. This is also evidenced by the unidirectional relationship between the total carbon emissions and household electricity demand. In addition to carbon emissions, the ARDL estimation results show that the climate change factor indicated by degree days has an impact on Taiwan's electricity consumption. Therefore, the policy of mitigating the effects of climate change will have a positive impact on controlling electricity consumption. It is consistent with the approach of technological innovation through the application of energy efficiency principles, which has the advantage of reducing electricity consumption while also having a positive impact on the environment.
Thirdly, based on the ARDL estimation results in this study, although the long-term growth of ICT has a positive impact on increasing household electricity consumption, in the short term, ICT can reduce household electricity use. It reveals that ICT has a contribution to environmental improvement and promotes sustainable growth in a short time. Therefore, we must support the government's efforts to encourage energy efficiency programmes through energy-friendly technological innovations, the construction of smart-grid systems for the entire territory of Taiwan, and initiate other energy efficiency programmes. In addition, the government should strengthen conservation efforts by making persuasive appeals through the media, including the television, encouraging all the citizens to participate in energy saving.
The government can also consider improving the energy conservation programme by focusing on middle- to upper-income households and encourage people to use ICT more effectively and efficiently. Energy conservation is an important action to control energy consumption, and it should be a programme that works in tandem with national technology development. It is undeniable that as technology in terms of ICT advances so will the demand for energy. Therefore, if an energy efficiency programme is not implemented in conjunction with the appropriate energy conservation policy, it will be ineffective.
Limitations and future directions
This study is not without limitations. The ICT factor used in this study cannot perfectly describe the actual ICT growth conditions because it only uses Internet facilities and the number of TV variables. Further research can also add other variables, such as the percentage of household coverage that utilize the smart grid, mobile phone users, or ICT investment. Besides, the causality relationship in this study only considers the relationship in the short term. We suggest that further research could complement this by applying a comprehensive causality model. Due to limited availability of data, we chose balanced panel data collected during the period of 2004–2018. This can be considered as one of the limitations. We suggest future studies could incorporate data for the following year once it becomes available. Lastly, the current study was carried out in Taiwan. Every country or region has their own specific economic grown conditions. Therefore, as the current study results are specific for Taiwan, it might not be possible to generalize these findings for other geographic locations. We suggest that future research could be carried out in both similar and dissimilar economies and comparison be made in terms of best government practices and policies. Several issues including the interrelations between energy consumption and renewable energy could be a valuable study in the future.
Conclusions
This study tries to provide a broader perspective by including environmental factors in the ICT and energy demand nexus model. We found that electricity price will have a negative effect on electricity demand in the long term. Furthermore, the economic variable indicated by family income level reveals that, in the long run, family income factors will have a positive and significant effect on energy use. On the other hand, environmental factors present a positive and significant impact on household energy demand. Similar conditions also occur in ICT growth as indicated by the number of Internet facilities and TV users.
In the short term, the ICT factor will have a negative impact on electricity demand, meaning that ICT will have the potential to reduce household electricity demand in the short run. Furthermore, the causality test results prove that environmental factors, particularly carbon emissions have a unidirectional relationship with electricity consumption, while degree days have no causal relationship. On the other hand, the ICT factor, both the number of Internet facilities and the number of colour TVs, confer a bidirectional relationship with household electricity consumption.
Footnotes
Acknowledgements
This research did not receive any specific grant from funding agencies in the public, commercial, or non-profit sectors. We are grateful to the editor and two anonymous referees for their constructive remarks and helpful improvements to the paper. Nonetheless, we are responsible for any errors or omissions.
Declaration of conflicting interests
The author(s) declared no potential conflicts of interest with respect to the research, authorship, and/or publication of this article.
Funding
The author(s) received no financial support for the research, authorship, and/or publication of this article.
