
Abstract
In this paper, we analyse two phenomena. First, the relationship between greenhouse gases emission and effectiveness of the European Union energy policies and second the transition from the fossil fuels to renewable energy sources. We run two-step data analysis concerning 25 European Union member states in the period from 1990 to 2018. We use information on greenhouse gases emission, introduction of new energy policies, source of energy supplied and merge it with macroeconomic data on the countries’ structural characteristics. We assess their long-run relationship and direction of causality using panel cointegration tests and dynamic panel data models. We identify a statistically significant effect of energy supply source, energy policy introduction and greenhouse gases emission. However, we were not able to confirm that European Union energy sector is in transition. Thus, obtained results confirm that the EU energy policies are effective however not sufficient enough in decreasing use of fossil fuels to call it a transition towards renewables.
Keywords
Introduction
The endeavours of the European Union (EU) aimed at decreasing human influence on climate change have resulted in a number of environmental policies. Most of them focus on greenhouse gas emission, putting particular emphasis on carbon dioxide emissions which represent 76% of all gases emitted within the EU. Carbon Dioxide (CO2) is an effect of burning fossil fuels with the purpose of obtaining energy. In order to decrease its negative impact, since 1997, the EU has been introducing new policies that are aimed at: decreasing fossil fuels share in energy mix, increasing energy efficiency of the EU member states, and covering energy gap with renewables. An increase in production of energy from renewables has led to mainstream belief that the EU energy sector is in transition. However, to speak about such a transition, certain conditions must be met. If not, it is more appropriate to call the phenomenon an evolution (or addition).
First recorded studies on influence of human activities on environment dates back to 18th century 1 . However, the majority of the empirical analysis has been published during last three decades. In the field of economy three main areas can be distinguished, all of which provide scientists with mixed results. First, investigating correlation between economic growth and energy consumption, show no consensus. Second, focusing on economic growth and pollution, which verifies hypothesis on existence of the environmental Kuznets curve. This research assumes that at some point of development economies decrease their pollution with further growth. 1 – 5 However, this theorem has been challenged in various publications. Main charge against it is the lack of robustness of the analysis at which environmental Kuznets curve is based on.6,7 Third field combines both previously described. It examines the correlation between economic growth, pollution, and energy consumption. However, results of those analyses vary between countries. The mixed findings reflect several factors, including country differences, model specification and methodological approach.
The negative impact of fossil fuels on climate change have been proven many times,8–10 however correlation between economic development, source of fuel (and its change) and CO2 emission leaves an open space for research; particularly, because of the fact that vast amount of studies focus on the Kuznets curve, not taking into consideration additional variables that may affect the correlation.
The purpose of this paper is to investigate the relation between energy supply sources, EU policies and greenhouse gases emissions, as well as to test if the EU fossil fuels are exchanged for renewable energy sources, or the renewables serve only as an addition to cover energy demand. This research should answer whether it can be said that the European Union energy sector is in transition or that it is just evolving by adding new energy sources.
This paper employs two-step analysis. First, in order to check trends, the EU energy sector statistic were investigated with the use of descriptive analysis. Second step consisted in establishing a set of regression which described correlation between energy supply sources, EU policies, greenhouse gases emissions and changes in energy sources of the EU. Twenty-five EU member states were subjected to the analysis concerning the period from 1990 till 2018. Data was sourced from three databases – World Development Indicators (WDI), Eurostat and U.S. Energy Information Administration (EIA).
This paper encompasses five logically structured sections. Section 1 is the Introduction and presents general background of the study, as well as it sets its major aims and scope. Section 2 presents a broad context of the research; it provides the reader with an extensive discussion on the energy transition process and available literature. Section 3 presents methodological setting and data explanation. Section 4 presents and interprets results of empirical analysis. Finally, Section 5 constitutes a conclusion.
Literature review
Energy transitions
Energy transitions are not a broadly researched subject. Literature presents some assumptions that are used with the purpose of investigating this topic, however, all of those differ depending on the research scope. To define transition, at least two conditions have to be specified – time frame and substitution of fuel source. According to that assumption four “mainstream” definitions used in research were presented in Table 1.
Energy transition definition review.
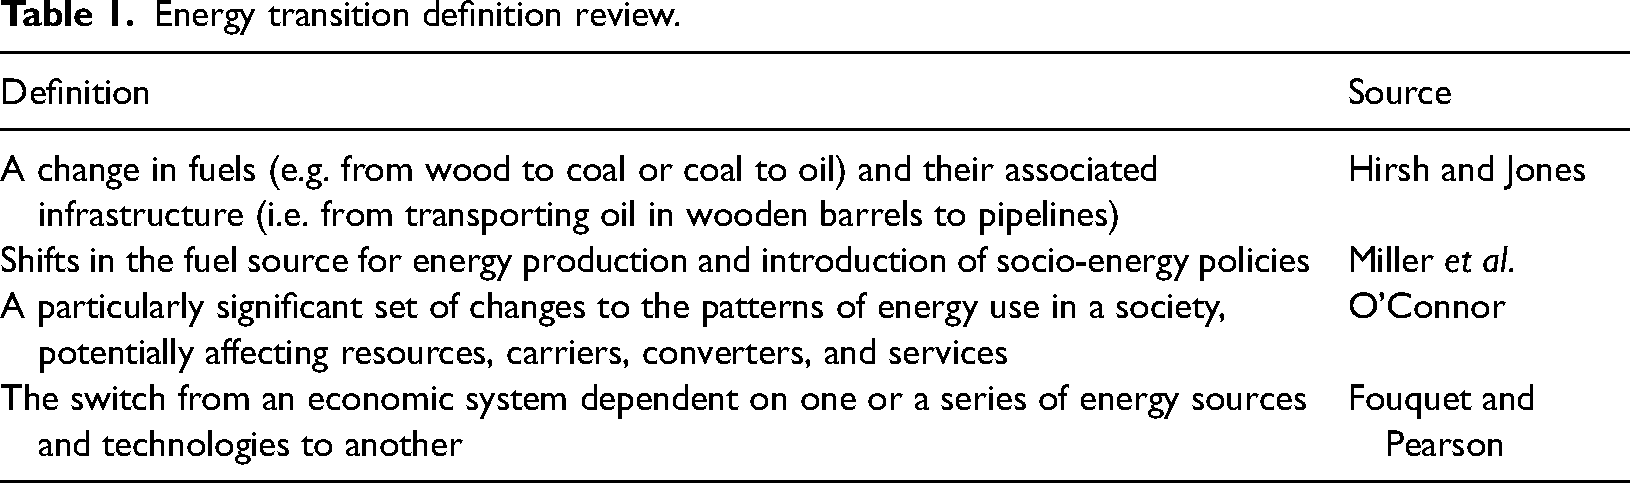
Energy transition definition review.
The main feature of the aforementioned definitions is change of a fuel source. However, for transition to happen, such a change is not enough. Researchers’ opinions differ on what additional condition have to be met in order to confirm the energy transition. Hirsh and Jones 11 argue that it is crucial that change of fuel is accompanied by a technological shift, but not only the one that uses it (i.e. from internal combustion engine to electric engine), but more importantly, the change that enables an increase in efficiency of infrastructure. Transitions were also described by Miller et al. 12 ) based on the phenomenon of turning towards photovoltaic energy in Arizona. Beside the fuel source, the authors added a crucial condition of socio-energy policies that have to be introduced by governing bodies. Those policies should have two main roles: first, to provide a guideline for development of new energy technology, and second, to control the rapid exploitation of sources and environment (i.e. by nuclear waste disposal control). Only O’Connor 13 provided a specified definition (however very general). According to his assumptions, any significant change concerning energy sector leads to energy transition. However, following the author's understanding, an energy transition takes place not only in macro- but also (and mainly) in microscale. One of the examples he provided, was transition from wood fireplaces to coal stoves which took place in the UK in the 17th century, and which was driven by rising costs of wood and enabled by easier distribution of stoves and coal. The latest definition was presented in an editorial by Fouquet and Pearson. 14 In their study, they presented new technologies using new type of fuel. In many cases, they were more expensive than conventional ones, however they became cheaper thanks to technological development or equipped with enhanced characteristics that new customers were willing to pay for. The authors argued that the main measure of success in history was the price of sourcing energy from new fuel.
Typically, phrase energy transition implies that new energy source is added to the mix and its share is increased while other sources remain constant with energy production or are, they decrease. In history, new energy sources were implemented during rapidly rising energy demand, 14 which implies that they might have served just as an addition. For the purpose of this research, energy transition should be defined as an increase of energy production from one source with its simultaneous decrease while using a different source or fuel. In other cases, it should be called an evolution (or addition).
As all processes, transitions should take place in specified time frames. However, most new technologies are developed in niche and their entrance may not be recognised. Usually, the beginning of transition is considered to take place when new fuel or technology obtains 1% of market share 15 and it ends at 25-50% of market share.16,17 Nevertheless, the aforementioned time frame does not specify the actual time of a transition. Main reason for that is that each transition we are aware of, took different number of years. For example, in the United States, natural gas needed 70 years to rise from 1% to 20% of market share. In the case of crude oil, it took 50 years to reach 10% from its exploration in 1860's and additional 30 years to reach 25%. The coal needed 103 years to account for only 5% of the US energy supply. 18 The above-mentioned periods take place at a slow, nonconstant pace. After reaching 5% of a market share, coal needed only 26 years to gain additional 20 pp. while oil gained 21.6% of market share (from 2.4% to 24%) between 1890 and 1925. 19 This phenomenon confirms Fouquet and Pearson 14 thesis, that new sources of energy develop in niche till they reach a point of becoming cost-effective. Pace of transition may also be driven by geopolitical and economic reasons, such as lack of resources for investments and research and development as a result of financial crisis. Previous transitions that were explored, needed at least 40 years from the stage of being technology novelties up to their dominance. Aggregate transition of whole economy could take centuries, as it requires change in fuels and technology of multiple energy services. 20
For the purpose of this research, energy transition is defined as a change (replacement) of one energy source for another one, combined with the development of technology.
Energy policies implications
Energy policies play important role in balancing trade-offs among competing goals of coping with challenges from the politics, technology, and economy especially in countries that have decided to support energy transition. 21 Substantial number of studies investigates impact of policies on the evolution of power supply and focus on interaction between regulations and market stakeholders. Iychettira et al. 22 analyses the effects of renewable energy support schemes, Chappin et al. 23 different energy and climate policies while Bhagwat et al. 24 and Bhagwat et al. 25 investigate the effects of strategic reserve and capacity mechanisms on the change of power supply. Li and Strachan 26 test various policy models. Their findings show that some models “account for co-evolutionary dynamics between policies, behaviour of investors and technologies”. Simulation of Barazza and Strachan 27 concludes that a successful transition requires the co-evolution of the policy dimension with the strategies of the heterogeneous market players.
Genser et al. 28 provide a better understanding of how electricity markets and their regulation can successfully co-evolve. Rabe 29 has concluded that state-level policies drive the energy transition, and policymakers frequently draw inspiration from success of the other states.
Since 1997, the EU Parliament has issued more than 15 documents (policies, directives, legislations) concerning implementation of renewable energy sources. Main reason for that kind of legislation is to decrease greenhouse gas emission by increasing the share of renewables in the EU energy mix to 20% by 2020 and up to 30% by 2030. What is important is the fact that this share should not be achieved by addition of new energy sources, but by the replacement of fossil fuels (as the EU Parliament agreed on increasing energy efficiency).
The main reason of these policies is to decrease emission of greenhouse gases and to slow climate change. Carbon dioxide represents 76% of all greenhouse gases, where 65p.p. are assigned to sourcing energy from fossil fuels (combined with industrial use of this fuels i.e. to obtain heat). 30 In 2019, energy related CO2 emission equalled to 33.3Gt. 31 The European Union is responsible for 22% of global CO2 emission and is one of the world regions that has the highest influence on climate change. 32 Based on that information, it is clear that transition from fossil fuels to renewables of low or non-greenhouse gas emission is a way to decrease greenhouse gas emission thus slowing down climate change.
The EU member states are not rich in the energy resources. Contemporary energy transition studies engage in geographically sensitive questions in resource peripheries, 33 spatial analysis of vulnerability to impacts of ‘low-carbon’ energy transitions,34,35 and community-level effects of energy transitions.35–37
Building on these threads of scholarship, this study focuses on how policy, energy supply source and macroeconomic factors influence the negative impact of human activities on the environment. It investigates whether possession of local fossil fuels impacts the energy transition, and it is challenging the hypothesis that the EU member states decoupled their development from energy consumption without negative impact on industry.
Energy sector in the Eu
Total energy produced in 2018 within the EU equalled to 1698,56 MTOE which was only 0.07% more than in 1990, but at the same time, 10.2% less compared to its pick in 2006. Energy produced using fossil fuels equalled to 1230.25MTOE, 12.9% less than in 1990 and 17.7% less than in 2006. As much as 241.73MTOE was sourced from renewables, which is 235% more than in 1990. The European Union's energy structure is strongly diversified because of differences in the economy and population of each member state. It is visible when the average production of energy in 2018 of 67.94MTOE is analysed taking into consideration different member states, e.g., Germany supplied the most energy within the EU (i.e. 316,12MTOE) and Latvia was the country which accounted for only 4.83MTOE, thus being the supplier of the least volume. It is more reasonable to compare production of energy per capita, where standard deviation is much smaller compared to the average. The highest supply was recorded in Finland (6.37TOE per capita) and the lowest in Romania (1.72TOE per capita). Summary of energy production statistics were presented in Table 2.
Change in energy supply within the EU, 1990–2018 comparison.
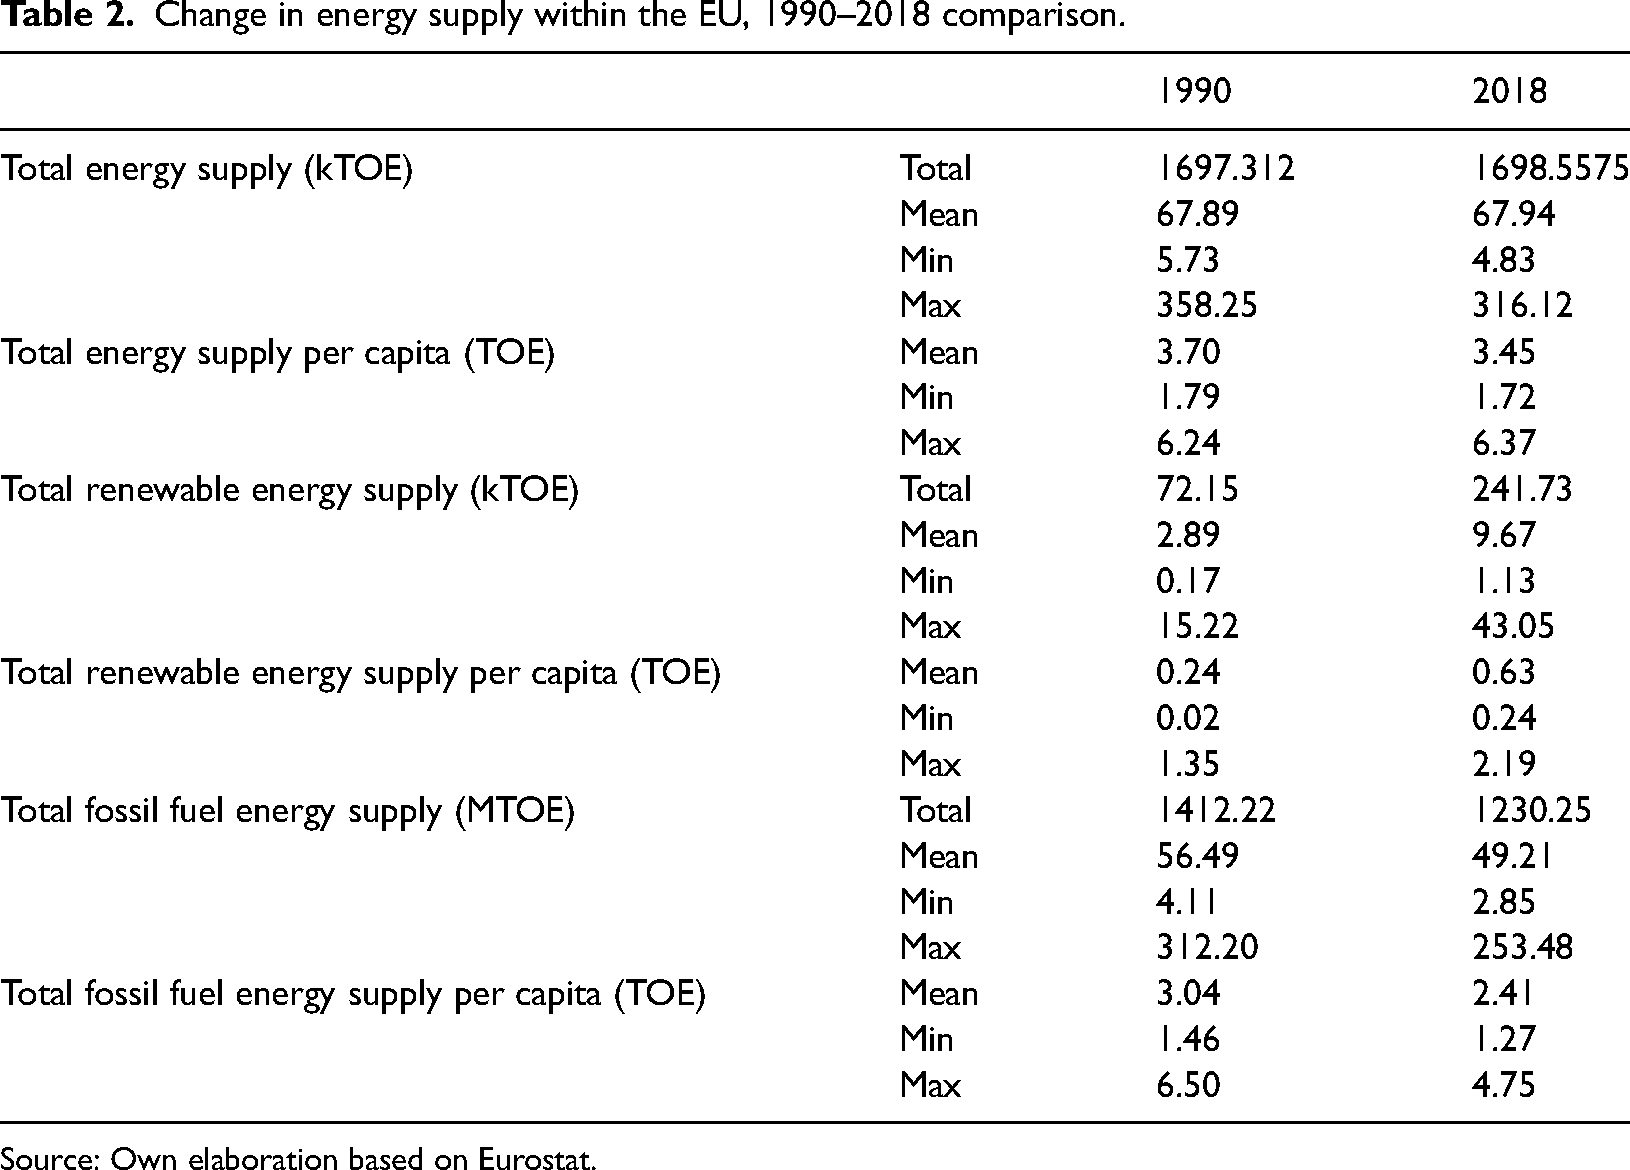
Source: Own elaboration based on Eurostat.
Long term empirical evidence suggests that energy used in economy is directly proportional to its development. 38 Given the negative impact of energy sector on climate change (especially technologies using fossil fuels), many countries decided on decoupling its economic performance from energy. This process relies on enhancing efficiency within economy by increasing units of produced output per unit of energy. In the EU, 21 out of 28 member states reached absolute decoupling in 2005. 39 The main concept of decoupling has been challenged by many researchers.40–43 The main charge against its success is the question whether deindustrialisation and moving the least efficient processes abroad may be called a decoupling, and additionally, whether the energy use of the foreign country should be assigned to the deindustrialising country. 40 Nevertheless, decoupling phenomenon maybe one of the reasons that in 2006, aggregated energy supply within the EU peaked thus changing a trend (Figure 1). The second reason for that may be assigned to Green Papers on energy security “ The European Strategy for Sustainable, Competitive and Secure Energy” 44 which was a response to a risk of natural gas shortage which in 80% had been imported from Russia through Ukraine 45 and “Energy Efficiency - or Doing More With Less” 46 which focused on energy efficiency (by setting target in energy usage reduction on 20%) in purpose of meeting the EU obligations towards the Kyoto Protocol.
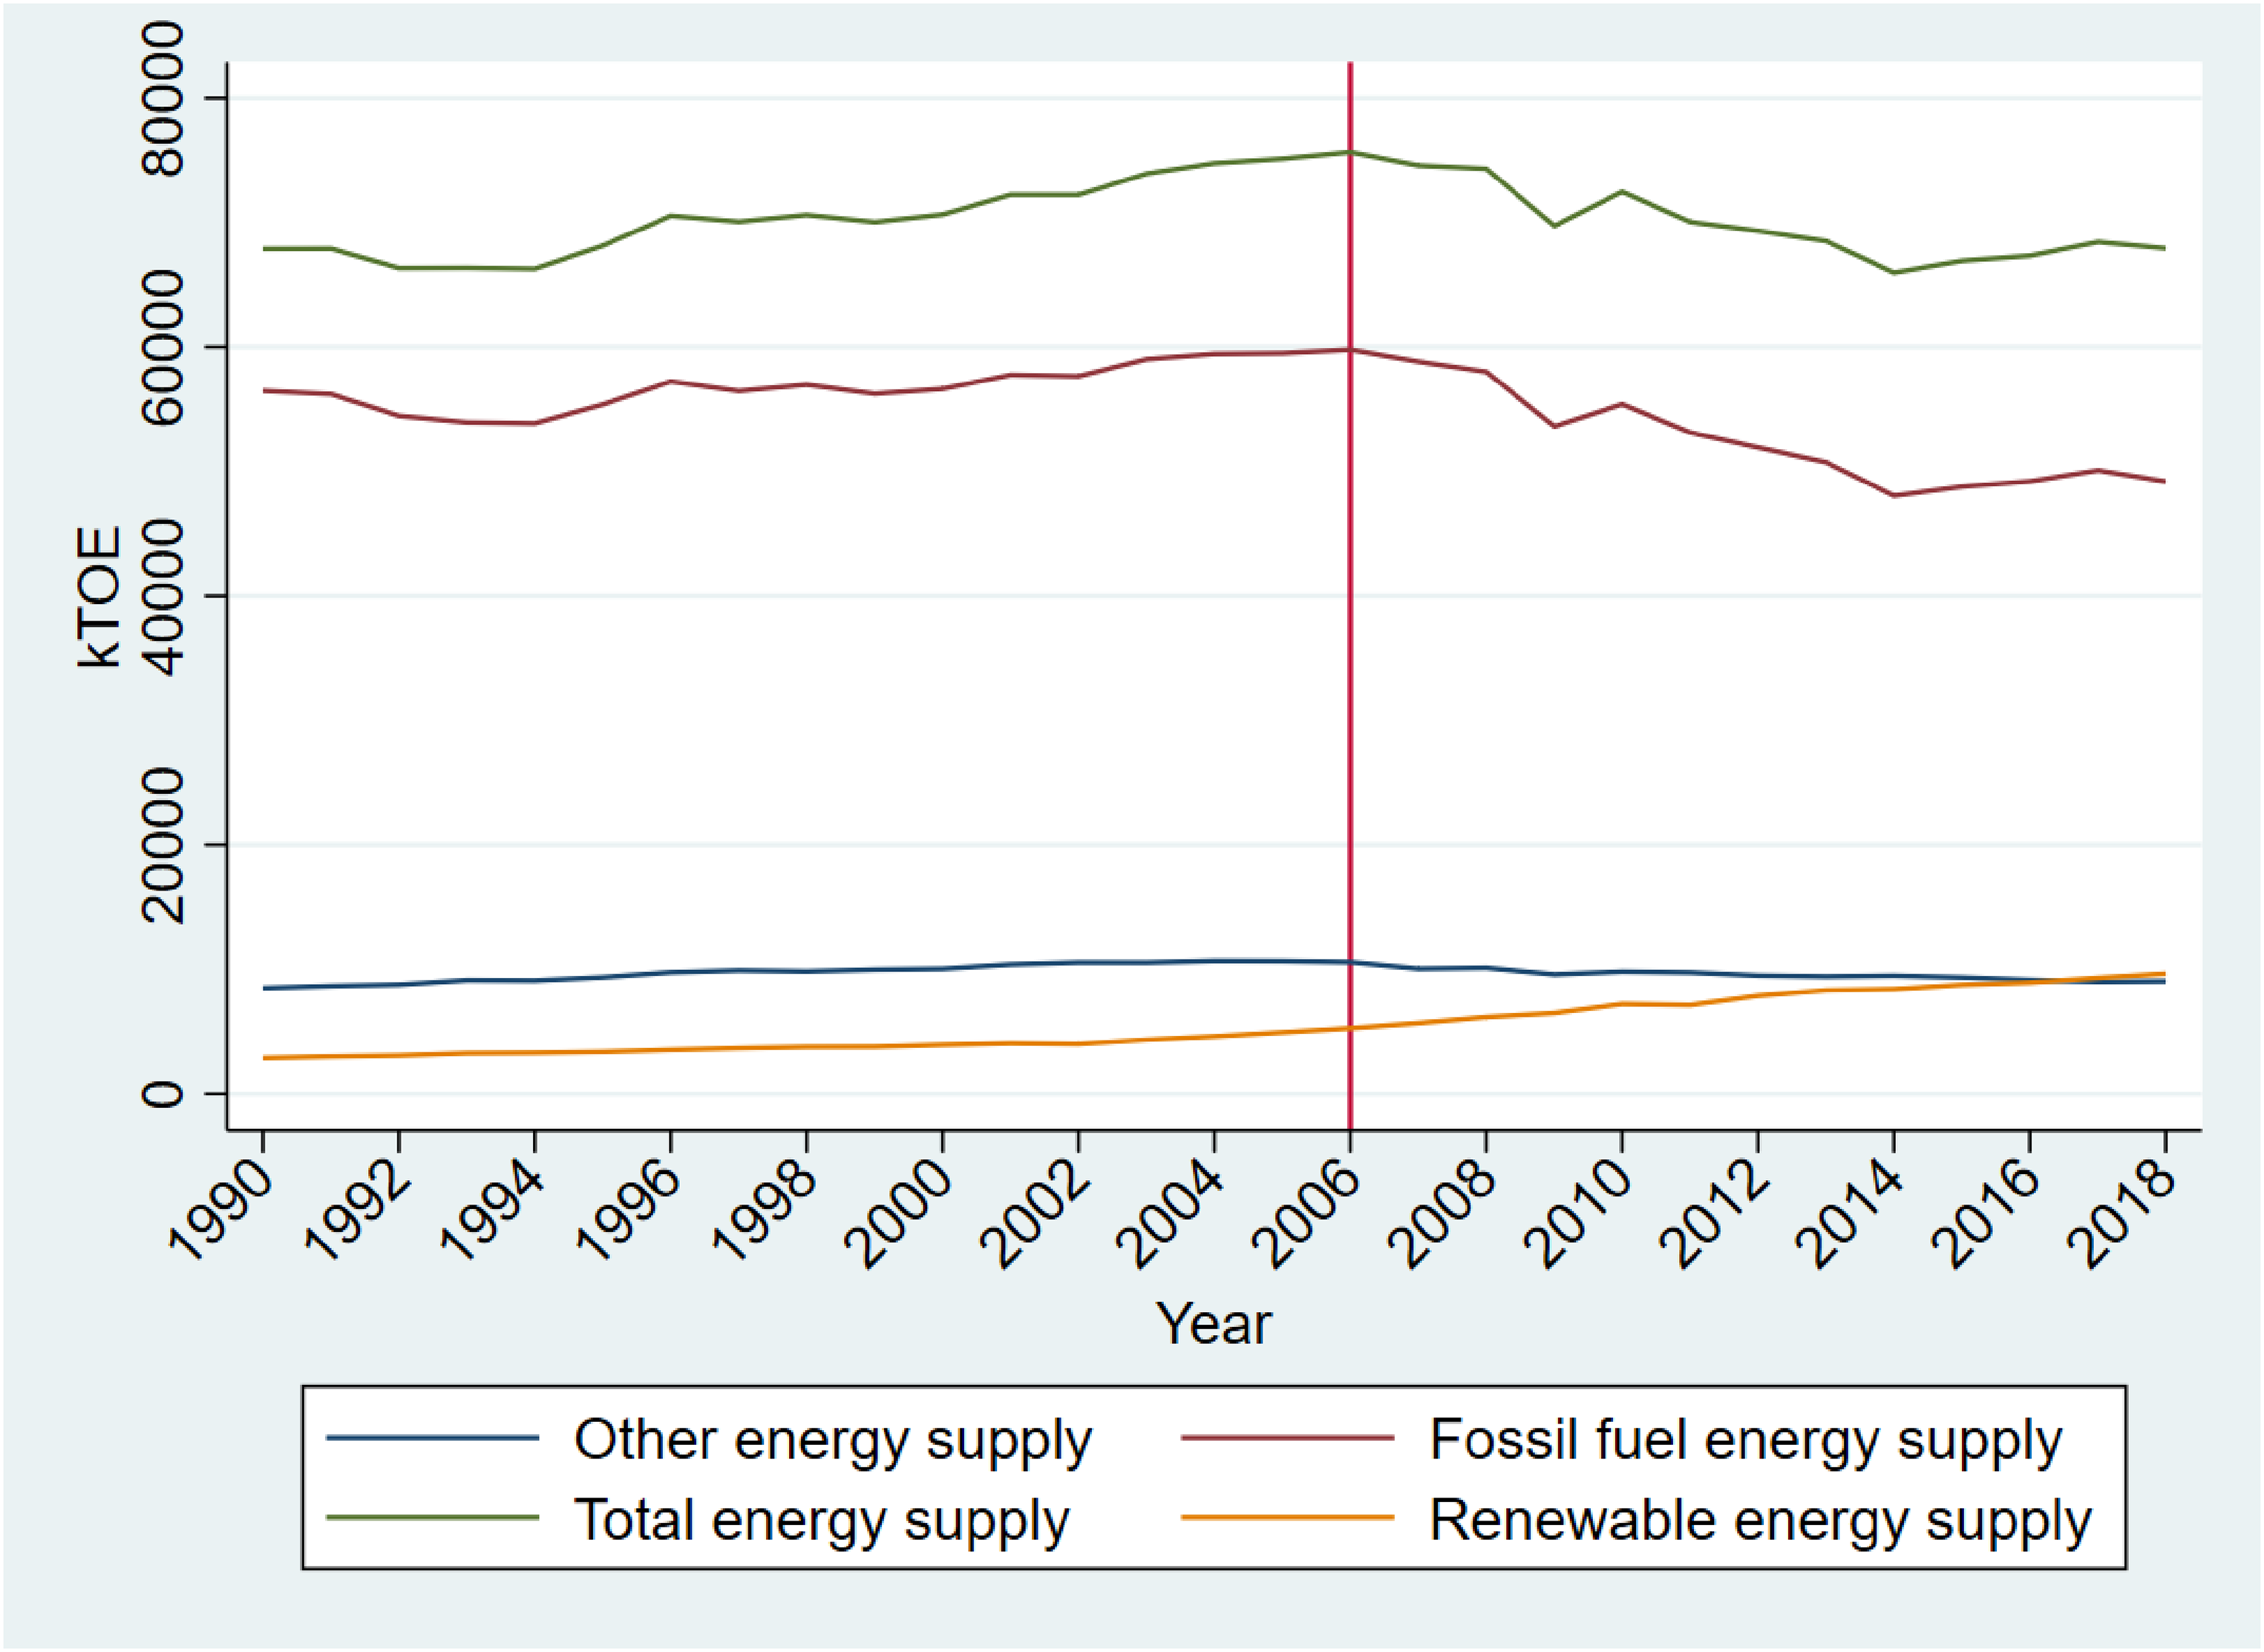
The European Union energy supply. Source: Own elaboration based on Eurostat.
Both (2005 and 2006) Green Papers were supplemented with the renewable Energy Directive signed by the EU members in 2009. This directive set clear targets for energy sector, its impact on climate and use of fossil fuels. This step towards Europeanisation of national renewable energy and centralisation of energy markets 47 set one of the most important targets concerning the share of energy sourced from renewables in energy mix (15% excluding hydro by 2013). 48 Since introduction of the aforementioned policies, the aggregated energy mix has changed significantly, (Figure 2) however, this change was slower than anticipated by the EU legislators and is still a challenge in terms of 2030 targets. 47
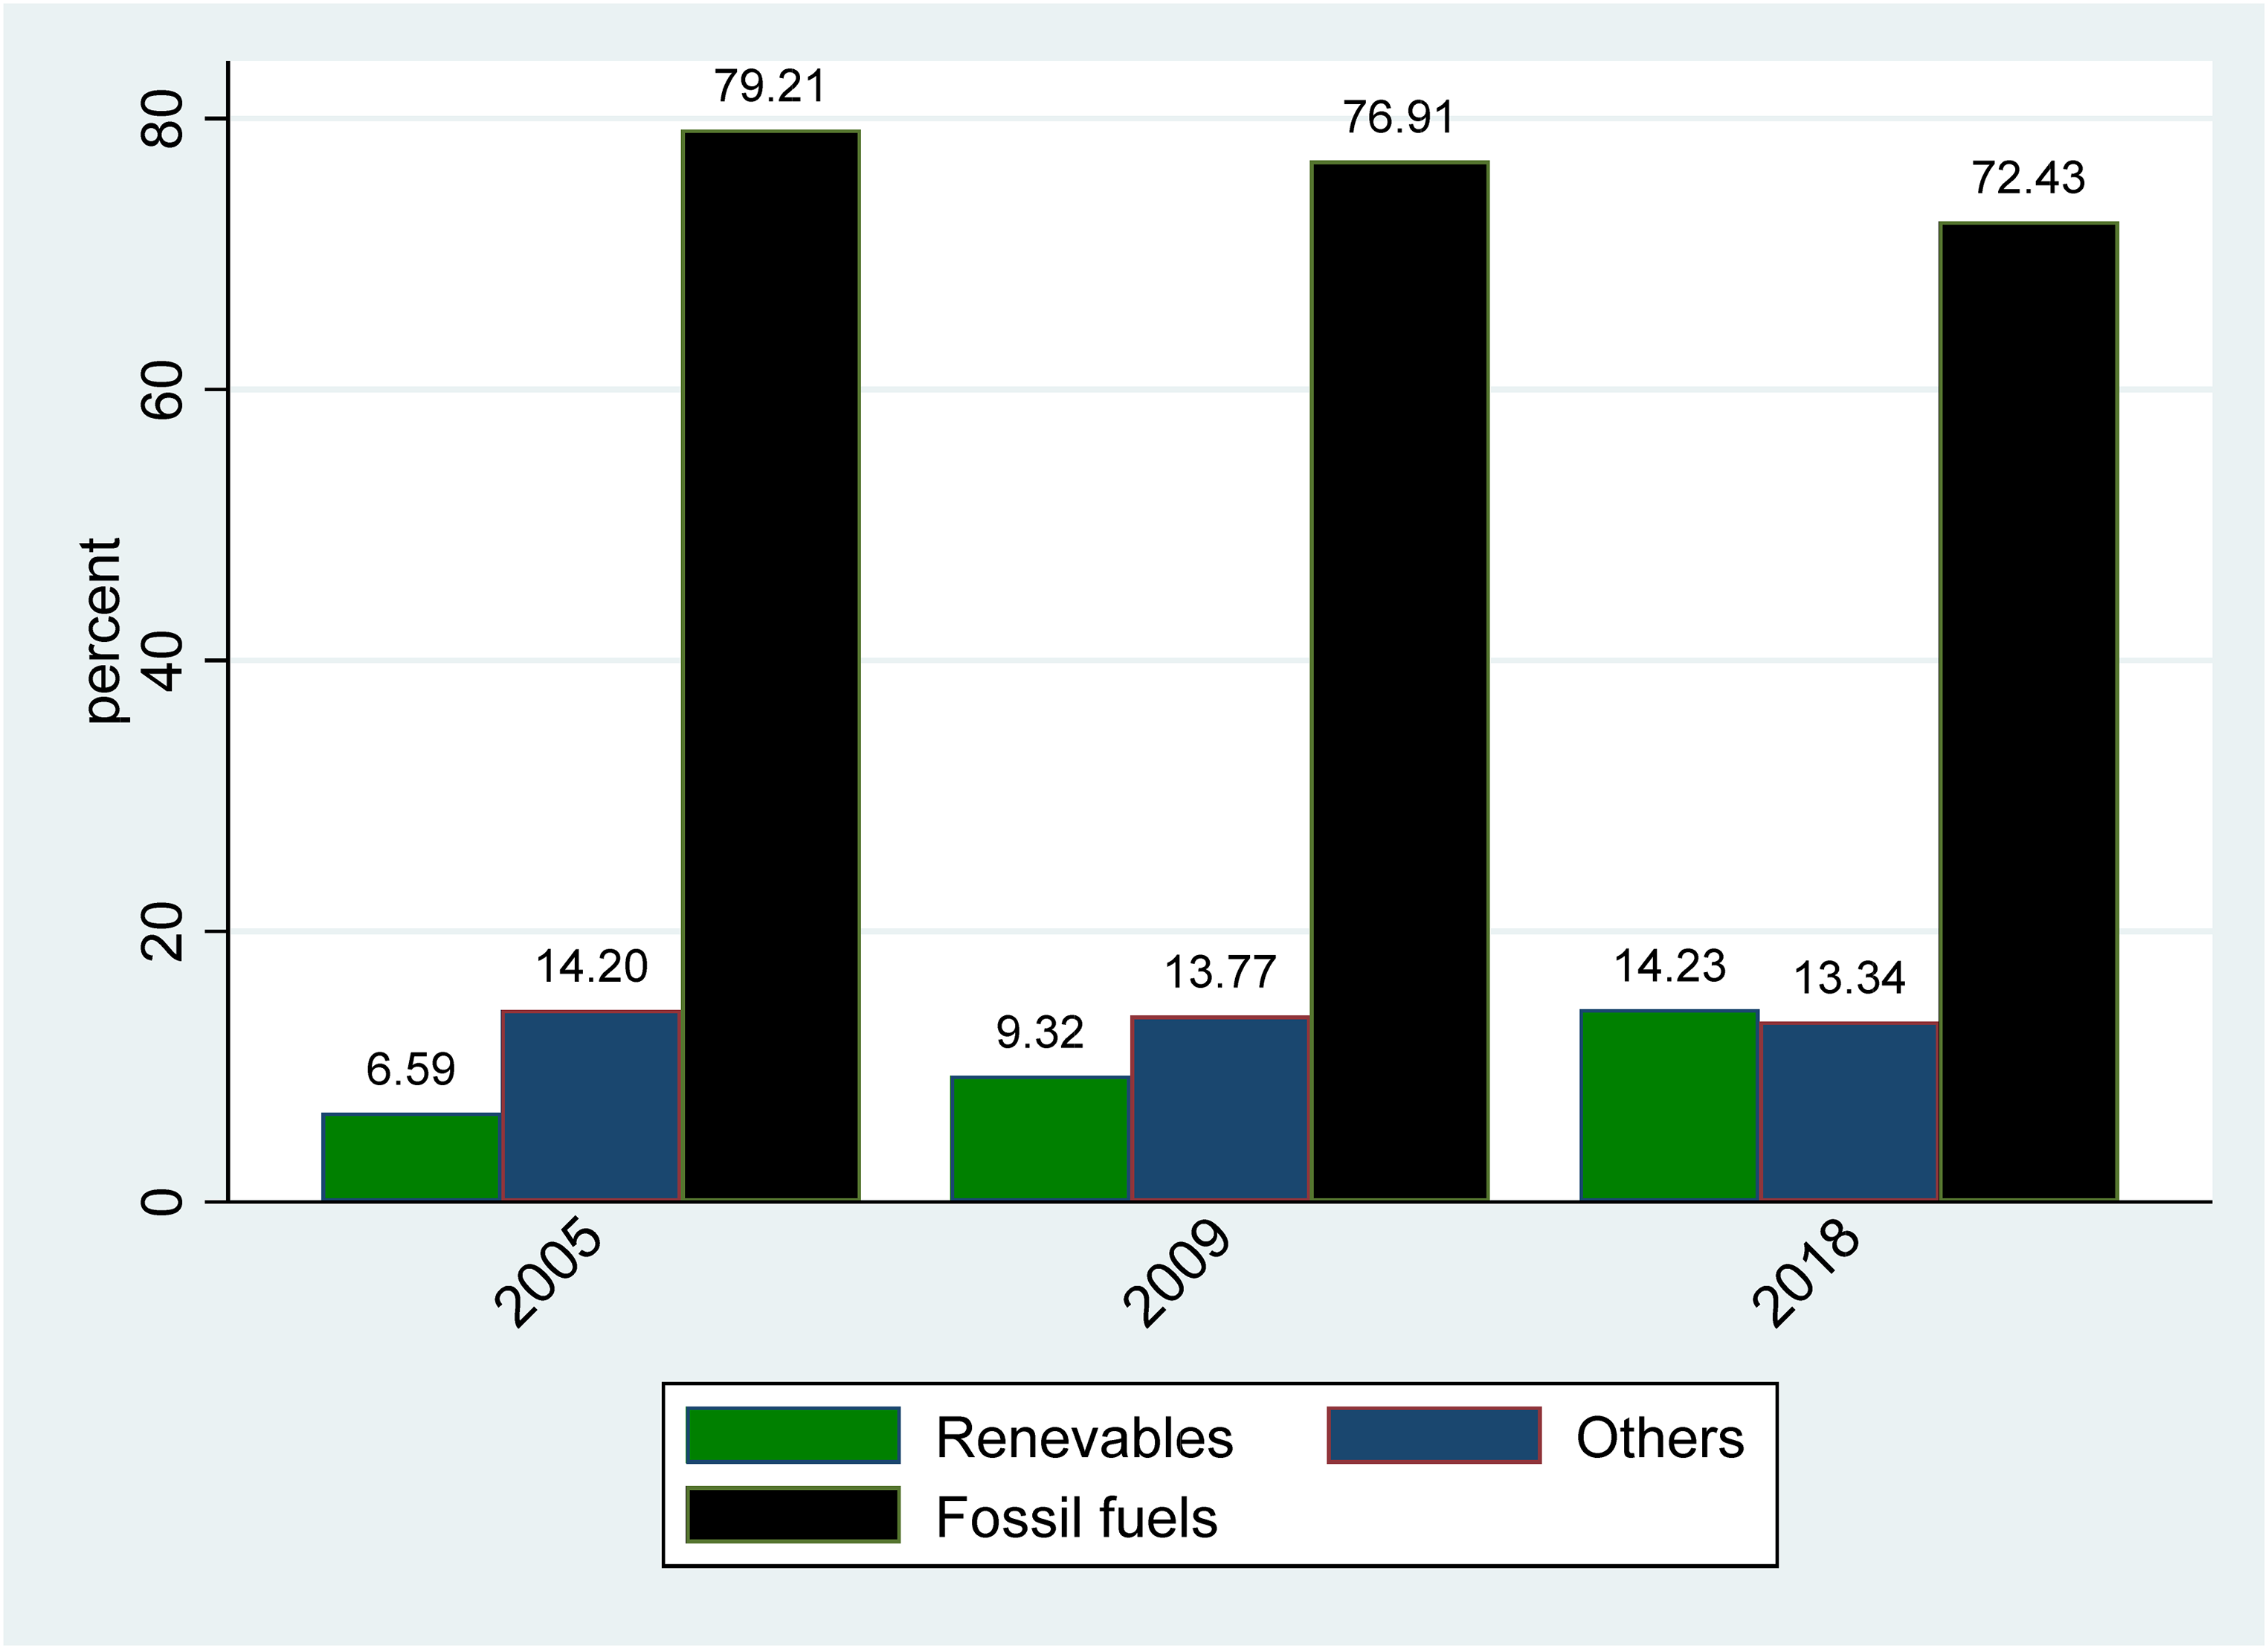
The European Union energy mix 2005-2018. Source: Own elaboration based on Eurostat.
Methodology
Data
The annual data (time series) concerning the EU member states was sourced from World Development Indicators (WDI). Data was provided by World Bank, 49 Eurostat database, EIA, 50 and European Commission for 28 countries. 3 Three EU members were excluded from the sample (Cyprus, Luxembourg, and Malta), because of their sole reliability on energy import (average import during investigated period was higher than 93% of total energy supply). Statistics were sourced for period from 1990 till 2018.
Table 2 provides definitions of variables and descriptive statistics. Further, the prefix “l” denotes the natural logarithm. Variable OIL was obtained by multiplying the average annual price of Brent crude oil by the average exchange rate against USD in a given country (as Brent price does not vary between countries). Oil was taken as a proxy for energy prices. While oil is not the only energy source, it is responsible for more than 36% of the EU energy supply. 51 What is more, price of oil is directly coupled with prices of natural gas, which (in total) represent 59% of the EU energy supply and is related to prices of coal.52,53 Brent was chosen as a reference because it has the largest market share. 54 CO2 representing the emission of greenhouse gasses was employed to present whether the EU efforts to slow down climate change are effective. It made it possible to check if an increasing supply of energy from renewables results in decreasing the emission of carbon dioxide thus replacing energy sourced from fossil fuels. REN (representing all renewables including hydro) and FOSS (representing a sum of gross energy sourced from solid fossil fuels, oil, petroleum products, peat, and natural gas) were presented in thousands of tonnes of oil equivalent (TOE) and represented 86.6% of the EU energy mix. It was assumed that in order to confirm transition, a negative correlation between those variables should be observed and energy sourced from fossil fuels should decrease at a faster pace compared to the efficiency increase. Variable POL was created to mark years when significant EU's policies were introduced. To confirm effectiveness of EU's policies and directives, they should interact with supply of fuels thus decreasing carbon dioxide emission. EEF was chosen to represent total energy in the economy, which is a measure employed by the EU to track the implementation of directives (Eurostat) directly influencing prices and energy supply in the economy. 52 GDP per capita was used to control whether the economies of the EU countries were developing while the energy supply was increasing, and if its rise results from a higher energy demand (what would deny decoupling theory and the effectiveness of EU's policies on energy efficiency). Countries exporting certain fuels (mainly oil) are prone to subsidise their internal consumption, which may result in lower volatility of energy demand thus increasing prices. Surplus may also be allocated to invest in development of new energy sources, 55 that is why IMP was employed to the analysis. RTS was chosen to control whether the access to natural resources is not slowing down transition (or evolution) and as such is decreasing the effectiveness of EU's directives on energy sustainability. In order to verify if an increase of energy efficiency in the economy is not a result of deindustrialisation, 40 and consequently, if a sustainability of EU countries is not just virtual, IND was selected as a control variable.
Tests
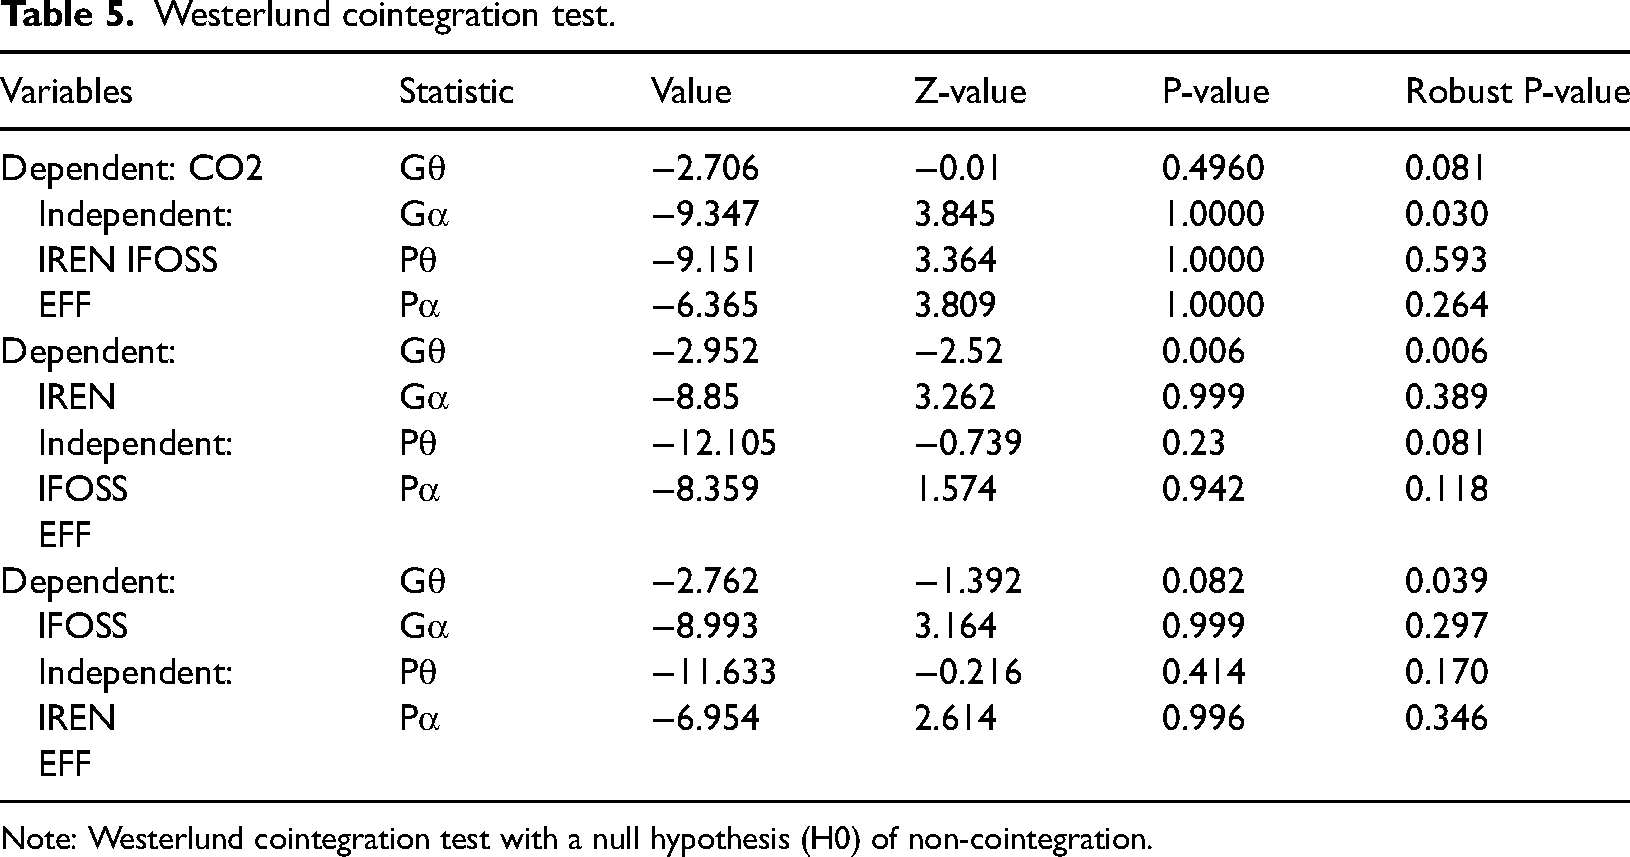
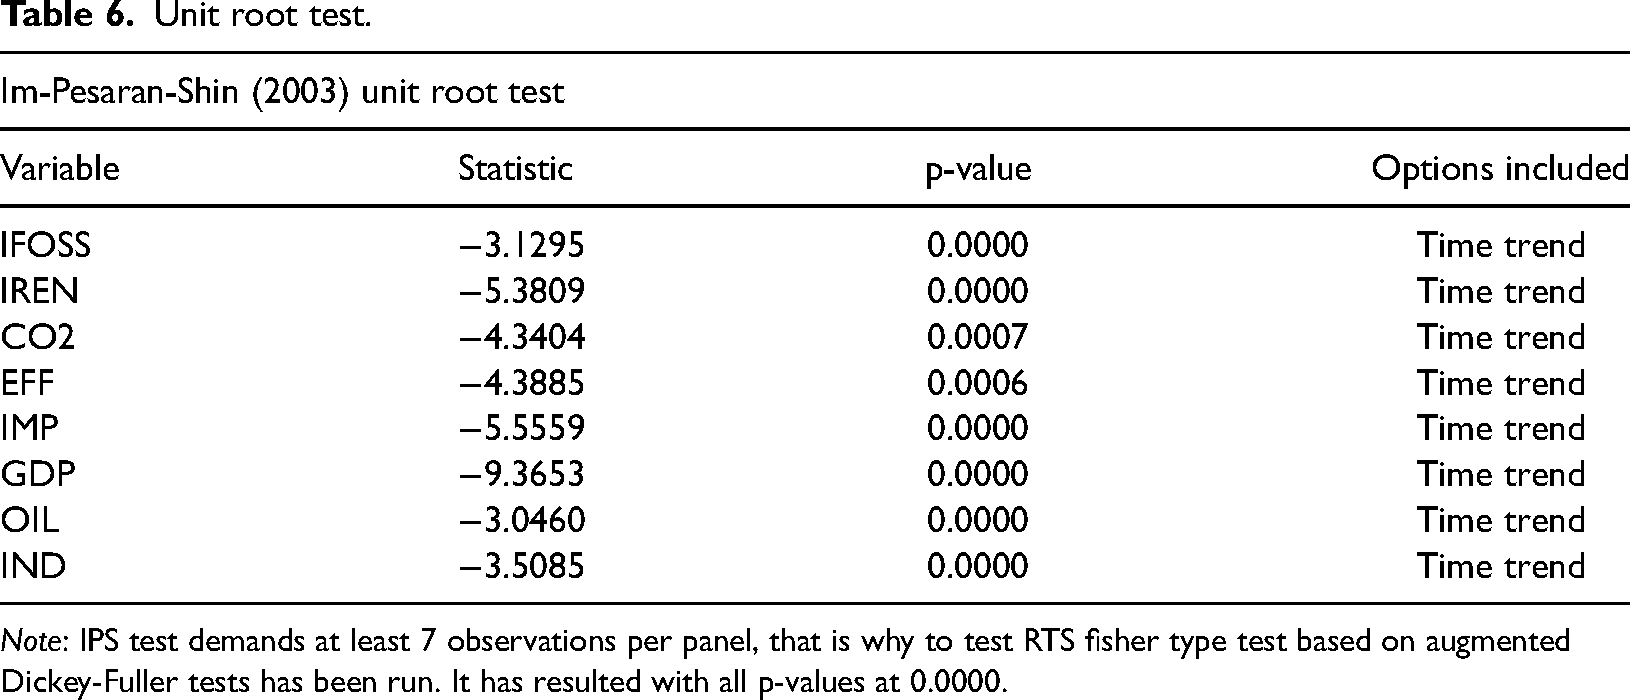
Econometric analysis of panel data is divided into three parts. Because fixed effect regression is used for estimation, in the first place, variables have to be tested for stationarity. To do so, Im-Pesaran and Shin test (IPS) was employed. Null hypothesis of this test states presence of the unit root (not-stationarity of series) while alternative hypothesis assumes lack of unit root in at least a fraction of dataset. Next, variables concerning energy (REN FOSS EFF) and CO2 were tested for cointegration for which Westerlund test was employed. There are many cointegration tests available, among which the most recognisable is Pedroni test56,57 which considers heterogeneity and independence. However, in this specific case it was deemed as not plausible as it does not analyse cross-sectional dependence which was confirmed with Pesaran test.58,59 Westerlund test estimates four statistics – Gθ, Gα, (which perform under alternative that the panel is co-integrated as a whole) and ρθ, ρα (which alternative is that there is at least one element of the panel which is co-integrated).60,61 In all cases, H0 of no-cointegration is tested. In case of co-integration, then causality must run in at least one direction. 62
Table 3 shows results of Im-Pesaran-Shin test for unit root. In all tests, time trend was included. In all cases, H0 of unit root was rejected at 1% which resulted in stationarity of at least some panels.
Definitions and descriptive statistics of data used in the study.
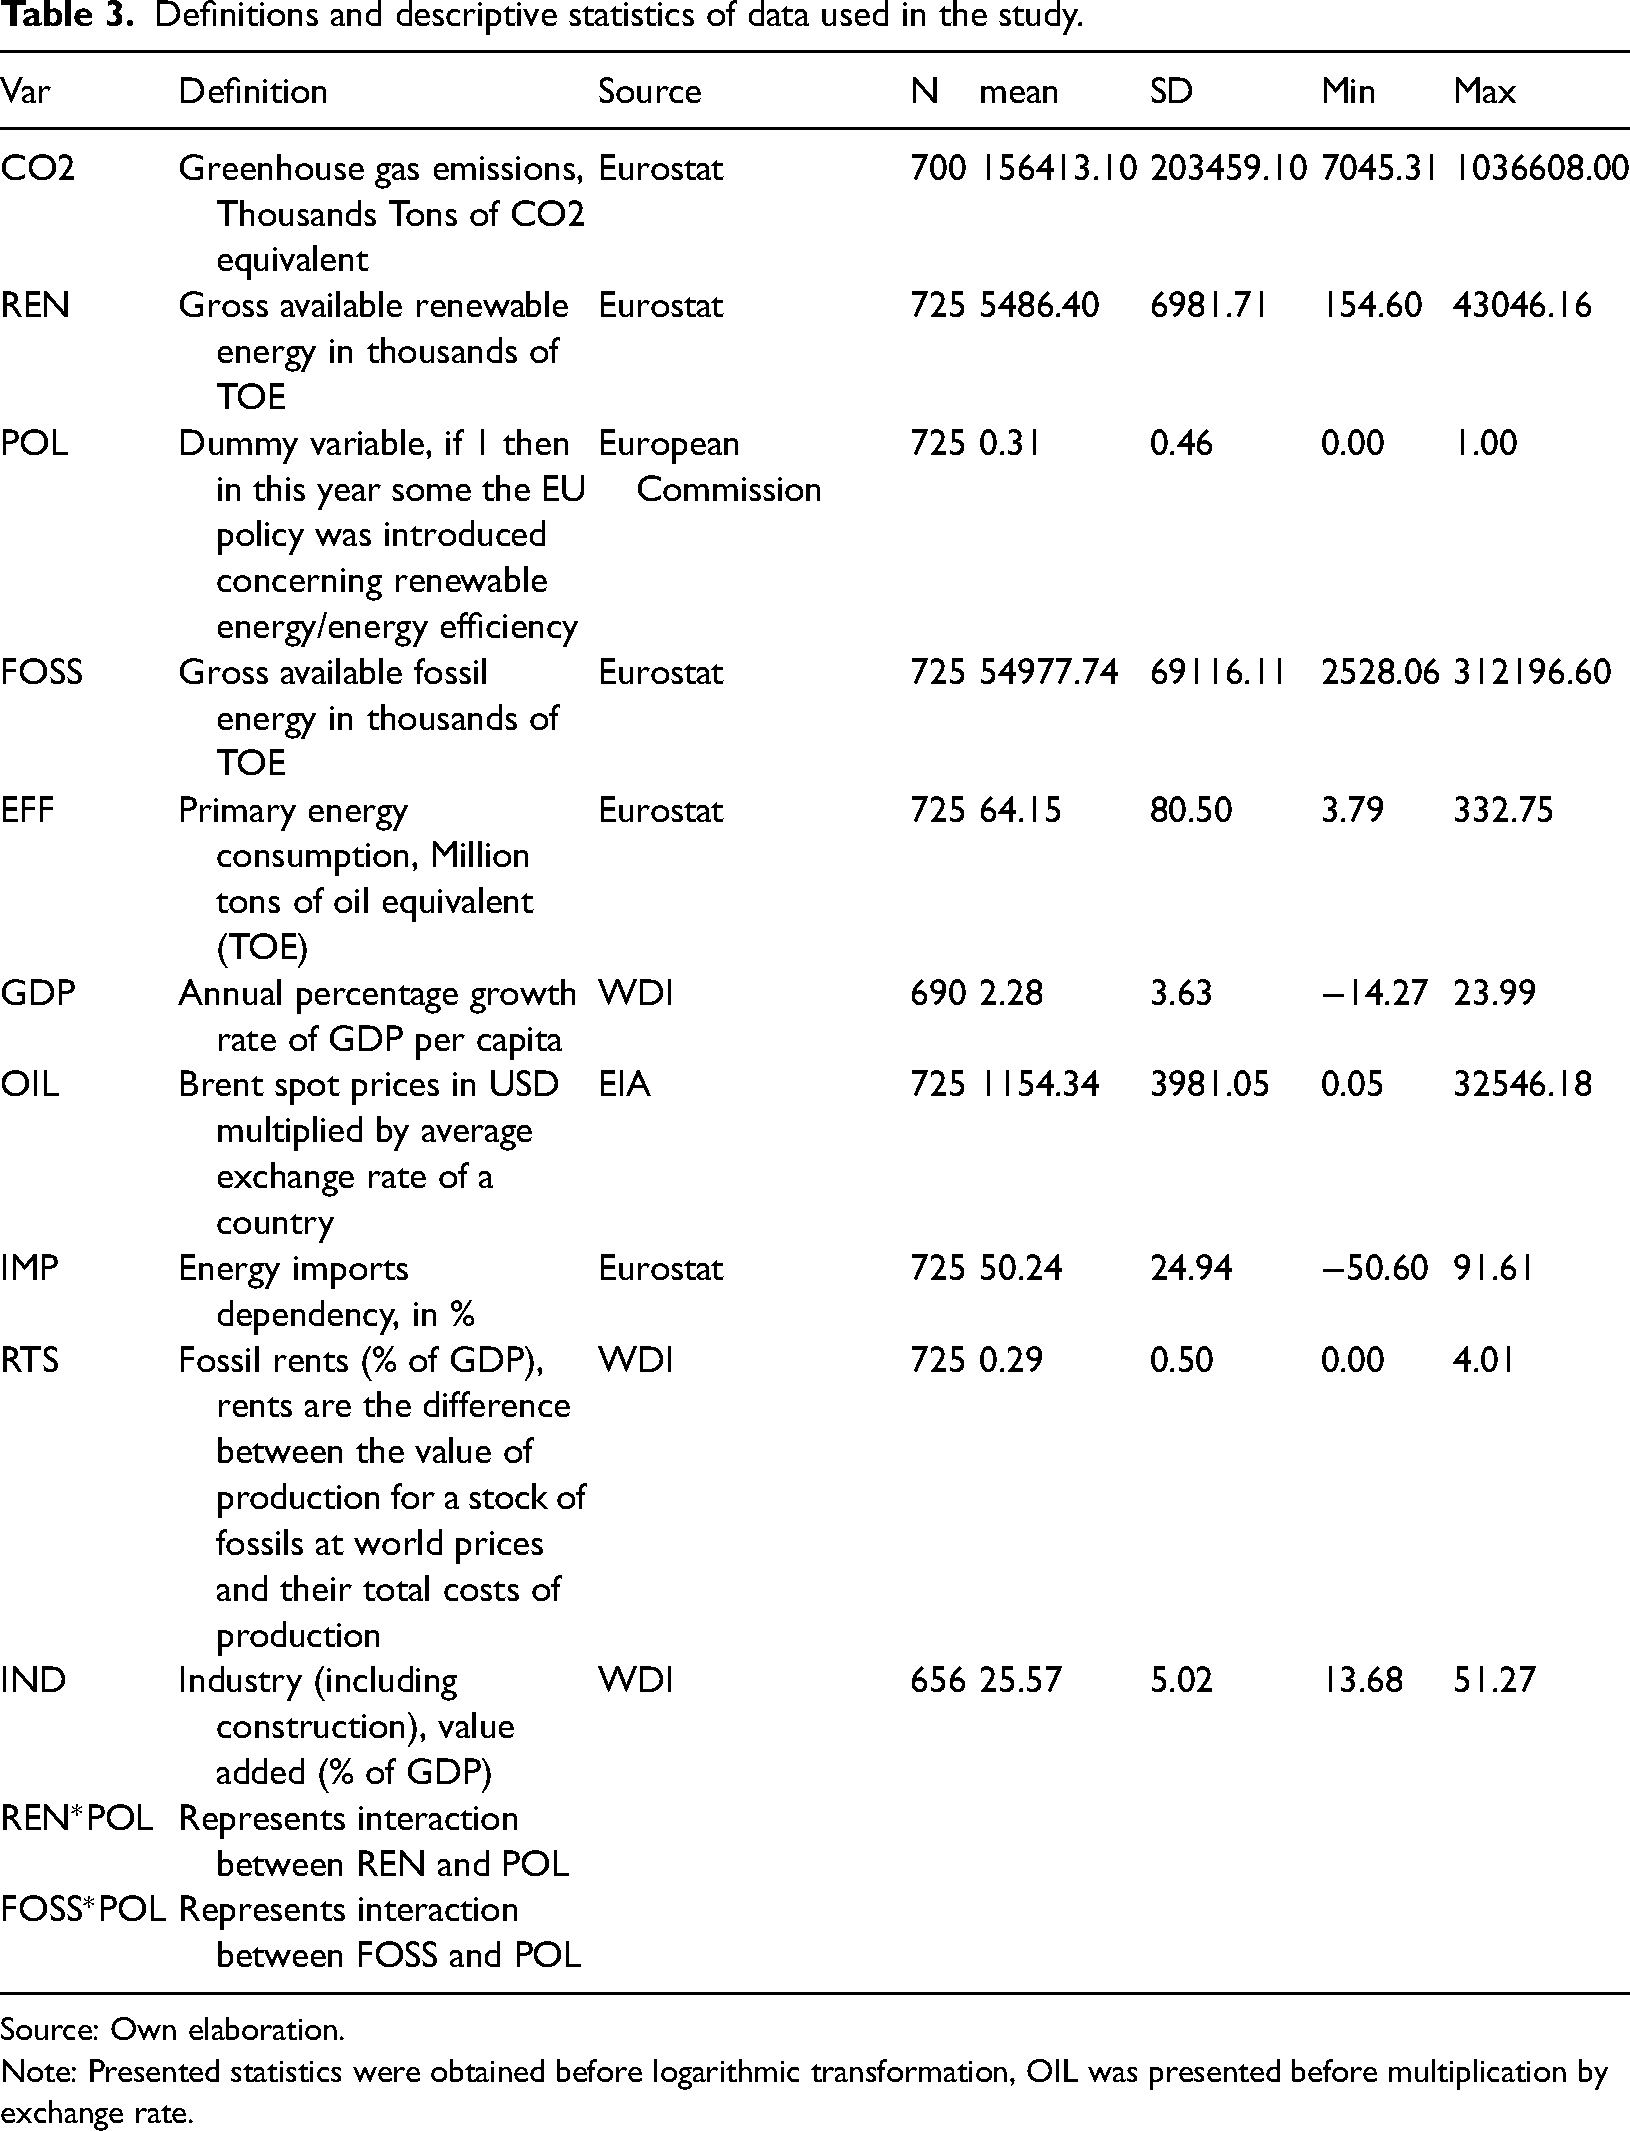
Source: Own elaboration.
Note: Presented statistics were obtained before logarithmic transformation, OIL was presented before multiplication by exchange rate.
Cointegration test results were presented in Table 4. For transversal dependence, control robust values were generated through 800 simulations with bootstrapping regression. Westerlund 60 test was run to check three different cointegrations. Firstly, to check whether CO2 (dependant) is cointegrated with lREN, lFOSS and EFF, secondly to confirm the relation between lREN (dependant), lFOSS and EFF, and thirdly, to determine which was a reversal of the second - lFOSS (dependant), lREN or EFF.
Unit root test.

Note: IPS test demands at least 7 observations per panel, which is why to test RTS fisher type test based on augmented Dickey-Fuller tests has been run. It has resulted with all p-values at 0.0000.
Westerlund test confirmed cointegration for a whole panel, however at least in some cases (individual) cointegration did not occur. Test for relation between energy sources gives mixed results. In both cases. H0 of no cointegration was rejected at 5% for whole panels, but not for single countries. In other words, change of energy supply from one source to the other was cointegrated for a whole panel, but for at least some countries, change of one energy source did not result in the shift in terms of other sources.
Models
In the second part, impact of energy supply on greenhouse emissions was tested. Following that step, fixed effect regressions were run (with additional controls in (b) and (c)):


To account for the fact that greenhouse gas emission at time t might be determined by its past values (as energy transition is a long-term process), that greenhouse gas emission, supply of energy from fossil fuels, energy efficiency may be determined simultaneously and for fixed effects we estimate a linear dynamic panel data model using a system GMM estimator.
64
We estimate following relation:
In the third step, correlation between energy supply sources (renewables and fossil fuels) was tested through two additional sets of fixed effect regressions (with additional controls in (b) (c)):


Westerlund cointegration test.
Note: Westerlund cointegration test with a null hypothesis (H0) of non-cointegration.
Unit root test.
Note: IPS test demands at least 7 observations per panel, that is why to test RTS fisher type test based on augmented Dickey-Fuller tests has been run. It has resulted with all p-values at 0.0000.
Westerlund cointegration test.
Note: Westerlund cointegration test with a null hypothesis (H0) of non-cointegration.
Likewise for Model 1, we have estimated a linear dynamic panel data model using a system GMM estimator
64
to account for the fact that supply of the energy at time t might be determined by its past values, which amount of the specified available energy and price of fossil fuels may be determined simultaneously and for fixed effects. We estimate following relation:

Empirical results and discussion
Empirical tests
First, we tested variables for the unit root. Table 3 presents the results of Im-Pesaran-Shin test for unit root. In all tests, time trend was included. In all cases, H0 of unit root was rejected at 1% which resulted in stationarity of at least some panels.
Cointegration test results were presented in Table 4. For transversal dependence, control robust values were generated through 800 simulations with bootstrapping regression. Westerlund 60 test was run to check three different cointegrations. Firstly, to check whether CO2 (dependant) is cointegrated with lREN, lFOSS and EFF, secondly to confirm the relation between lREN (dependant), lFOSS and EFF, and thirdly, to determine which was a reversal of the second - lFOSS (dependant), lREN or EFF.
Westerlund test confirmed cointegration for a whole panel, however at least in some cases (individual) cointegration did not occur. Test for relation between energy sources gives mixed results. In both cases. H0 of no cointegration was rejected at 5% for whole panels, but not for single countries. In other words, change of energy supply from one source to the other was cointegrated for a whole panel, but for at least some countries, change of one energy source did not result in the shift in terms of other sources.
Greenhouse gases emission within the Eu
Model 1 was created to confirm that type and quantity of energy supplied within the EU is correlated with total greenhouse gases emissions. It made it possible to check how the change between energy sources may influence the climate and to assess if the EU policies on sustainable energy are effective.
When analysed individually, REN is not significant for CO2, however when considered in terms of its interaction with POL, it negatively influences CO2. One explanation of this phenomenon can be the fact that EU policies are actually effective and result in an increase of use on non-emitting energy sources. Negative correlation between interaction of POL with FOSS also confirms that EU policies are efficient and contribute to more sustainable energy economy within the EU. In the case of positive relation between OIL and CO2 (but negative for climate), there are two potential explanations. First of all, increase of fossil fuel prices may result in decrease of welfare within the economy, which leads to lack of resources for investment in new renewable energy sources. 66 Secondly, it may be caused by the fact that an increase of fossil fuel prices leads to rise of income in sectors responsible for those fuels. This additional income may be used as a financial backing for obtaining new sources of fossil fuels, further exploitation of existing ones or investment in sourcing of those fuels to make it even more efficient. It may lead to a greater availability of fossil fuels and ultimately to a boost in supply and consumption. Negative relation between IMP and CO2 shows, that while outsourcing the energy production abroad may be regarded as positive in terms of the EU's climate impact, it should not be concerned as beneficial on a global scale taking into consideration that the production is just moved, and not ceased (Table 8).
Results of model 1 estimation.

Note: *p-value ≤ 0.10, **p-value ≤0.05, ***p-value ≤0.01.
Models (b) and (c) contain additional control variable of RTS and IND respectively. In both cases, those variables were not statistically significant. In the case of RTS it may be due to the lack of significant or price competitive deposits of fossil fuels 67 within the EU's area. With regard to IND, lack of significance contradicts with the findings concerning the fact that process of decoupling in the EU is not an effect of deindustrialisation. 68
Table 9 presents results of the difference GMM estimations. Column (a) confirms that, even controlling for past CO2 values, lREN in interaction with POL is negative and remains significant as well as lFOSS*POL. Relation with lFOSS stayed positive and statistically significant. Obtained results are in line with previously presented conclusions. The only other variables that remained significant are OIL and GDP which shows that higher growth of the economy results with higher emission of the greenhouse gases – at least in case of energy sectors based on fossil fuels. Results in Column (b) and (c) do not change much when we add RTS and IND as a control variable. AR and the Hansen J tests confirm that our instrumenting strategy is valid - the former confirms that the differenced residuals follow an AR(1) process, while the latter never rejects the null hypothesis of no over-identification.
Results of model 1 GMM estimation.
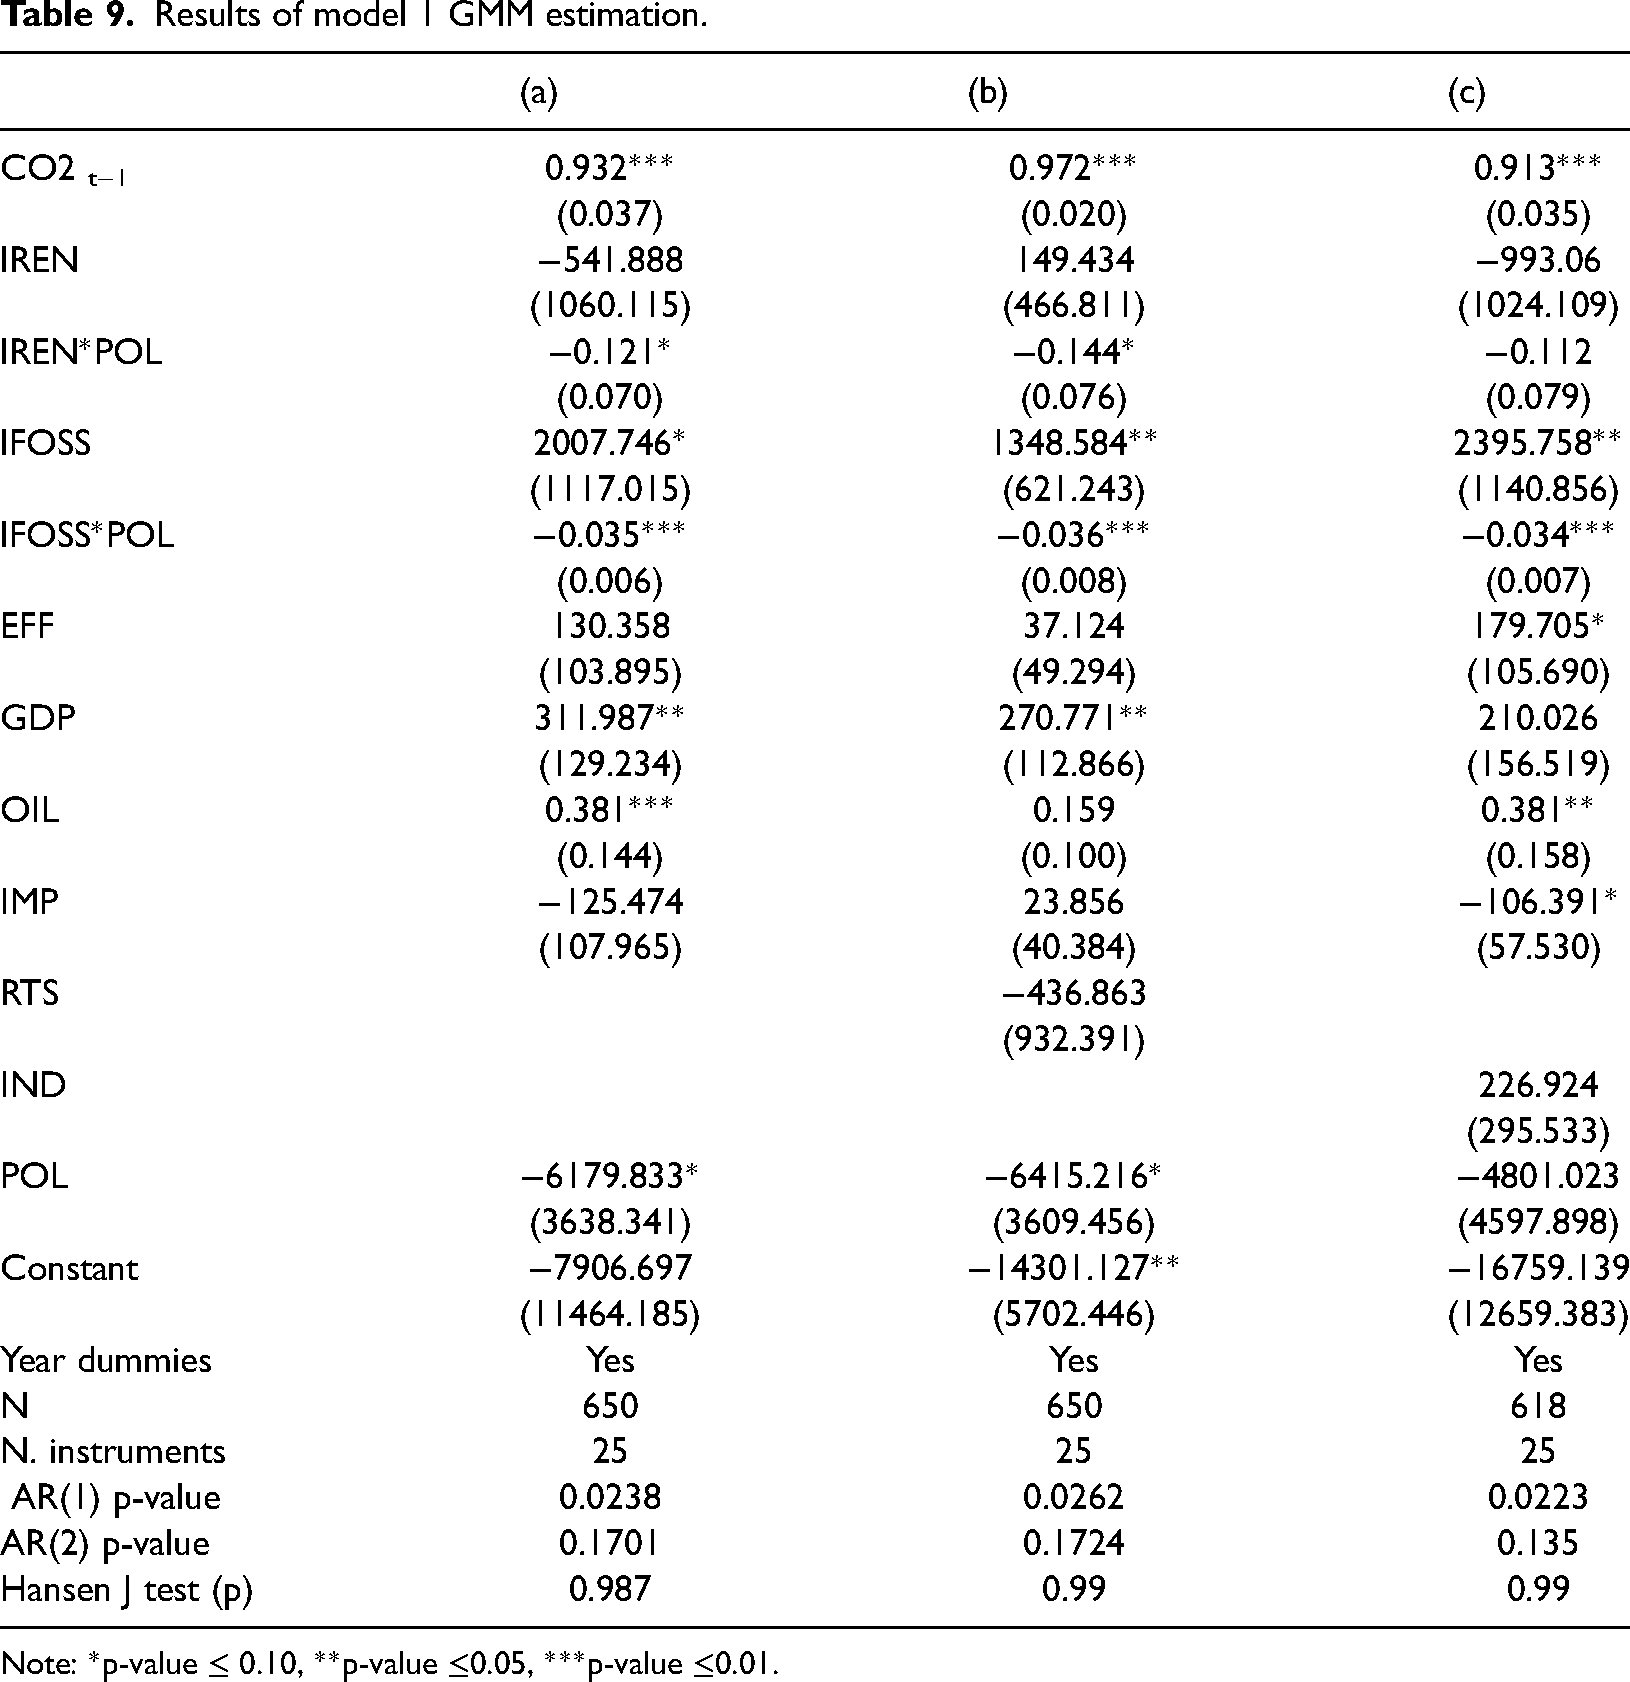
Note: *p-value ≤ 0.10, **p-value ≤0.05, ***p-value ≤0.01.
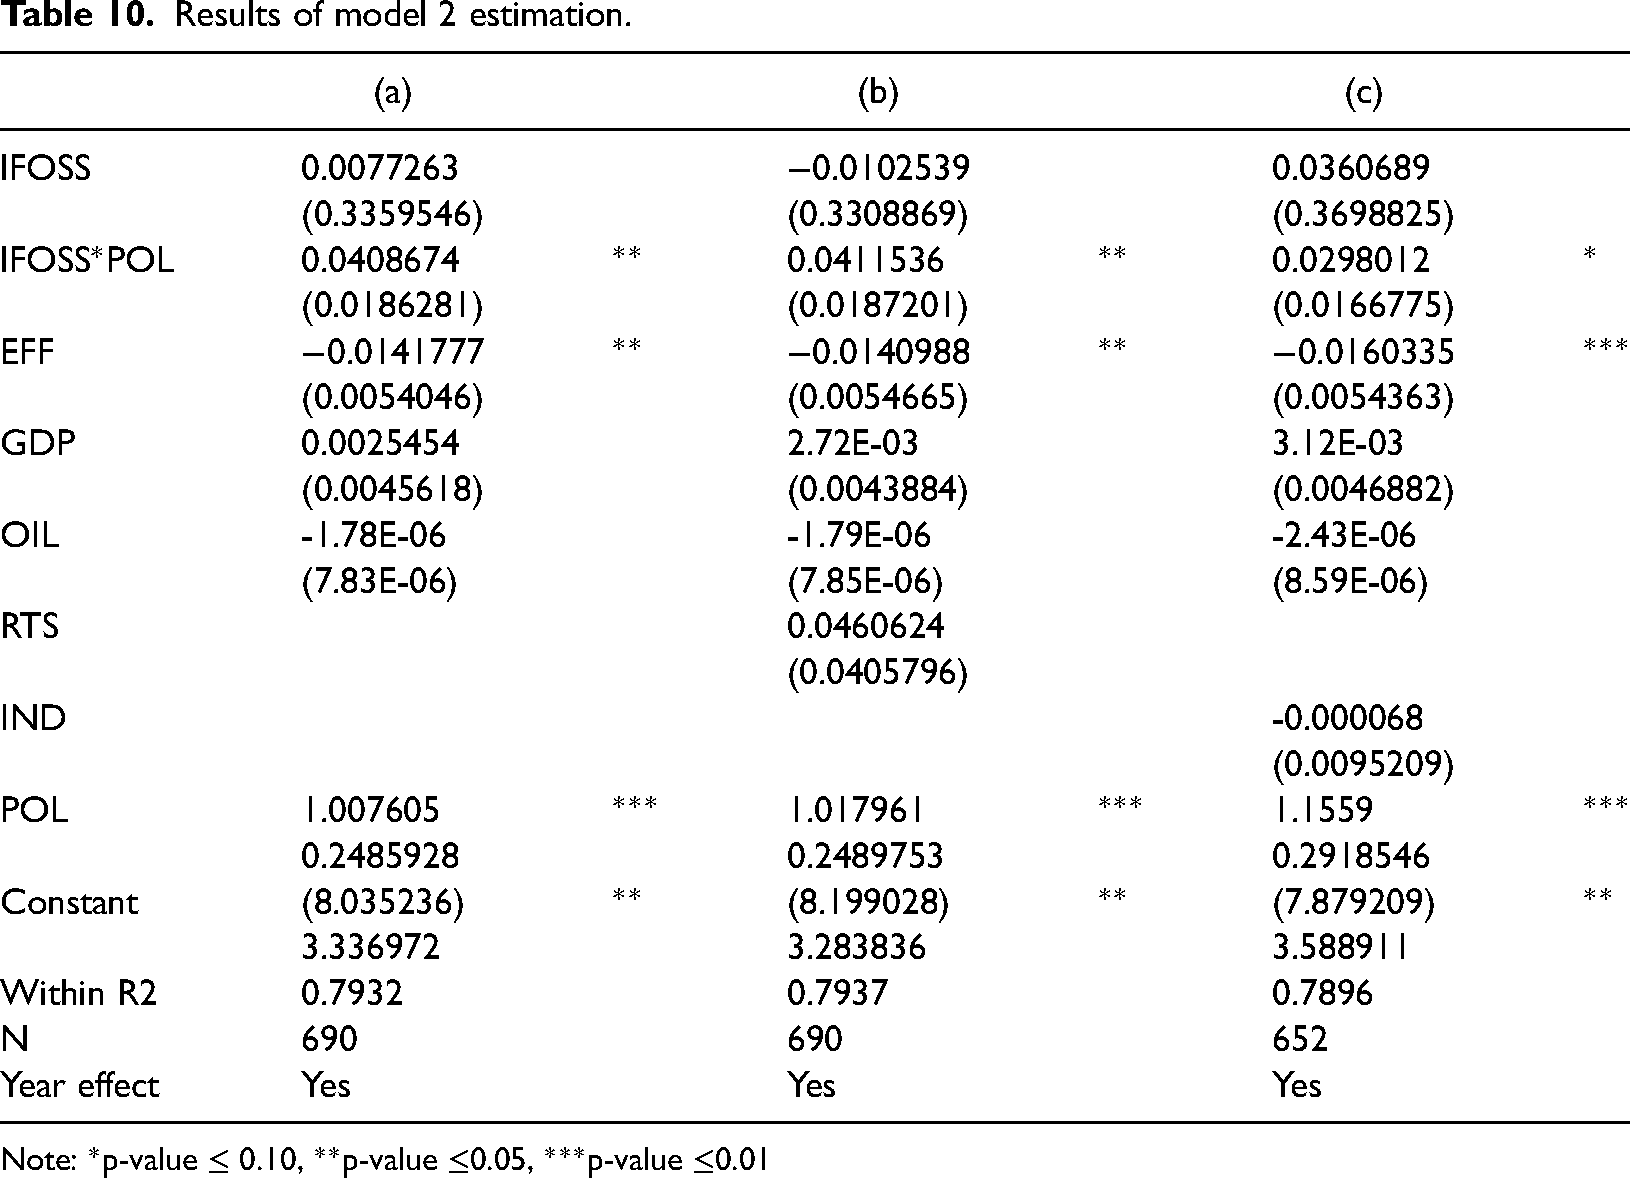
Model 2 was designed to confirm thesis on ongoing energy transition within the EU by checking whether change in supply of energy sourced from fossil fuels resulted in an increase of energy sourced from renewables. In other words, to check if fossil fuels are substituted with renewables or if their decrease is just a result of increasing energy efficiency within the EU (Table 10).
Results of model 2 estimation.
Note: *p-value ≤ 0.10, **p-value ≤0.05, ***p-value ≤0.01
In accordance with the results obtained in the study, they seem to contradict with previous assumptions. Positive relation between REN and FOSS*POL suggests that additional costs of CO2 emissions, 69 as a result of burning fossil fuels, may be a spur for diversification of energy mix with zero emissions energy sources. Correlation with EFF shows that decrease in energy consumption does not negatively affect REN. Obtained results suggest that the development of REN is driven by the EU's policies rather than by free market mechanisms.
Table 11 presents results of the difference GMM estimations. Column (a) confirms that, even controlling for past lREN values, lFOSS in interaction with POL is still positive and remains significant. Obtained results are in line with previously presented conclusions. AR and the Hansen J tests confirm that our instrumenting strategy is valid - the former confirms that the differenced residuals follow an AR(1) process, while the latter never rejects the null hypothesis of no over-identification.
Results of model 2 GMM estimation.

Note: *p-value ≤ 0.10, **p-value ≤0.05, ***p-value ≤0.01.
Model 3 was created to control whether increase of energy sourced from renewables in parallel with increasing energy efficiency results in decrease of energy sourced from fossil fuels. According to the results, there is no relation between REN and FOSS. Positive relation between EFF and FOSS was anticipated having in mind the fact that FOSS is the key contributor to EU's energy mix and thus it is exposed on decreasing energy demand. Statistical significance of GDP in this model suggests indirect correlation with greenhouse emissions. What is more, it confirms findings on decoupling of energy production from economic development. 41 Positive relation between IND and FOSS suggests that supply of energy from other sources (such as renewables) is not sufficient to cover the demand rising in the industry. However, this statistic is not significantly different from zero, which suggests that increase or decrease of performance within the industry have no effect on production of energy from fossil fuels (Table 12).
Results of model 3 estimation.

Note: *p-value ≤ 0.10, **p-value ≤0.05, ***p-value ≤0.01.
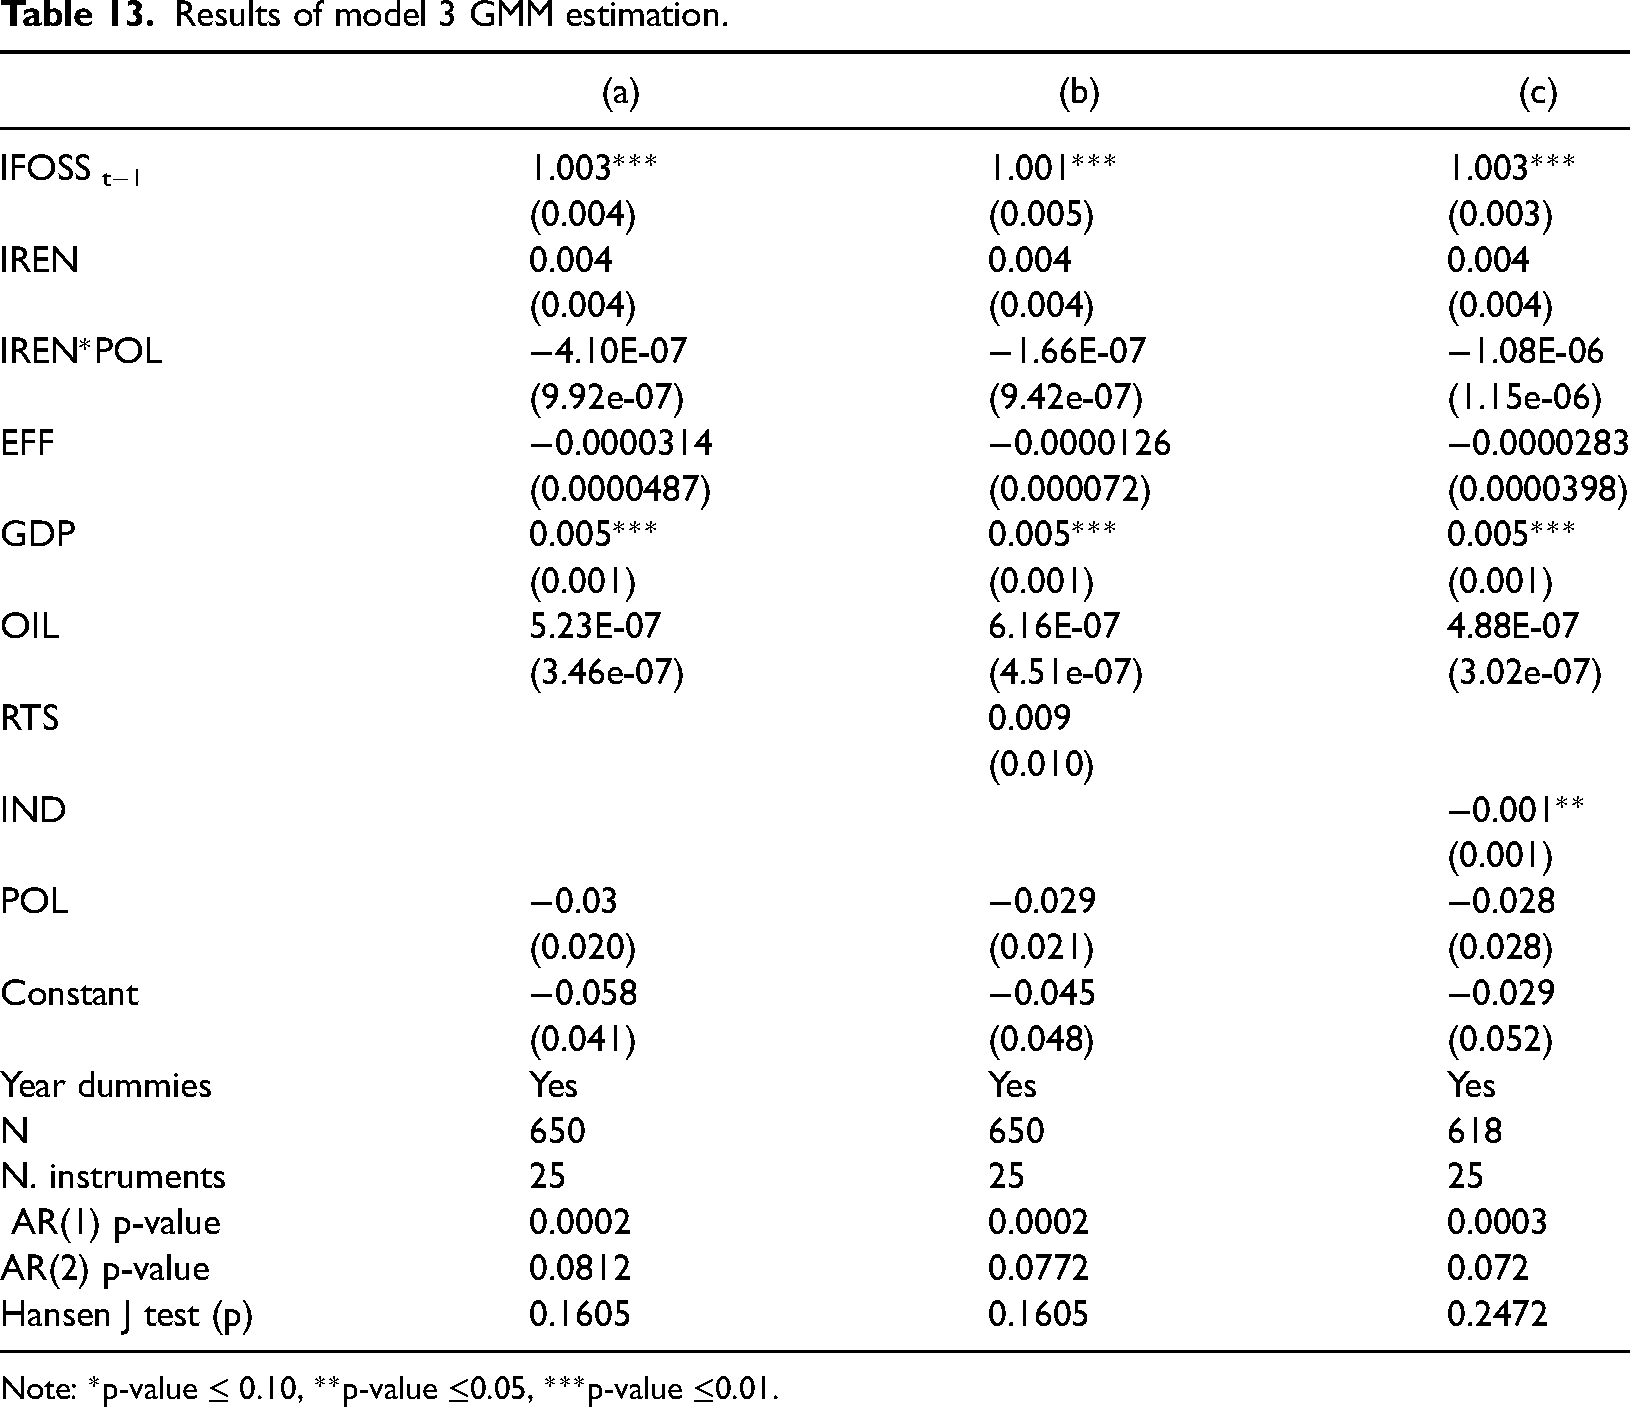
Table 13 presents results of the difference GMM estimations of model 3. Only remaining statistically significant variables are GDP and IND (in (c)). Controlling for past values of lFOSS contradicts with previous results. Obtained results challenge theorem on decoupling of energy production from economic development. 41 AR and the Hansen J tests confirm that our instrumenting strategy is valid - the former confirms that the differenced residuals follow an AR(1) process, while the latter never rejects the null hypothesis of no over-identification.
Results of model 3 GMM estimation.
Note: *p-value ≤ 0.10, **p-value ≤0.05, ***p-value ≤0.01.
Conclusions
This study had two main objectives; first of all, it was to investigate the relation between energy supply sources, the EU policies and greenhouse gases emissions, as well as to test hypothesis that the EU is undergoing energy transition. In order to answer these questions, firstly, descriptive analysis of trends in supply of energy was carried out. For the purpose of this analysis, panel data for twenty-five EU member states concerning the period from 1990 to 2018 was gathered. It resulted in confirmation that the EU energy system is in transition, and what is more important, tends to be more efficient in comparison to the 90's. Another conclusion was that energy mix of the EU is changing and it heads towards more sustainable energy economy, which constitutes one of main EU policies. The second step was to employ econometric methods to confirm or reject the set hypotheses. According to a cointegration analysis that was carried out under high cross-sectional data dependency, it was concluded that for aggregated panel data there is a cointegration between energy sources, its efficiency and greenhouse gasses emissions. These tests were followed by fixed effect regression which subsequently was confirmed by the GMM estimation. The results obtained from estimation gave mixed findings which contradicts mainstream perception, especially with regard to renewables. According to the outcomes, the EU efforts towards reaching sustainable energy economy through introduction of energy policies are effective. Taking into consideration the fact that using fossil fuels for energy purposes is considered to be one of the biggest contributors to greenhouse gases emissions, it was presumed (and confirmed) that supply of those fuels should have a negative (in terms of climate change) impact on emissions of carbon dioxide. Obtained results make it possible to confirm that EU efforts in reaching sustainable energy economy may be assessed as effective.
Implementation of policies concerning energy economy within the EU and increase of renewables in the EU energy mix suggest (in accordance with some theorems [i.e.12,15 that energy transition has begun decades ago. However, the lack of statistical significance between increase of energy produced with renewable energy sources and greenhouse gases emissions suggest that renewable energy does not influence the energy sourced from fossil fuels. What is more, the results of model 2 estimations suggest that renewables are positively correlated with fossil fuels that are in compliance with EU policies. Moreover, model 3 does not provide any statistically significant evidence for correlation between those energy sources. It seems that introduction of new policies is a driver to change rather than a result of moving into different energy sources. Therefore, it cannot be concluded that hypothesis concerning energy transition within the EU is correct. According to the empirical results obtained in the study, it may be concluded that the EU energy economy is evolving rather than being in transition. The main reason for this may be a disproportion in implementation of the EU policies between its member states.
According to the findings of this study, it may be pointed out that in order to achieve the state of energy transition resulting in a successful decrease of the negative influence that EU economies have on climate change, all member states should follow and implement policies and directives set by the EU Parliament to the same degree. What is more, excessive subsidization of renewables thorough different programs is not resulting with significant increase of their share in total energy mix. Economic theory predicts that decision-makers purchase an appliance or vehicle when its net utility exceeds that of all other alternatives under consideration. 70 In line with that theorem energy transition should take place when technological advancement decreases cost of energy from a new source below current price of energy, or in case when negative effects are much higher in existing source of energy. This implies that costs of transferring towards renewables are still too high. Policymakers, to achieve state of energy transition, should increase the subsidies or tax exemptions on renewables or increase costs of sourcing energy from fossil fuels through additional CO2 taxation.
This research treats European Union as a one body. Further research should be conducted to investigate the disproportions in implementation of the EU policies among its member states. Finding differences will allow to understand which exactly policies are effective and to what extant. Further investigation should also answer what are the reasons that some policies are more effective than others.
Footnotes
Declaration of conflicting interests
The author(s) declared no potential conflicts of interest with respect to the research, authorship, and/or publication of this article.
Funding
The author(s) received no financial support for the research, authorship, and/or publication of this article.