



Abstract
The performance of solar photovoltaic systems tends to decline if the operating conditions change from the nominal operating cell temperature due to environmental factors. The major factors include temperature and humidity variations, which cause thermal losses and open-circuit voltage drops in photovoltaic panels. This study investigates the correlations between solar photovoltaic performance and environmental factors by quantifying the real-time variables including temperature, humidity, dewpoint temperature, and heat index. Furthermore, the study investigates the difference between real-time measured and theoretically calculated temperature values with the help of weather station data to investigate the impact of temperature difference on the overall percentage power loss of the systems. The panels were installed at three distinct sites (rooftop, parking shed, and ground-mounted) connected to the same grid-tied system. Results reveal that the photovoltaic panel temperature has an inverse relation with the dew temperature and the humidity of the surrounding environment. The heat index value was found slightly less at the peak solar hours during the 24 h cycle of the measurement. The difference and relationship between temperature and humidity are measured and losses are highlighted based on the instantaneous occurrence of variables. Based on a difference between measured and calculated temperature values, results reveal that PV systems faced 27.95%, 5.41%, and 0.82% power losses for ground, roof, and parking installed PV systems, respectively.
Keywords
Introduction
Energy demand is growing exponentially with increasing urbanization, industrialization, and population growth, putting a strain on conventional energy sources and the environment. Renewable and sustainable energy sources are therefore more focused due to less harmful environmental effects to cater to the growing energy challenge across the globe. Solar photovoltaic systems are a cleaner supply of energy with low manufacturing costs and net-zero emission factors. With the low cost of solar photovoltaic technology, photovoltaic modules are presently deployed in the great majority of countries throughout the world. 1 The research activities in the field of energy-related issues are more focused in the current years. According to a recent study from the International Energy Agency (IEA), solar PV technology is expanding faster than any other renewable energy source on the planet. Globally solar photovoltaic capacity additions are anticipated to reach almost 161.7 GW in 2022, indicating a linear projection from the 2015 analysis. 2 Solar photovoltaic deployment on the utility side is the leading sector in the overall adaptation of photovoltaics across the globe, expected to increase its share by 69% by 2022 shown in Figure 1. 2 However, the Covid-19 issue in the last couple of years may have caused a short-term slowdown in photovoltaic installations globally, but long-term growth prospects remain bright. Before pandemic forecast regarding impacts of Covid-19 lockdown on distributed PV sector reports that, In the distributed PV industry, a two-month lockdown period would be a high-risk threshold value. The monthly value-added loss reaches 67.69% when the duration exceeds the threshold value, while demand shrinks by 78.69%. Furthermore, 7.18% of distributed PV enterprises would be at risk of failure, and nearly 81% of PV sector employees would be laid off. 3 Figure 2 is depicting a year-wise grid-connected PV photovoltaic capacity of Pakistan from the year 2015–2018. 4 The country receives a good average solar radiation profile i.e., almost 5.5 Wh/m2 of solar insolation. 5

Annual additions to solar photovoltaic capacity by application segment till the year 2022.

Year-wise grid-connected solar power capacity in Pakistan.
There are various kinds of solar panels accessible in the market consisting of polycrystalline, monocrystalline, thin films etc. However, under the same environmental and geographical conditions, the power output capacity of monocrystalline solar panels-based power plants is 5–7% better than that of existing polycrystalline ones. In prior studies, monocrystalline silicon-based solar photovoltaic technology was expected to account for more than half of the entire solar industry till the last year. 6 The monocrystalline solar panel is made with silicon cells. Solar cells are made of semiconductor material. Due to its low bandgap of 2.37 eV for photoelectrochemical water oxidation, strong solar energy absorption of about 10%, and high photocurrent of 7.5 mA/cm2, bismuth vanadate (BiVO4) is a very promising n-type semiconductor to be investigated for photoelectrode usage. 7 Solar panels capture energy from the sun and convert it to electricity. The light energy from the sun comes in the form of packets with different wavelength levels called photons. Photons strike on the silicon plate of the panel; some photons having short wavelength are harnessed by the surface of the panel and the panel extract the energy from photons depending upon their efficiency. This phenomenon is widely known as Photovoltaic Effect. It is noteworthy, that not all photons are fully harnessed by the panel surface, some photons having large wavelength gets absorbed into the panel which causes heat phenomena in the panel creating different types of thermal losses. These losses badly affect the thermal efficiencies of solar panels. These different types of losses in photovoltaic module are discussed briefly in next section.
The performance of a photovoltaic module is shaped by two factors: solar irradiation and cell temperature. Aside from these considerations, the performance of the photovoltaic module is also influenced by other factors such as different system losses. The performance of PV modules is also influenced by different metrological parameters which involve climatic parameters, which are not in the control of human beings and have an uncertain nature. These climatic parameters include solar irradiance (kWh/m2/day), wind speed (m/s), ambient temperature (oC), dust particles and cloud cover, and geography of the location.
8
Increasing the potential difference and improving the power output by at least 5.6% was achieved by lowering the temperature of the PV panel. Furthermore, dust deposition decreased power output by 8.80% and efficiency by 11.86%, while birds fouling the PV module surface reduced PV system performance by 7.4%.
9
The distribution of incident solar irradiance and different types of generated losses in PV modules are summarized in Figure 3.
10
Some major losses are classified as follows:
Thermal losses Soiling losses Array mismatch losses Power and resistive losses Sun tracking losses and shading losses

Distribution of incident solar radiation in a photovoltaic module.
As discussed in the previous section, thermal losses occurred in the solar panel because of the absorption of high wavelength photon particles. Environment temperature rise above 25°C is also one of the causes of thermal losses. Due to these effects, thermal loss corresponds to a reduction of performance of the solar panels. 11 Multiple assessments, including a full environmental evaluation, are required to produce a product in a sustainable manner. 12
Photovoltaic panels convert a very small amount of almost 5–25% of solar energy into electricity depending on photovoltaic panel efficiency while the rest 75–95% of incident energy is converted into heat.
13
This heat increases the core temperature of a photovoltaic panel. As the output power of the photovoltaic panel is a function of temperature, this warming effect eventually affects the output power production capability of the panel. The photovoltaic panel loses 0.5% of its power output for every degree of temperature over the normal rating temperature of 25°C.
14
The losses due to these effects are known as thermal losses of the photovoltaic module. Thermal losses depend on wind speed, wind distribution, and ambient temperature.
15
Several factors are responsible for thermal losses in the photovoltaic module, listed as follows.
14
Intrinsic thermal performance characteristics of the material used in the construction of solar cell/module. How is the photovoltaic panel mounted or installed in a typical location? Climatic conditions of that typical location.
Many factors influence the performance of a photovoltaic module. Material characteristics, environmental conditions, meteorological scenarios, and technical and operational aspects are all directly related to the performance of solar photovoltaics installed at any specific climatic location.
16
In broad thinking, these aspects include material type used in the construction of the solar panel, the intensity of solar radiation, environment, and cell temperature, weather conditions, shading effects, module orientation, dust effect, components resistances, and finally the geographical location where the photovoltaic system is installed.
17
Temperature is one of the major factors and from all the above-discussed factors. As discussed in the previous section, thermal losses are the second-largest losses right after shading losses. The temperature coefficient of most polycrystalline and monocrystalline solar cells ranges from 0.40% per degree to 0.50% per degree. This indicates that the photovoltaic panel will lose 0.5% of its power output for every degree rise in temperature over the standard rating temperature of 25°C. Temperature rise is the driving force of thermal losses in the photovoltaic panel. Thermal losses are directly related to the temperature of the cell. As the temperature gets raised above the standard test conditions (STC) value (25°C), thermal losses start to increase which ultimately decreases the overall performance of the solar panel.
Dust particles highly affect the output performance of solar photovoltaics. Dust particles and wind speed have an inverse relationship with each other. Photovoltaic panels installed at large height (roof) show better performance due to steady wind flow as compared to photovoltaic panels installed at ground level. The impacts of dust particles on the output performance of solar photovoltaic panels are investigated in many recent studies under different weather conditions.18–20 Solar photovoltaic efficiency is inversely related to cell internal temperature. The temperature rises due to different factors like climate variation and installation height etc, decreasing the final efficiency of photovoltaic modules. Authors in21,22 investigated the effects of high temperature on the output performance of solar cells concerning different technologies. From the perspective of relative humidity, when the humidity is low, the photovoltaic efficiency is high. As a result, photovoltaic systems operate better when the relative humidity is low.
23

From reviewed literature, most of the studies focus on a single factor influencing the output performance of the solar panels. Some studies just considered the temperature effect while humidity and dust impacts were ignored. While some studies considered only dust impacts and other factors like temperature and humidity factors were ignored. Although some rare studies exist in the literature that studied the impact of multiple factors like26,27 these studies do not take into account the height factor. The output performance of different height factors from the ground is ignored. To the best of the authors’ knowledge, no potential study was found in the literature that takes three different height factors and multiple influencing factors on the output performance of solar photovoltaics at the same time. In contrast, this study focuses on the multiple factors at the same time responsible for photovoltaic efficiency reduction at three different height levels from the ground. Three different height levels are considered concerning three different atmospheric pressure to study the impact of temperature and humidity factors on the output performance of solar photovoltaics. A total of 150 kW solar photovoltaic systems installed on the premises of the U.S-Pakistan Center for Advanced Studies in Energy, National University of Sciences and Technology building is considered as a case study. The photovoltaic system is installed on three different locations (ground, parking, and roof) concerning height.
The efficiency degradation due to temperature increase is dependent on multiple factors. One factor is the installation position of the solar system. The Solar systems can be deployed on plain ground, parking lots, rooftops, canals, green fields, deserts, or any other appropriate place. The installation location will differ in the useable solar irradiations, surface reflections, wind speeds, dust factor, and humidity.
The existing research concedes the effect of temperature on the photovoltaic panels, but no study has been conducted on the solar systems installed in three different environments at the same location and the temperature differences have not been identified. The effect of humidity at the same location with the height difference, such a study has not been conducted. The relationship is measured variables at the back surface of the panel and the weather station data is not available in previous studies.
The research contributes to the following specific areas, The temperature variation at the same day time is measured for three different locations, The change in humidity is highlighted when the installation height of the solar panel is changed, Dew point temperature effect on the solar PV temperature is measured, the relationship between measured PV temperature and theoretically calculated temperature of PV panel based on local weather data is also plotted.
Methodology
The data of the photovoltaic system positioned at 33°38′31.5″N 72°59′06.0″E 33.642071, 72.984997 is quantified and documented for several periods through a data logger device at three different spots of the system. The first spot refers to a photovoltaic array fixed at the earth level. The second spot implies a photovoltaic mounted in the parking area, while the third spot implies a photovoltaic positioned on the roof of the educational building. The obtained data of the solar photovoltaic system consisted of solar panels’ back surface temperature and humidity for each different spot. The weather data for the same time slot and the same locations are also acquired through a metrological high precision weather data station installed in a radius of 700 meters from the installed photovoltaic system, as shown in Figure 4. The detailed description of time slots for which the temperature and humidity data of the solar photovoltaic system and corresponding weather station data are acquired is tabulated in Table 1. The data is logged with precision devices in.csv format with time stamps.

Data collection points to three distinct locations and their satellite view. (a) roof, (b) parking, (c) ground, and (d) satellite view.
Measured data details.

Figure 5 explains the flow of calculation methods for different parameters. The temperature of three points is measured with three devices and then the collected data is time-synchronized so that a real-time measurement can be experienced at the same time.

Flow chart of the methodology for identification of temperature and humidity effects, and the difference between real-time measured and calculated values.
After data processing and segregation, the temperature of the photovoltaic panel back surface is divided into high temperature, medium temperature, and low-temperature values with the same time stamps. To see the effect of temperature on the photovoltaic panels at different times of the day and night, the occurrence of high temperature, medium-temperature, and low temperature is calculated.
The highest temperature occurrence is further compared with humidity values at the same timestamp. This helps us to identify the effect of humidity on the solar panels.
The temperature of a photovoltaic module (°C) is stated as a function of meteorological data and empirical factors. The relationship between different parameters and their impacts on the output efficiency of a solar photovoltaic module is described below:
The mathematical model of a photovoltaic cell may be created using the following formula, which allows retrieval of the I-V curve.
34



of 

The temperature has an impact on the performance of solar cells in terms of output power. Temperature owns a strong effect on the output power generation of the solar photovoltaic modules. Temperature causes a strong heating loss in a photovoltaic module which alternately causes a reduction in output efficiency of the module. That is the main reason, in most cases, solar panels yield more output in colder temperature areas and show less performance in high-temperature areas. The following correlation shows the relationship between temperature and output power production of the photovoltaic module.
25


Where;
On the other perspective, the open-circuit voltage is highly dependent on temperature and has a direct relationship with each other. Open circuit voltage decreases with a temperature rise, while current also changes concerning temperature.
36

Ambient temperature is also reported as a baseline or ordinary temperature. Ambient temperature is referred to as outdoor real-time environmental temperature, which any object faces in real-time. The cell temperature of the photovoltaic module has a direct relation to the ambient temperature. With the increase in ambient temperature, cell temperature gets increased which causes thermal losses in the module. These thermal losses ultimately cause degradation of the output performance of any specific photovoltaic module. The mathematical relationship between cell temperature and ambient temperature is followed by:
The relative humidity is the ratio of specific humidity to saturation specific humidity expressed as a percentage. A saturated parcel of air at constant pressure, cannot retain any more water molecules, resulting in a relative humidity of 100%. As air temperature rises, it can contain more water molecules, resulting in a drop in relative humidity. According to studies, parameters like voltage, current, and power are dependent on relative humidity. By increasing the relative humidity gradually, the serial resistance starts to increase which ultimately is the output power of the photovoltaic module. By decreasing the relative humidity, the output performance of the photovoltaic panel increased. From the perspective of shunt resistance, with increasing the relative humidity, shunt resistance decreases which results in a decrease in the current magnitude of photovoltaic modules. Thus, the output performance of the photovoltaic module decreases. So, from all the above-mentioned perspectives, the final power of the photovoltaic module decreases with an increase in relative humidity. As followed; regression Equation 11
25
may be used to represent the variation in photovoltaic output power as a function of relative humidity.
The internal temperature of any photovoltaic module is the main factor that decreases the performance of the photovoltaic panel. The photovoltaic panels operate better in low-temperature environments as compared to high-temperature environments. Thanks to wind flow due to its cooling impacts, which maintain the internal temperature of the photovoltaic module and cause cooling impacts in the photovoltaic module. So, photovoltaic panels better perform in windy areas.
It is seen that the floating systems and rooftop-installed solar systems show better performance as compared to photovoltaic panels installed at ground level. The major factor in this difference is the wind flow, wind flows smoothly at the roof and sea level due to no obstacles at height and offshore levels. The series resistance of the photovoltaic module decreases with increases in wind speed, while shunt resistance increases with an increase in wind speed.
25
Which increases the output power of the photovoltaic system by increasing the wind speed level.



Specifications of data logger device.

Acquired climatic data from weather stations for the same timestamp.

In Figure 5 (data processing 1) the flow for measuring the relationship between heat index and temperature values at three different PV panels installed under environmental conditions is demonstrated. In the first stage, measured heat index values of all three locations are synchronized concerning the same time stamps. In the second stage, the measured PV panel temperature from all three sites is synchronized concerning heat index timestamps values.
Then, the effect of heat index on the temperature of PV panels is elaborated based on the resultant outputs. The resultant output results may reflect the smaller heat index values at peak hours of the sun, which are summarized in Figure 9 of the results and discussion section. Similarly, in Figure 5 (data processing 1), the relationship and impacts of dew points temperature on actual temperature are elaborated. Like previous cases here also, in the first stage, the measured dew point temperatures of all three sites are synchronized concerning the same time stamps.
In the second stage, the measured temperature values of all three sites are considered and synchronized concerning the same time stamps as measured dew points temperature values. Then, the effects of dew points on temperature are elaborated, which is expected to show the inverse relation with solar panel temperature. The resultant outputs for all three sites are summarized in Figure 10 of the results and discussion section.
Data is processed and trimmed to group the data into different patches concerning complete days. The incomplete data and some initial and final samples have been removed due to reassembling of the data logger during measurement from one place to another place of measurement. Weather data is acquired for a whole year, but data used in this study was extracted according to a period of temperature and humidity data acquired. Weather data acquired from the weather station consist of different weather-related parameters like average global horizontal irradiance (GHI), average direct normal irradiance (DNI) thrust average air, average relative humidity, and average gust values.
The output performance and efficiency of a photovoltaic module are affected by the operating temperature, with the rate of change being influenced by the weather and the photovoltaic material. Air temperature is affected by prevailing weather patterns and changes in local surface conditions and fluctuates as a function of latitude, elevation, and large-scale atmospheric circulations. 37 Average air temperatures provide a more accurate representation of the temperature in a given region than a single measurement could. Temperatures change during the day, throughout a week, month to month, and year to year, as well as depending on where you are.
Results and Discussion
Figure 6 is depicting the temperature analysis of understudy PV systems at three different height levels (rooftop, parking, and ground). From the figure, during day hours the temperature of the PV system installed at ground level remains higher as compared to the other two installed locations. While during night hours the temperature of the ground remains lower as compared to the other two locations. During day hours, the trend of high-temperature variance follows the sequence of ground, roof, and then parking. While during night hours, the trend of high-temperature variance follows a sequence of roof, parking, and then ground. Here, it is worth noticing that, during rainy weather conditions (June 02 – June 03), the temperature of all three sites drops to a significant value. The effect of humidity can be seen in Figure 7 where the humidity values of three locations with time synchronization have been plotted. The difference in humidity values defines the difference in environmental conditions. The humidity is higher on the grass due to grass and nearby trees. On the opposite side, the humidity values for the roof are lower as compared to the ground.

The measured temperature for the three locations is from 1–8 June 2021.

Measured humidity for three locations from 1–8 June 2021.
The lower values indicate that the rooftop environment is less humid due to the shiny and reflective roof surface. The data on 3rd June represents the rain in the first half of the day, due to which peak is observed at 0900 AM.
The effect of temperature on the photovoltaic panels is segregated concerning several occurrences of temperature values in correlation with all three locations. After separating the temperature values into high, medium, and low for every instant, the frequency of each high, medium, and low are plotted in Figure 8 in percentage values for temperature and humidity values. The results show that the occurrence of the highest temperature values is greater in percentage concerning the other three locations. The Occurrence of the smallest values is the smallest for the ground, which means that ground installed panels observe more temperature peak values fluctuations as compared to the other three locations. The lowest humidity occurrence remains at ground level while the highest humidity occurrence remains on the rooftop.

The relationship between the occurrence of temperature and humidity for three locations.
The data in Figure 8 also shows that humidity and temperature have an inverse relation. As the humidity increase, the values of temperature gradually decrease at the same rate, and vice versa. The analysis reflects the discussion regarding low values of humidity values when at the peak sunshine time. The fluctuations in humidity data are found at the start of the day as the same fluctuations in the temperature data were found. This shows that humidity and temperature are very closely related.
As shown in Figure 9, the relationship pattern between heat index and temperature for roof and parking remained the same, but a little bit different for the ground site. In the case of roof and ground, during day hours, the heat index remained lower as compared to cell measured temperature, while at night hours the situation becomes opposite day hours. During night hours the measured cell temperature rises above as compared to the heat index. While in the case of parking, for some period (June 01 – June 02) of time the pattern remains the same as the case of roof and ground, while for the next horizon (June 03 – June 07), the situation seemed to be a little different, where during day hours the heat index remained higher as compared to measured cell temperature, and vice versa for night hours.

Relationship of photovoltaic temperature and heat index; (a) roof, (b) parking, (c) ground, and a heat index of all sites.
Here it is worth noticing that, for all three sites a dip in temperature and heat index is noticed from June 02 – to June 03. This is because of weather conditions, rain during this day caused a humidity effect which ultimately caused a decrease in the overall temperature and heat index of the panels and environment. The expression for heat index and temperature relation is given below.
38


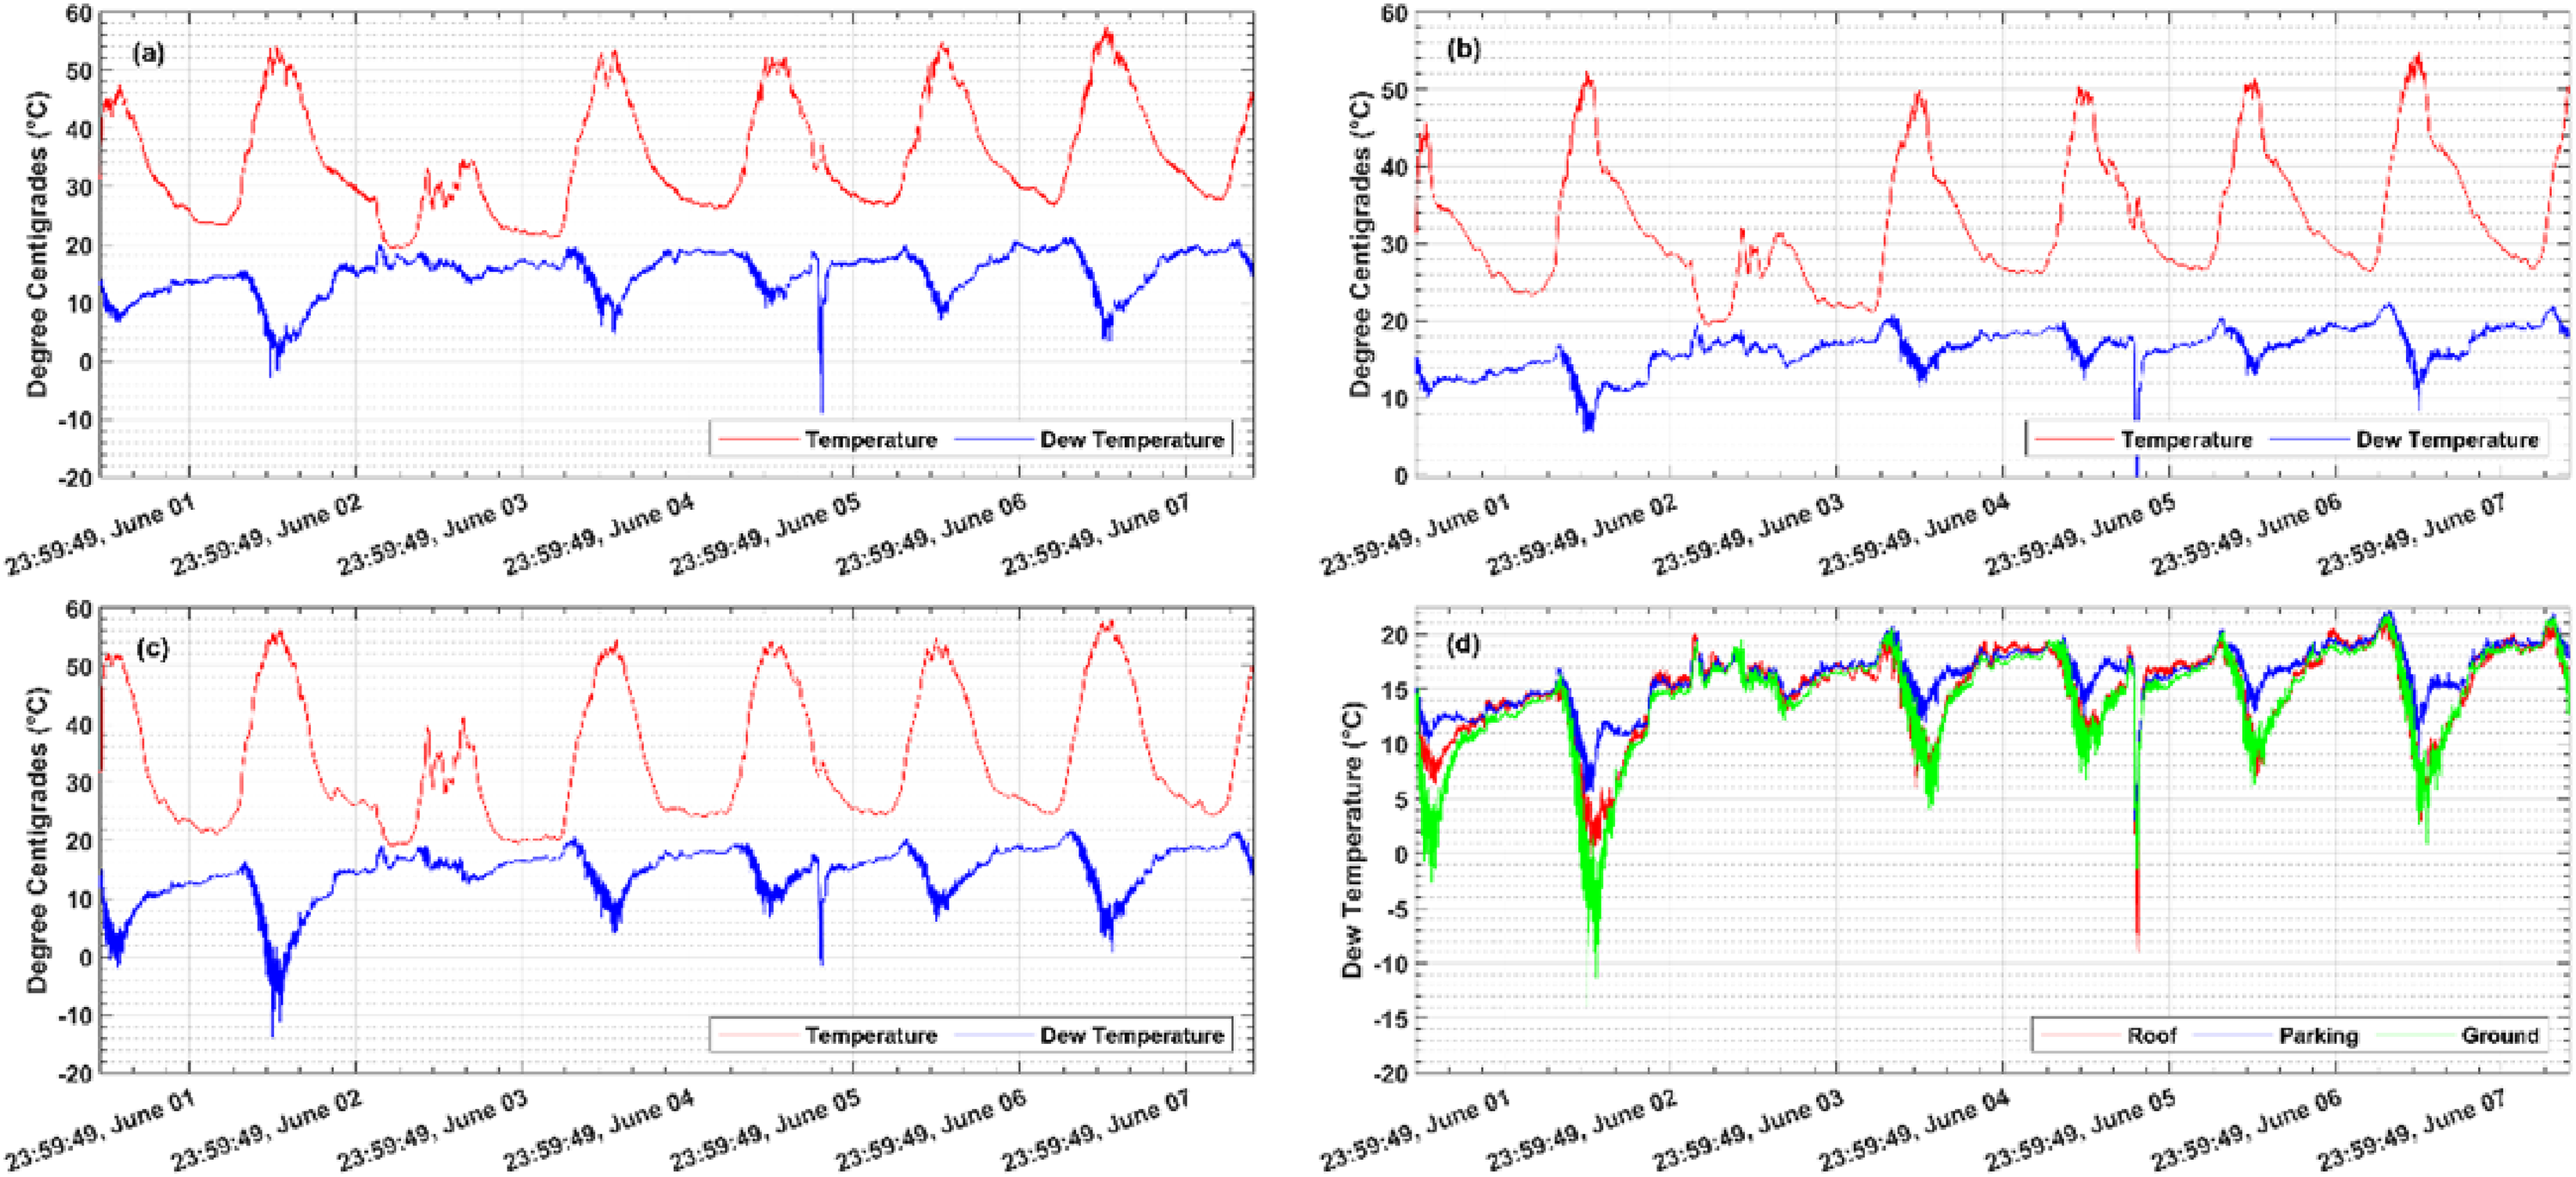
Relationship of PV temperature and dew temperature; (a) roof, (b) parking, (c) ground, and (d) dew temperature for all sites.
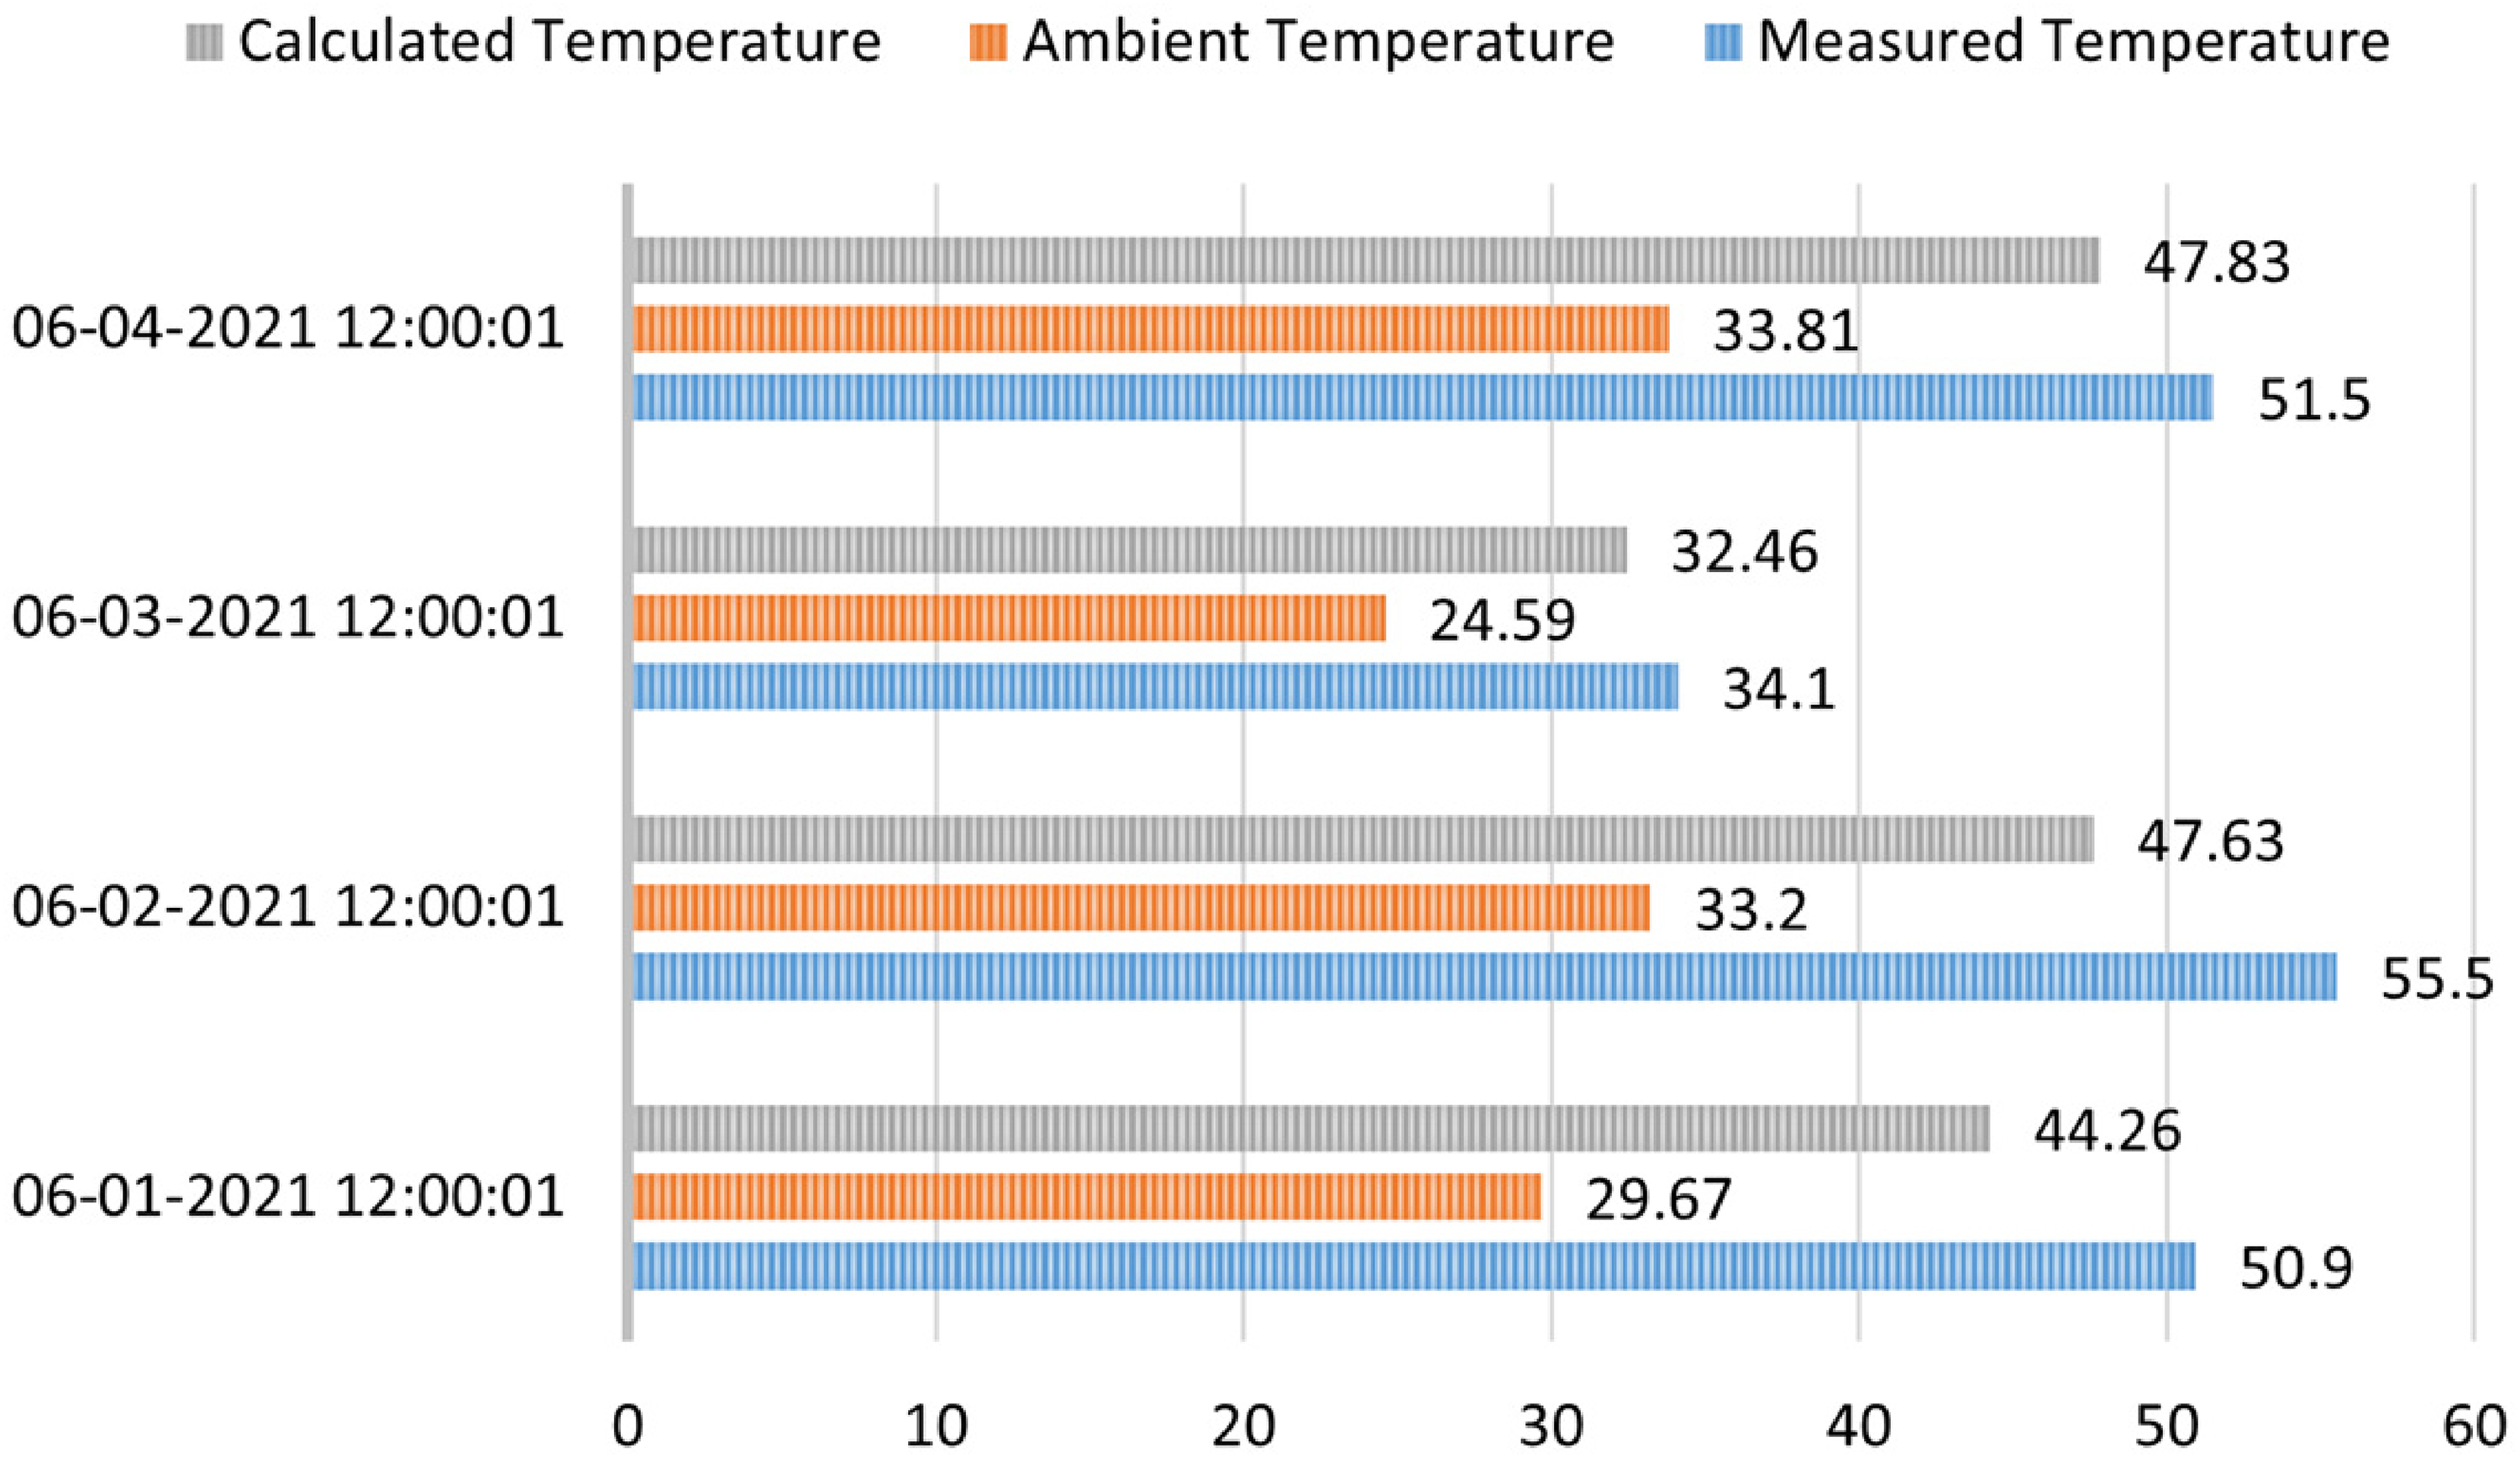
The relationship between the real-time measurement of photovoltaic temperature and calculated temperature.
Graphical representation also shows the difference between actual measured temperature values and theoretically calculated values. The trend shows the peaks in measured values as compared to theoretically calculated values from Equation 10. This difference may result due to some external factors which are not considered in the formula during the calculation of theoretical module temperature values.
These external factors may include dust particles, temperature measuring position, and background radiation etc., some of them are summarized below:
This difference between real-time measured PV module values and theoretically calculated values from weather station parameters causes performance reduction in a PV system. This PV performance reduction results in output power reduction. To calculate the percentage (%) power loss due to the difference between actual real-time measure temperature values and theoretically calculated values for all installed PV systems locations. The power output (
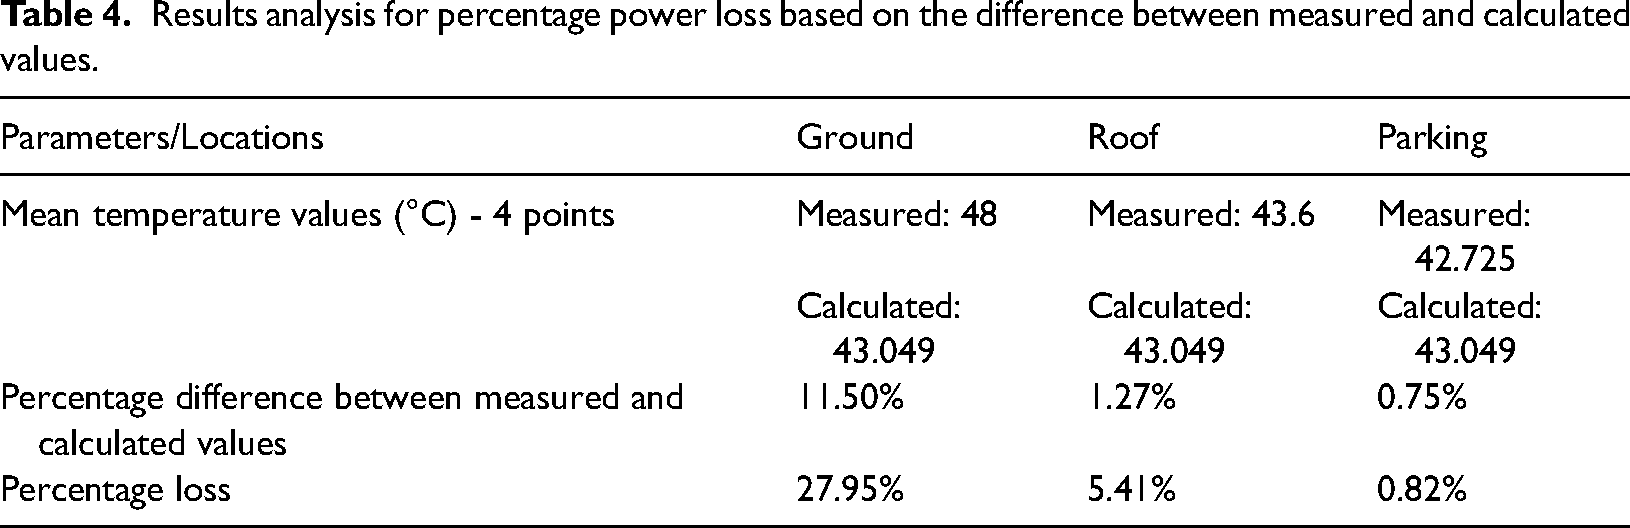
The results reveal that ground has the highest losses, then the order of roof and parking, respectively. This is due to two major reasons. The first reason is the highest temperature at ground installed PV systems. During day hours the ground surface gets hotter quickly as compared to parking and roof. That is why, the temperature of the ground remains higher as compared to the other two locations, and this may lead to high power loss in installed PV systems also. The second reason is the difference between real-time measured values and theoretically calculated values (from weather station data) of the temperature. The higher the difference between measured and theoretically calculated values, the higher the power loss for all three installed PV locations.
Ground faced a large difference i.e., 11.5% as compared to the other two locations that achieved roof (1.27%) and parking (0.75%) respectively, that's why installed PV systems faced a high-power loss in the order of ground, roof, and then parking. Detailed results are summarized in Table 4. Note that, the calculated values are computed from weather station data through the formula (Equation 10) for the same irradiance and ambient temperature values for all three locations. It is worth noticing that the difference between roof and parking percentage loss is too small as compared to power loss at ground level. This is due to wind speed variations for all three sites and the structure of the roof which is the concrete mounted roof for this study.
Results analysis for percentage power loss based on the difference between measured and calculated values.
Conclusion
In this research, a detailed study is conducted based on the real-time measurement of environmental parameters of a solar photovoltaic system that is installed at three different locations. The solar photovoltaic temperature is measured at three distinct locations and correlated with other environmental parameters that include dewpoint temperature, humidity, and heat index. The PV panels’ temperature and the heat index value difference were prominent in the rooftop and the ground installed panels during the peak day time. The dew point temperature is found less at the ground installed PV panels as compared to a rooftop and the parking installed PV panels. The solar panels installed at the highest location (rooftop) with concrete surface observing highest temperature with the highest temperature percentage occurrences as compared to ground installed and parking installed photovoltaic panels leads to higher thermal losses and degradation. The humidity value of the ground-installed photovoltaic panels appeared highest as compared to all three locations which lead to a lower temperature value of the panels. Regarding percentage power loss, based on a difference between real-time measured and calculated values PV system installed at the ground location faced the highest percentage power loss i.e., 27.95%, While systems installed on rooftop and parking faced a percentage power loss with the order of 5.41% and 0.82%, respectively.
Future recommendation
In the future, the parameters which are affecting the real-time temperature of the photovoltaic can be measured and studied for real-time temperature estimation of the solar system. The abrupt declination of parking installed panels right after the peak sun hours can be further quantified in future research.
Footnotes
Acknowledgements
We acknowledge the support of Mr Ali Javaid in data collection, and the authorities of the U.S.-Pakistan Center for Advanced Studies in Energy (USPCAS-E), NUST for granting access to test systems.
Declaration of conflicting interests
The author(s) declared no potential conflicts of interest with respect to the research, authorship, and/or publication of this article.
Funding
The author(s) disclosed receipt of the following financial support for the research, authorship, and/or publication of this article: This work was supported by the Higher Education Commision, Pakistan, (grant number NRPU 10462).
