



Abstract
Energy is very vital for the economic development and prosperity of any nation. Expanding a country's use of renewable energy sources can help it meet its current and future energy needs, as well as spur economic growth. Sustainable energy supply, electrification rate, population shifts, and per-capita power use affect economic development and prosperity. Electricity use is a key sign of a country's economic growth, and as the economy grows, so does the need for energy. Electricity generation relies on the availability of primary sources, implementation of technology as well as on policy imperatives. The South Asian Association for Regional Cooperation is the regional intergovernmental organization and geopolitical union of states in South Asia. Its member states are India, Afghanistan, Bhutan, Bangladesh, Nepal, Maldives, Sri Lanka, and Pakistan. SAARC countries are wealthy in natural resources, yet economic growth is a difficulty. This study aims to assess the solar energy potential of SAARC countries, which has received little attention. Prior research on solar energy possibilities in SAARC concentrated on one country or group. According to the study, SAARC countries rely heavily on imported fossil fuels and a single energy source. Renewable energy sources, especially solar energy, are important for their sustainable expansion, diversity of energy basket, energy security, and fulfilling rising electricity demand. The SAARC region has superior daily average horizontal sun irradiances than the UK and Germany, indicating untapped potential for solar photovoltaic systems. This study aims to encourage stakeholders to execute efficient solar energy governance planning for sustainable growth.
Introduction
Energy is vital for the region's economic development, and finally, its growth leads to well-being and prosperity. Although the relationship between energy consumption and economic growth is well known, the direction of the relationship is not always evident. Increased renewable energy in the nation's energy mix is anticipated to help meet the nation's expanding energy demand and influence economic growth over time. Renewable energy sources can reduce the environmental impact of fossil fuels and increase the diversity of energy sources, so potentially contributing to energy security and the availability of long-term energy supplies. Renewable energy sources, which are more accessible in less developed regions and may reduce the cost of climate change, can improve regional development.1–3 In the twenty-first century, the crucial issue is how to thwart an energy crisis. 4 During the last decades, regular exertion has been performing to find numerous different ways to meet rising energy demand.4,5 In order for the world to progress and remain competitive, three major issues must be addressed: affordable and easy access to energy, energy supply security, and environmental sustainability. 6 It is appraising that our earth is blessed with a vast range of energies classified as conventional and non-conventional sources to complete primary and secondary energy requirements, mainly electricity production. The traditional source of energy is generally fossil fuels like coal, crude oil, natural gas. 7 On the other hand, non-conventional or renewable energy sources like wind energy, solar energy, hydro energy, etc., have not been fully utilized. As compared to non-conventional sources of energy, fossil fuels have been well employing and commercializing for a long. 8 However, due to the scarcity of domestic conventional energy sources, developing countries have to import fossil fuels. Therefore, to sustain and meet the growing energy demand, harnessing renewable energy sources is the only alternate.4, 9–11 This alternate is not a new concept, and it has been developing for a long to replace fossil fuels with other energy sources. Earlier studies suggested that renewable energy sources are available in abundance and theoretically can produce 1000 times more than the global energy requirement, demonstrating that they are a viable source of energy.5,12 It is because of this that governments throughout the world are paying greater attention to renewable energy sources and incorporating them into their energy strategies. 4 Renewable energy's share of the total global primary energy consumption basket is steadily increasing, with renewable energy accounting for 12.54% of the total global primary energy consumption basket in 2020, as shown in Figure 1.
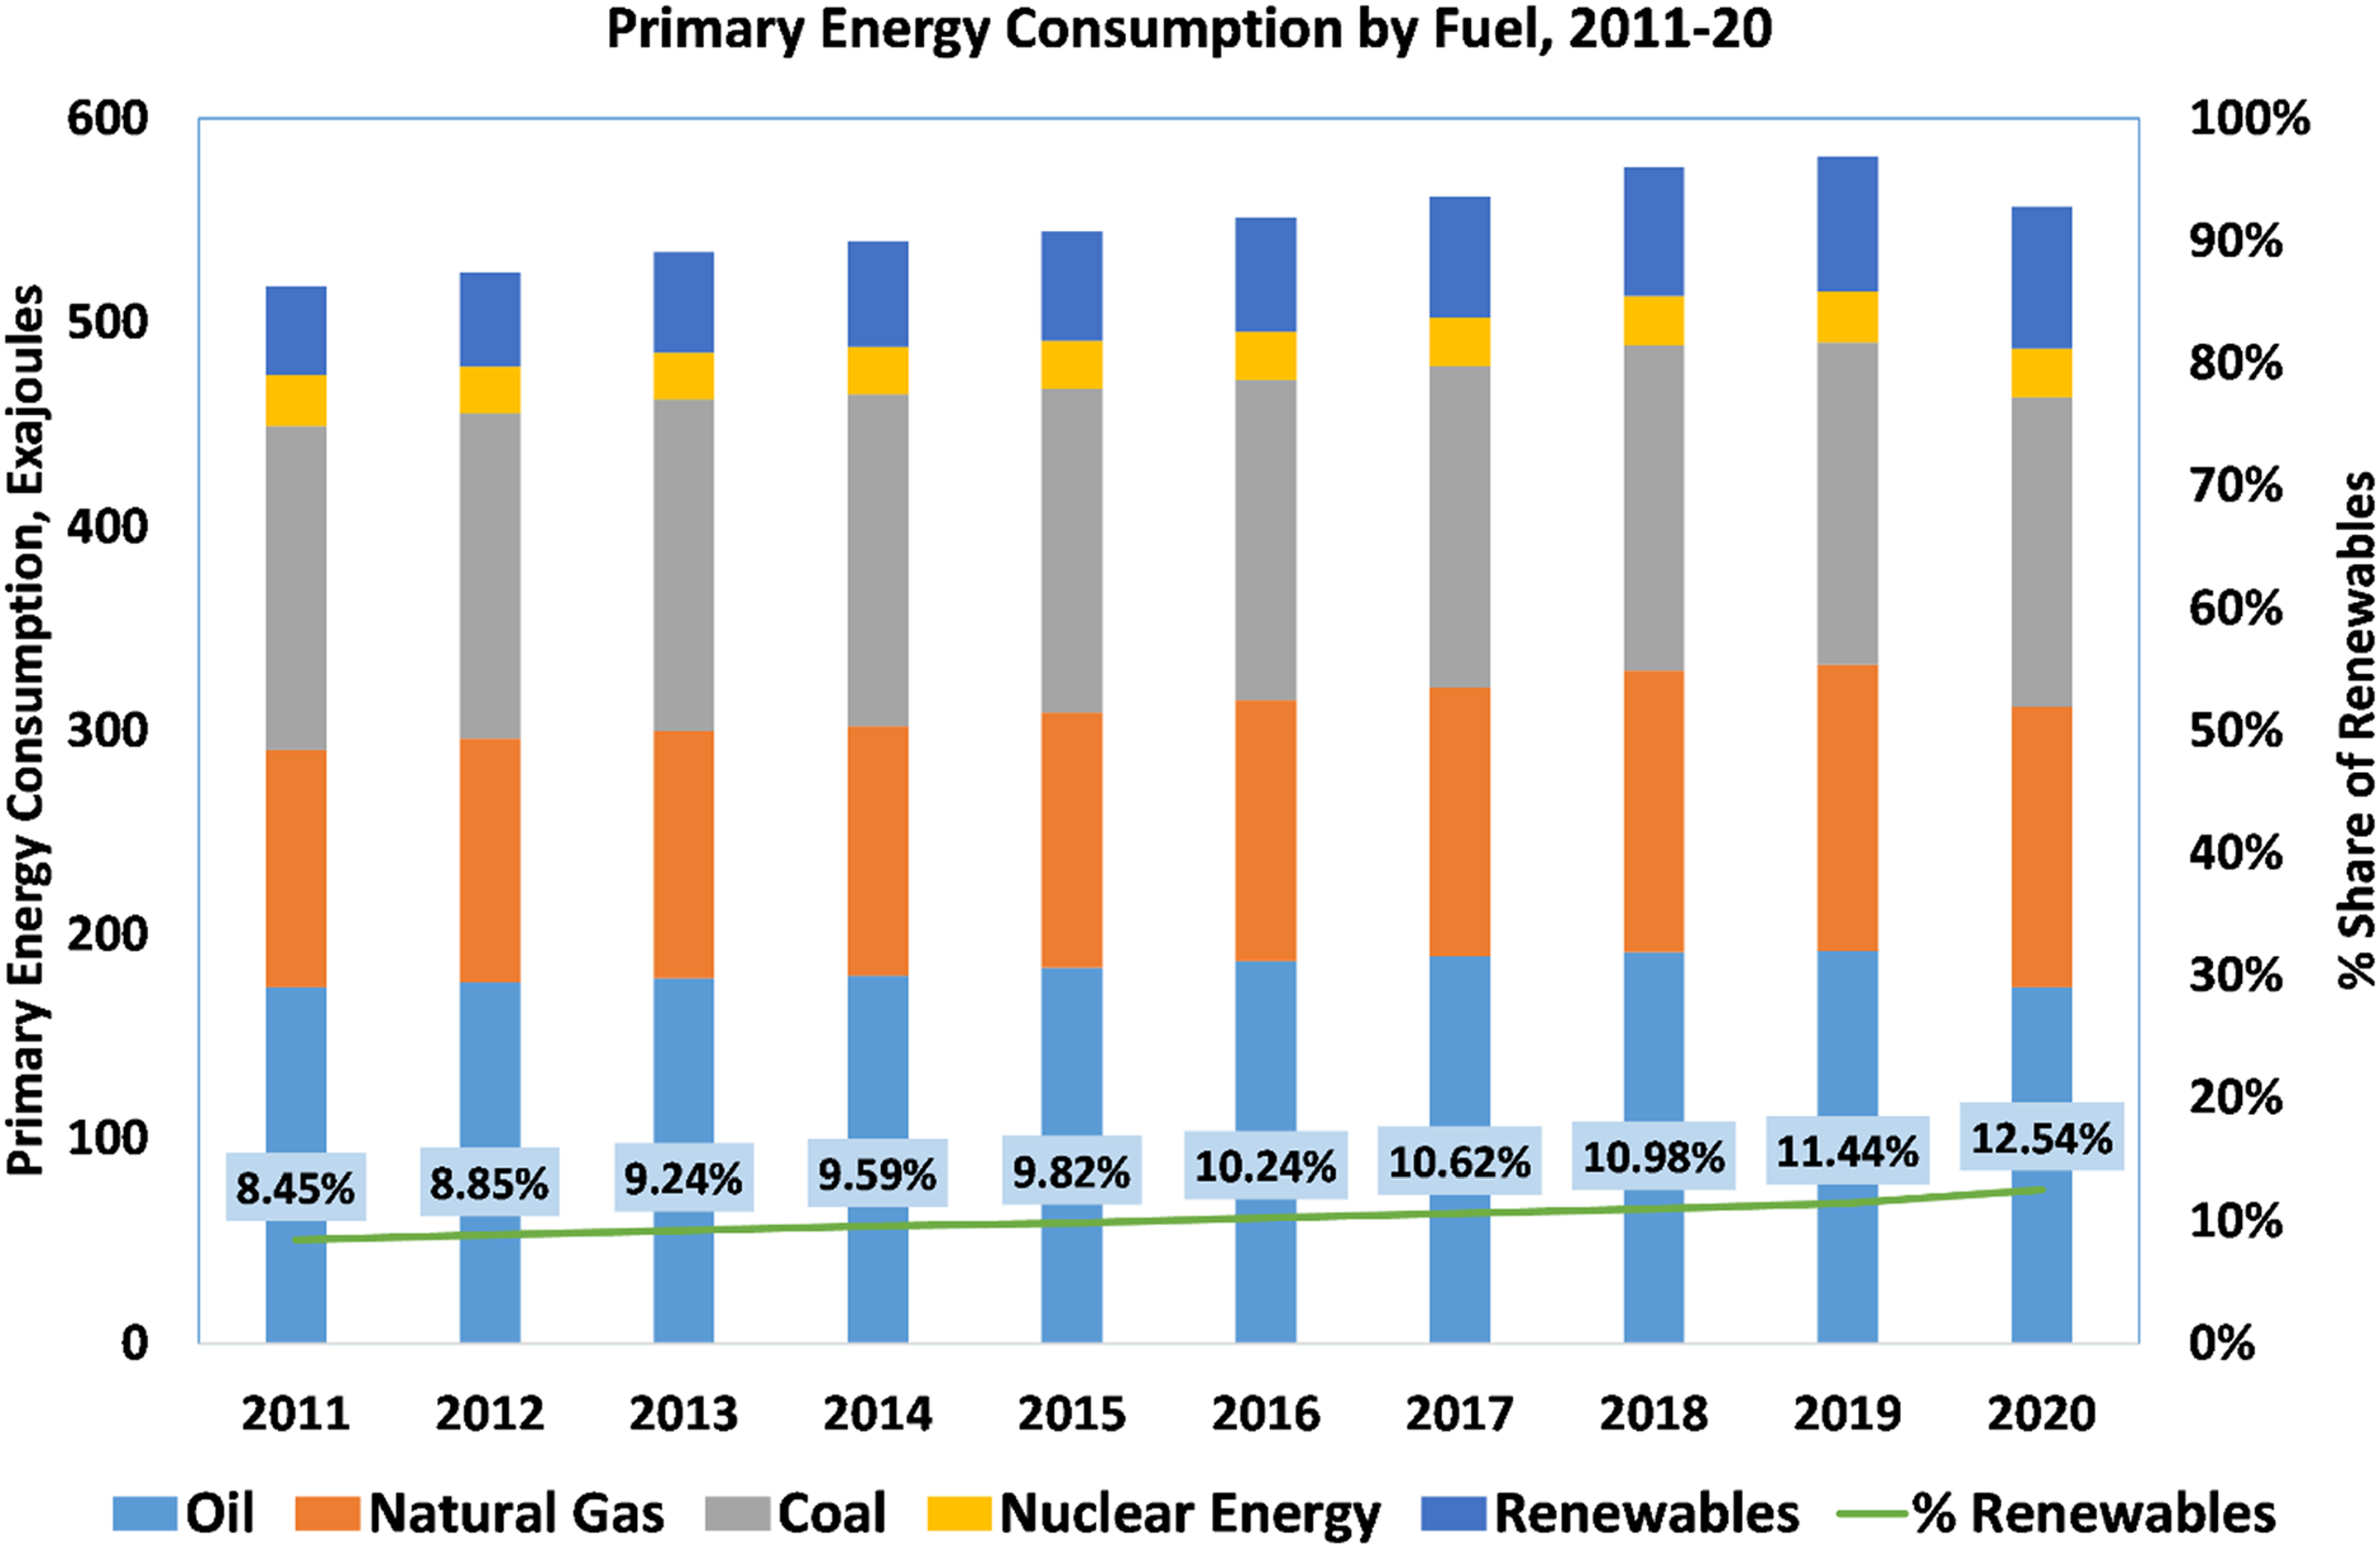
Share of renewable energy in global primary energy consumption basket, 2011–20. 13
Renewables sources assist battle climate change, diversify its sources, and protect them from external shocks. The transition from fossil fuels to renewable energy sources is predicted to increase gradually as the latter's cost continuously declines compared to the former's. Currently, there is fresh market potential in renewable energy technologies, as new developers push these technologies with the extra assistance of the government and public opinion. Therefore, the involvement of SAARC countries can be considerable since they have large prospects for renewable energy such as solar, wind, hydro, and biomass, which can solve energy shortages and promote sustainable economic growth in the region. 14 In the SAARC region, among all renewable energy sources, the solar power energy market is rapidly expanding due to solar power's abundant availability, consistent supply, cleaner fuel and ease of deployment at residences and industries. 15 In the past three decades, the performance of solar power generation systems has increased, and sales have achieved tremendous development. In addition, the capital and power-generating costs associated with the solar system have also declined significantly.14,16
Photovoltaic (PV) systems and solar thermal systems are the two most common ways to use solar energy. PV systems convert sunlight into electricity, and solar thermal systems convert sunlight into heat. 7 The latest solar technologies, such as concentrated photovoltaics (CPV), concentrated solar-thermal (CST), solar heating and cooling (SHC), and water desalination, overcome the problems associated with conventional power generation systems, such as low power generation and production efficiency. These technologies have the potential to be utilized in a wide range of applications.17–20
For South Asian countries, solar energy's inherent characteristics make it a valuable utility for the following reasons: (1) South Asian countries are located in areas with optimal exposure to direct sunlight, as shown in Figure 2. For instance, in India, the annual solar power received is about 5000 trillion kilowatt-hours (kWh). In addition, the average radiation in tropical and subtropical areas of developing countries can be compared to the global average, which is about 1600–2200 kWh/m2. 5 (2) A global shift towards low-carbon footprints and cleaner fuel like solar energy. (3) Solar energy is relatively cheap and usable in homes and villages due to which areas in developed countries use more solar energy than ever before.
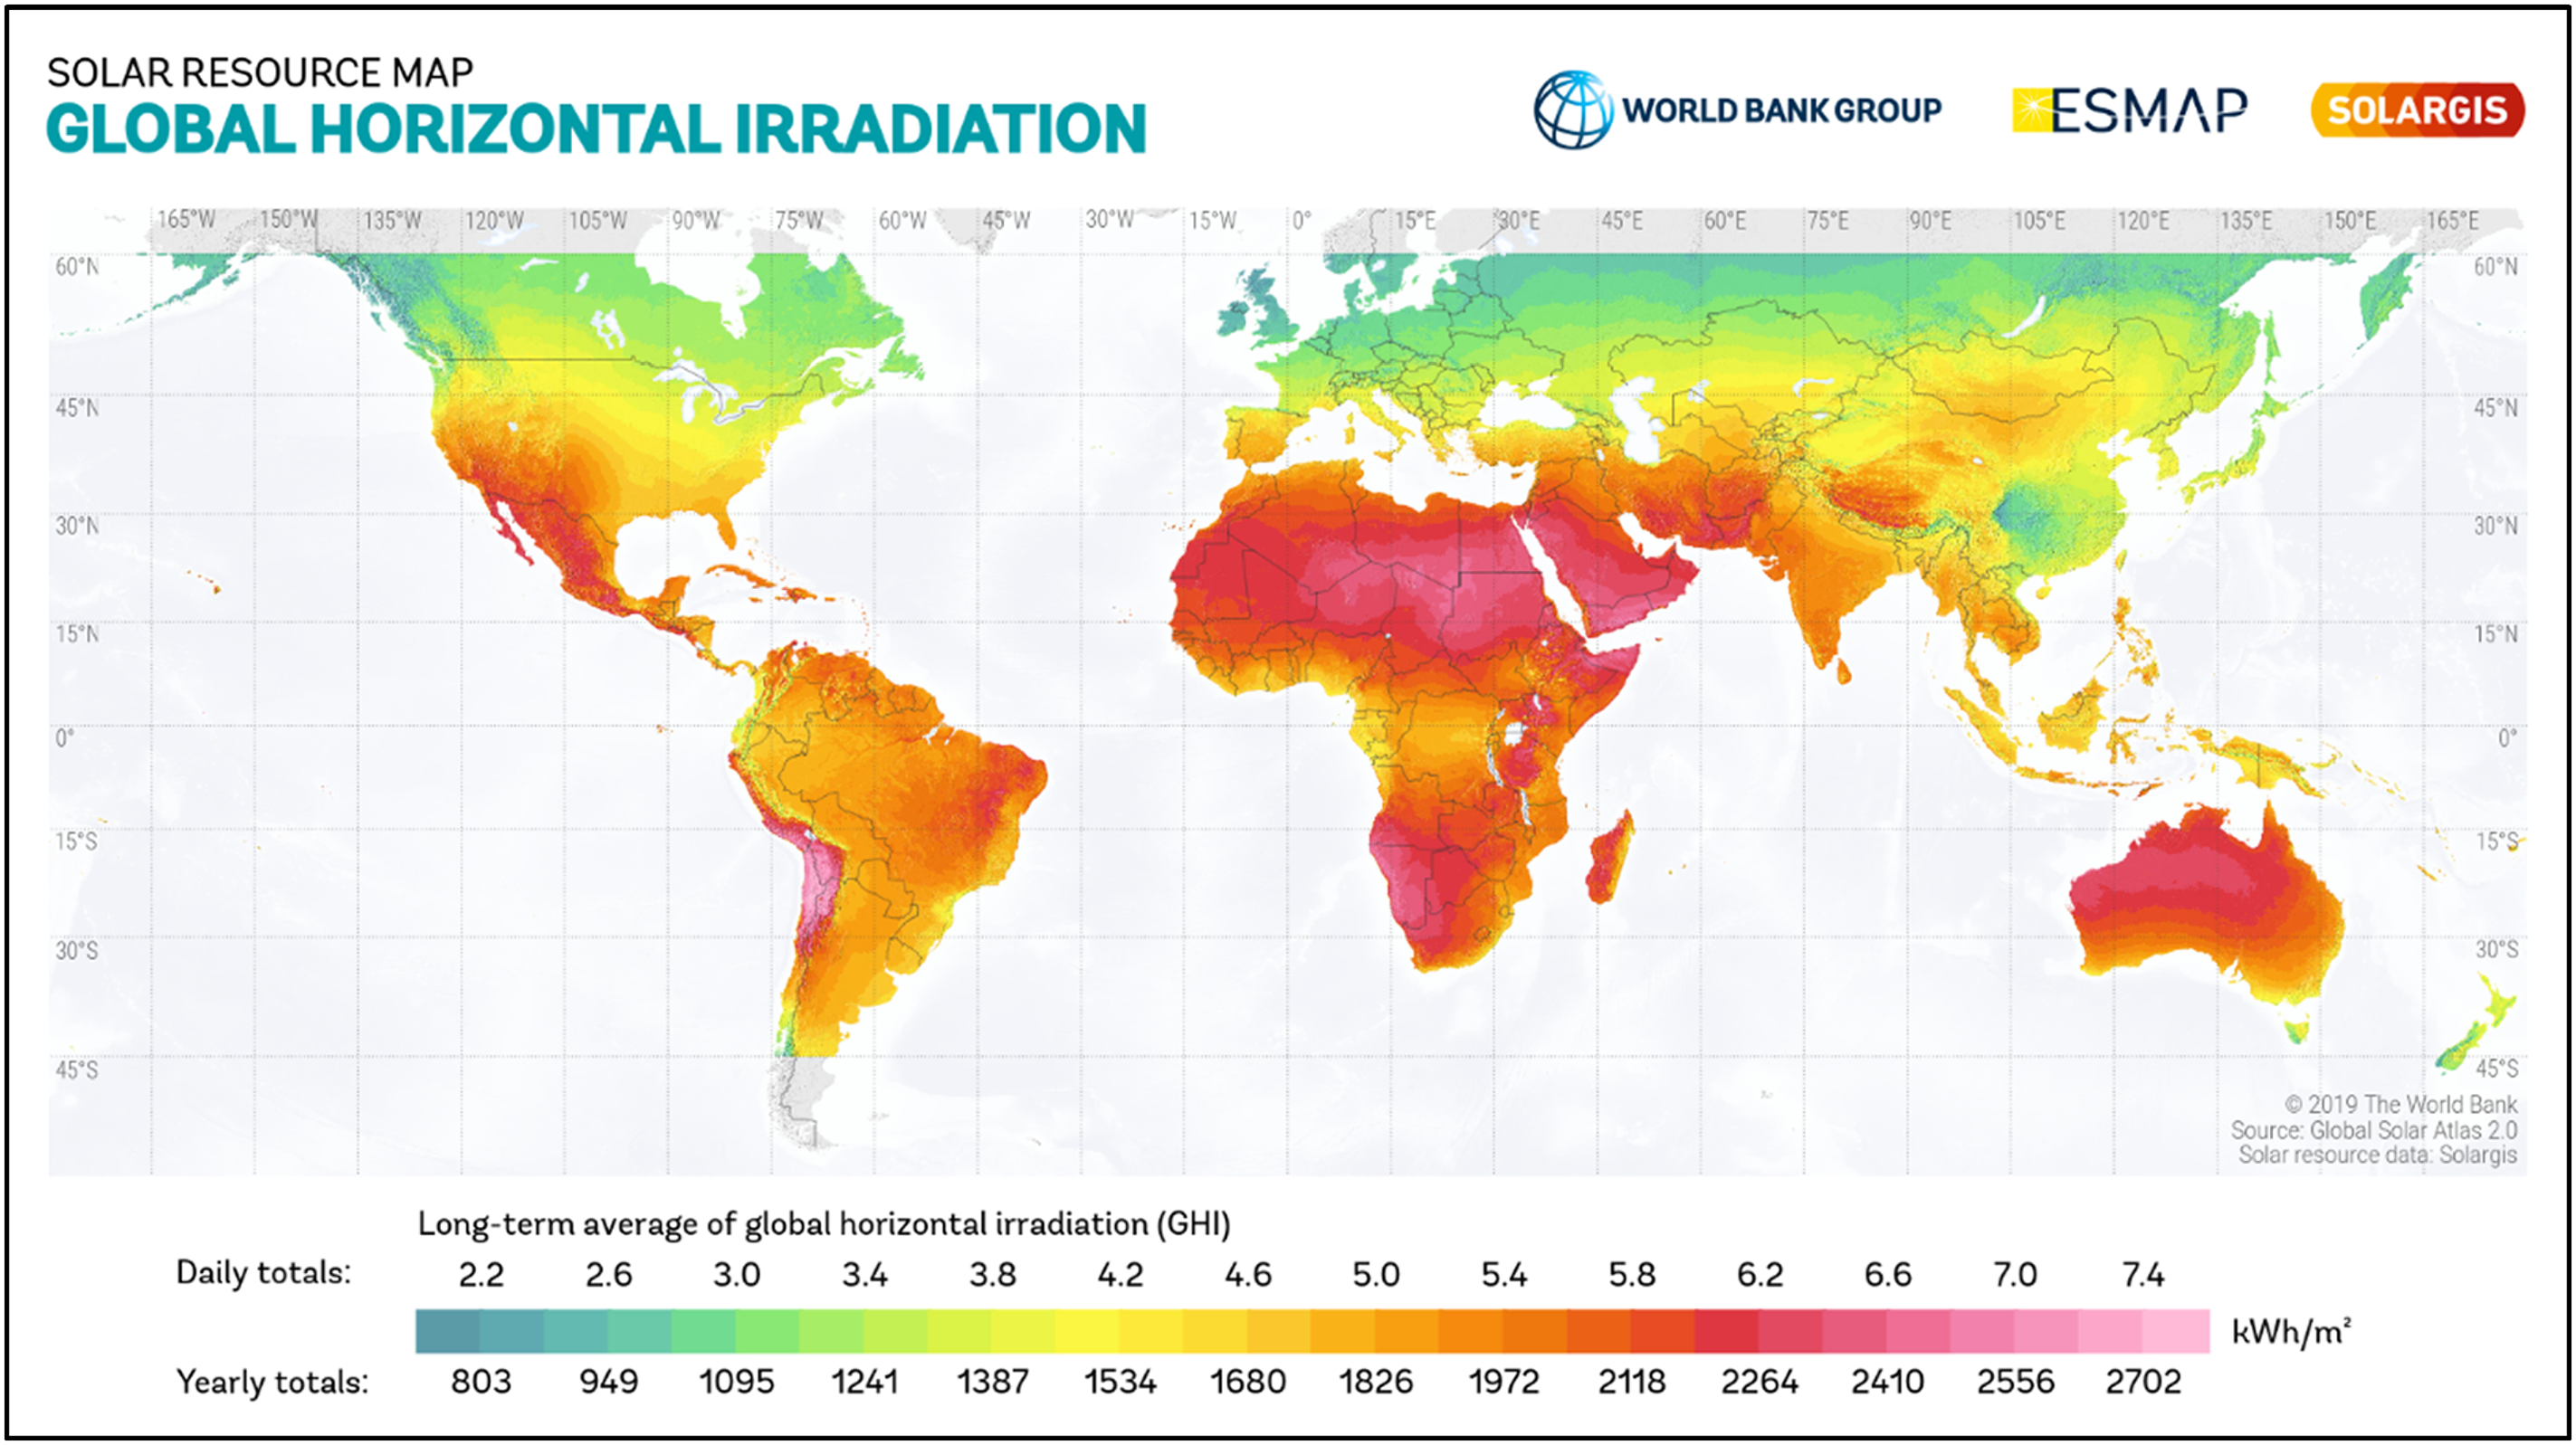
Average annual global solar energy (GHI). 21
Solar PV installations are expected to grow by 32% annually by 2022, according to a report by leading information provider IHS (Information Handling Services) Markit. This will result in an additional 232 GW of solar PV capacity being added to the global grid. China, India, and the United States are going to be the most important markets geographically, and together they are going to constitute half of the total demand in the world. 22
Demographics of SAARC Region
Analysis of population demographics and energy infrastructure provide insights that are crucial for identifying development needs, policy recommendations, and investment gaps as the globe moves through the phase of global energy transition. These data and insights are critical for evaluating a country or region's development path in any sector. SAARC countries, namely Afghanistan, Bangladesh, Bhutan, India, Maldives, Nepal, Pakistan, and Sri Lanka, have an estimated population of 1.79 billion (2019). The South Asia countries account for about 24% of the world's population and are home to an infinite array of peoples. More than one-fifth of the world's population lives in SAARC countries (Figure 3), which are the countries with the lowest per capita income in the world. More than 95% of the people in this region reside in India, Pakistan, and Bangladesh; thus, they consume the most energy. As a result, these countries have a significant impact on regional economic development. Renewable energy can alleviate the region's energy shortages and help the economy grow sustainably. 4 (Table 1)

Map of SAARC countries.
Demographics of SARRC countries
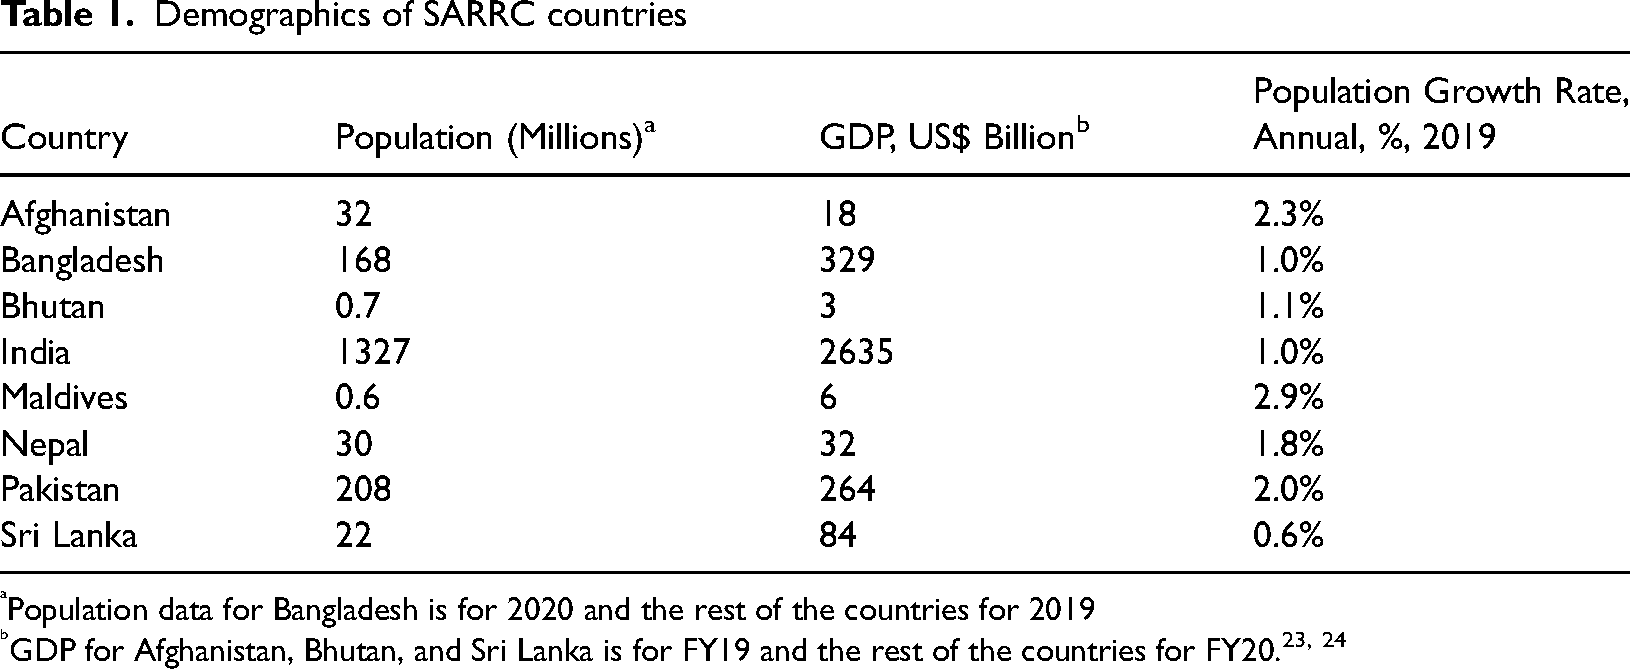
Population data for Bangladesh is for 2020 and the rest of the countries for 2019
Primary Energy Consumption in SAARC Region
The primary energy consumption pattern in the SAARC region (Figure 4) resembles the consumption pattern in India, owing to the highest population density. In the SAARC region, the immediate energy consumption, in 2017, was 959.3 mega tonne of oil equivalent (Mtoe) with a maximum consumption of the tune of 816.8 Mtoe noticing from India. Energy consumption is expected to reach 1673.3 Mtoe by 2030, and India is expected to account for the most growth, followed by Pakistan (147.3 Mtoe), Bangladesh (85.3), Nepal (21 Mtoe), Afghanistan (9.5 Mtoe), Bhutan (1.5 Mtoe), and the Maldives (1.2 Mtoe).
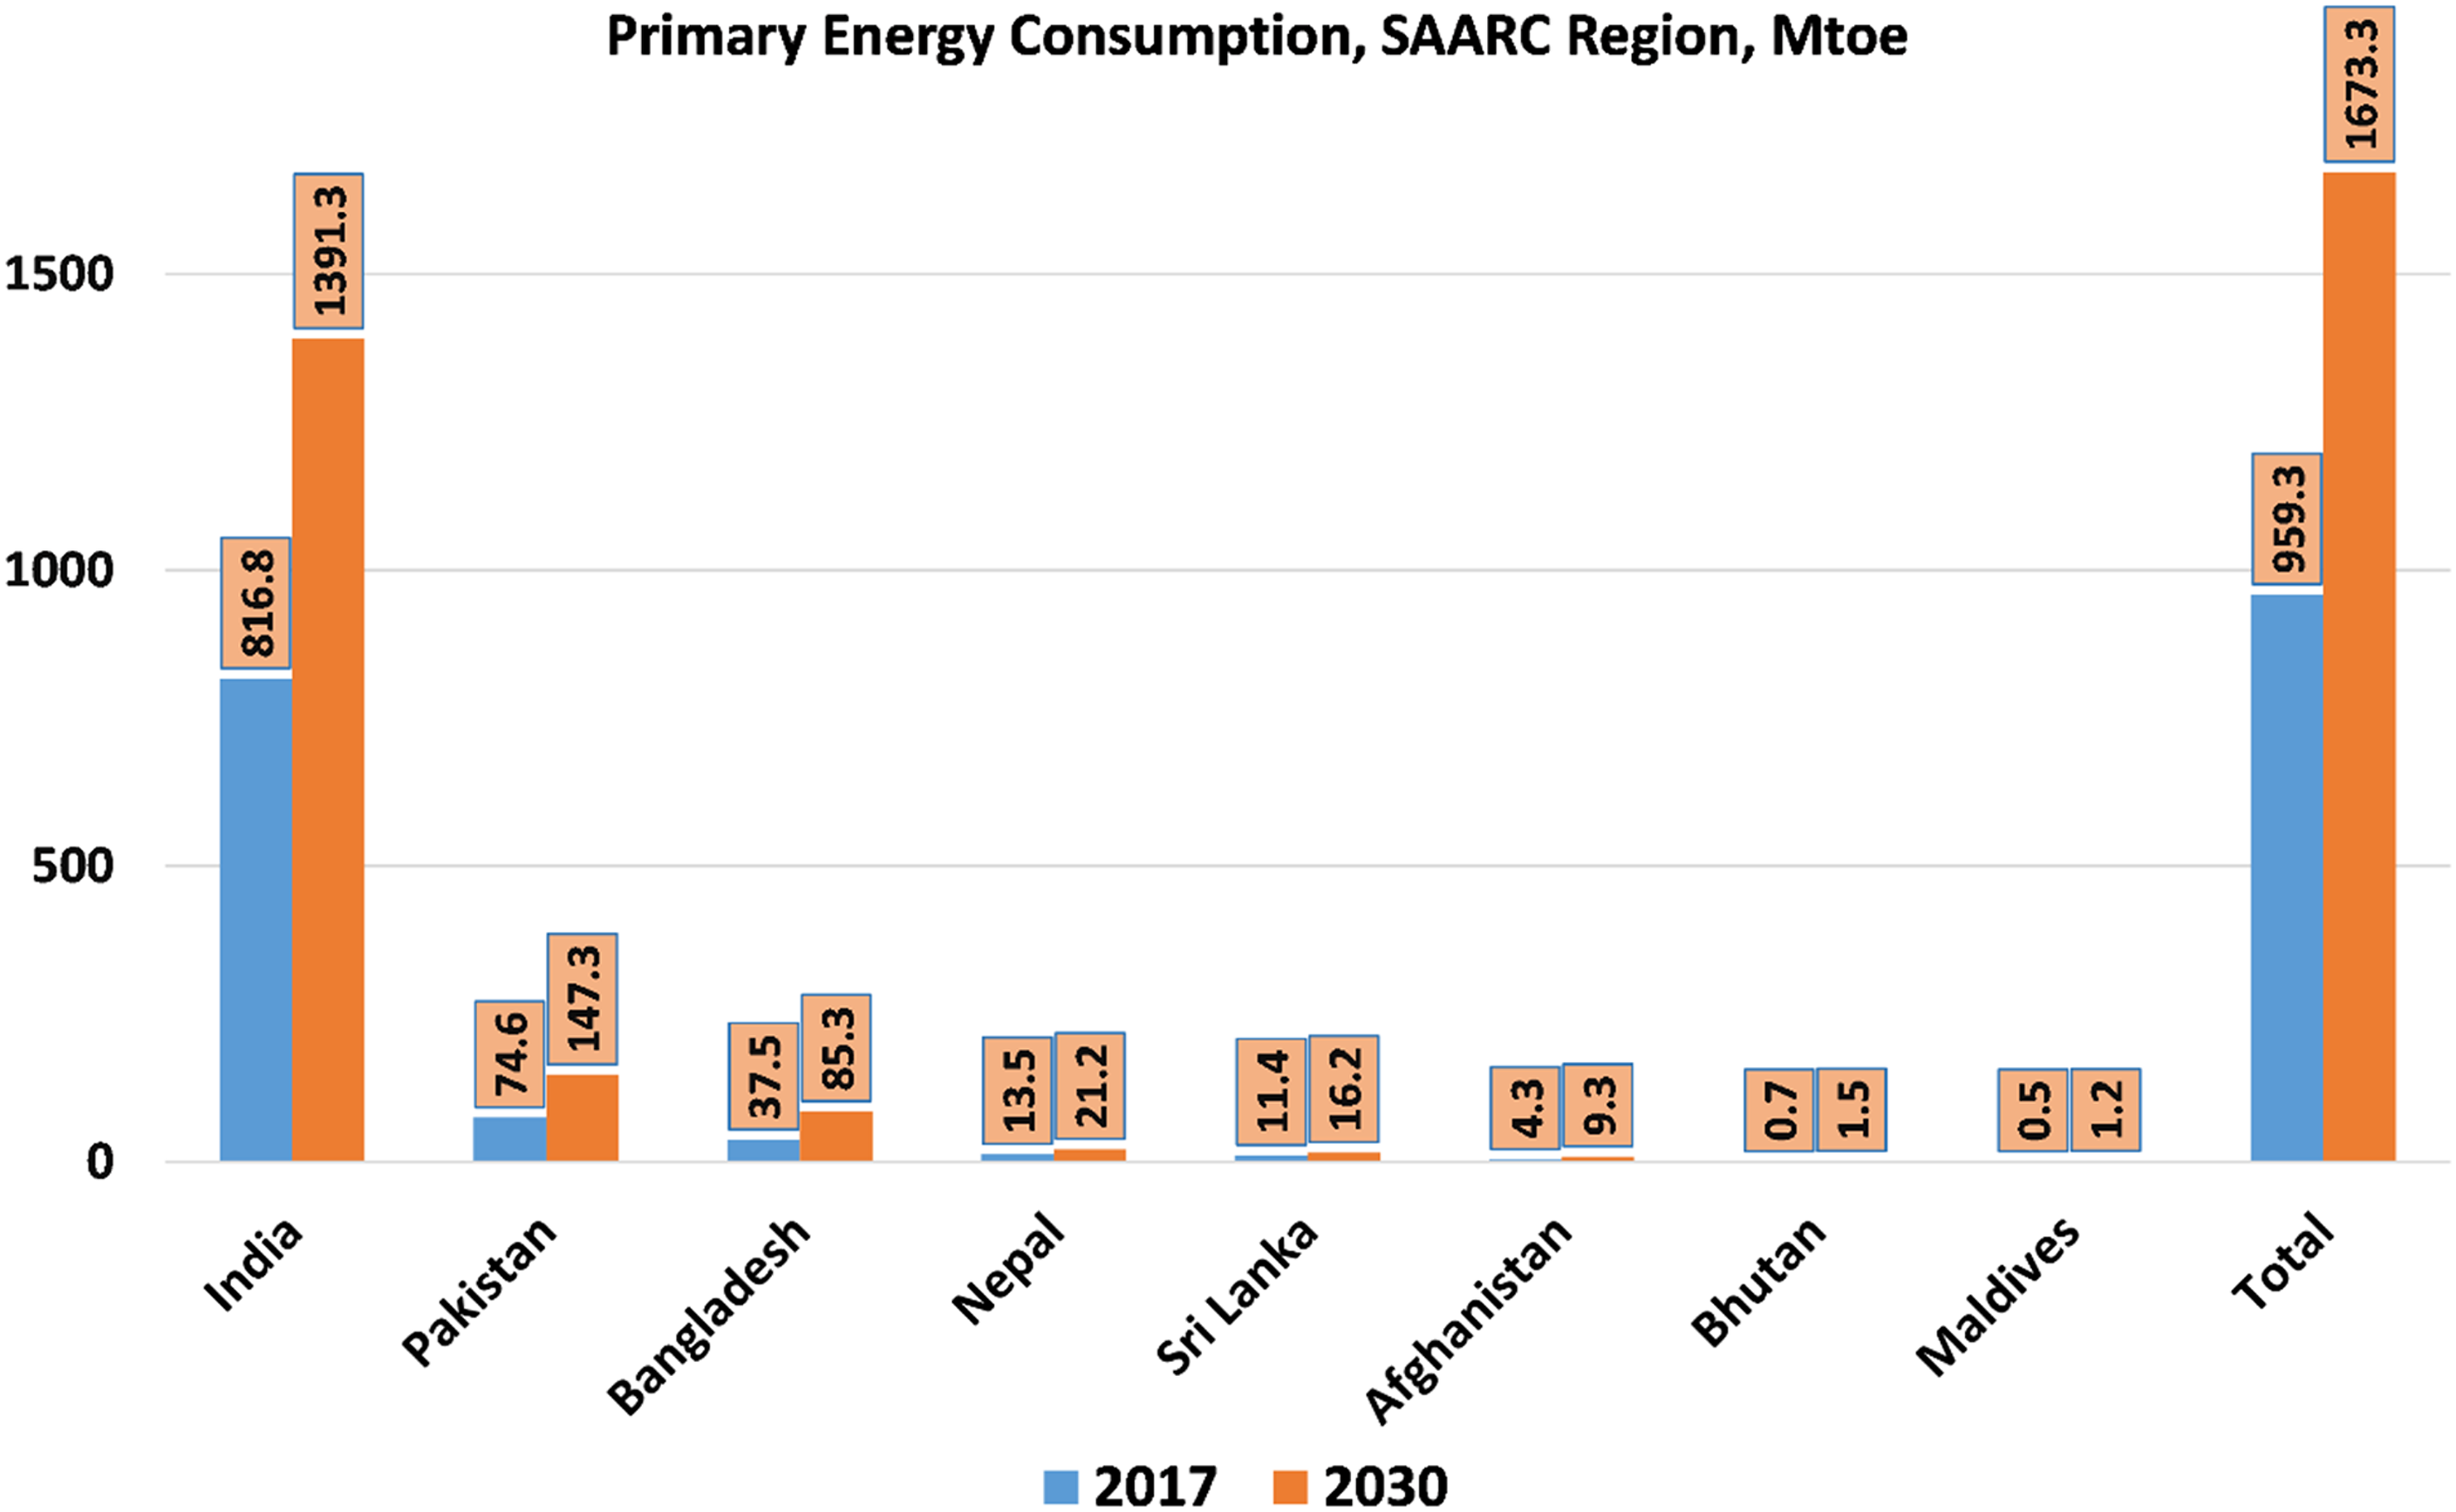
Primary energy consumption growth in SAARC countries. 25
Electricity Mix by Fuel in SAARC Region
As shown in Figure 5, of South Asian region, the structure of energy business varies from country to country; instead of utilizing energy resources, they all are similar. Fossil fuels dominate energy consumption in the energy mix; the contribution of renewable energy is not significant. SAARC countries have experienced a rise in energy demand in recent years due to a growing population and inadequate energy resources. The energy crisis affects power generation; therefore, the chronic lack of electricity supply is one of the primary causes for the miserable existence of communities without access to electricity. Therefore, establishing the necessary infrastructure and implementing distributed energy are essential to meet everyone's energy needs.
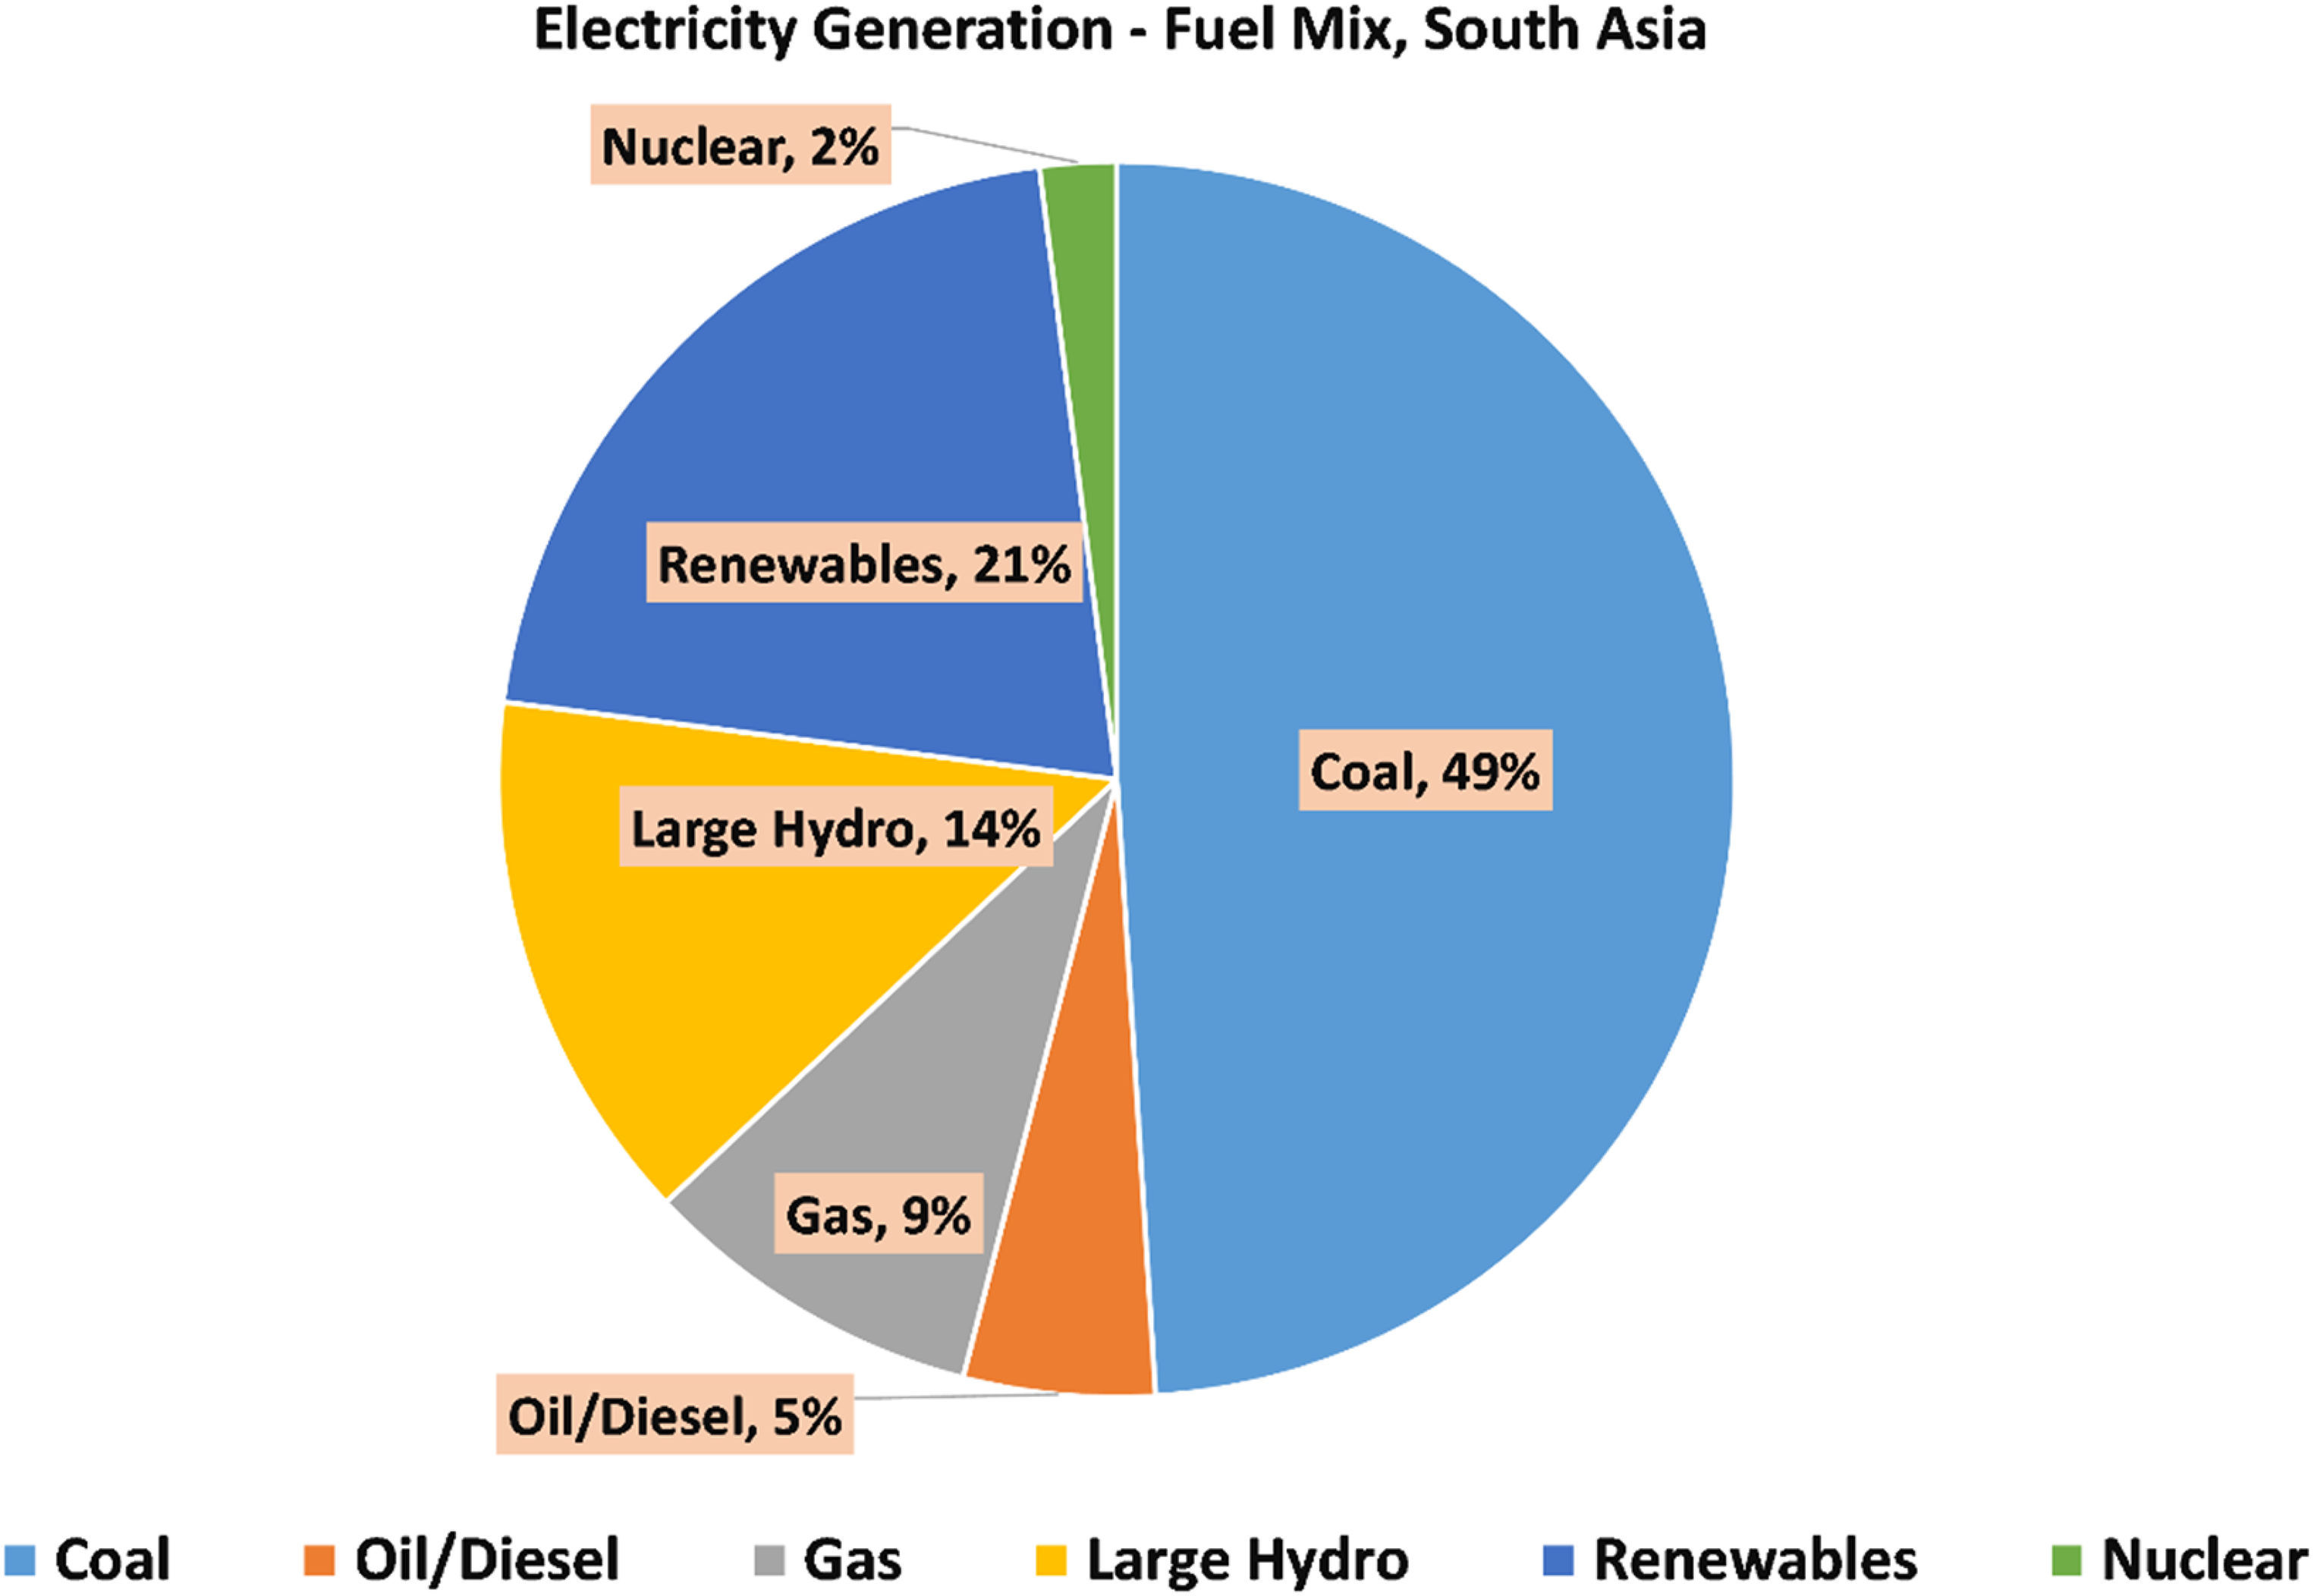
Electricity mix by fuel in South Asia. 24
In March 2021, “South Asia Regional Initiative for Energy Integration (SARI/EI)” published a report that South Asia generates 79% and 21% of electricity from non-renewable and renewable energy sources (except large hydro), respectively. 24 In Bhutan and Nepal, hydropower is the predominant source of electricity generation, accounting for more than 50% of total generation. Bangladesh is dominated by natural gas, while India is dominated by coal.
Electricity Access in SAARC Region
Electricity consumption is a key indicator of a country's economic progress, and as a result, the need for energy rises. With passing days, electricity demand in South Asia rises with the increase in population. However, access to electricity has significantly improved in this region during the last few years (Figure 6), but still, 152 million people have to survive with no access.26,27 Moreover, the countries in the SAARC region are developing countries with high population growth and economic advancement.28–31 The rising demand for electricity in SAARC countries necessitates the use of renewable energy sources like hydropower, wind, and solar in order to ensure long-term energy security and sustainable growth. Among the renewable energy sources available in SAARC countries, solar energy is the most appealing because of its vast potential, low cost, and ease of deployment.

Electrification in SAARC region. 24
Solar Power Potential of SAARC Region
SAARC region has the vast untapped potential of renewable energy sources like solar energy. If exploited, it will bring in social and economic development and improve the lives of millions of people. Figure 7 depicts the average daily solar irradiance of the SAARC countries. The country with the highest daily average horizontal solar irradiance of 5.593 KWh/m2 is Maldives, and the country with a minimum daily average flat solar potential of 3.940 KWh/m2 is Bhutan. That is better than many countries like the UK and Germany having daily average horizontal solar irradiance of 2.592 KWh/m2 and 2.978 KWh/m2 respectively, which have a sizeable contribution in the power generation from solar energy, showing the potential for solar photovoltaic installations in SAARC region.
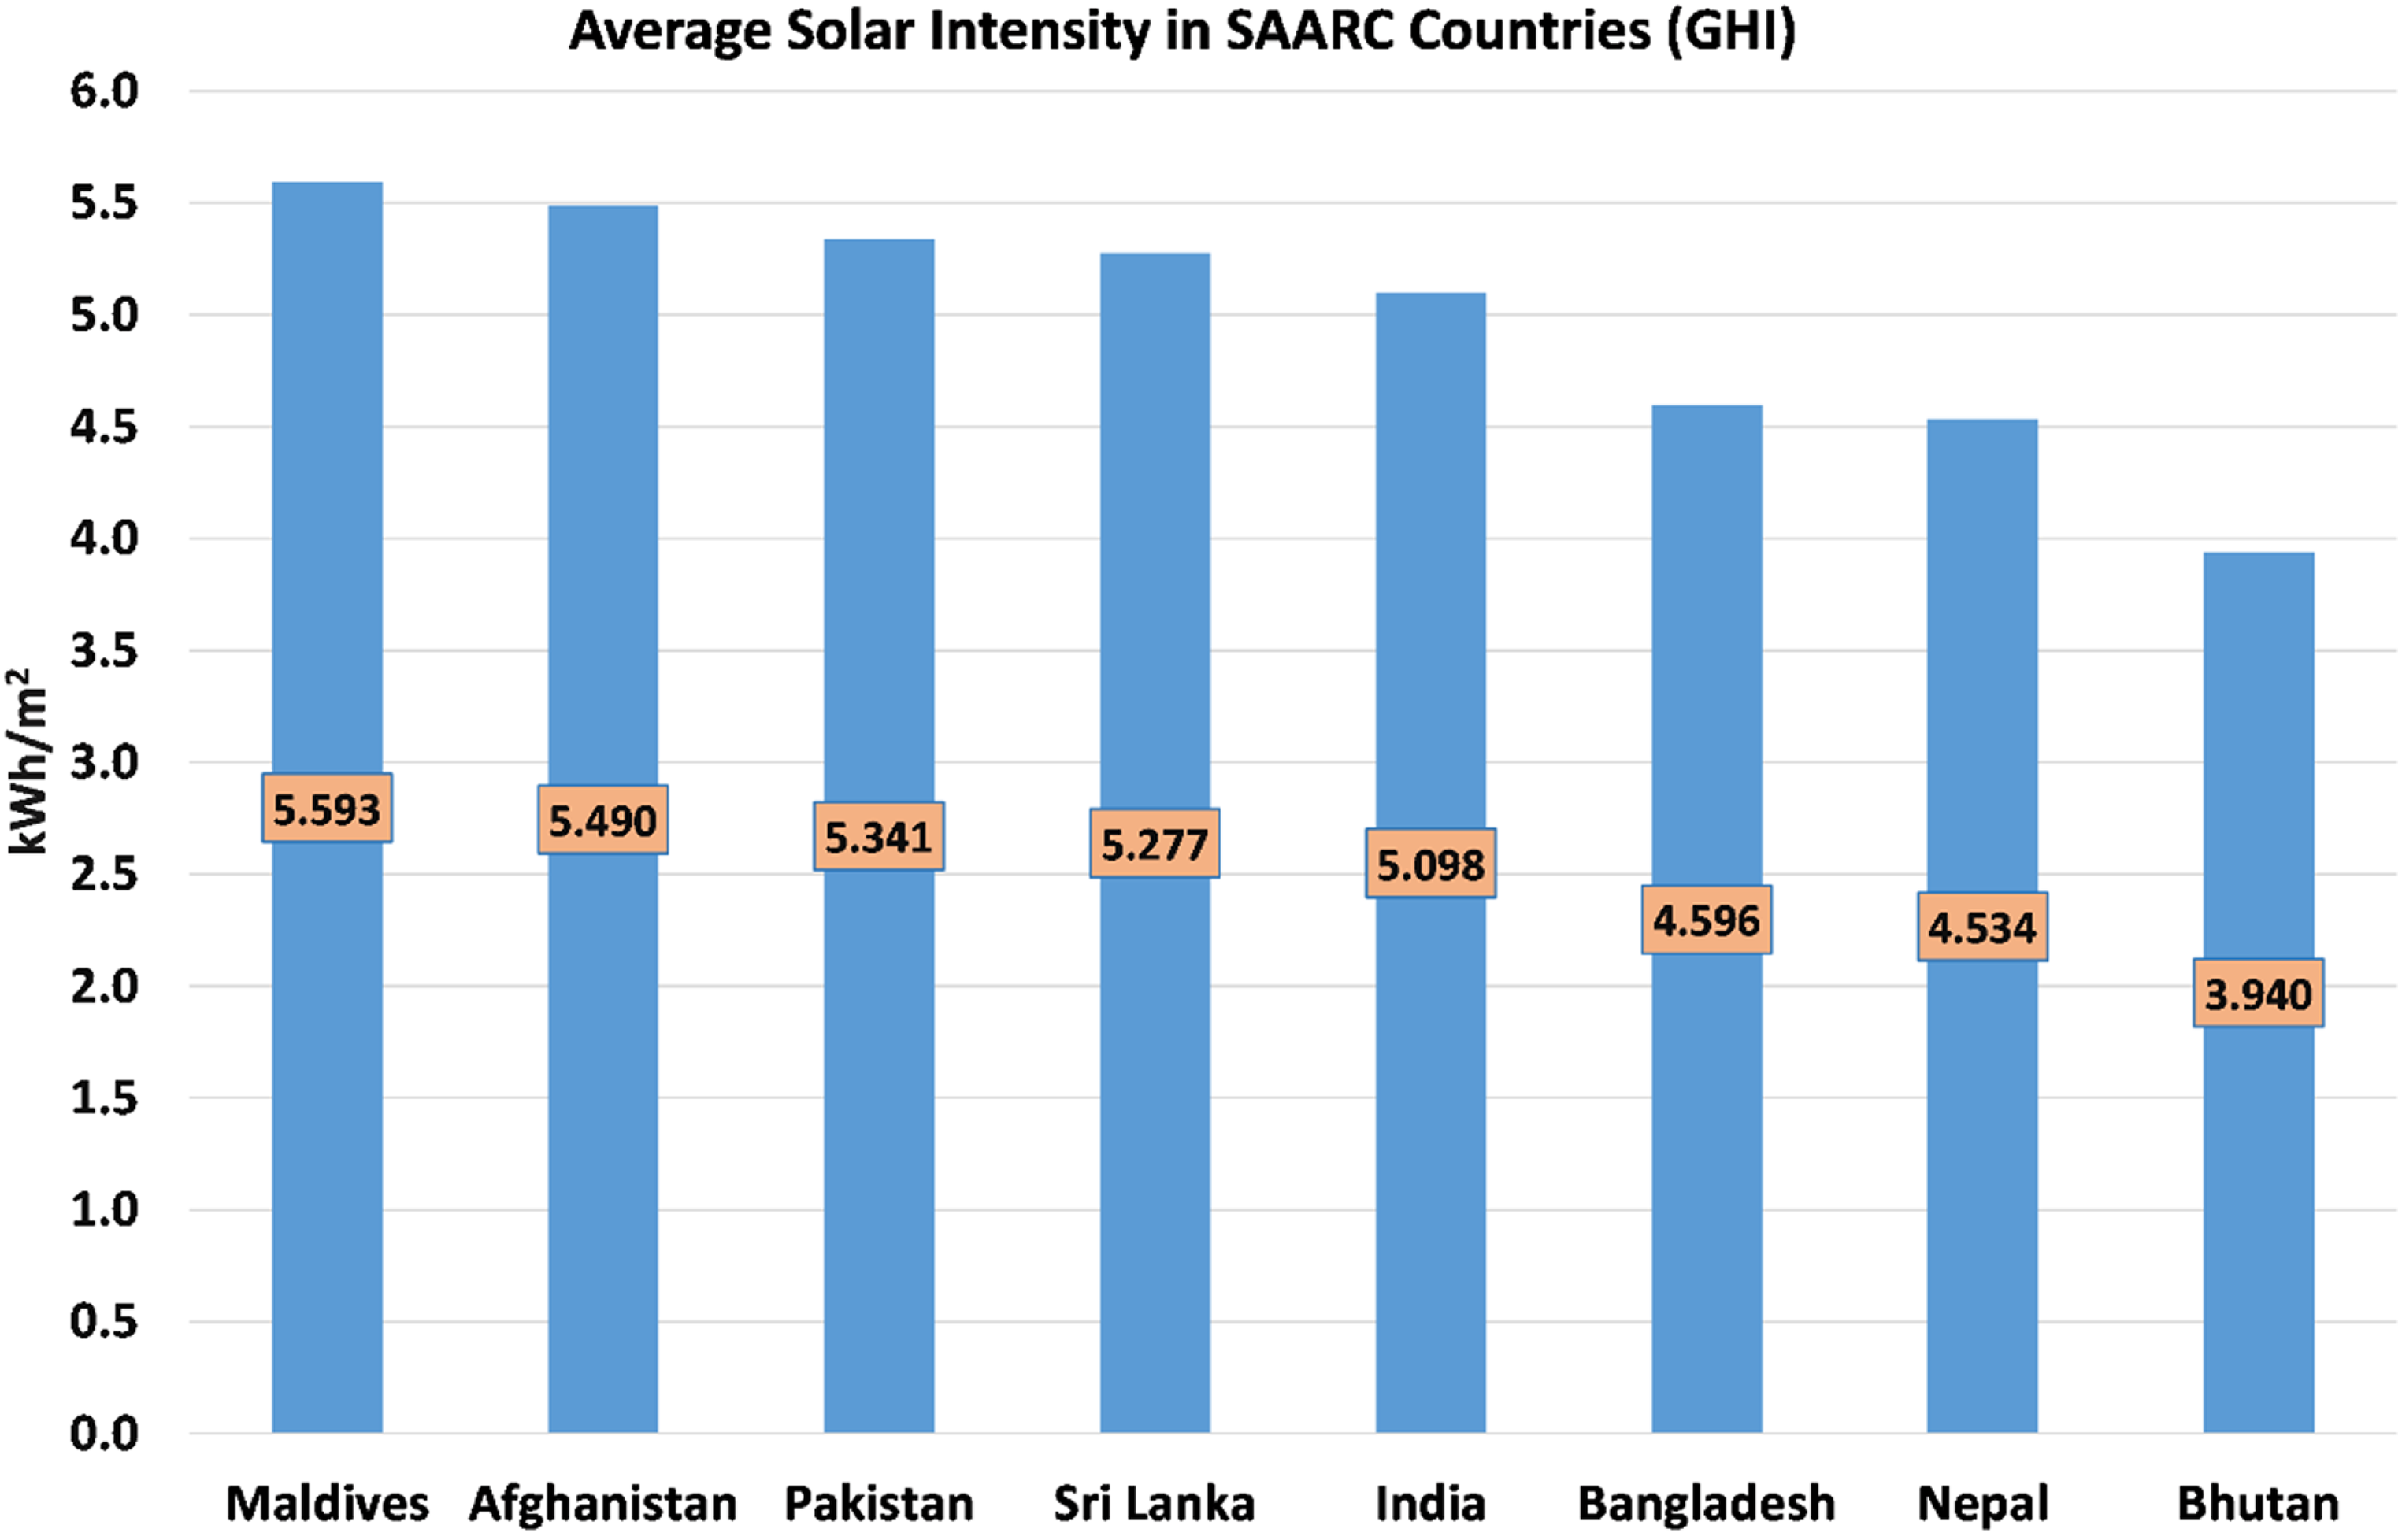
Average daily global horizontal irradiance (GHI) in SAARC countries. 32
Afghanistan
Being a landlocked country, Afghanistan's development and economic growth are severely affected due to various issues such as internal conflict, civil war, foreign involvement, and political uncertainty. 33 Here, energy security seems shocking, with the per-capita annual power consumption being only 5% of the global average. Moreover, the country's electricity generation capacity is relatively low and meets its consumption requirement by importing 80% of the electricity from its neighboring countries. 34
Primary energy consumption basket and growth in Afghanistan
Figure 8(a) illustrates the primary energy consumption from petroleum and oil lubricants (POL), coal, biomass, imported electricity, gas, and hydro was 49%, 29%, 9%, 7%, 4%, and 2%, respectively, for 2018. 33 Figure 8(b) demonstrates the growth in primary energy consumption by fuel from 4334 thousand tonne of oil equivalent (Ktoe) in 2018 to 9324 Ktoe in 2030 at a compound annual growth rate (CAGR) of 6.59. Energy consumption increased because of the rise in per capita income, increased electrification, and the growth rate of motor vehicles. 33
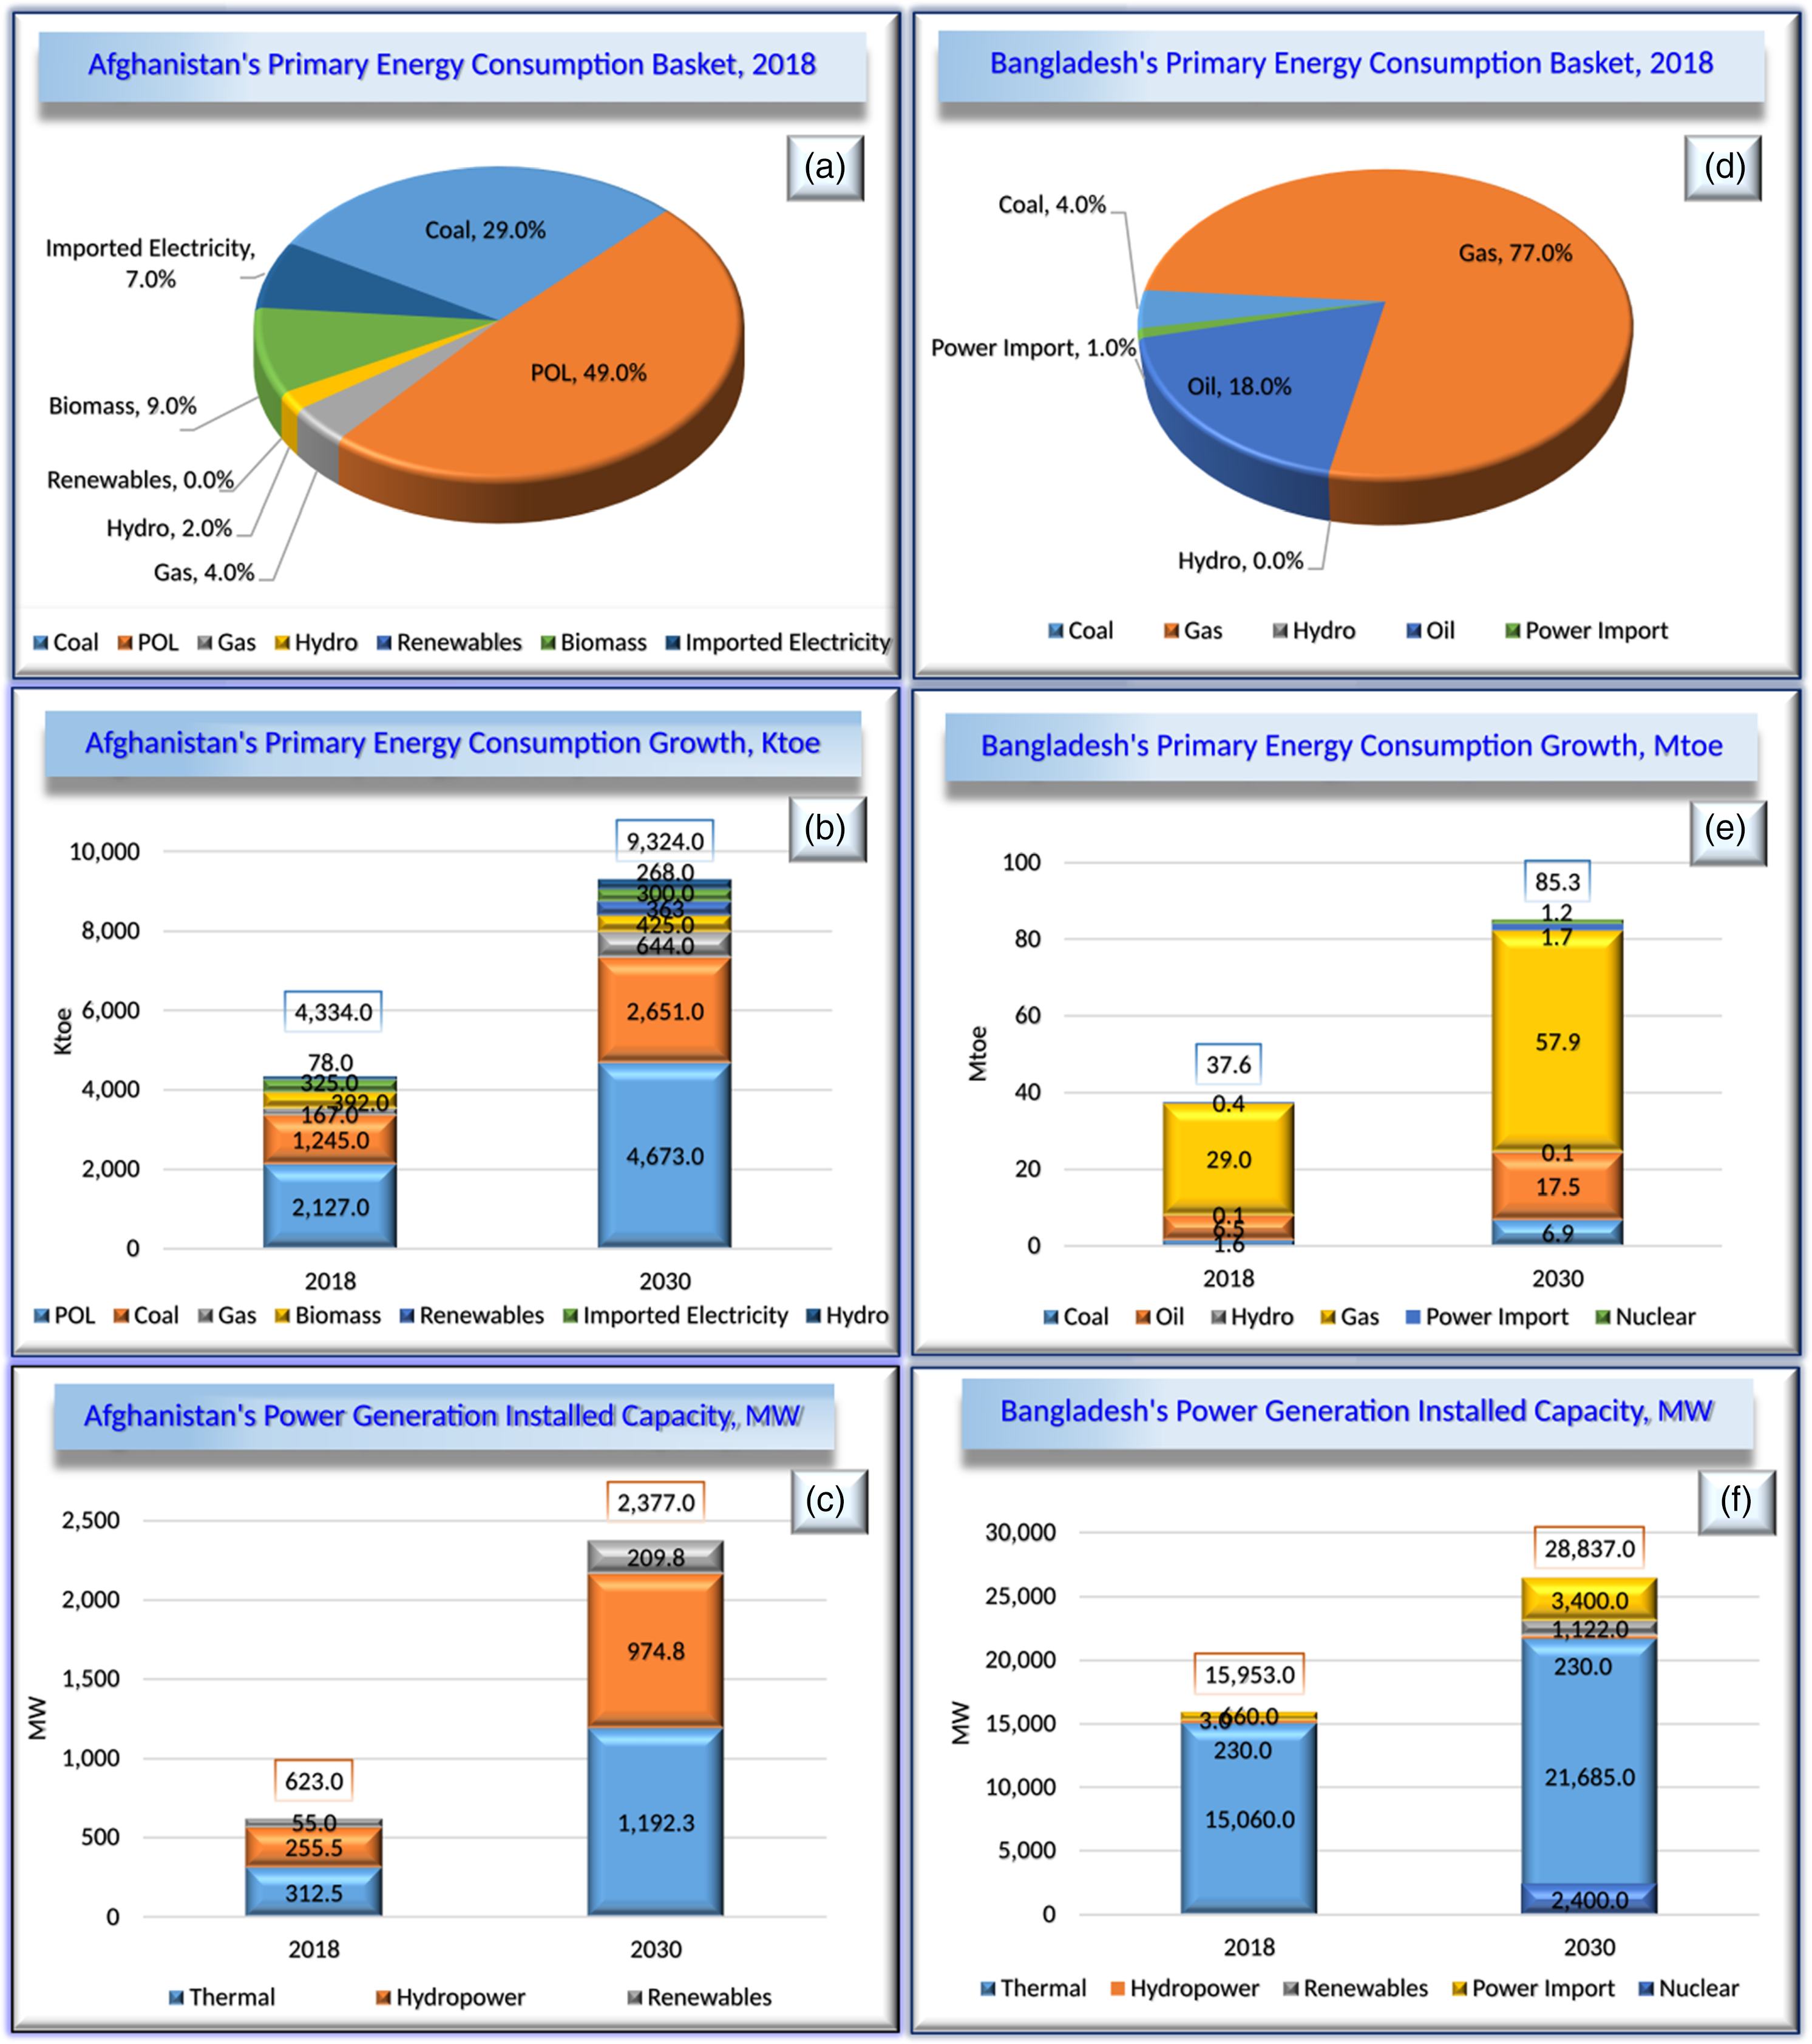
(a) Afghanistan's primary energy consumption basket 2018 33 ; (b) Afghanistan's primary energy consumption growth, Ktoe 33 ; (c) power generation installed capacity in Afghanistan 33 ; (d) Bangladesh's primary energy consumption basket 2018 35 ; (e) Bangladesh's primary energy consumption growth, Ktoe 35 ; (f) power generation installed capacity in Bangladesh. 35
Electricity generation installed capacity in Afghanistan
The country has installed 623 megawatts (MW) in 2018, 33 with renewables and non-renewables sources contributing approx. 10% and 90% respectively. The projected overall power generation installed capacity is expected to be around 2377 MW in 2030, with significant contribution coming from non-renewable energy sources, mainly hydropower, as illustrated by Figure 8(c).
Solar energy Status and renewable energy potential in Afghanistan
The country has not utilized its renewable energy to its potential due to a lack of development. Nevertheless, this area can produce around 318 GW of electricity through renewable energy sources with hydro, wind, solar, geothermal, and biomass contributing 23, 67, 222, 3–3.5, and 4 GW, respectively. 36 Figure 9 demonstrates Afghanistan's global horizontal irradiance (GHI) map. Here, solar energy has the most promising potential and receives 300 days of sunlight, with the average solar energy received about 6.5 kWh/m2 per day. 36
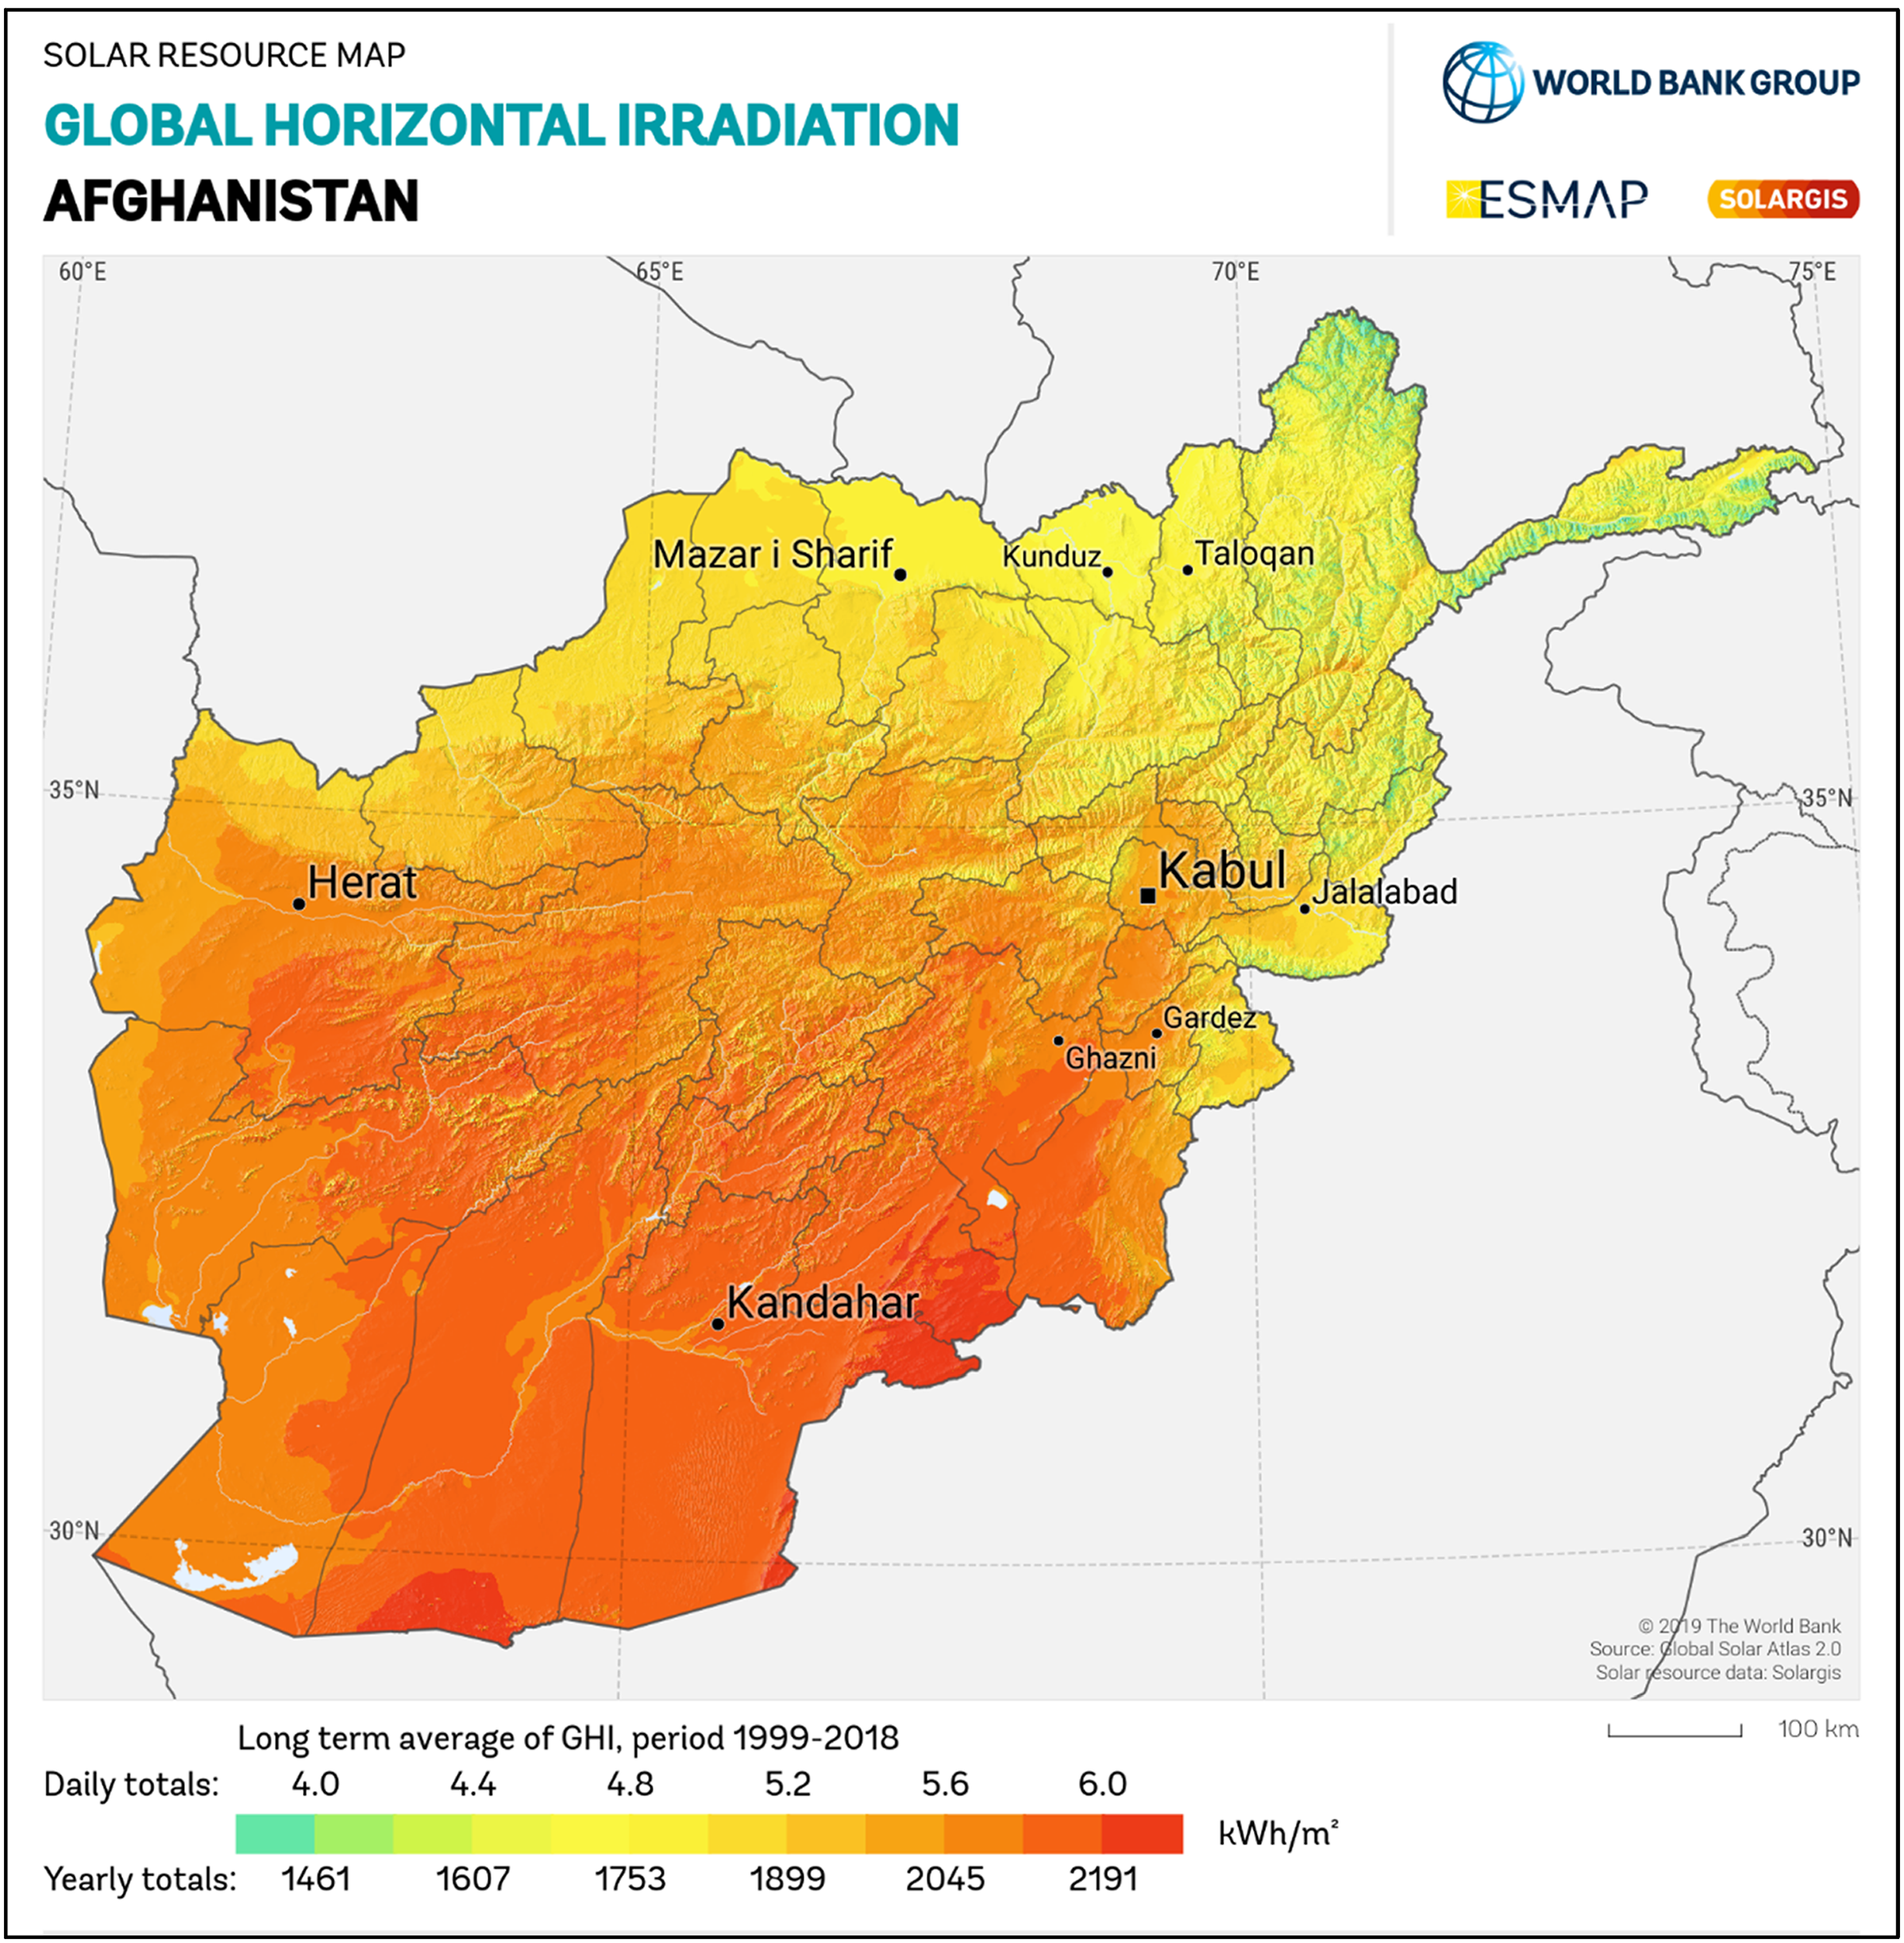
Afghanistan's global horizontal irradiance (GHI) map. 21
Bangladesh
Bangladesh is located in the delta of the Ganga and Brahmaputra rivers in the northeastern part of the Indian subcontinent. It is one of the most densely populated countries globally and faces colossal energy crises due to the increased supply-demand gap.4,37
Primary energy consumption basket and growth in Bangladesh
In 2018, Bangladesh's primary energy consumption requirement was meet mainly by fossil fuels, with gas, oil, and coal contributing 77%, 18%, and 4%, respectively. 35 Figure 8(d) demonstrates Bangladesh's primary energy consumption by fuel in 2018. Figure 8(e) demonstrated an anticipated growth in primary energy consumption from 37.6 Mtoe in 2018 to 85.3 Mtoe in 2030 at a CAGR of 7.06%. 35
Electricity generation installed capacity in Bangladesh
In 2018, Bangladesh's electricity generation installed capacity was 15,953 35 megawatt (MW), with thermal contributing almost 95%. The projected overall power generation installed capacity is expected to be around 28,837 38 MW in 2030, with a significant capacity contribution from thermal power plants. Figure 8(f) shows the electricity generation installed capacity growth from 2018 to 2030. 35
Solar energy Status and renewable energy potential in Bangladesh
Bangladesh is located between 20:30 and 26.38 degrees north latitude and between 88.04 and 92.44 degrees east longitude. Therefore, it is an ideal place to use solar energy. 38 Figure 10 shows the average daily GHI in the range of 4.3–4.9 kWh/m2, which is favorable for solar PV installations.

Bangladesh's global horizontal irradiance (GHI) map. 21
Bhutan
The kingdom of Bhutan is a landlocked country and sharing its borders with India and China. 39 In 2019, its annual GDP growth rate was 5.5 because of a solid investment, and it is one of the fastest-growing economies globally. 40 Moreover, it is the only Asian country with surplus energy exported to India, the primary source of revenue generation for the country's economic development. 40
Primary energy consumption basket and growth in Bhutan
Biomass in the form of fuelwood, biogas, and briquettes is the primary energy source in this region, followed by electricity generation from hydropower. Fuel use in Bhutan in 2017 is depicted in Figure 11(a). Bhutan relies heavily on hydroelectric power plants to meet 60% of its basic energy needs. Coal and POL from India make up the final 40% of the total. Bhutan's oil and coal reserves are insufficient. 35 Figure 11(b) shows Bhutan's primary energy consumption anticipated growth at a CAGR of 4% from 726 Ktoe in 2017 to 1150 Ktoe in 2030. The rise in immediate energy consumption is mainly due to increased electricity generation from hydro projects. 35
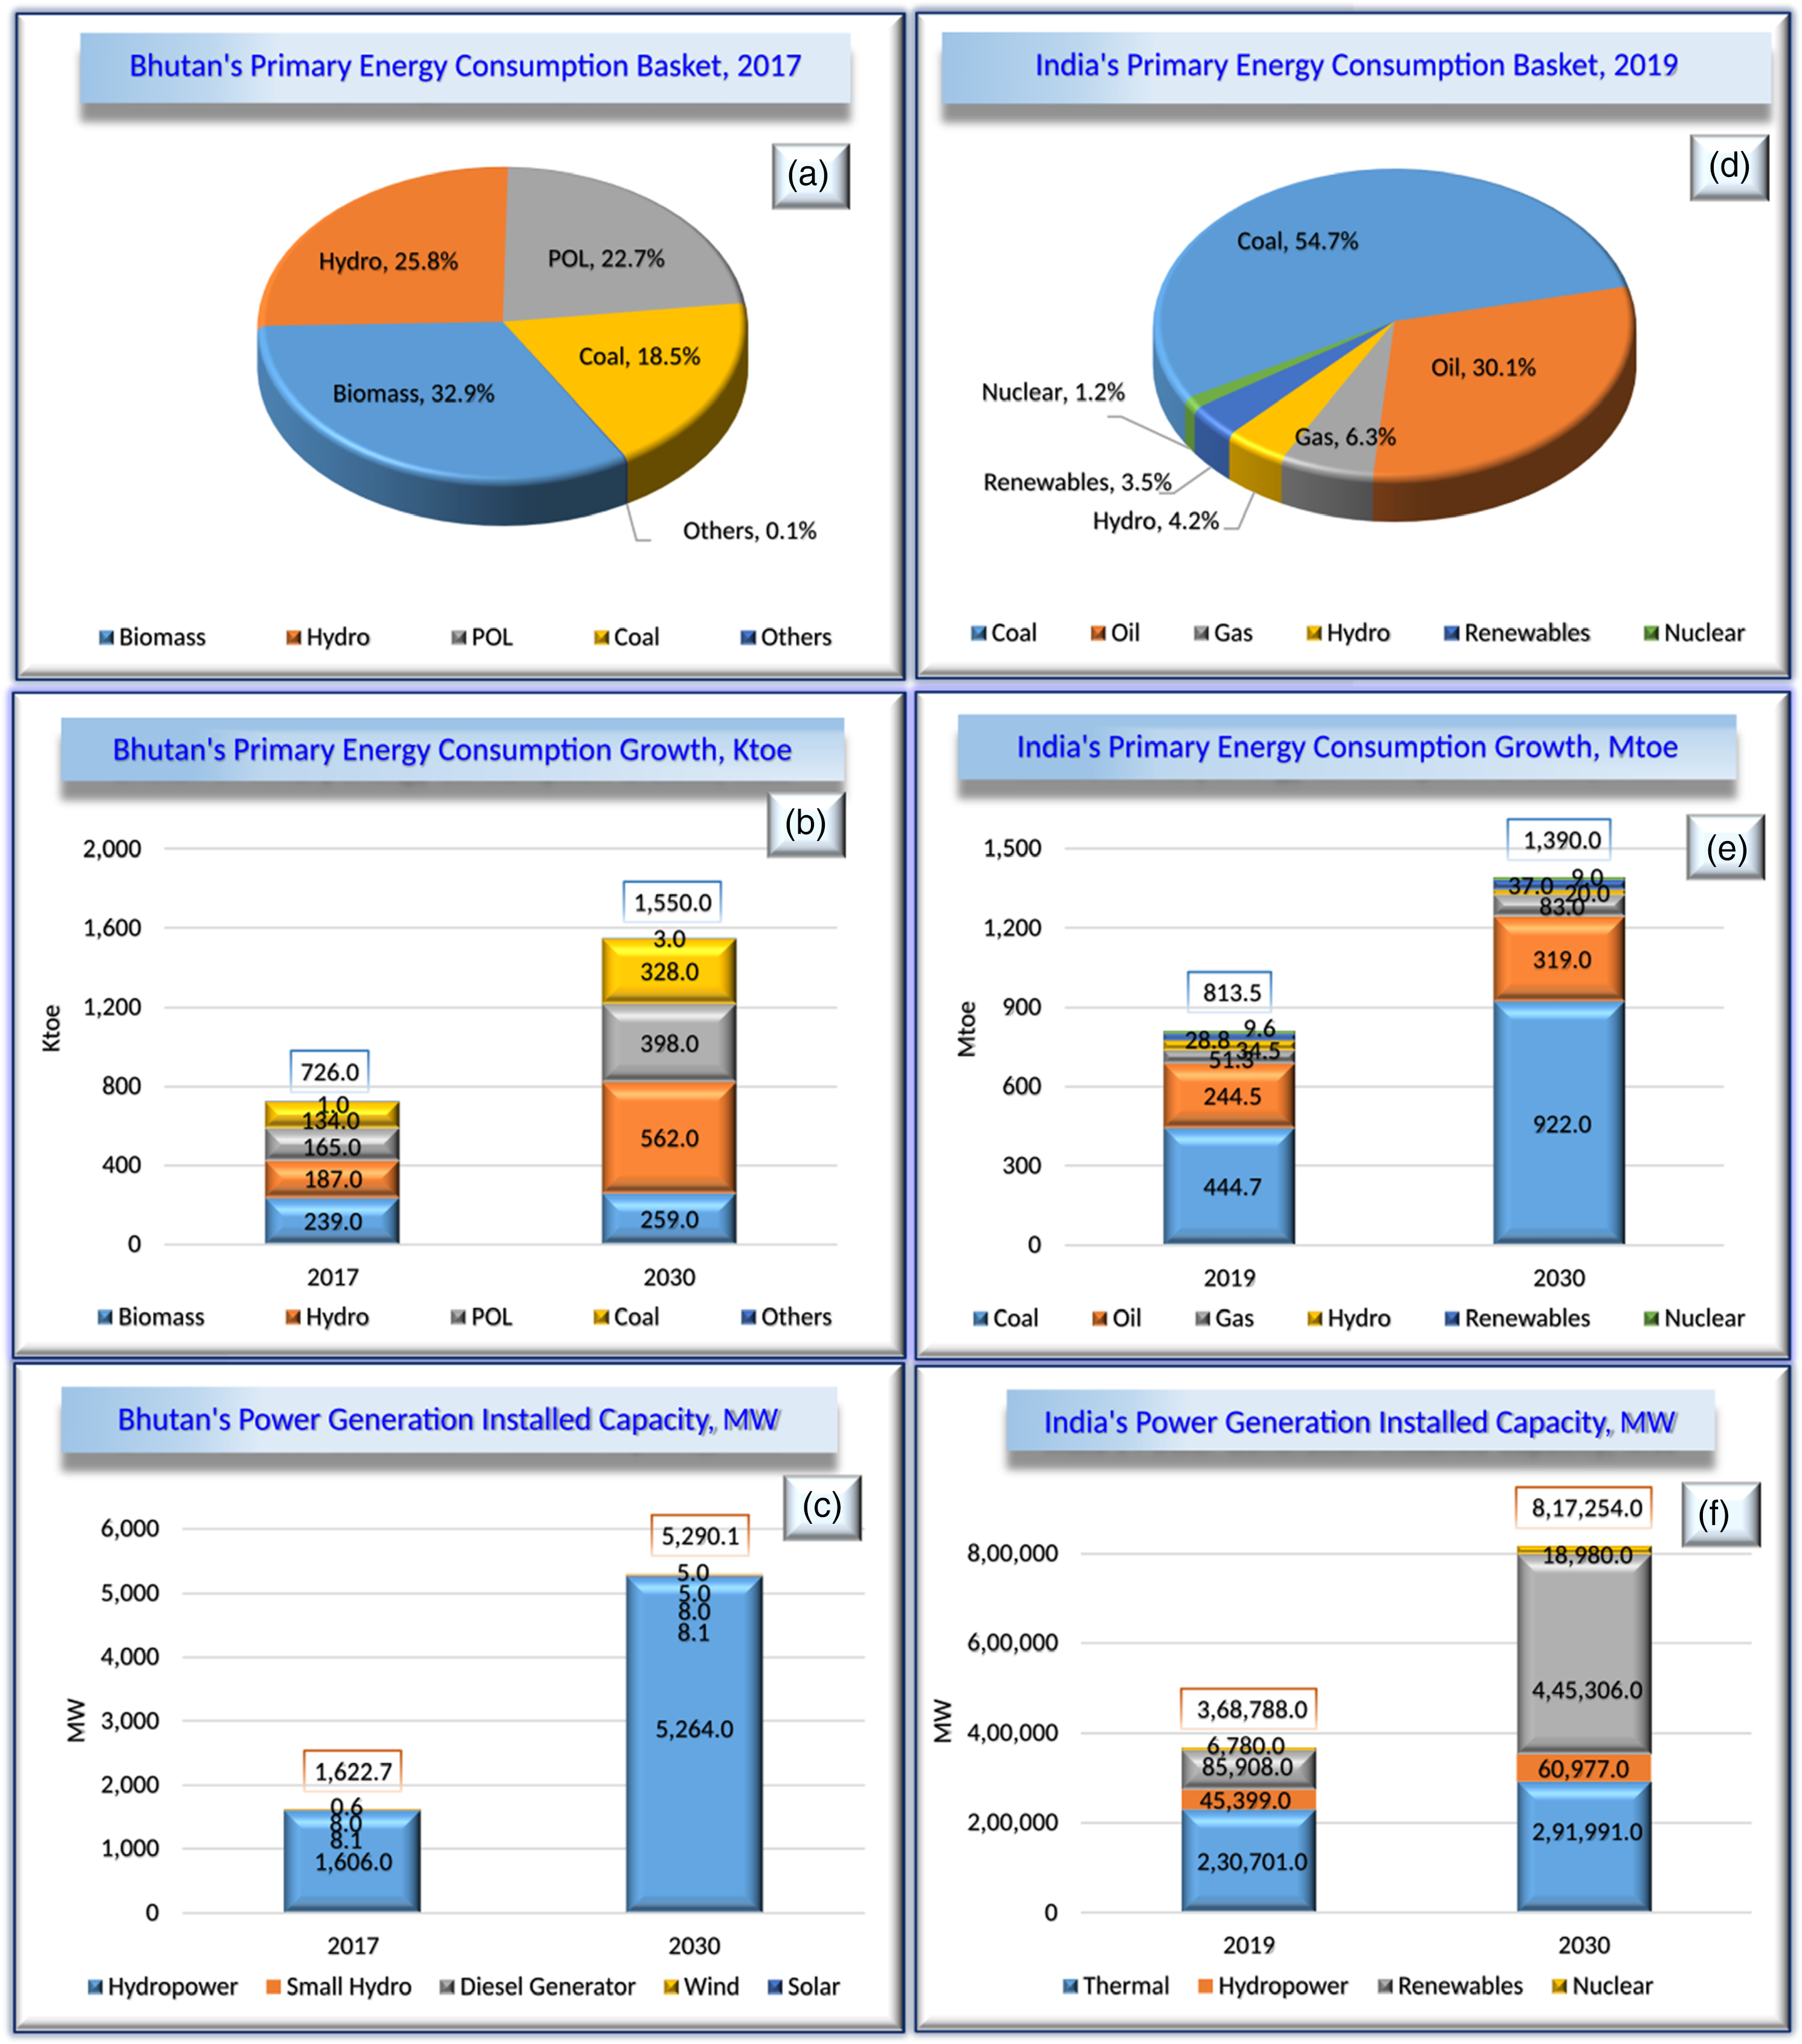
(a) Bhutan's primary energy consumption basket 2017 35 ; (b) Bhutan's primary energy consumption growth, Ktoe 35 ; (c) power generation installed capacity in Bhutan35,39,40; (d) India's primary energy consumption basket 2019 13 ; (e) India's primary energy consumption growth, Mtoe13,35; (f) power generation installed capacity in India.41,42
Electricity generation installed capacity in Bhutan
Figure 11(c) shows power generation installed capacity in Bhutan in 2017. The electricity generation installed capacity was 1623 megawatt (MW), with 99% of the electricity generates from large hydropower projects. Renewables contribute approximately 9 MW, which is just 1% of the total installed capacity. The projected overall power generation installed capacity is expected to be around 5290 MW in 2030, with significant ability and the tune of 3658 MW generated from important hydropower projects. The country's alternative energy policy document plans to diversify the primary energy consumption basket by boosting investment in renewable energy sources. By 2025, the plan is to install 20 MW of renewables-based power generation plants with solar and wind, each contributing 5 MW electricity.35,39,40
Solar energy Status and renewable energy potential in Bhutan
Bhutan predominantly depends on hydropower projects for its electricity generation requirement. Here the hydropower plants merely rely on run-of-river due to which power output fluctuates seasonally. Renewable energy sources such as solar PV, biomass, small hydropower, and wind could contribute to the diversification of the energy basket and ultimately lead to a sustainable energy system in the long run in order to achieve economic efficiency and energy security. Renewable Energy Management Master Plan (2016) estimates that Bhutan can generate 12 GW of solar and wind energy, with a total capacity of 760 MW. The current renewable energy installed capacity is 9 MW, and it is planned to increase it to 20 MW by 2025, with solar PV, wind, biomass, and others each contributing 5 MW. Implementation of renewable energy helps in complementing hydropower during supply disruption, reduces dependence on biomass and petroleum products for cooking and heating purposes.35,39,40 Figure 12 demonstrates Bhutan's global horizontal irradiance (GHI) map; the country receives a sufficient amount of solar radiation with a worldwide horizontal irradiance (GHI) in the range of 1600–2700 kWh/m2/year, 39 showing its potential for solar photovoltaic installations.
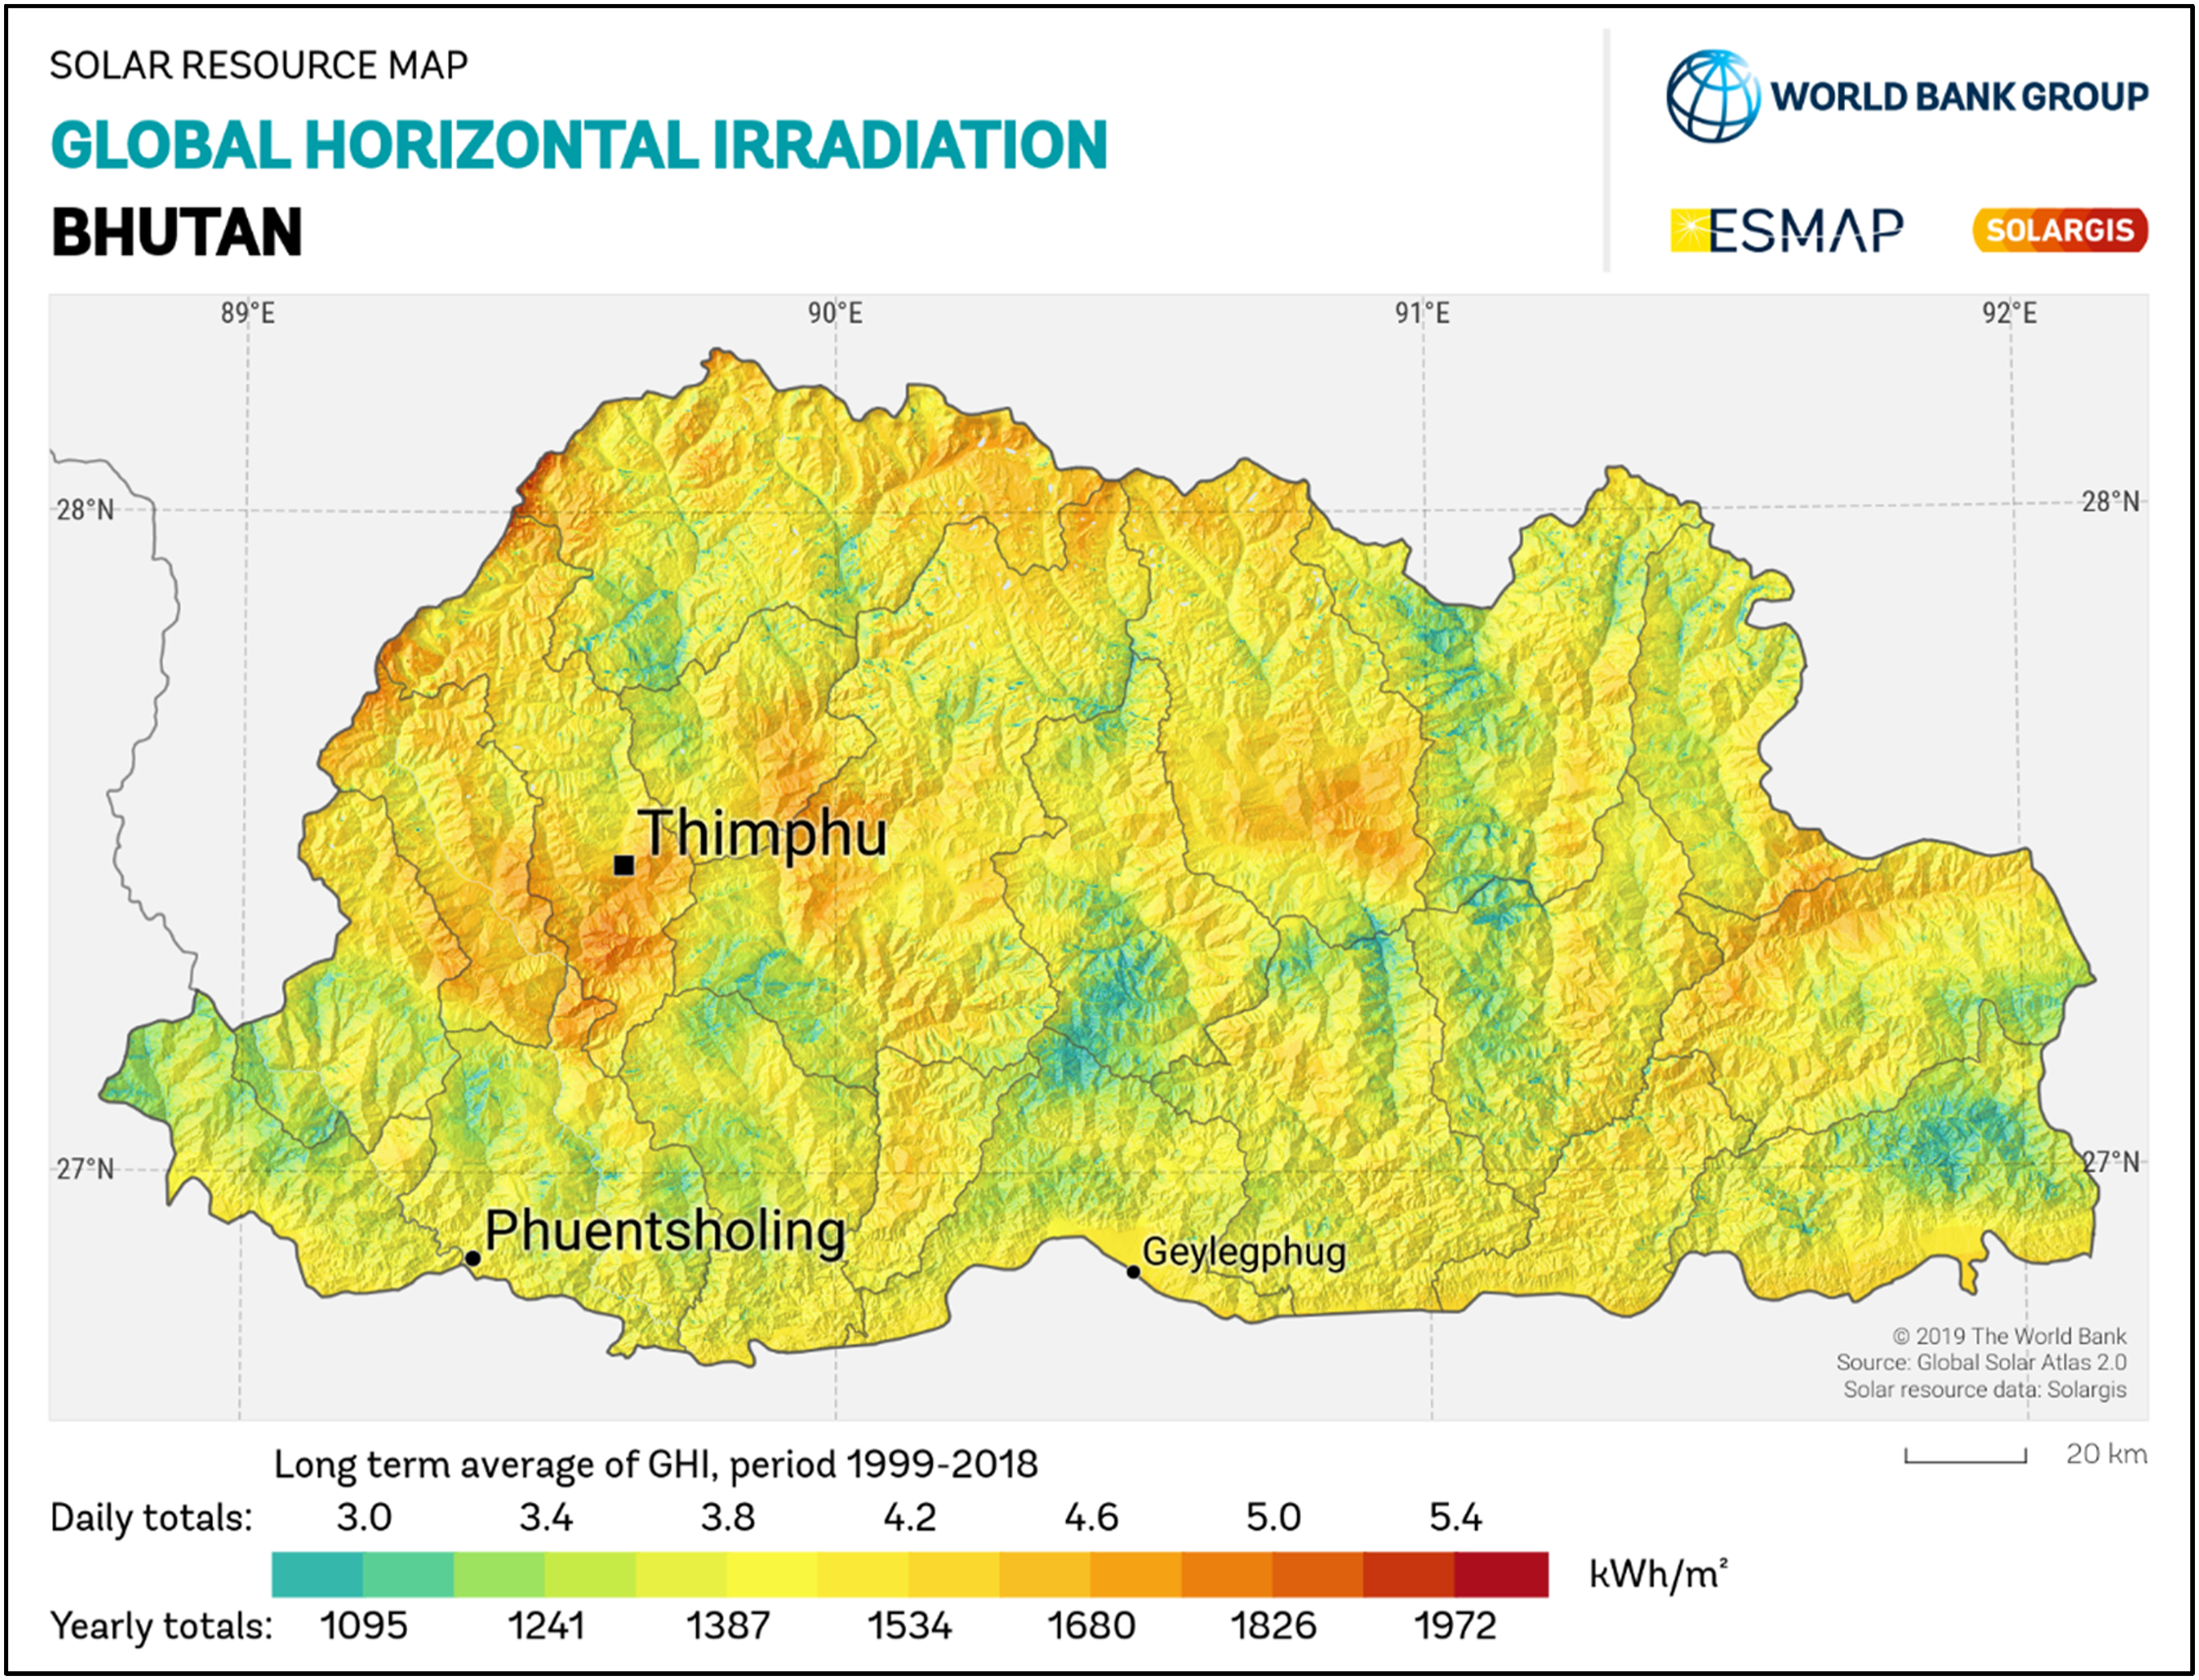
Bhutan's global horizontal irradiance (GHI) map. 21
India
India has 1.37 billion inhabitants, which accounts for about 18% of the total population of the planet, making it the second most populous country in the world after China.38,39 Projections indicate that by 2027, India will have 1.47 billion people, making it the most populous country in the world, surpassing China in that regard. Because of this, the demand for power in India has skyrocketed in recent years and is only going to continue to climb rapidly.43,44 In this kind of scenario, the power sector becomes the single most important factor in determining the socioeconomic progress and welfare of the society. The expansion of the country's power industry is necessary to ensure the economy of the country continues to expand throughout time. The power industry in India is in the midst of a substantial transformation, with an increased emphasis being placed on the generation of electricity from renewable energy sources. India has set a daunting task to increase the renewable energy capacity to 450 GW by 2030 with a significant contribution from wind and renewable solar sources.45–47
Primary energy consumption basket and growth in India
From Figure 11(d), India shows its primary energy consumption by fuel in 2019. The Figure 11(d) demonstrates the immediate energy consumption from various renewable energy sources such as coal, oil, gas, hydro, renewables, and nuclear stood at 54.7%, 30.1%, 6.3%, 4.2%, 3.5%, 1.2%, respectively. 13
The country's primary energy consumption grew from 813 Mtoe in 2019 to 1390 Mtoe in 2030 to a CAGR of 5, as shown in Figure 11(e), the third biggest after China and the USA. According to The British Petroleum Company (Bp Plc) energy outlook, during the 2018–2050 cycle, the primary energy consumption will grow by 35% at an average growth rate of 2.5–3% yearly.13,35
Electricity generation installed capacity in India
Figure 11(f) demonstrates India's power generation installed capacity at the end of Dec 2019. India's electricity grid has a power generation installed capacity of 369 GW, with renewables and non-renewables sources contributing 23% and 77%, respectively. 41 The projected overall power generation installed capacity is expected to be around 817 GW in 2029–30, with renewable energy sources like solar and wind likely to have an installed capacity of more than 50% of the projected installed capacity. The expected power generation capacity of solar and wind will likely be 280 GW and 140 GW, respectively. 42 The shift in power generation towards renewable energy sources is expected due to affordable solar panels and battery energy storage systems.
Solar energy Status and renewable energy potential in India
Solar energy is the most secure of all power as it is available in abundant quantity, and even a tiny fraction of solar energy can meet the country's demand. India is privileged to have vast solar energy potential and receives 5000 trillion kWh per year of solar radiation. Being a tropical country, India receives solar radiation with an average intensity of 200 MW/Km2 with 250–300 sunny days in a year. Figure 13 shows India's global horizontal irradiance (GHI) map. 21 The average solar radiation incident over India varies from 4–7 kWh/day, which is equivalent to about 1500–2000 peak (rated) capacity operating hours in a year.47,48 As per the National Institute of Solar Energy, it is estimated that the solar energy potential in power generation to be around 750 GW based on the availability of the land and the solar radiation. 49
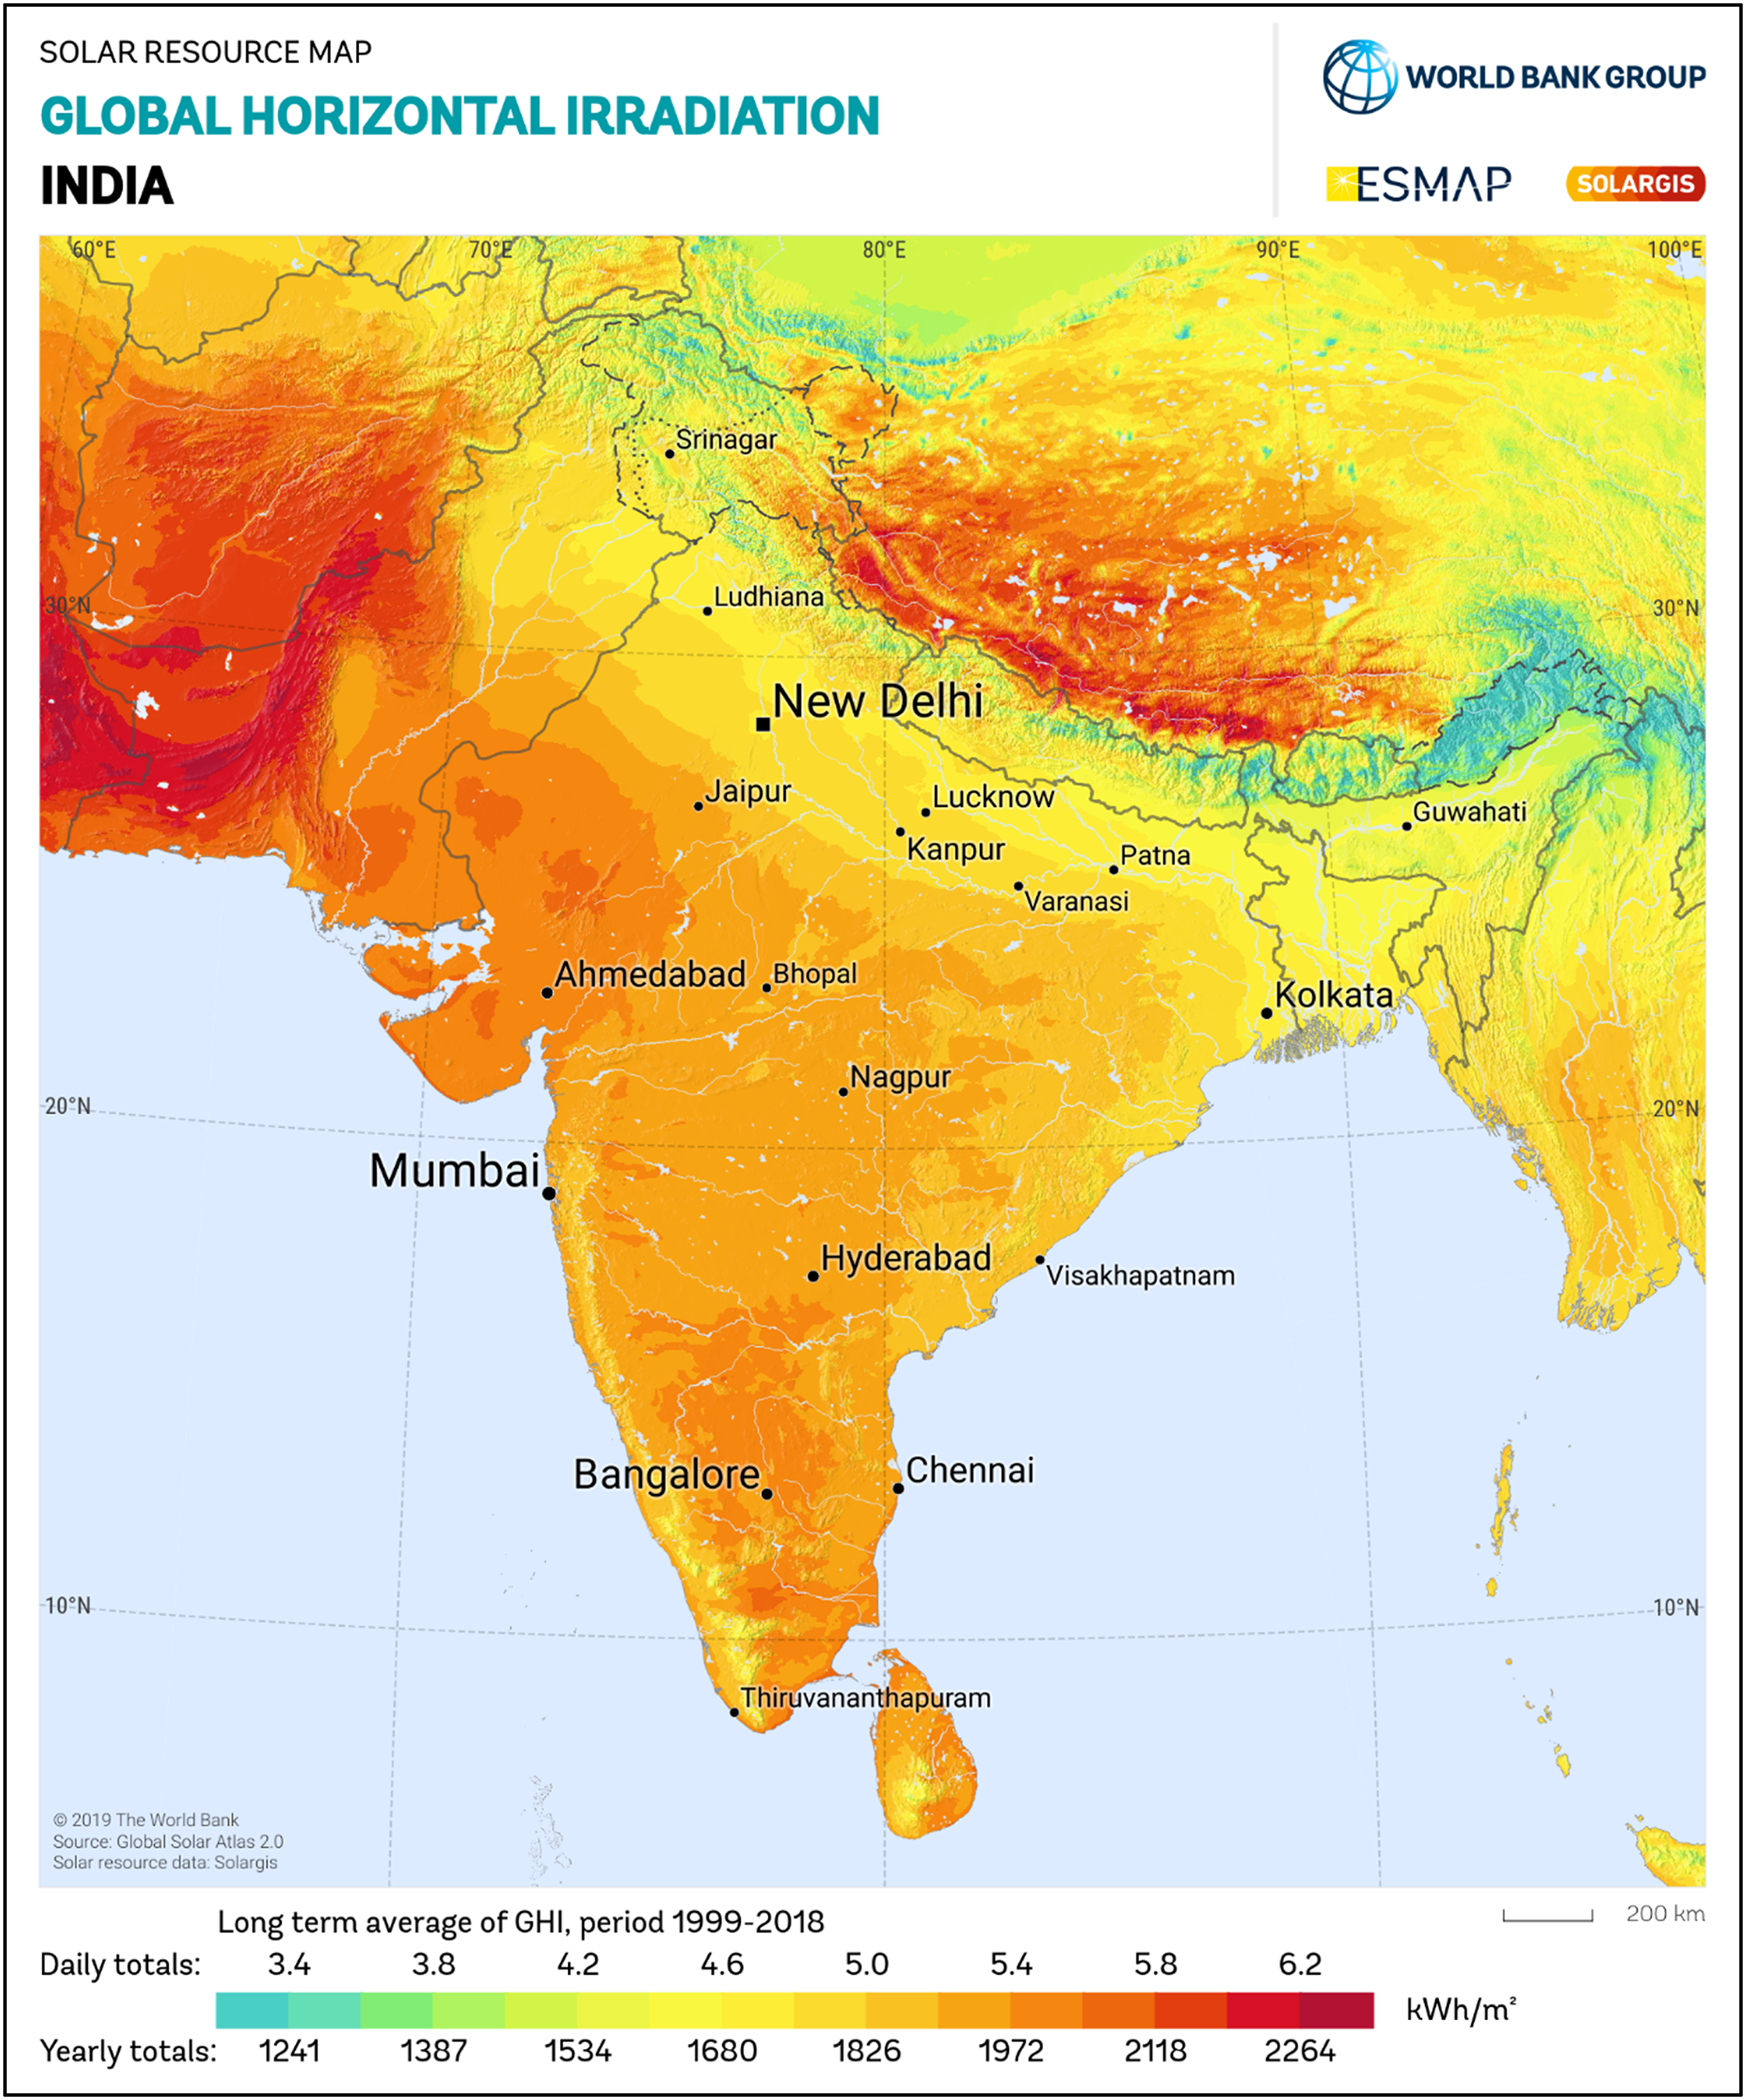
India's global horizontal irradiance (GHI) map. 21
Maldives
Maldives has been a Small Island Developing State (SIDS) faces many unique challenges. Due to the lack of fossil fuel, its energy demand is met through imports. To provide reliable and sustainable energy services for everyone at the lowest cost, the Maldives is trying to recognize the existing energy balance by introducing renewable energy (mainly solar energy). The goal is to reduce dependence on imported fuel and reduce the current account deficit (CAD).
Primary energy consumption basket and growth in the Maldives
Figure 14(a) exhibits Maldives's primary energy consumption by fuel in 2017. Most of the part is covered by diesel, i.e., 85.4% and the remaining portion by petrol, cooking gas, renewables having the contribution of 11.4%, 3.0%, 0.2% respectively. The Figure 14(a) demonstrates that renewable sources have a minor contribution. 35 Figure 14(b) shows Maldives's primary energy consumption anticipated growth from 542 Ktoe in 2017 to 1117 Ktoe in 2030. 35

(a) Maldives's primary energy consumption basket 2017 35 ; (b) Maldives's primary energy consumption growth, Ktoe 35 ; (c) power generation installed capacity in Maldives35,50; (d) Nepal's primary energy consumption basket 2018 35 ; (e) Nepal's primary energy consumption growth, Ktoe 35 ; (f) power generation installed capacity in Nepal.51–53
Electricity generation installed capacity in the Maldives
In the Maldives, the installed capacity was 546.5 megawatt (MW), with renewables and non-renewables sources contributing approx. 3% and 97% respectively. Therefore, the projected overall power generation installed capacity will be around 1075 MW in 2029–30. A significant contribution is generated from non-renewable energy sources like diesel, as shown in Figure 14(c).35,50
Solar energy Status and renewable energy potential in the Maldives
Although the Maldives” renewable energy resources are considerable for the generation of power, the country's regulatory environment is not up to par, which limits the deployment potential of these resources. The production of energy, the expansion of energy storage, and a reduction in dependence on imported petroleum products are all mandatory in order to increase the energy security and diversification of energy resources (such as solar, wind, ocean, etc.).54–56 The government of Maldives published the strategic action plan report (2019–23), which states that the share of renewable energy in the country's primary energy basket is targeted to increase from 2% in 2018 to 20% in 2023. 57 As the island receives sunlight in abundance, the government aims to exploit this solar energy potential by installing solar PV panels across various sectors. The government promotes solar power pumps in aquaculture activities and the transportation sector and Island Waste Management Centers (IWMCs) and provides incentives for solar energy usages. The government has achieved around 30% of its target by exploiting solar energy in Island Waste Management Centers and installed at least 10 MW of solar PV under net metering regulations by 2023. 57 Figure 15 shows the Maldives's global horizontal irradiance (GHI) map. 21

Maldives's global horizontal irradiance (GHI) map. 21
Nepal
Nepal is a landlocked country and shares the border with China and India. It is one of the least developed countries with per-capita electricity consumption of 238 kWh/year, 58 much lesser than the many developed and developing countries. Nepal lacks fossil fuels and meets its energy requirement, predominately dependent on traditional power. However, the area is endowed with vast hydropower potential. Still, an untapped and increasing trend in the development of hydropower projects is anticipated to meet the growing demand in the future. The country is also trying to reduce dependence on hydropower and move towards other cleaner energy like solar power.58–60
Primary energy consumption basket and growth in Nepal
Nepal relies heavily on traditional fuel, i.e., fuelwood, crop residue, and animal waste, to meet its energy requirement. Figure 14(d) demonstrated Nepal's primary energy consumption by fuel in 2018. The immediate energy consumption from various renewable energy sources such as traditional fuel, imported petroleum product, coal, other sources like solar and biogas, hydro, and imported electricity contributed 71.2%, 17.9%, 5.3%, 2.2%, 1.9%, and 1.6% respectively.35,58–60 Nepal's primary energy consumption is anticipated to grow from 13.5 Mtoe in 2018 to 21.2 Mtoe in 2030, at a CAGR of 3.8% (Figure 14(e)). The main reason for higher consumption is anticipated due to the growing demand for petroleum products in the transport and industrial sector.35,58–60
Electricity generation installed capacity in Nepal
In 2018, the country's electricity generation installed capacity was 1074 megawatt (MW) with large hydropower projects, thermal and renewables, mainly solar contributing 1020.6, 53.4, and 0.1 MW. Hydropower project generation capacity is almost 95% of the total generation capacity, showing its dominance. The projected overall power generation installed capacity is expected to be around 6003 MW in 2030 with a significant capacity and the tune of 4892 MW generated from major hydropower projects as illustrated by Figure 14(f).51–53 The government is taking many initiatives into other renewable energy sources like solar energy to improve power generation. Recently, the government awarded survey licenses to developers willing to install solar power projects with a combined installed capacity of 317.14 MW. 61 In 2020, Nepal Electricity Authority (NEA) inaugurated its first solar power project of 25 MW. 35
Solar energy Status and renewable energy potential in Nepal
Nepal has a substantial renewable energy potential, but it has not been tapped due to social, economic, and political instability. The primary sources of renewable energy are mini-hydropower (< = 100 KW), solar energy, various forms of biomass energy, wind energy. The wind and solar energy potential are estimated to be around 3000 MW and 2100 MW, respectively. 62 Figure 16 shows the average daily global horizontal irradiance (GHI) in the range of 5.4–7.7 kWh/m2, which is favorable for solar PV installations.

Nepal's global horizontal irradiance (GHI) map. 21
Pakistan
Pakistan is rich in primary energy resources, but due to high population growth and rapid urbanization, the country is in severe energy shortages. As a result, Pakistan's per capita electricity consumption is only 600 kWh, about one-sixth of the global average of 3300 kWh.63,64 The demand for natural gas exceeds the transmission/supply capacity. The supply to large consumers, mainly in industrial plants, power plants, cement industry, and transportation sector (LNG plants), is generally reduced in winter to ensure supply to households and small scale industry. The country's energy crisis forced thousands of companies to cease operations, affected industrial production and the livelihoods of thousands of families and severely hindered the economic development and growth of the country. Poor planning and lack of governance are making the situation even worst
Primary energy consumption basket and growth in Pakistan
Pakistan relies heavily on fossil fuels to meet its energy requirement. In 2019, natural gas, crude oil, coal, hydro, nuclear and renewables contributed 46.2%, 25.3%, 15.5%, 8.9%, 2.4% and 1.7% respectively in the primary energy consumption basket as demonstrated in Figure 17(a). 13 Figure 17(b) explained the country's primary energy consumption by the fiscal year 2030. The total immediate energy consumption will increase to 147.4 Mtoe in 2030 with an annual growth rate of 5.1% compared to 85 Mtoe in 2019. 13
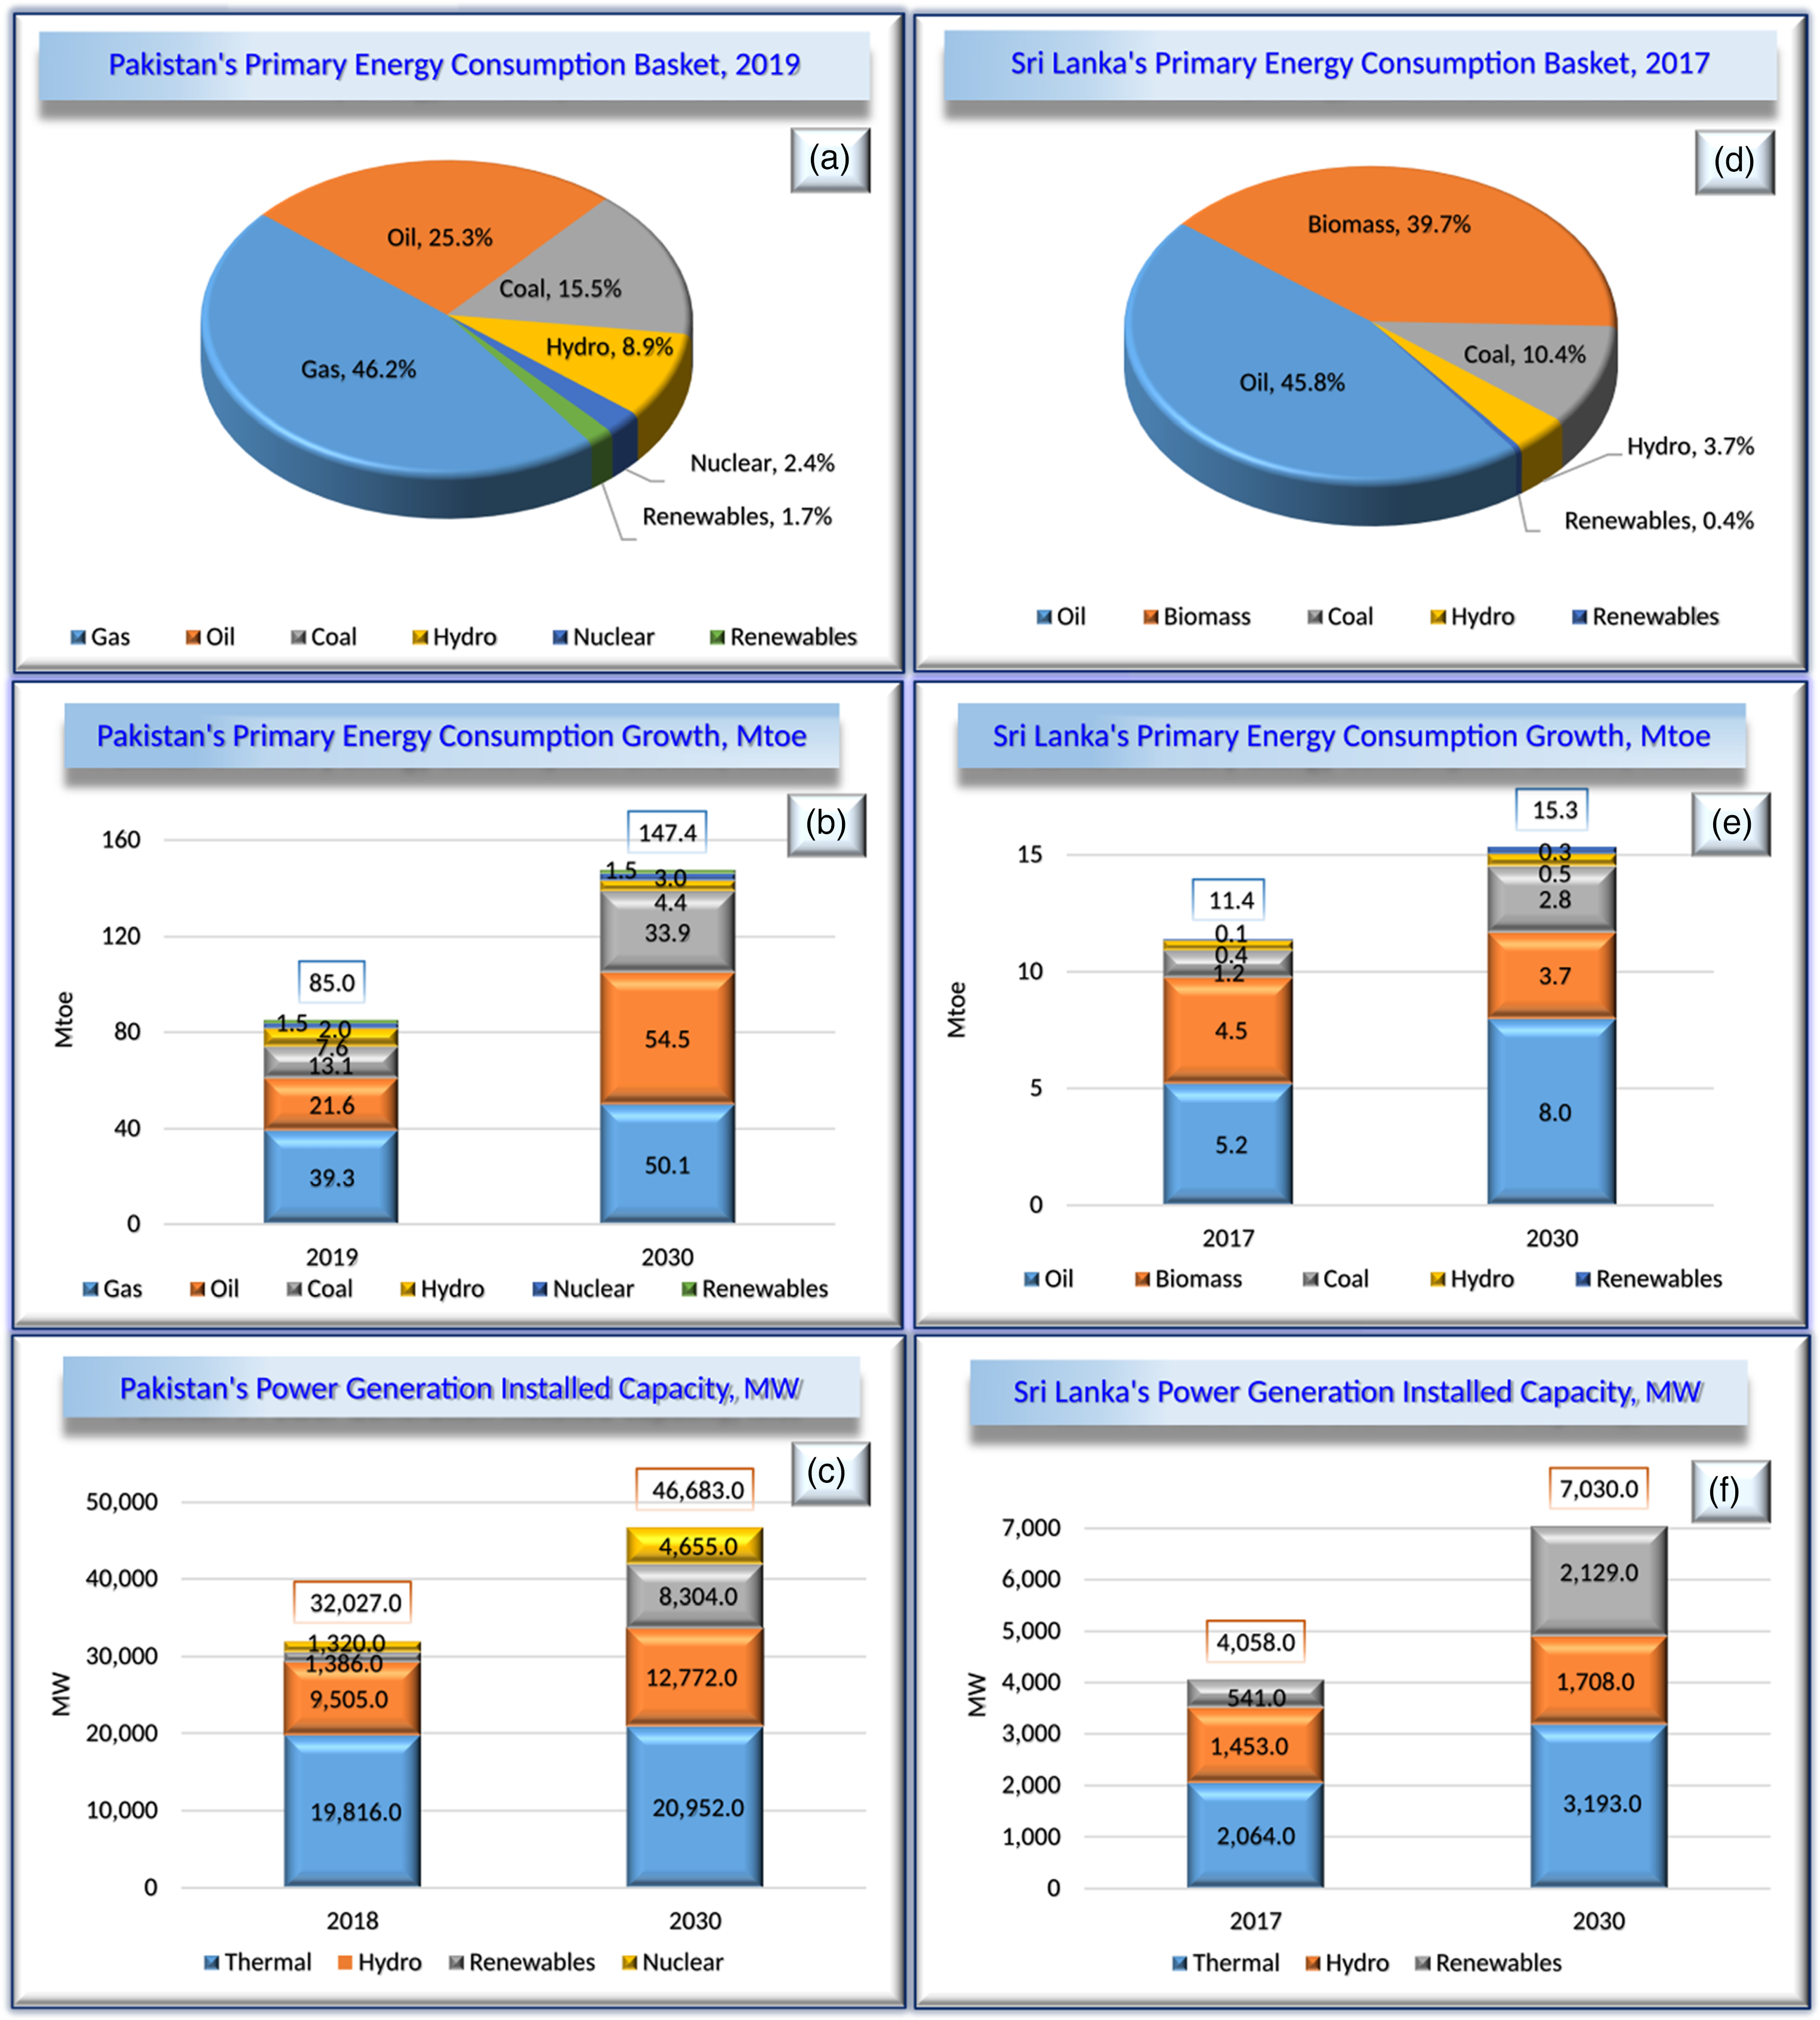
(a) Pakistan's primary energy consumption basket 2019 13 ; (b) Pakistan's primary energy consumption growth, Ktoe 13 ; (c) power generation installed capacity in Pakistan 35 ; (d) Sri Lanka's primary energy consumption basket 2017 35 ; (e) Sri Lanka's primary energy consumption growth, Ktoe 35 ; (f) power generation installed capacity in Sri Lanka. 35
Electricity generation installed capacity in Pakistan
In 2018, Pakistan's electricity generation installed capacity was 32,027 megawatt (MW) with thermal, hydropower, renewables, and nuclear contributing 19,816, 9,505, 1,386, and 1320 MW, respectively, and the projected overall power generation installed capacity is expected to be around 46,683 MW in 2030 as demonstrated from Figure 17(c). 35 Thermal-based power plants continue to be the primary source of electricity generation. In 2030, Coal-based power plants are predicted to contribute the most to new potential additions of 8000 MW, followed by 4700 MW of gas-based power plants. No new oil-based power plants are attributable due to excessive prices and delivery constraints. The new gas-based power plants are predicted to run on Regasified Liquefied Natural Gas (RLNG) commonly. Hydro-based power plants are expected to thrust upward attributable to governmental push and active participation from private players. The deliberate potential additions, coupled with energy imports, will meet future demand. 35
Solar energy Status and renewable energy potential in Pakistan
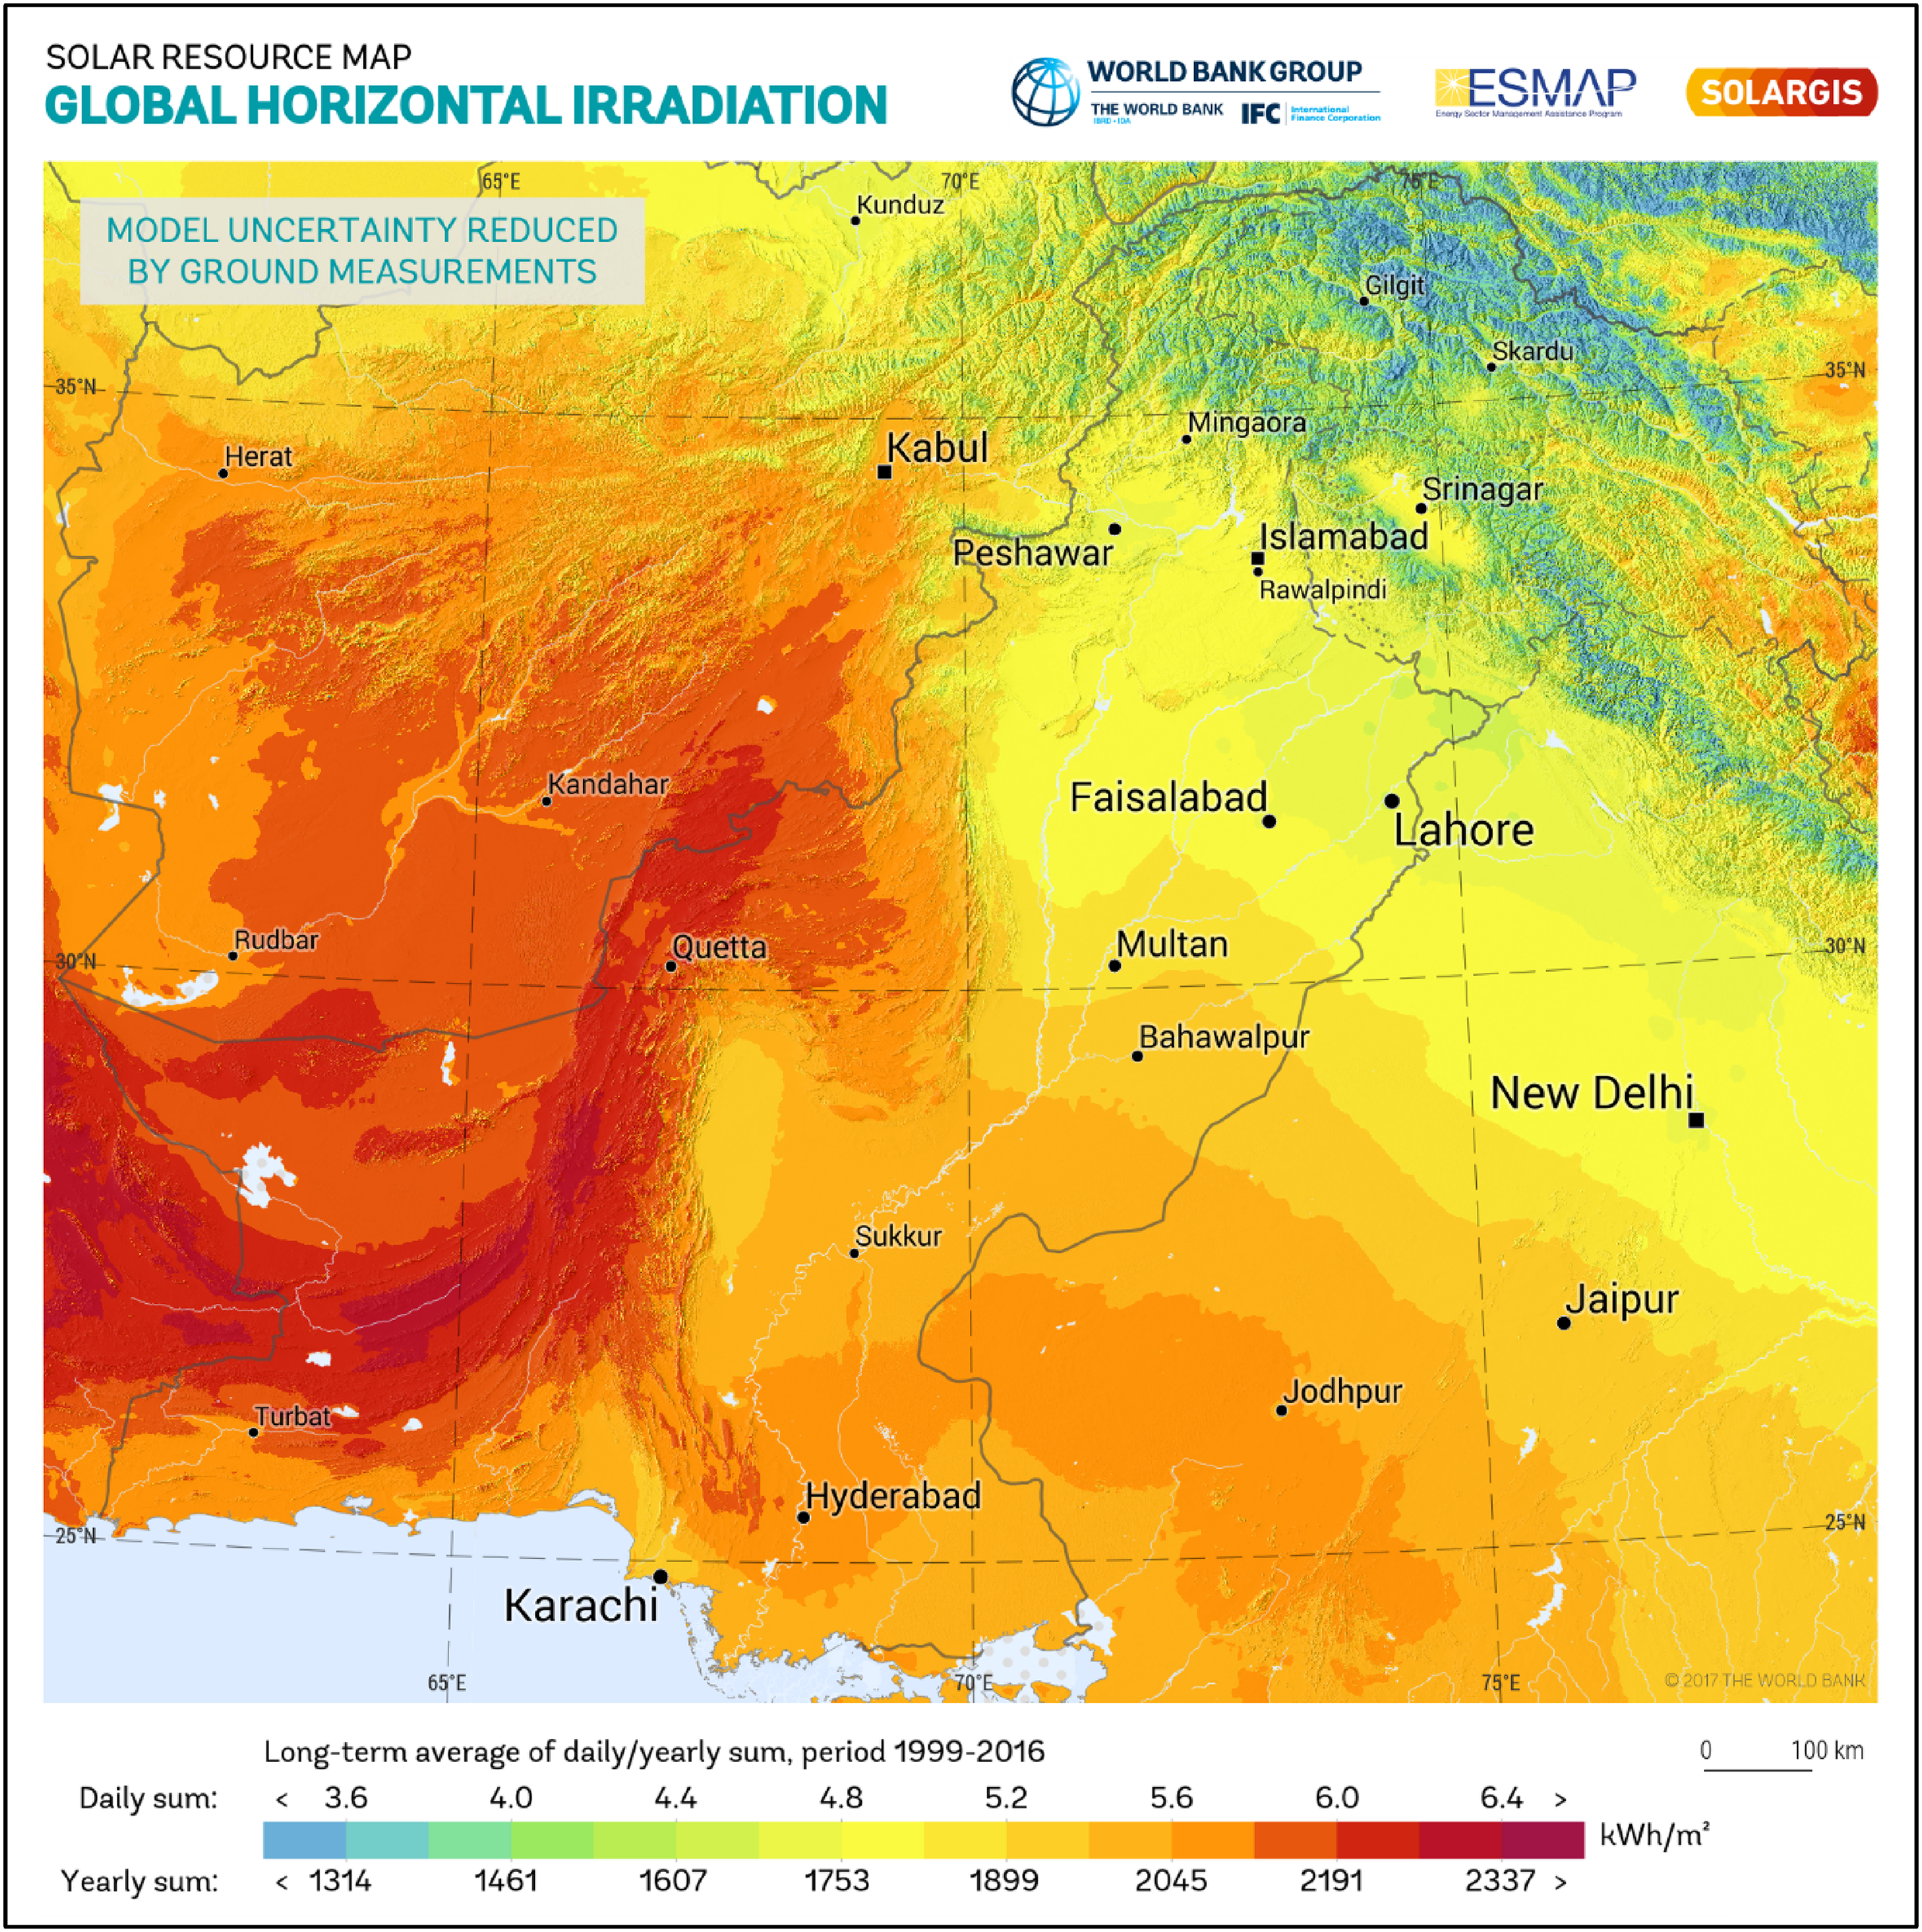
Pakistan has a wealth of renewable energy sources, such as sun and wind, which remain unexplored. The solar energy source is widely dispersed and abundantly accessible throughout the nation. The potential of solar power installations is estimated to be around 2900 GW. 41 Figure 18 illustrated Pakistan's global horizontal irradiance (GHI) map, where the average global irradiation falling on a flat surface is about 4.21–6.22 MWh/m2/year. 21 Such parameters are ideal for PV and other solar energy applications. In Pakistan, the current installed solar and wind energy capacity is around 1500 Megawatts, which is just 2% of total power generation. The government plans to increase the share of renewables in whole power generation to 30% by 2030. 65
Pakistan's global horizontal irradiance (GHI) map. 21
Sri Lanka
Sri Lanka is a small island nation situated in the Indian Ocean, south of India. The country's energy demand has been rising steadily and meets its energy requirement by importing most of the fuel. Sri Lanka is fully electrified with the power generation contributing major part from hydropower and gas-based power plants.35,66,67
Primary energy consumption basket and growth in Sri Lanka
In Sri Lanka, oil and biomass are the dominant primary energy resources and fulfill most of their energy requirement. Figure 17(d) depicts Sri Lanka's 2017 primary energy consumption by fuel, with oil, biomass, coal, hydro, and renewables contributing 45.8%, 39.7%, 10.4%, 3.7%, and 0.4%, respectively.35,67 Figure 17(e) shows Sri Lanka's primary energy consumption, which anticipates growing at a CAGR of 2.29% from 11.4 Mtoe in 2017 to 15.31 Mtoe in 2030.35,67
Electricity generation installed capacity in Sri Lanka
Figure 17(f) illustrated Power Generation Installed Capacity in Sri Lanka. In 2017, the installed capacity was 4058 megawatt (MW), with renewables and non-renewables sources contributing approximately 13% and 87%. The country's total installed capacity is 4108 MW, including 50 MW of net-metered capacity. Hydropower used to be the major source of power generation due to water availability in abundance and contributing 1/3 of the power generation. The projected overall power generation installed capacity is expected to be around 7030 MW in 2030, with renewables and non-renewables sources contributing approx. 30% and 70% respectively.35,67
Solar energy Status and renewable energy potential in Sri Lanka
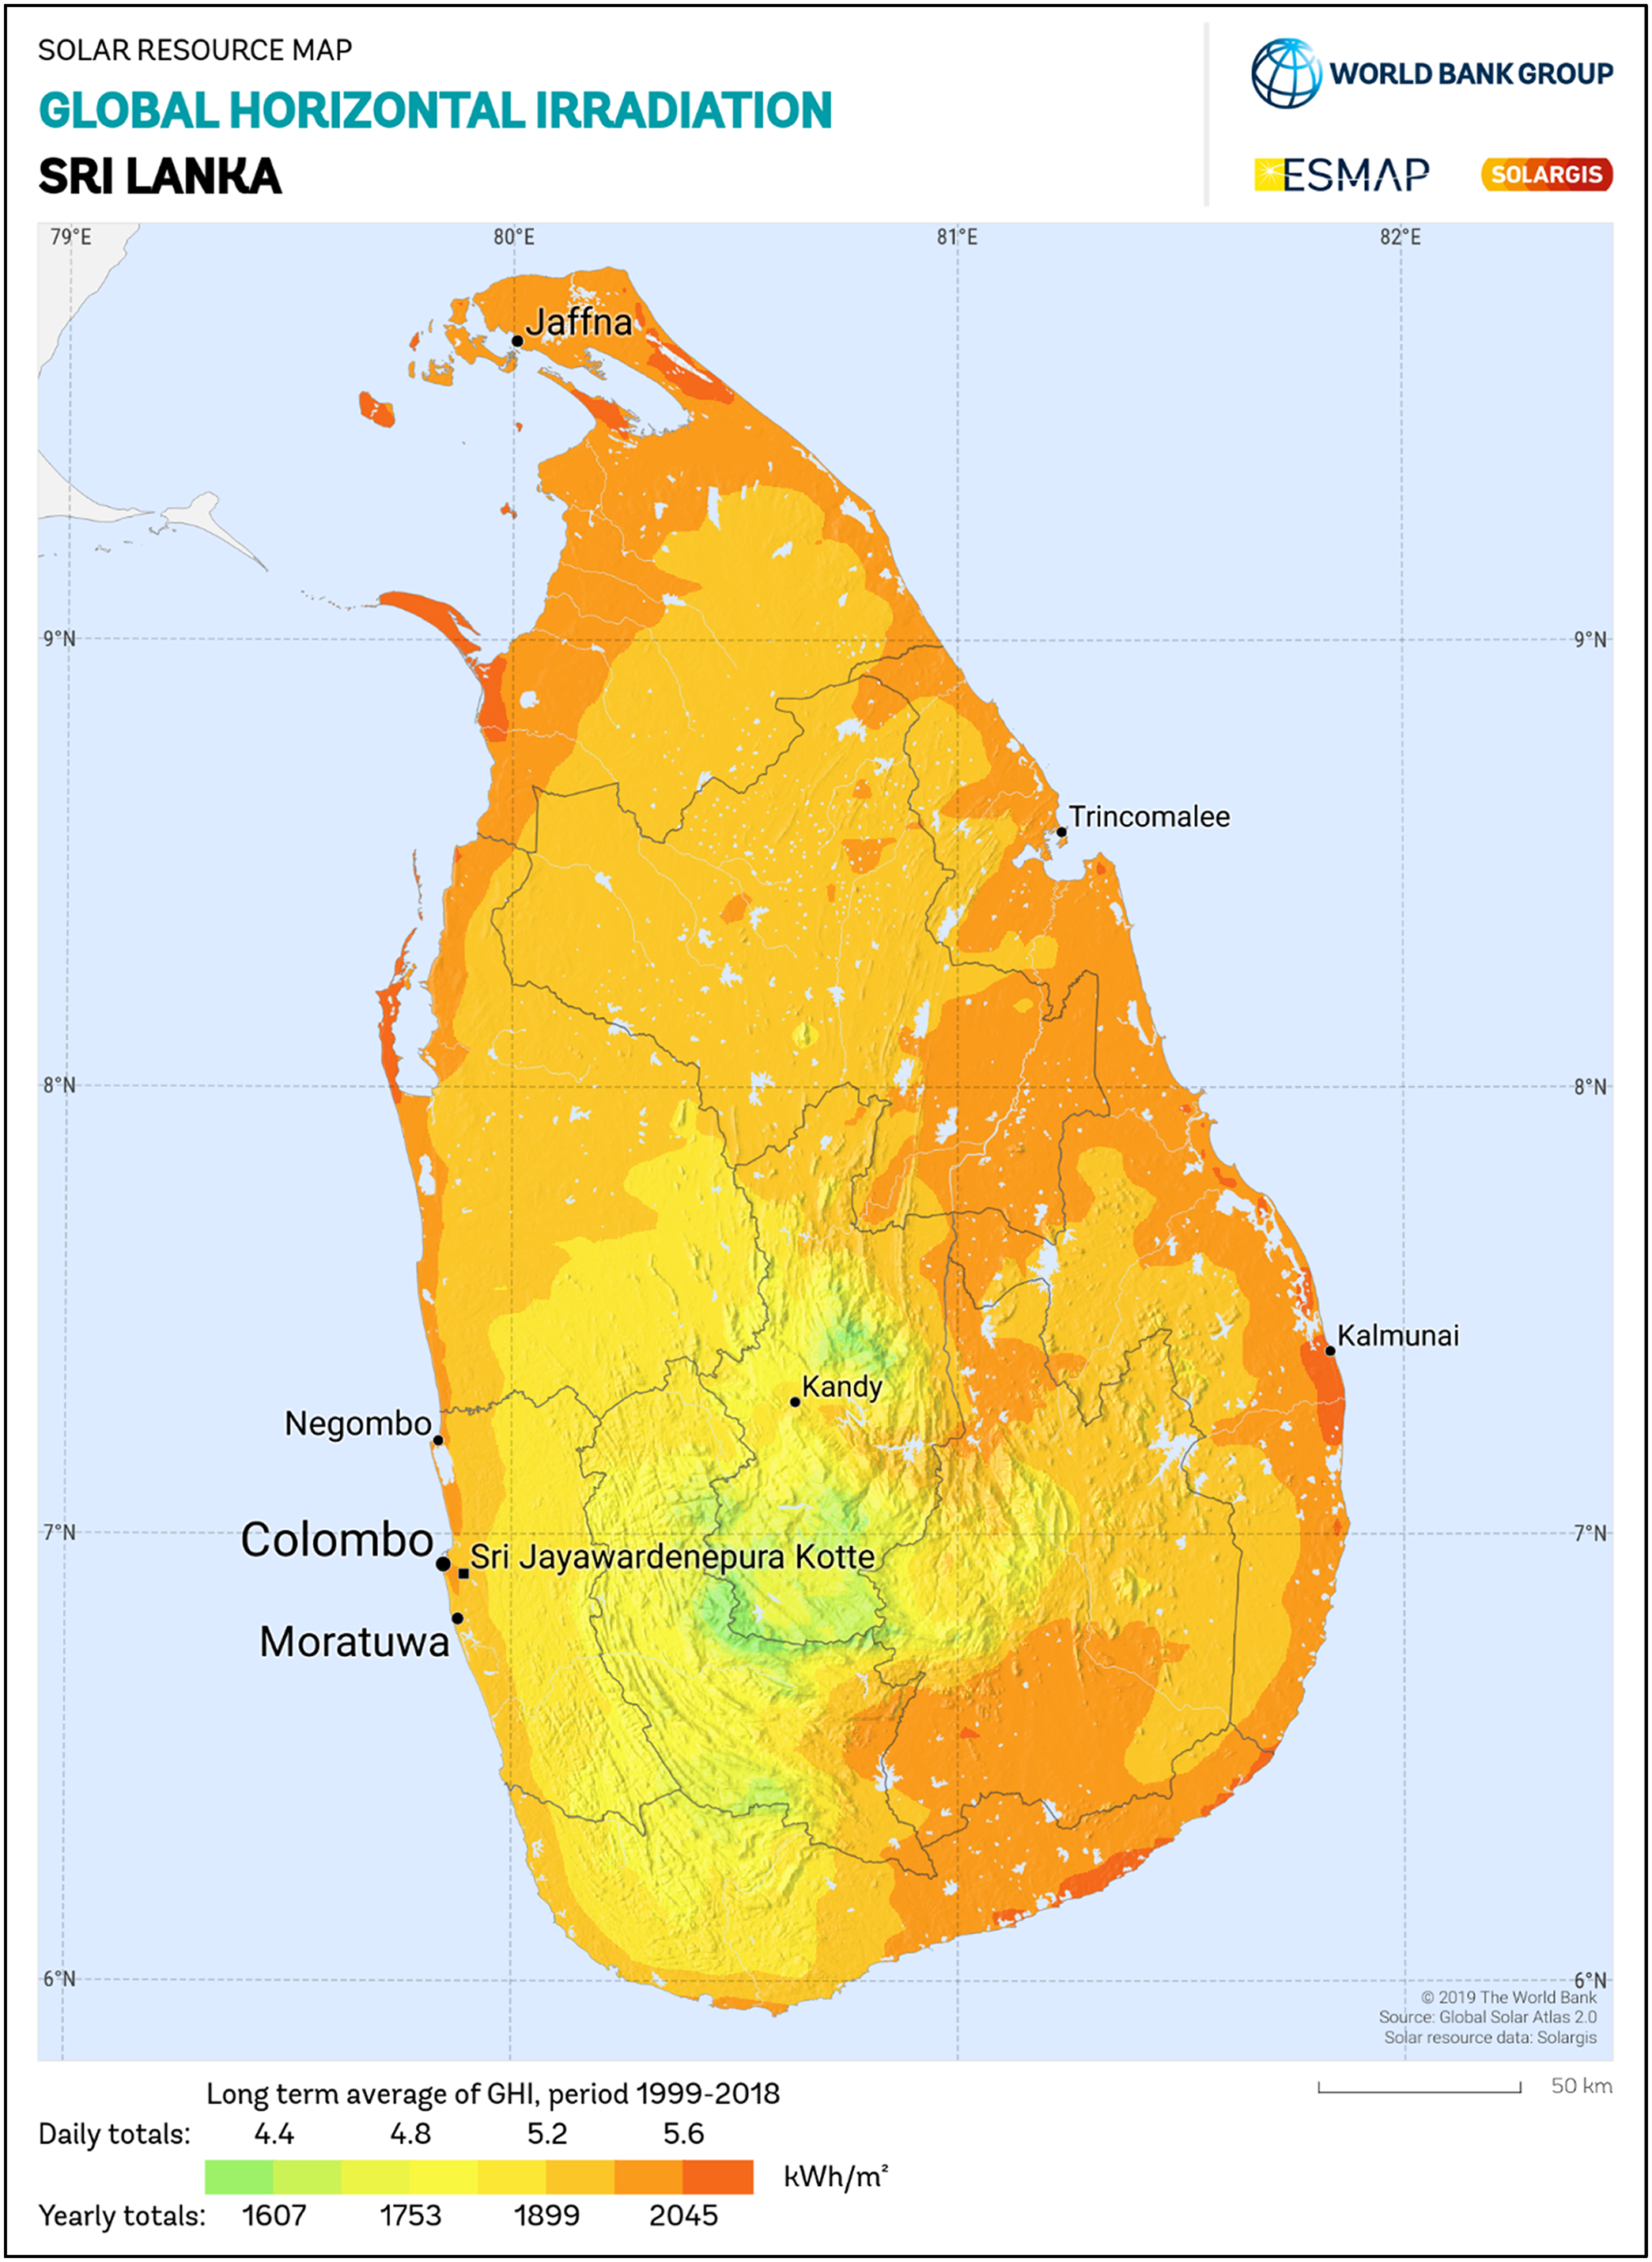
Biomass, which is second only to oil in importance, is mostly used for cooking in homes and for heating in industries. Biomass use for electricity generation is somewhat limited, with only 26.1 MW of installed capacity. The country has the potential to generate a biomass-based capacity of the tune of 2400 MW. Sri Lanka has abundant availability of solar power with global horizontal irradiance (GHI) in the range of 4.5–6 kWh/m2/day, as demonstrated in Figure 19. Therefore, the potential of using solar energy for electricity generation is about 6000 MW. However, the solar photovoltaic technology installed power generation capacity is 200 MW in 2020, just 3–4% of the available solar potential. The country's wind power potential is approximately 5600 MW; however, its installed wind power capacity is only 131 MW.35,66–68
Sri Lanka's global horizontal irradiance (GHI) map. 21
Discussion
In SAARC countries, the primary energy consumption pattern is projected to increase from its 2017 level of 959.3 Mtoe to 1673.3 Mtoe by the year 2030. This increase comes as a direct result of the region's rapid economic and demographic growth. According to the findings of the study, SAARC countries have a significant reliance on imported fossil fuels and are predominately dependent on a single source of energy. It is vital to recognize the relevance of renewable energy sources for sustainable development, particularly solar energy due to its abundant availability. SAARC countries will need to have created and put into action a long-term plan for the use of renewable energy to reach their goal of self-sufficiency. SAARC states can't satisfy their rising energy demand by shifting to renewable energy despite their efforts to develop an environmentally friendly energy policy. Existing economic realities preclude these states from sponsoring large energy projects, demanding regional cooperation despite their potential. India, Pakistan, and Bangladesh are responsible for about 95% of all consumption in the SAARC area, so it is likely that their consumption will grow the most.
India will continue to rely heavily on coal for the near future, accounting for nearly 66% of its total energy needs in 2030 as illustrated in Figure 11E. However, as shown in Figure 11F, a shift away from fossil fuels and toward renewable energy sources is likely due to the low cost of solar panels and battery energy storage systems. As stated earlier, the power generation from renewable energy increases from 23% in 2019 to 50% in 2030, with the major contribution coming from solar energy. The expansion of the country's power industry is necessary to ensure the economy of the country continues to expand throughout time. The power industry in India is in the midst of a substantial transformation, with an increased emphasis being placed on the generation of electricity from renewable energy sources. India has set a daunting task to increase the renewable energy capacity to 450 GW by 2030 with a significant contribution from wind and renewable solar sources.45–47
Pakistan suffers from severe energy shortages and relies heavily on Non-renewable energy's resources and imports to meet its needs.4,69 Non-renewable energy's depletion, rising demand, and negative impacts on the environment have compelled decision-makers and planners to choose more environmentally friendly options. 70 However, the contribution of renewable energy to Pakistan's overall energy supply makes up a relatively tiny percentage of the total proportion in 2019, as shown in Figure 17(a). This occurs due to inadequate domestic energy resource analysis, inefficient energy planning, inadequate policy creation, a lack of knowledge regarding energy modelling methods, ineffective governance, and a reliance on imported fossil fuels. 69 There must be a long-term strategy in place to alleviate Pakistan's energy crisis, and this strategy must include the development of renewable energy sources such as solar and wind.
Bangladesh relies extensively on natural gas and imported non-renewable energy to meet the energy demand and will continue to do so over the next decade, as seen in Figure 8(d). The most serious problem is the depletion of natural gas resources in coming decades and the reliance on expensive imported non-renewable energy sources.8,71 Bangladesh has not made major strides in using energy-efficient renewable technology. Thus, for Bangladesh to achieve long-term energy security, it is necessary to create policies and a strategic approach to its fuel diversification procedures in accordance with global energy market trends. 72
Afghanistan is energy deprived nation and is relying on imported POL to meet its energy requirement, as shown in Figure 8(a). In the coming decades, Afghanistan will still import POL to meet its energy needs, as shown in Figure 8(b). Due to a lack of progress; the country has not made full use of its renewable energy resources. The government now has the opportunity to investigate into these resources especially solar energy due to a decline in the price of their extraction over the last few years.33,73 To establish efficient policies and strategies, the Afghan government, funders, private sector entities, and civil society organizations need access to high-quality energy data. The accurate forecasting of energy consumption is essential to the continued growth of Afghanistan's economy and society over the long term. 74
Nepal and Bhutan are primarily reliant on traditional energy sources including firewood, agricultural leftovers, and animal dung, as shown in Figures 11(a) and 14(d), due to the lack of significant local deposits of fossil fuels.75,76 Population growth, industrialization, and economic growth have boosted Nepal and Bhutan's energy usage. Boosted fossil fuel imports, economic instability, and unsustainable biomass use have all increased greenhouse gas emissions. Nepal and Bhutan rely heavily on hydropower for electricity generation, as shown in Figures 11(c) and 14(f). In order to foster greater social and economic development, Nepal and Bhutan need to broaden their use of different types of energy resources.75–79 According to a study on the role of renewable energy in Nepal, it is imperative that the country utilize its own renewable resources and avoid relying on foreign fuel imports.75,76 In conclusion, indigenous renewable energy resources in Nepal and Bhutan contribute to establishing energy independence and guaranteeing a low-cost electricity supply for the entire populations of both nations.
In Maldives and Sri Lanka, fossil fuels are in short supply, thus imports are required to meet the country's energy demands. In Sri Lanka, biomass accounts for a considerable amount of domestic cooking energy, second only to fossil fuels, as shown in Figure 17(d). To decrease reliance on imported crude oil and petroleum products, the nation's energy policy must prioritize the development of abundant renewable energy sources such as solar.80–82 The renewable energy resources in the Maldives and Sri Lanka are significant, but the country's regulatory framework does not meet expectations, limiting the country's ability to use these resources to generate power. Increasing production, expanding energy storage, and reducing dependence on imported petroleum products are all necessary to ensure energy security and diversify the supply of energy through use of solar energy.
Conclusions and future prespectives
In their energy mix, SAARC states rely substantially on imported fossil fuels and are primarily dependent on a single energy source. The economic growth can be accomplished by diversifying energy sources as opposed to relying primarily on conventional energy sources. Because of fast urbanization, population growth, and continuous economic prosperity, it is expected that SAARC nations” energy demand would increase significantly over the next few decades. The amount of electricity that is consumed is a major indicator of the level of economic development that a country has achieved, and consequently, the need for energy increases. The energy issue has an impact on the generation of power; hence, one of the challenges that SAARC members must address is ensuring a constant and cost-effective electrical supply. SAARC nations may assure a reliable energy mix by resolving identified challenges and following proposed approaches, such as promoting the efficient use of fossil fuels, embracing renewable energy sources, and enacting effective energy regulations. The significance of solar energy must be acknowledged due to its great potential, low cost, ease of implementation, and minimal carbon footprints. Despite their efforts to implement their energy strategy with an emphasis on the environment, it is difficult for SAARC states to satisfy their expanding energy demand through a paradigm shift toward the expansion of renewable energy. Existing economic realities prevent these states from funding such wide energy endeavors, necessitating regional energy cooperation despite their tremendous potential. SAARC states have a lot of potential, even though national and international energy policies are working hard to maximize renewable energy resources. Public-government relations must be strengthened if this massive undertaking is to be completed.
Footnotes
Declaration of Conflicting Interests
The author(s) declared no potential conflicts of interest with respect to the research, authorship, and/or publication of this article.
Funding
The author(s) received no financial support for the research, authorship, and/or publication of this article
