



Abstract
The distribution models of wind speed data are essential to assess the potential wind speed energy because they decrease the uncertainty in estimating wind energy output. Therefore, before performing a detailed potential energy analysis, the precise distribution model for data relating to wind speed must be found. This research contains material from numerous goodness-of-fit tests, such as Kolmogorov–Simonov, Anderson–Darling, chi-square, root mean square error, Akaike information criterion, and Bayesian information criterion, which were combined finally to determine the wind speed of the best-fitted distribution. The suggested method collectively makes each criterion. This method was useful in statistically fitting 14 distribution models to wind speed data collected at four sites in Pakistan. The consequences show that this method provides the best source for selecting the most suitable wind speed statistical distribution. Also, the graphical representation is consistent with the analytical consequences. This research presents three estimation methods that can be used to calculate the different distributions used to estimate the wind. In the suggested maximum likelihood method, method of moments, and maximum likelihood estimation, the third-order moment used in the wind energy formula is a crucial function because it contributes to the precise estimate of wind energy. In order to prove the presence of the suggested method of moments, it was compared with well-known estimation methods, such as the method of linear moments and maximum likelihood estimation. In the relative analysis, given several goodness-of-fit tests, the presentation of the considered techniques is estimated based on the actual wind speed evaluated in different periods. The results show that the method of moments provides a more precise estimation than other commonly used methods for estimating wind energy based on the 14 distributions. Therefore, the method of moments can be a better technique for assessing wind energy.
Introduction
Energy is considered one of the most critical factors for the progress of a nation. The rate of energy intake defines the prosperity of a country. Many developing countries face severe energy crises, which have affected their progress. Most of these countries use fossil fuels as their chief source of energy production. Fuel resources are limited, and their widespread use will have a negative impact on climate change. Therefore, a cleaner and more usable natural alternative energy source is needed. Wind energy is one of the resources with these properties.1,2 In addition to environmental sustainability, wind power is reliable and will bring long-term economic benefits. Therefore, in recent years, many countries have invested in developing large and small wind projects. 3
Wind energy has been the world's fastest growing renewable energy source. 4 The global decrease in fossil resources and growing environmental concerns have led to a dramatic increase in the research of alternative energy sources over the past 20 years. 5 Therefore, renewable energy attracts the attention of policymakers and the developed (and developing) world 6 to produce clean energy. It can be produced from various sources, such as wind, solar, biomass, biofuel, wave and tidal, geothermal, hydropower, and so on. In 2015, renewable energy sources contributed to reducing greenhouse gas emissions by the equivalent of Italy's total emissions. 7 The year 2017 has been a record-breaking one for renewable energy. The reasons are the increase in renewable energy capacity, falling costs, increases in investments, and developments in relevant technologies. 7
Wind power has been the fastest growing renewable energy source in the world over the past two decades. 4 Over the past 20 years, fossil resources and growing environmental concerns have led to a sharp increase in research into alternative energy sources. 5 As a result, renewable energy has gained the attention of policymakers and the developed (and developing) world 6 to produce clean energy. Its production sources are diverse, such as wind power, solar power, biomass power, biofuels, waves and tides, geothermal energy, hydropower, and so on. In 2015, renewable energy reduced greenhouse gas emissions by the equivalent of Italy's total emissions. 7 2017 was a record year for renewable energy. The reasons are increased renewable energy production capacity, lower costs, increased investments, and the development of associated technologies. 7 One of the most promising alternative energy sources among the various renewable energy sources is wind power, which increased by more than 52 GW in 2017. Wind power is becoming a rapidly growing and competitive technology worldwide. 12
Pakistan has suffered from an energy crisis for over two decades, and only half of the country's population is connected to the national grid. The country's electricity generation relies primarily on low-efficiency fossil fuels from wind and solar resources. Therefore, the country's abundant wind power must be used.8–10 In different regions, the Pakistan Meteorological Department (PMD), with the assistance of the Alternative Energy Development Board (AEDB) and the United Nations Development Program (UNDP), has carried out detailed studies on wind potential. Pakistan's southern coast is approximately 1100 km long and is the main area for wind power generation. 11 Recently, there has been an increase in Pakistan's wind capacity, so the cumulative installed capacity at the end of 2018 was around 2118 MW. 12
In many studies, two popular models have been broadly used, namely the Weibull and Rayleigh distribution functions.13–17 There are several other probability density functions (PDFs) commonly used for wind energy evaluation, such as gamma, generalized gamma, inverse Gaussian, Gumbel, inverse gamma, two-parameter log-normal (LN2), three-parameter log-normal (LN3), Pearson type 3, three-parameter beta, Wakeby, Burr, log-Pearson type 3, kappa, Erlang, generalized extreme value, generalized Pareto distribution, and generalized log-normal distribution.18–20 It is essential to determine the more appropriate function that best fits the observed data. Using a PDF that is more accurate fits the wind dataset. At present, the use of renewable energy is becoming more widespread around the world, spreading across all continents to alleviate environmental problems and promote freedom from fossil fuel dependence. Wind energy has emerged as a cost-effective and widely available renewable energy source in recent years.21,22 In the future, wind energy can effectively meet most of the world's energy needs without emitting carbon dioxide or other harmful gases. The wind industry has made significant progress in installing wind turbines. 23
Saleh et al. 24 compared various numerical methods to assess the WEI parameters of Zafarana in the Gulf of Suez, Egypt. Research methods include power density method (PDM), graphical method (GM), mean wind speed method (MWSM), modified maximum likelihood method (MMLM), and maximum likelihood method (MLM). In the Gulf of Suez, Egypt, MWSM and MLM methods were considered the most capable of determining WEI parameters and analyzing wind potential. One study 25 used MLM, WAsP algorithm, and least-squares regression method (LSRM) to estimate WEI parameters to analyze wind characteristics in the Jubail region of Saudi Arabia. In connection with these methods, MLM has proved to be an efficient method for estimating Weibull parameters, followed by LSRM and WAsP algorithm. Similarly, in Pakistan, wind resource assessments have been carried out in some potential locations, such as the Baburband, Keti Bander, Haksbay, and Nooriabad wind potential assessments.9,11,26
Aries et al. 27 evaluated the precision of different probability functions to simulate the distribution of wind speeds at four locations in Algeria to minimize the uncertainty of the estimate of wind resources. The commonly used maximum likelihood, power density, and L-moment methods were first developed and used in wind resource valuation, and most distribution parameters used in this article were estimated. In addition, two goodness-of-fit tests based on the coefficient of determination and the root mean square error (RMSE) were performed to select a well-fitting PDF.
This study focused on the comparison approaches for wind resource assessment to determine the most precise method in the southern parts of Pakistan. A comparison was carried out using three methods: maximum likelihood estimation (MLE), method of linear moments (MLM), and method of moments (MOM). The data were taken from PMD for four selected stations named Hyderabad, Jacobabad, Jamshoro, and Karachi. These methods were compared to determine the most precise method for assessing wind energy.
Literature review
Suitable and precise wind speed modeling is a significant stage in examining the possible wind power, as wind energy generation strongly depends on the capacity and features of wind speed. 28 The modeling characterizes the uncertainty and wind speed variations to evaluate the available potential energy. 29 The literature review demonstrates that many researchers have described the various applications of models for assessing wind power potential in a specific area.
A study was conducted by Deveci et al. 30 to determine the importance of offshore wind farm (OWF) site selection using a novel decision-making level-based weight assessment (LBWA) approach based on interval valued fuzzy-rough numbers (IVFRN). The proposed method allows the exploitation of uncertainties and subjectivity in decision making. The results from this study improve our understanding of the importance and impact of each criterion, which we believe would be invaluable for future studies on the site selection of OWFs. Deveci et al. 31 conducted a similar study on type 2 neutrosophic number (T2NN) and fuzzy multi-criteria decision model (MCDM) for the selection of OWF sites. This study integrates technical and economic models for decision making and OWF integration. A case study was conducted to assess and rank five proposed OWF sites off the New Jersey coast. In order to verify the proposed model, it was compared to three alternative fuzzy-based T2NN models.
The wind turbine fault model and wind energy turbine curves were used to estimate the associated power production. 32 Numerical plotting of wind energy features33–39 is employed for the degradation of wind turbine model.23,40,41–47
Deveci et al. 4 conducted a study to develop a multi-criteria decision-making model (MCDM) that considers technical, economic, environmental, and social criteria to assess the sustainability of Ireland's most promising OWFs. An MCDM model based on interval type 2 fuzzy sets was developed, which combines a scoring function with positive and negative solutions to achieve better results. Chadee and Clarke 48 evaluated different models of distribution, specifically, Weibull, log-normal, generalized logistic, Gumbel, gamma, and inverse Gaussian distribution models of wind speed at four different locations in Algeria 48 used 21 single mixture distributions to evaluate global wind speed data comprehensively. Similarly, different models have been used to display spatial information in different areas. Aries et al. 27 associated eight distribution models to identify the most suitable model for calculating the wind speed in Iran.
The results show that inverse Gaussian, gamma, generalized extreme, and Nakagami value distributions perform best in wind speed modeling compared to Weibull. Alavi et al. 49 reported complete evaluation models. It was concluded that most researchers worldwide have used 11 distribution models of wind speed to evaluate the potential energy. In many studies, wind power has been investigated using multiple distribution models simultaneously, thereby providing the most precise outcome for wind power estimation and calculation.11,50–58 Several methods were used to fit wind speed data. For instance, it is recommended to use the chi-square and R2 to calculate wind speed in Pakistan. 58 Fawad et al.59,60 suggested the use of generalized extreme value (GEV) distribution, generalized Pareto distribution (GPA), generalized logistic distribution (GLO), log-Pearson type 3 distribution (LP3), Weibull (WEI) distribution, and Pearson type 3 (P3) distribution to estimate wind speed.
Choosing a precise distribution model involves several standard measurements for wind data, such as Kolmogorov–Simonov (KS), Anderson–Darling (AD), chi-square, and R2 coefficient statistics. Specifically, different criteria and measurement techniques can be used to estimate distribution based on the goodness-of-fit test when a particular technique cannot provide definite outcomes (there is a difference between the outcomes of each technique). Hence, this research attempts to solve the problem by proposing a comprehensive method to determine the best choice model for treating wind speed data. The planned method includes a combination of numerous major criteria.
The novelty of this study is that it compares these three approaches. MOM, LMOM, MLE, and model selection approach including Akaike information criterion (AIC), Bayesian information criterion (BIC), AD, KS, RMSE, and chi-square are presented as estimation methods for selecting a most precise distribution for wind speed. These three methods concluded that MOM is significantly better than other methods. Considering AD, KS, and RMSE, for almost all stations considered, compared to the other methods, MOM provides better results. MOM provides more minor results than other methods. Therefore, MOM can be used as a better method for estimating all distribution parameters, wind speed, and energy applications. From Tables 4–6, it can be concluded that MOM is significantly better than other methods. In summary, while all giving approaches provide nearly all consequences in terms of AD, KS, chi-square, and RMSE, for all measured wind sampling situations, MOM provides smaller results than other methods.
Methodology
Parameter estimation techniques and wind speed distribution models
The estimation of a population parameter is of great concern in inferential statistics. Population parameters are estimated from sample data. Two types of estimation are used for this purpose. For example, these include point estimation and interval estimation. For a good point estimator, it is necessary to satisfy the same conditions, that is., unbiased, consistent, and relatively efficient. Interval estimates are in the form of intervals with a given confidence level. In this study, we used three different types of estimation: MLM, MLE, and MOM.
Method of L-moments
In this study, the L-moment method (LMOM)60–62 was used to evaluate the parameters of the partial distribution model for wind speed data. Since Hosking 63 defines the L-moment, the L-moment is the probability of some linear arrangement of statistics. These linear orders are arranged in descending or ascending order. L-moments are more reliable because they are not sensitive to outliers.63–65 The L-moment can also be expressed by probability weighted moment (PWM).
It can explain any random variable for which the mean occurs. Let








Maximum likelihood estimation
The MLE method is generally used to estimate population parameters from wind speed sample data. Between 1912 and 1922, this method was recommended and popularized by R.A. Fisher. Evaluation of the MLM includes estimates of parameters that generate the best results.
Probability of the occurrence of observation. For distributions with probability density functions (pdf) given by f(x) and parameters





Method of moments
The MOM estimate is attained by associating the sample moment with the population moment. In 1984, Karl Pearson introduced the MOM estimation. This method is used to estimate the parameter of the distribution. We first obtain the four general moments arbitrarily distributed from the expectation method of the given right to the random variable. We obtained the rth population moments around zero means as follows

First four sample moments can be estimated as follows

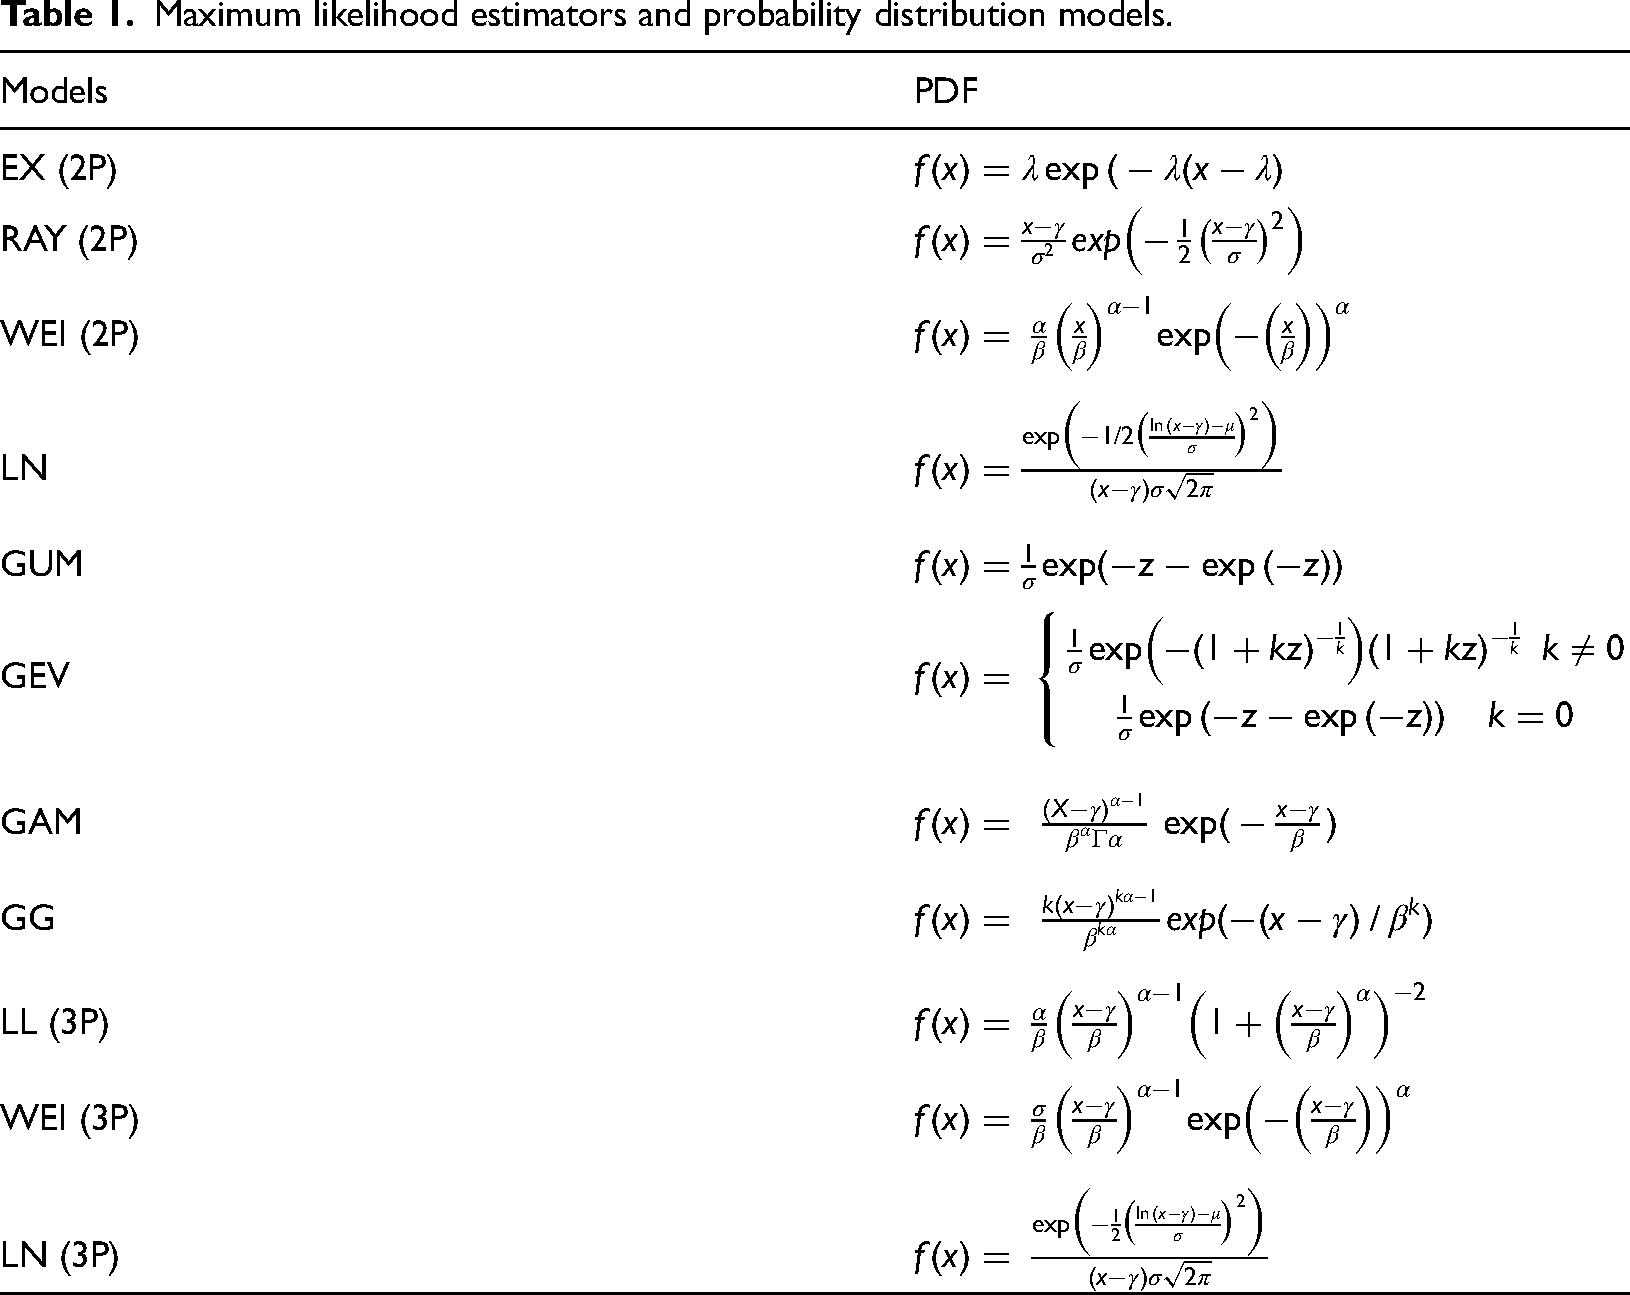
Maximum likelihood estimators and probability distribution models.
Different approaches for selecting the best distribution of wind speed
An empirical distribution function (EDF)-based KS test to determine if a sample is from a hypothetical continuous distribution. Suppose a random sample 

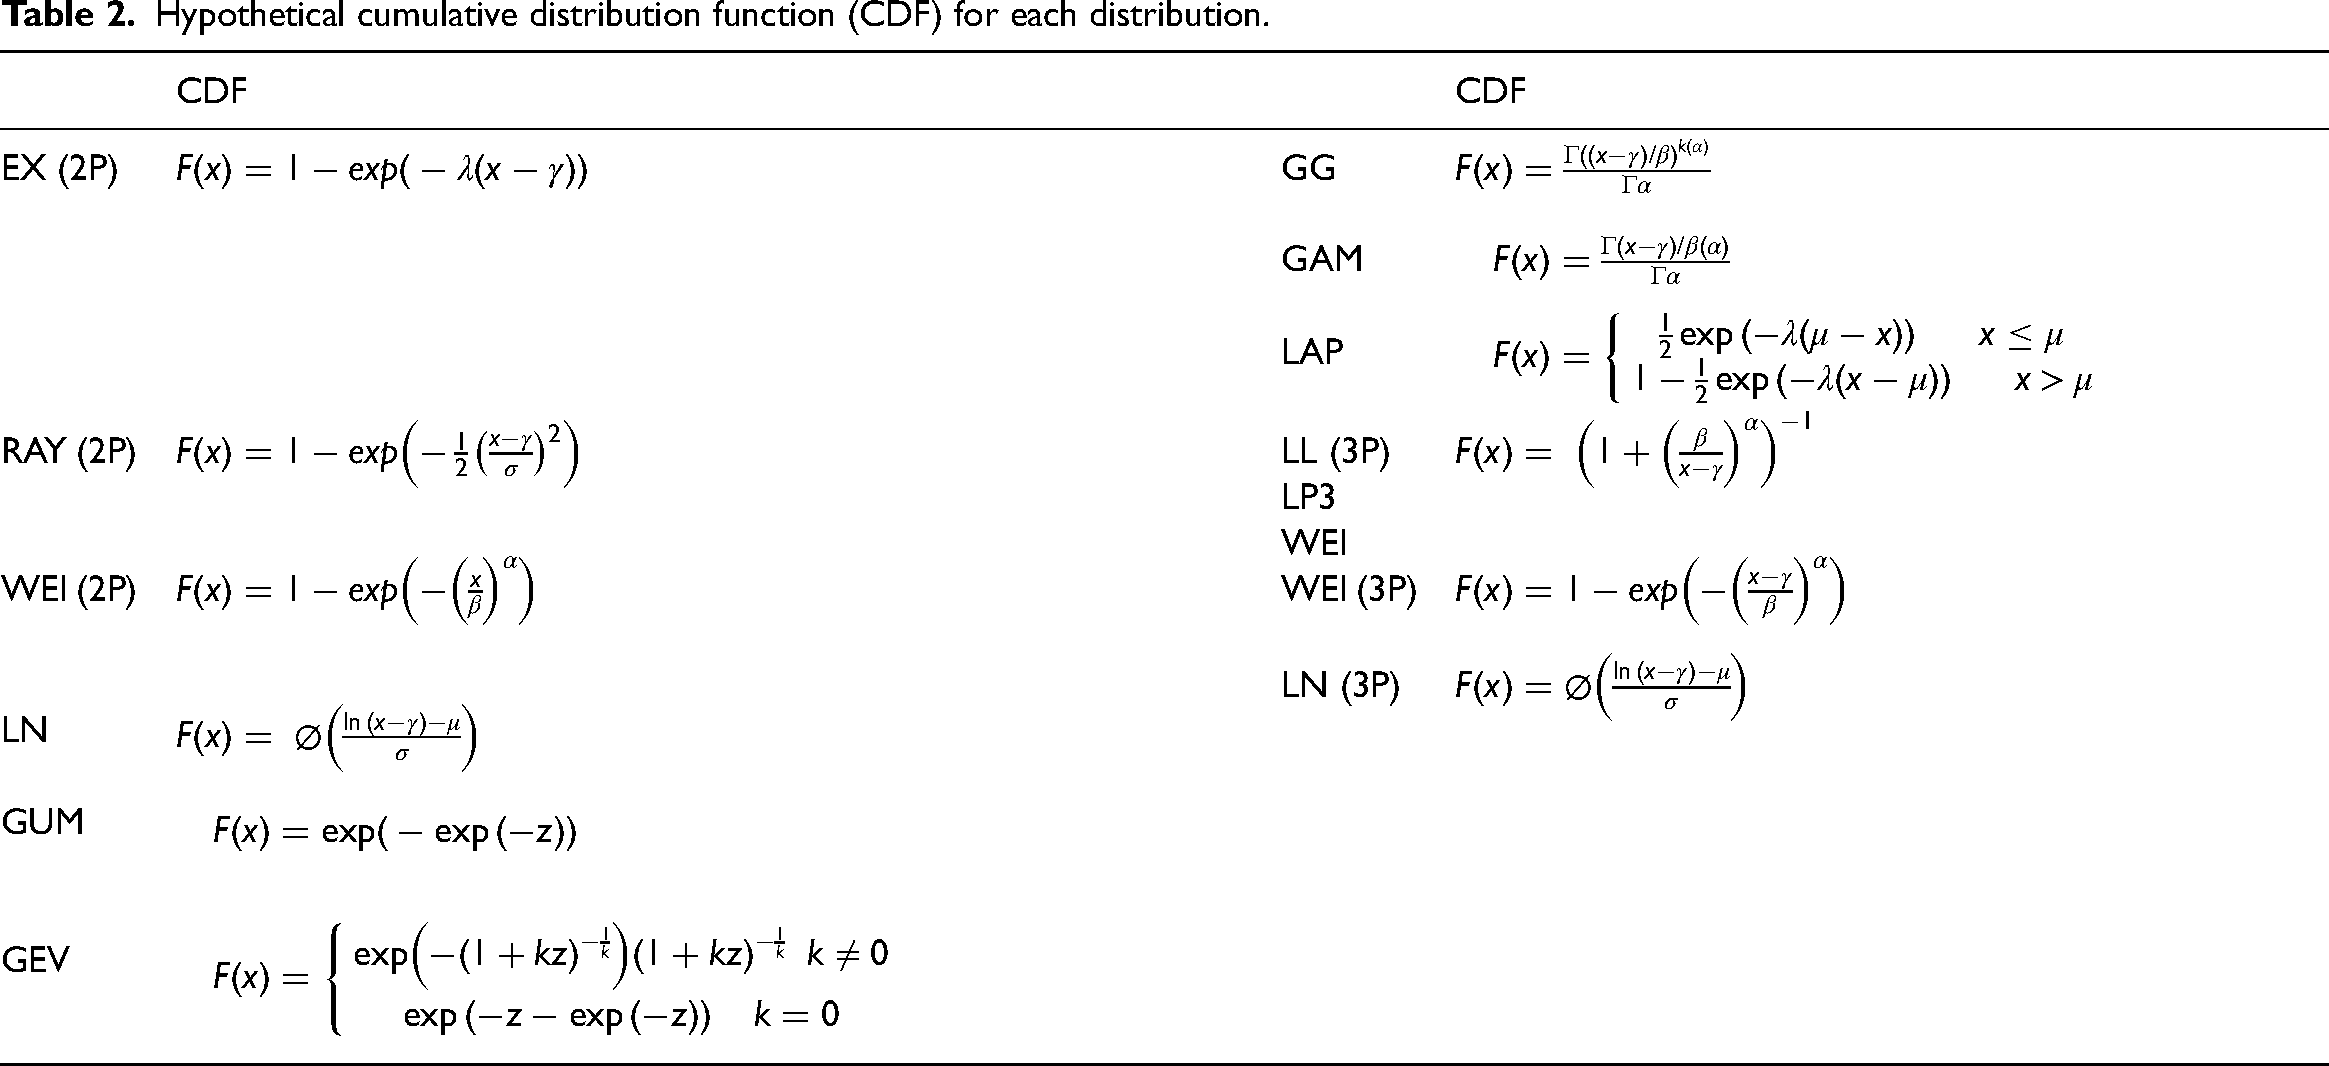
Hypothetical cumulative distribution function (CDF) for each distribution.
The AD test associates the observed fitting of the distribution. The Anderson Darling (AD) test assigns a more extensive weight and fundamental feature of modeling extreme events.
59
The AD test 
Akaike and Bayesian information criteria
The other method is based on the comparative measure of material loss when fitting the model to define the observation. This method contains AIC and BIC. However, these two techniques are the most popular measure. In the logic of the hypothesis, AIC is not a model test. Instead, the process and scoring provide a method for associating observation models and the instrument for the selected model. The standard method for AIC and BIC is

Study area
The analysis was carried out based on long-term wind speed data within 50 m (m/s). The data on the wind speed of the four stations in Hyderabad, Jacobabad, and Karachi in Pakistan were obtained from the Pakistan metrological department in Lahore. Four sites were selected these sites are Hyderabad, Jacobabad, Jamshoro and Karachi and these sites are located in Sindh province is the southern Pakistan as shown in Figure 1. This study's wind speed data were obtained from the Karachi metrological department, Pakistan. The data on the wind speed from 1981 to 2019 will be analyzed. Renewable energy is a major energy source in Pakistan, accounting for more than 6% of the country's total electricity generation. As of 2018, Pakistan's wind power capacity was 1237 MW.74,75 The government is seeking to increase the part of the energy, and plans to add approximately 3.5 GW of wind power capability. 76
The PMD conducted a study entitled “Survey on the Potential of Wind Power in the Coastal Areas of Pakistan” in 2013, and the Ministry of Science and Technology provided funding for this. This research enables PMD to identify potential “wind tunnels” that can be established for wind farms that may be economically viable. The wind corridor in Sindh province is considered the most profitable place for wind energy plants. 77 The wind potential energy covers 9700 km2, and the total wind potential energy is 43,000 MW. 75 Hyderabad is also located in Sindh province; the desert climate in Hyderabad is hot and dry throughout the year. As a result, houses in Hyderabad have traditionally been equipped with “induction wind” towers that blow breezes into residential areas to reduce heat. From mid-April to late June is the hottest period of the year, with the highest peak in May at 41.4°C. The maximum temperature recorded in May was 50°C, and the lowermost temperature recorded in February was 1°C (34°F).
Jacobabad is a city in Sindh province, Pakistan. This city is the most populated in Pakistan. Located far from the border between Sindh and Baluchistan provinces, Jacobabad has become a city where an existing village is located and intersects with the Pakistan Railways and many major roads in the province. In this city, wind speed increases and decreases with respect to time and months. The wind direction showed maximum fluctuations in the months of October–March.
The Jamshoro wind tunnel has the maximum wind energy potential. This develops and optimizes the blade design for the Jamshoro air duct. Considering the wind conditions of Jamshoro, theoretically, about 43 m of blades have been designed and optimized. This ensures a design with maximum power output relative to the wind speed of Jamshoro. Karachi is the capital of the province of Sindh and the most populated city in Pakistan. Although the climate of Karachi is dry, it is dry. Karachi is situated in the seaside area, so the climate is comparatively mild. The two main periods in Karachi. Winter and summer, but the autumn and spring are very short (mean that autumn and spring are very less duration to change).. Summer is the longest period of the year. Karachi receives rains from July to September. 78 The city has a tropical climate with hot summers and warm winters. Generally, from March to November, the humidity level will remain high, while in winter, the humidity level will be very low because the wind direction in winter is northeast wind. In April and May, Karachi receives powerful winds accompanied by showers. In the morning of October, the sky was still clear and the wind quiet. Wind weather prediction for Karachi includes complete information about resident wind speed and direction. The wave prediction contains wave altitude and period.
Results and discussion
The LMOM is used to estimate the distribution parameters. The AD, minimum L-kurtosis (ML-K), KS test, and L-ratio diagram indicate that four distributions, specifically GPA, GEV, GLO, and GNO (generalized normal distribution), are the most appropriate for the distribution of different sites and are better than other distribution. 59 The most commonly used method is the distribution fit MLM. As mentioned in 80% of studies, parameter estimation method (PEM) and MLM are used to estimate at least one distribution parameter.26–32,27,34,38–49,50,51–53,55–63,65,67,68,71,79 MLM is an optimization process for determining the estimation of different distribution functions. 80 MOM method was applied 22% in all studies to estimate the distribution of the parameters.79,81,82 LMOM used in different studies was expected to provide more precise parameters estimated.28,72,83 The MLE used for parameter distribution of Inverse Gaussian (IGA), Weibull (WE2), Gamma (GA), Burr(BR) distribution can be determined numerically based on the observed wind speed. Data were obtained using different methods, including the EM algorithm, Newton–Rapson, Nelder–Mead, scoring, and Quasi-Newton. 84
The literature also proposes several other distributions for evaluating wind energy used by MLE. These include generalized gamma, inverse Gaussian, inverse gamma, log-normal, log-logistic, logistic, generalized extreme value, Gamble, log-Pearson type 3, Burr, three-parameter beta, Johnson SB, Erlang, Wakeby, and kappa.13,15,18,19,83,85–88
Determining the precise distribution model, the data of wind speed mentioned above is significant issue to be solved. However, according to the literature, various criteria and methods have been adopted to find the best method and precise model. Given that various criteria and measurement methods, MLE, MOM, and LMOM can be used to assess the goodness of fit (GOF) of the different distribution models. The problem will be met when certain methods cannot provide conclusive results (there is a difference between each method and results). The problem will cause misperception, so there is a lack of consent on the best choice model. Deal with an uncertain result. Some studies used the boxplot method to conclude the best particular distribution (see Jung et al.28,56,69,81,84).
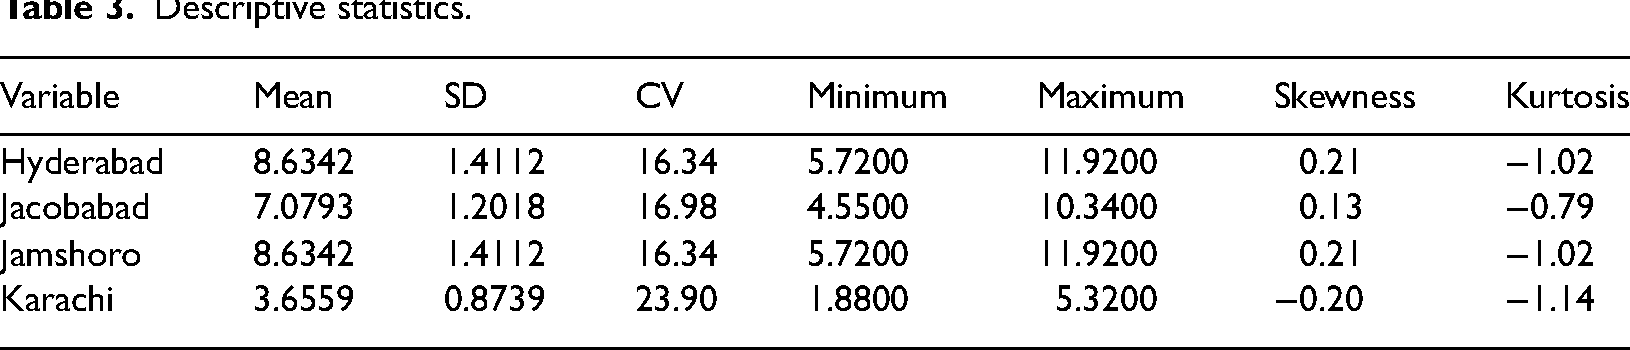
First, the descriptive appearance of wind energy values is considered by three different distribution approaches, and the wind energy values are achieved using the measured wind speed data. Therefore, Table 3 lists the main descriptive statistical information of the four examined sites, including mean, standard deviation, coefficient of variance, skewness, kurtosis, minimum, and maximum. This analysis helps to associate the wind energy density distribution calculated by the three approaches with the wind energy density calculated by meaningful wind speed data. The kurtosis and skewness value declaring that to measures symmetry and asymmetry distribution (peak and width) correspondingly. It can be seen that the skewness value is positive for all stations except Karachi station, which indicates that all distributions are skewed to the right. In addition, the kurtosis coefficients of all stations moderate the wind energy calculated from the measured data, which is worthless.
Descriptive statistics.
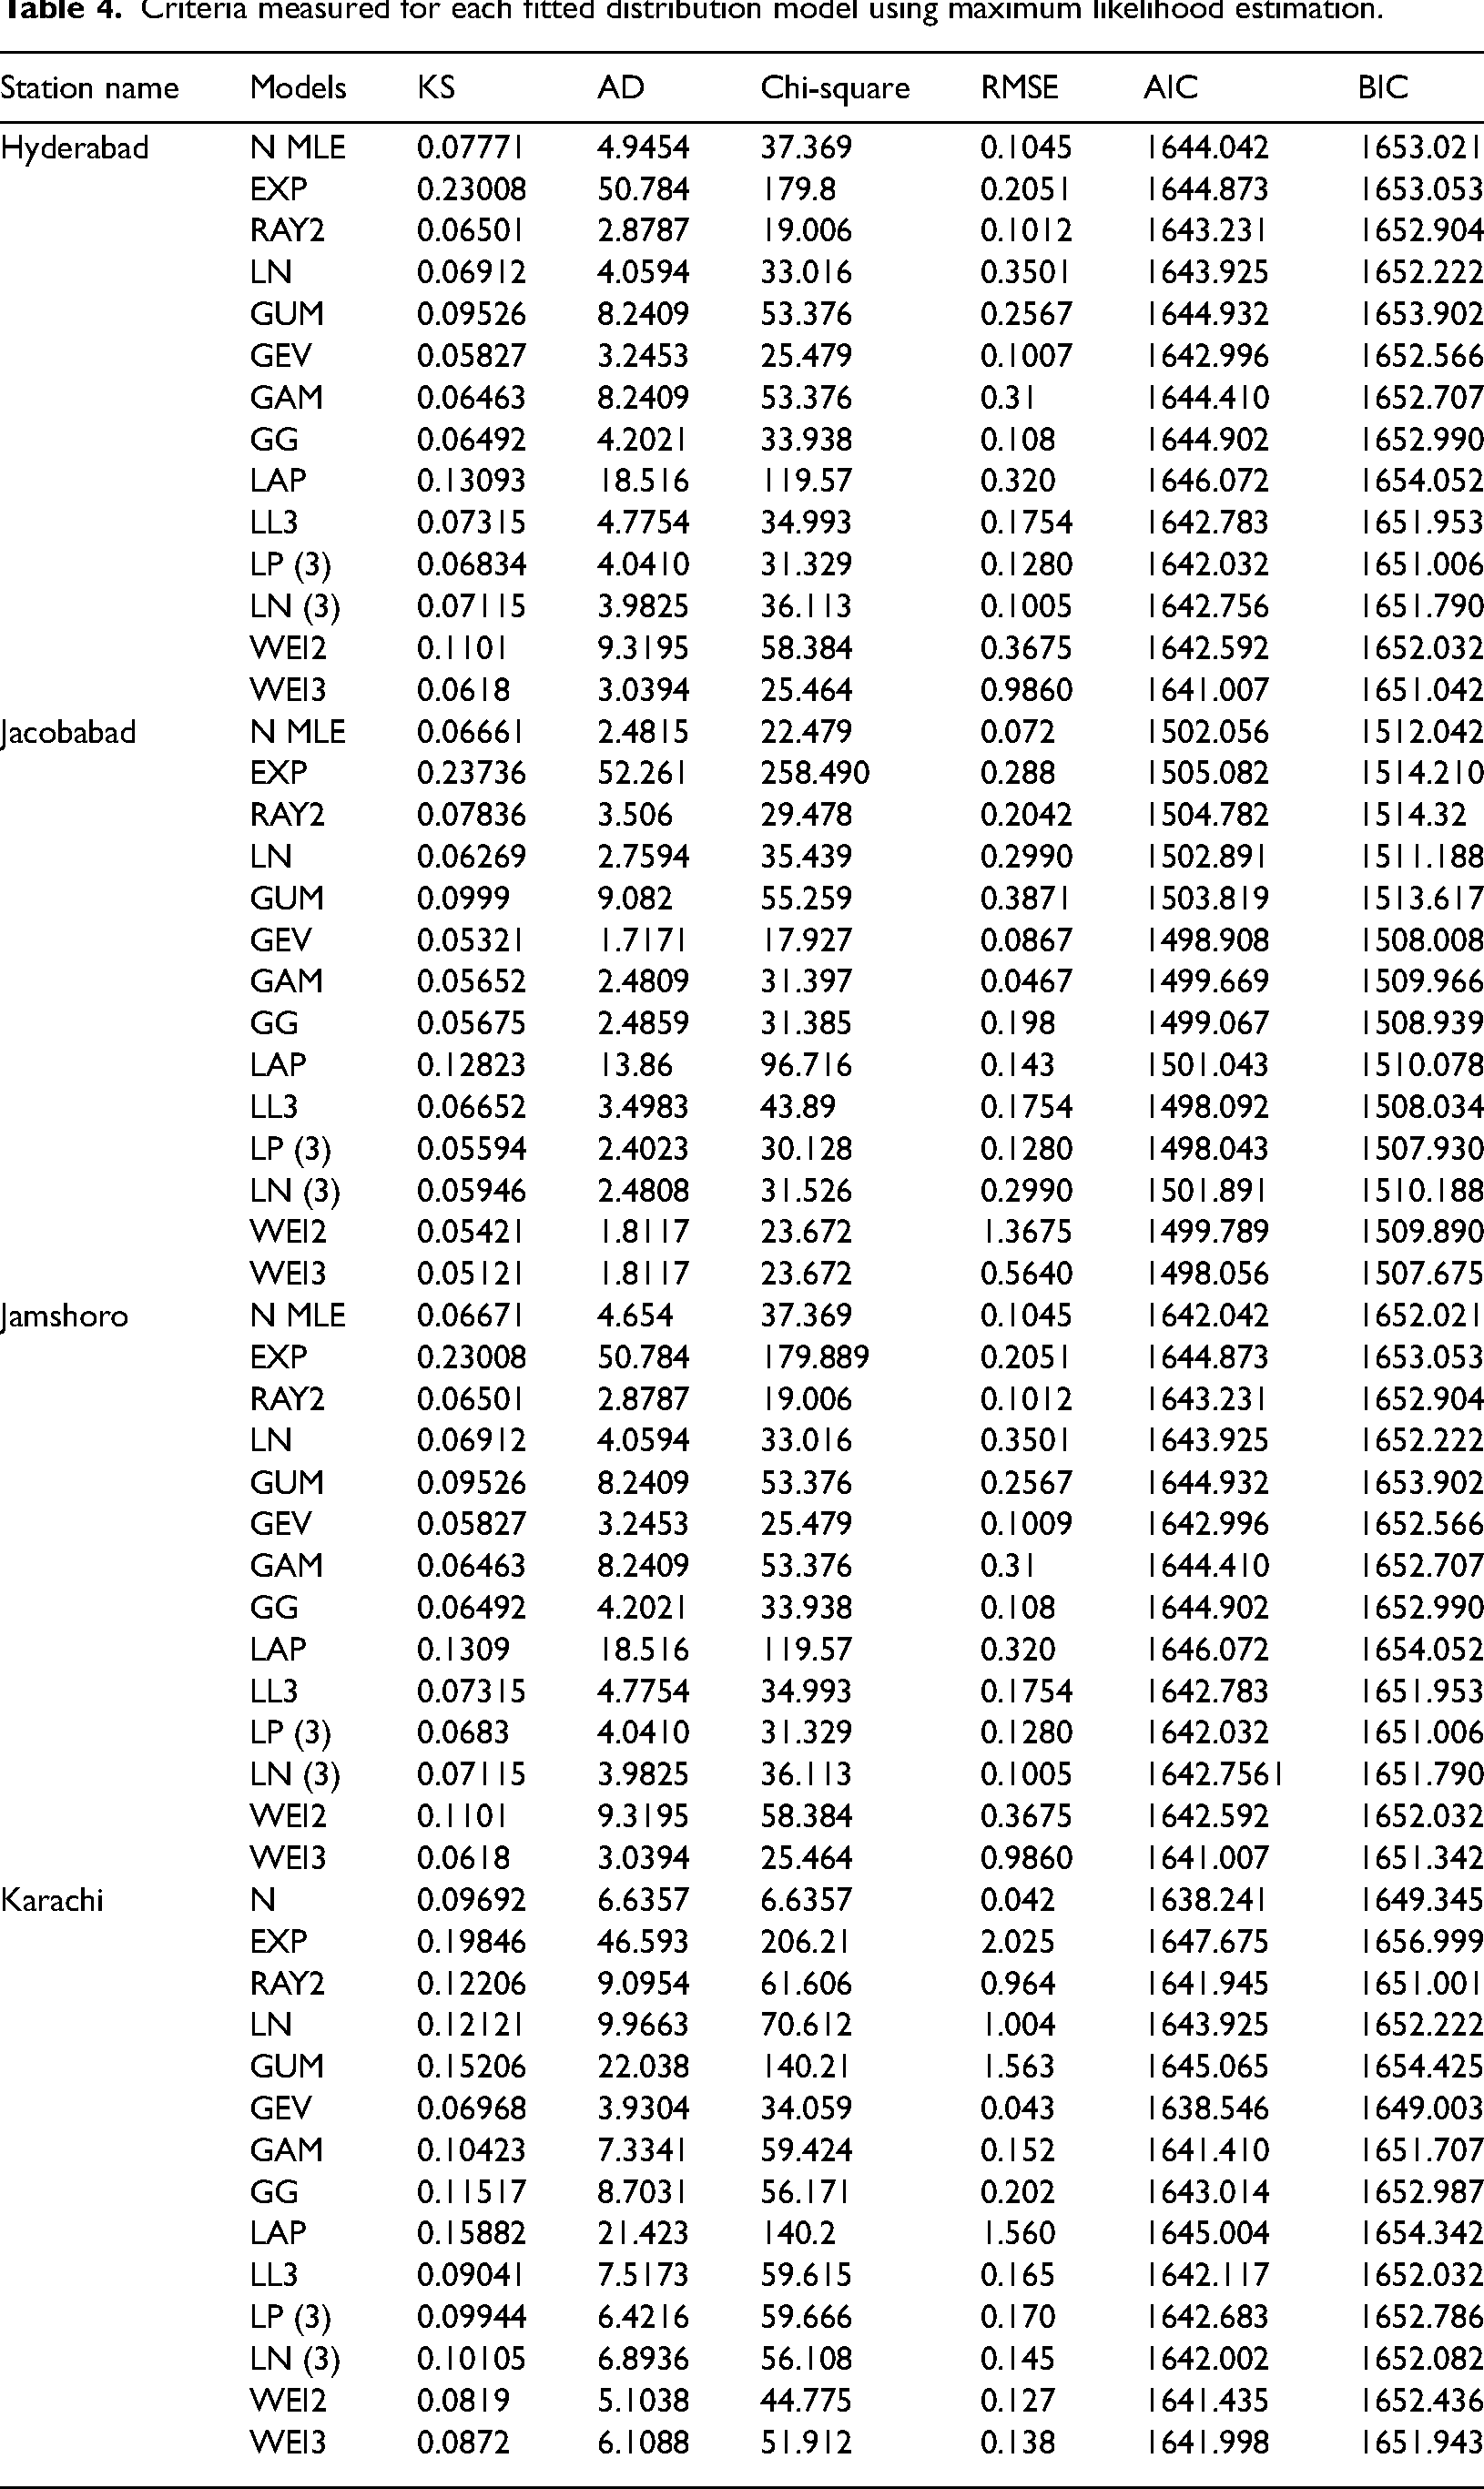
Wind speed data from Hyderabad, Jacobabad, Jamshoro, and Karachi were found to be compatible with 13 different models. Table 4 shows the outcome of the principle measured for every close-fitting distribution using MLE. The AD statistics, chi-square, and RMSE indicate that RAY2 is an appropriate model for Hyderabad. Although KS indicates that GEV and WEI3 are appropriate models, AIC and BIC indicate that WEI3 also fits the distribution. AD and chi-square statistics show that the GEV model is most fitted for Jacobabad. However, the result of KS, AIC, and BIC shows that three-parameter WEI distribution for these data is appropriate, and the result of RMSE shows that gamble distribution (GAM) is an appropriate model. For Jamshoro, the result of AD and chi-square shows that RAY2 is most suitable, and the result of KS and RMSE shows that GEV, AIC, and BIC for three-parameter WEI are most suitable. For Karachi station WEI2, generalized extreme value (GEV) distribution is most fitted distribution.
Criteria measured for each fitted distribution model using maximum likelihood estimation.
However, Table 5 shows the consequences of the suitable distribution model using LMOM. The AD and chi-square factors indicate that RAY is a fitting distribution for Hyderabad. The KS, RMSE, AIC, and BIC goodness of fit specify that GEV is a suitable distribution. AIC and BIC show that the generalize gamma (GG) model is most fitted model for Jacobabad. However, the KS, AD, chi-square, and RMSE show that three-parameter LN, WEI, and GEV, GAM are suitable models for these data. For Jamshoro, the consequence of AIC and BIC shows that the WEI model is most suitable. Kolmogorov Simonov (KS), root mean-absolute-error (RMAE), Akaike and Bayesian Information Criteria (AIC, BIC) the most fitted value is GEV, normal distribution for Karachi station.
Criteria measured for each fitted distribution model using L-moment.

Table 6 shows the result of the most fit distribution using MOM. The AD, chi-square, and RMSE show that RAY2 is an appropriate model for Hyderabad. But, KS indicates that two-parameter LN and GEV are appropriate models, and the AIC and BIC indicate that two- and three-parameter WEI distribution fits the distribution. The root mean square error RMSE, Akaike and Bayesian Information Criteria (AIC and BIC) goodness of fit shows that the gamma (GAM) distribution is best fitted for Jacobabad. However, the result of chi square shows that Generalize extreme value (GEV) for these data are suitable and the result of Kolmogorov Simonov (KS), Anderson Darling (AD), show that log normal (LN), Weibull WE3 is an appropriate model. For Jamshoro, AD and chi-square results show that RAY2 and AIC, BIC WEI3 is most suitable and KS and RMSE shows that LN and GEV are suitable. The KS, AD, RMSE, AIC, and BIC represent that WEI, and GEV is the best distribution function, and chi-square displays N is the most fitted model for Karachi.
Criteria measured for each fitted distribution model using method of moments.
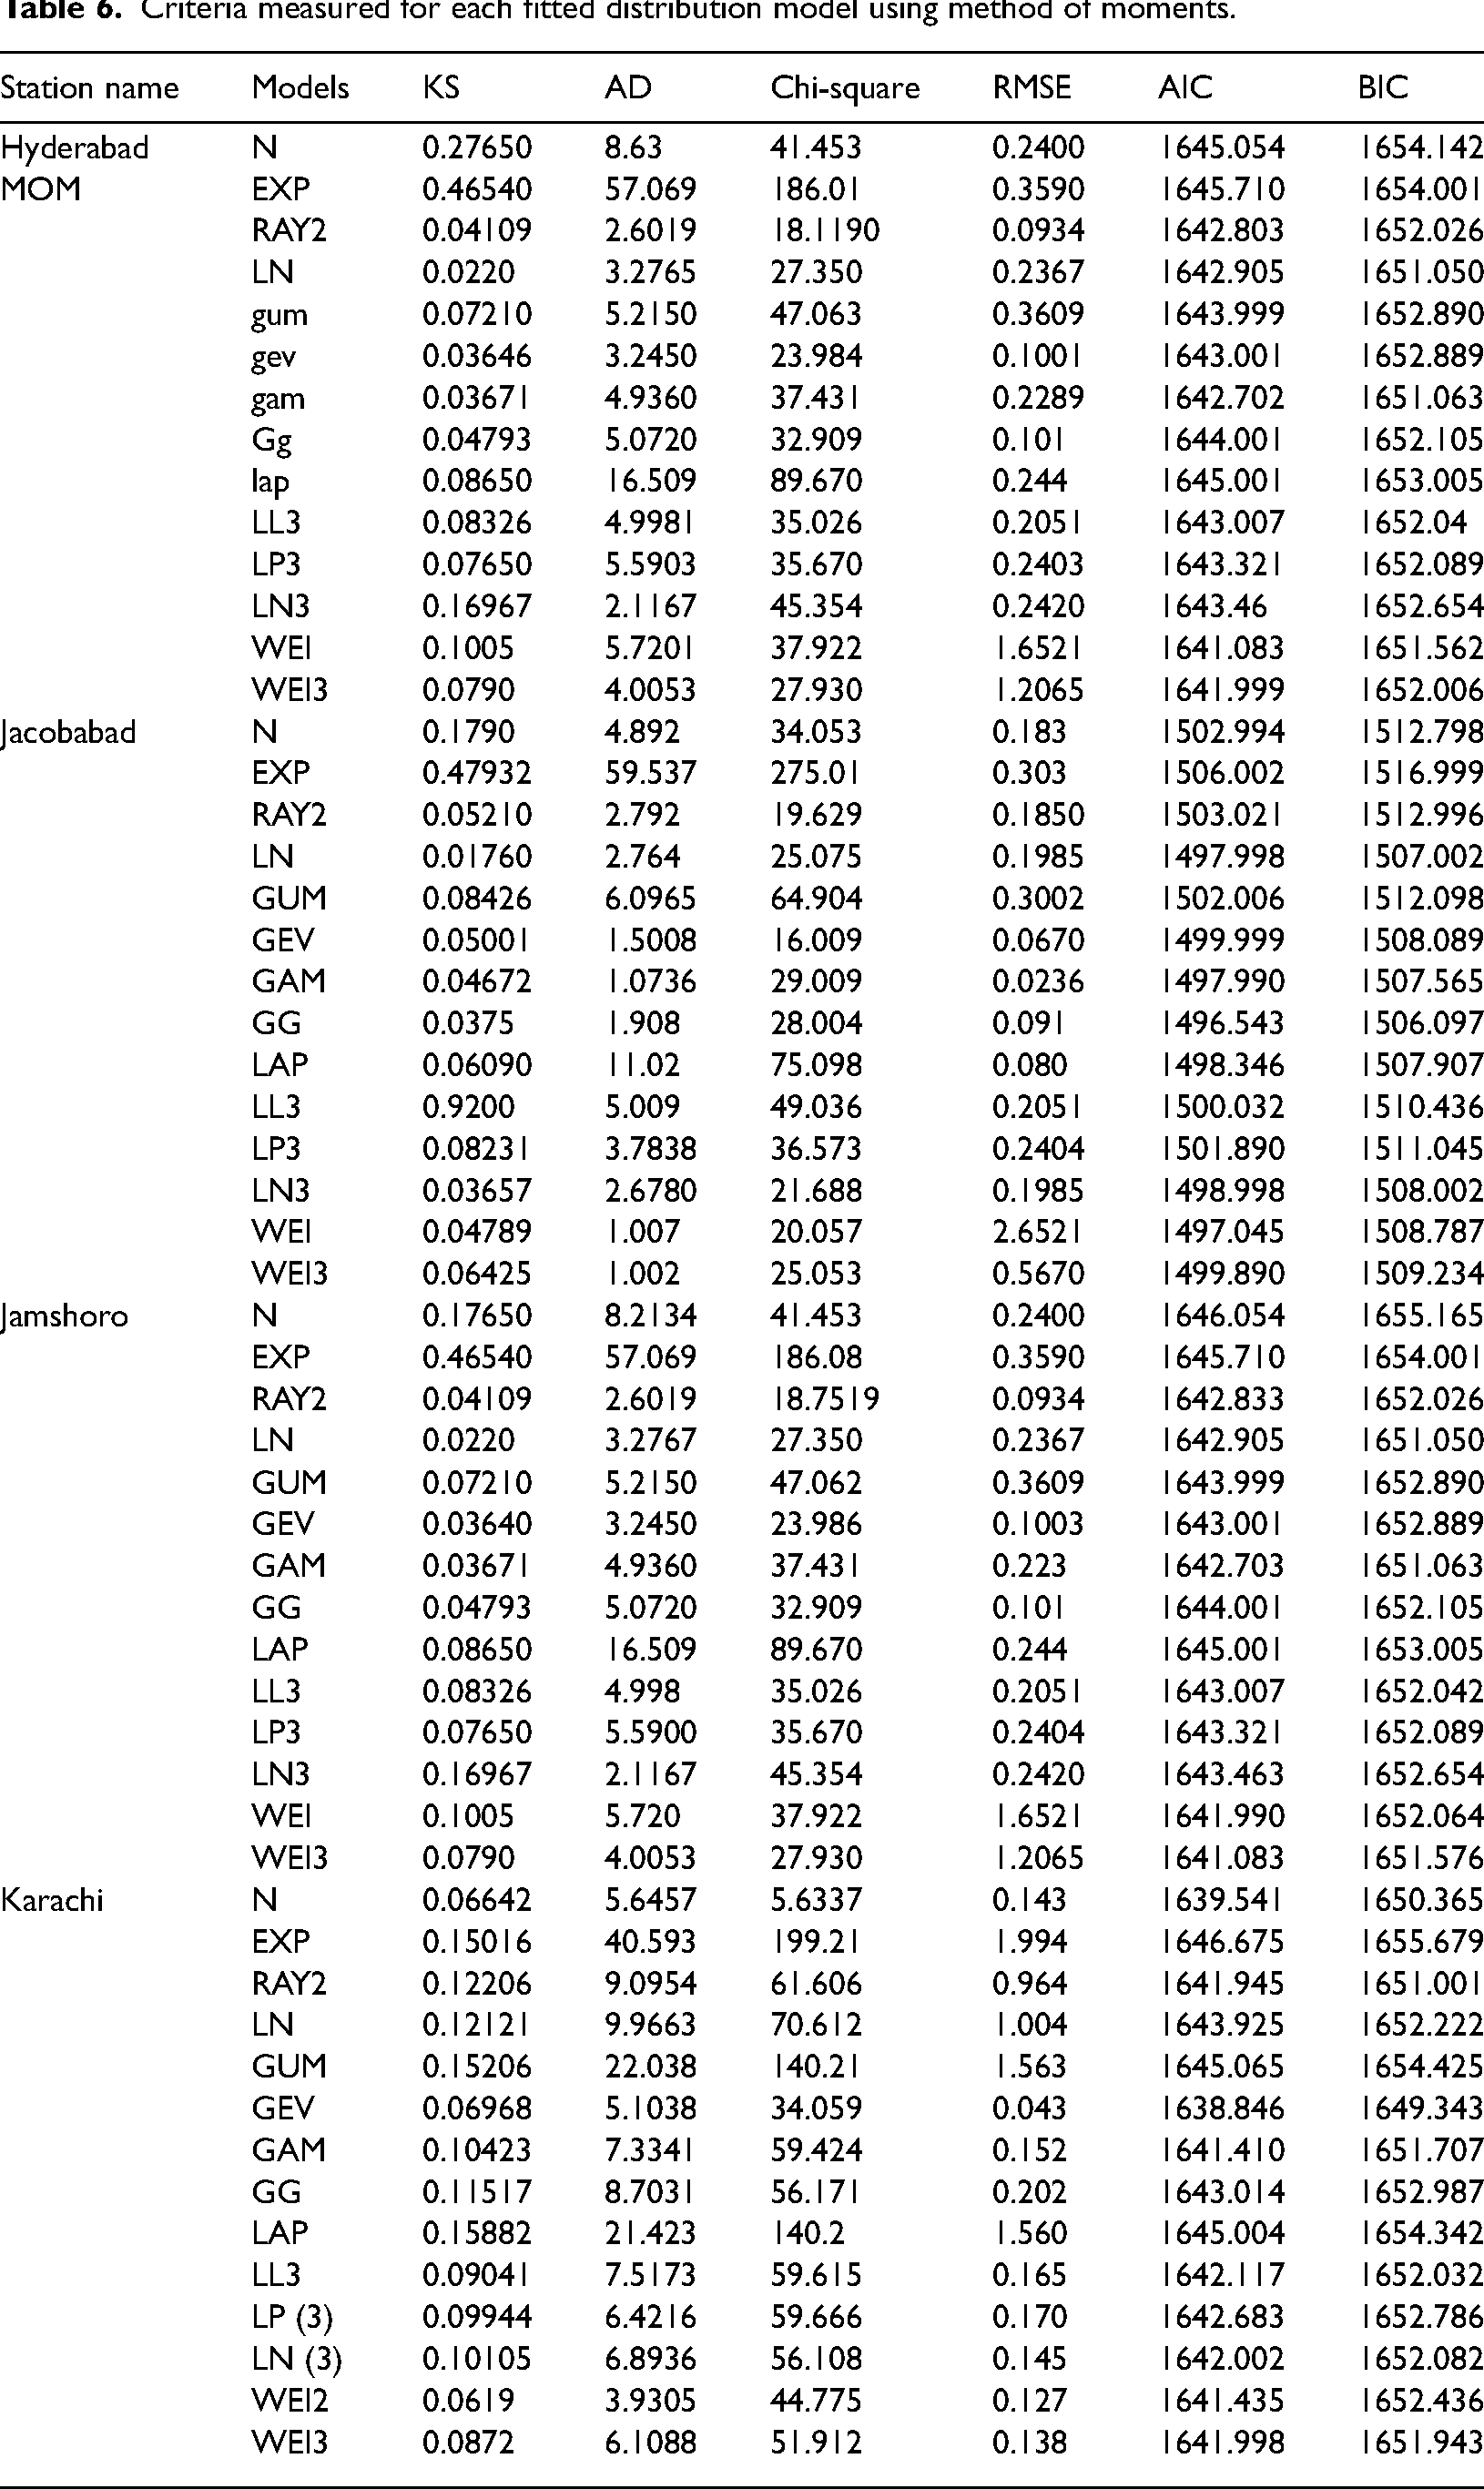
The estimated values of 12 distribution parameters for all stations and the calculation criteria are based on the long-term wind speed data considering the different methods considered. From Tables 4–6, it can be concluded that MOM is significantly better than other methods. Considering AD, KS, and RMSE, for almost all stations considered, as compared to the other methods, MOM provides better results. Although according to the criteria of chi-square, MOM is the best choice for all stations except N and EXP distribution. In terms of AIC and BIC tests, it shows pretty good performance of all stations except GEV, N, and EXP models. In summary, while all giving approaches provide nearly all consequences in terms of AD, KS, chi-square, and RMSE, for all measured wind sampling situations, MOM always provides smaller results than other methods. Therefore, MOM can be used as a better method for estimating all distribution parameters and wind energy for power applications.
In order to show that the four most suitable distribution function describe the wind speed in different ranges. Figures 2–5 show the probability plot, CDF plots, and probability difference of each fitted model by all stations. Figure 2 shows that N, RAY, WEI2, WEI3, GA, and GEV models are more suitable for data collected in Hyderabad than other distribution models. However, we can see that the difference between N, RAY, WEI2, WEI3, GA, and GEV distributions is comparatively small. In the data from Jacobabad, the same parameters can be applied to the graphical representation of Figure 3, where GAM, LL, LN, WEI3, and GEV models are appropriate distribution. In addition, for Jamshoro and Karachi, the identical distributions were applied to the graphical representation in Figures 4 and 5.

Geographic map and positions of four metrological stations in Pakistan.
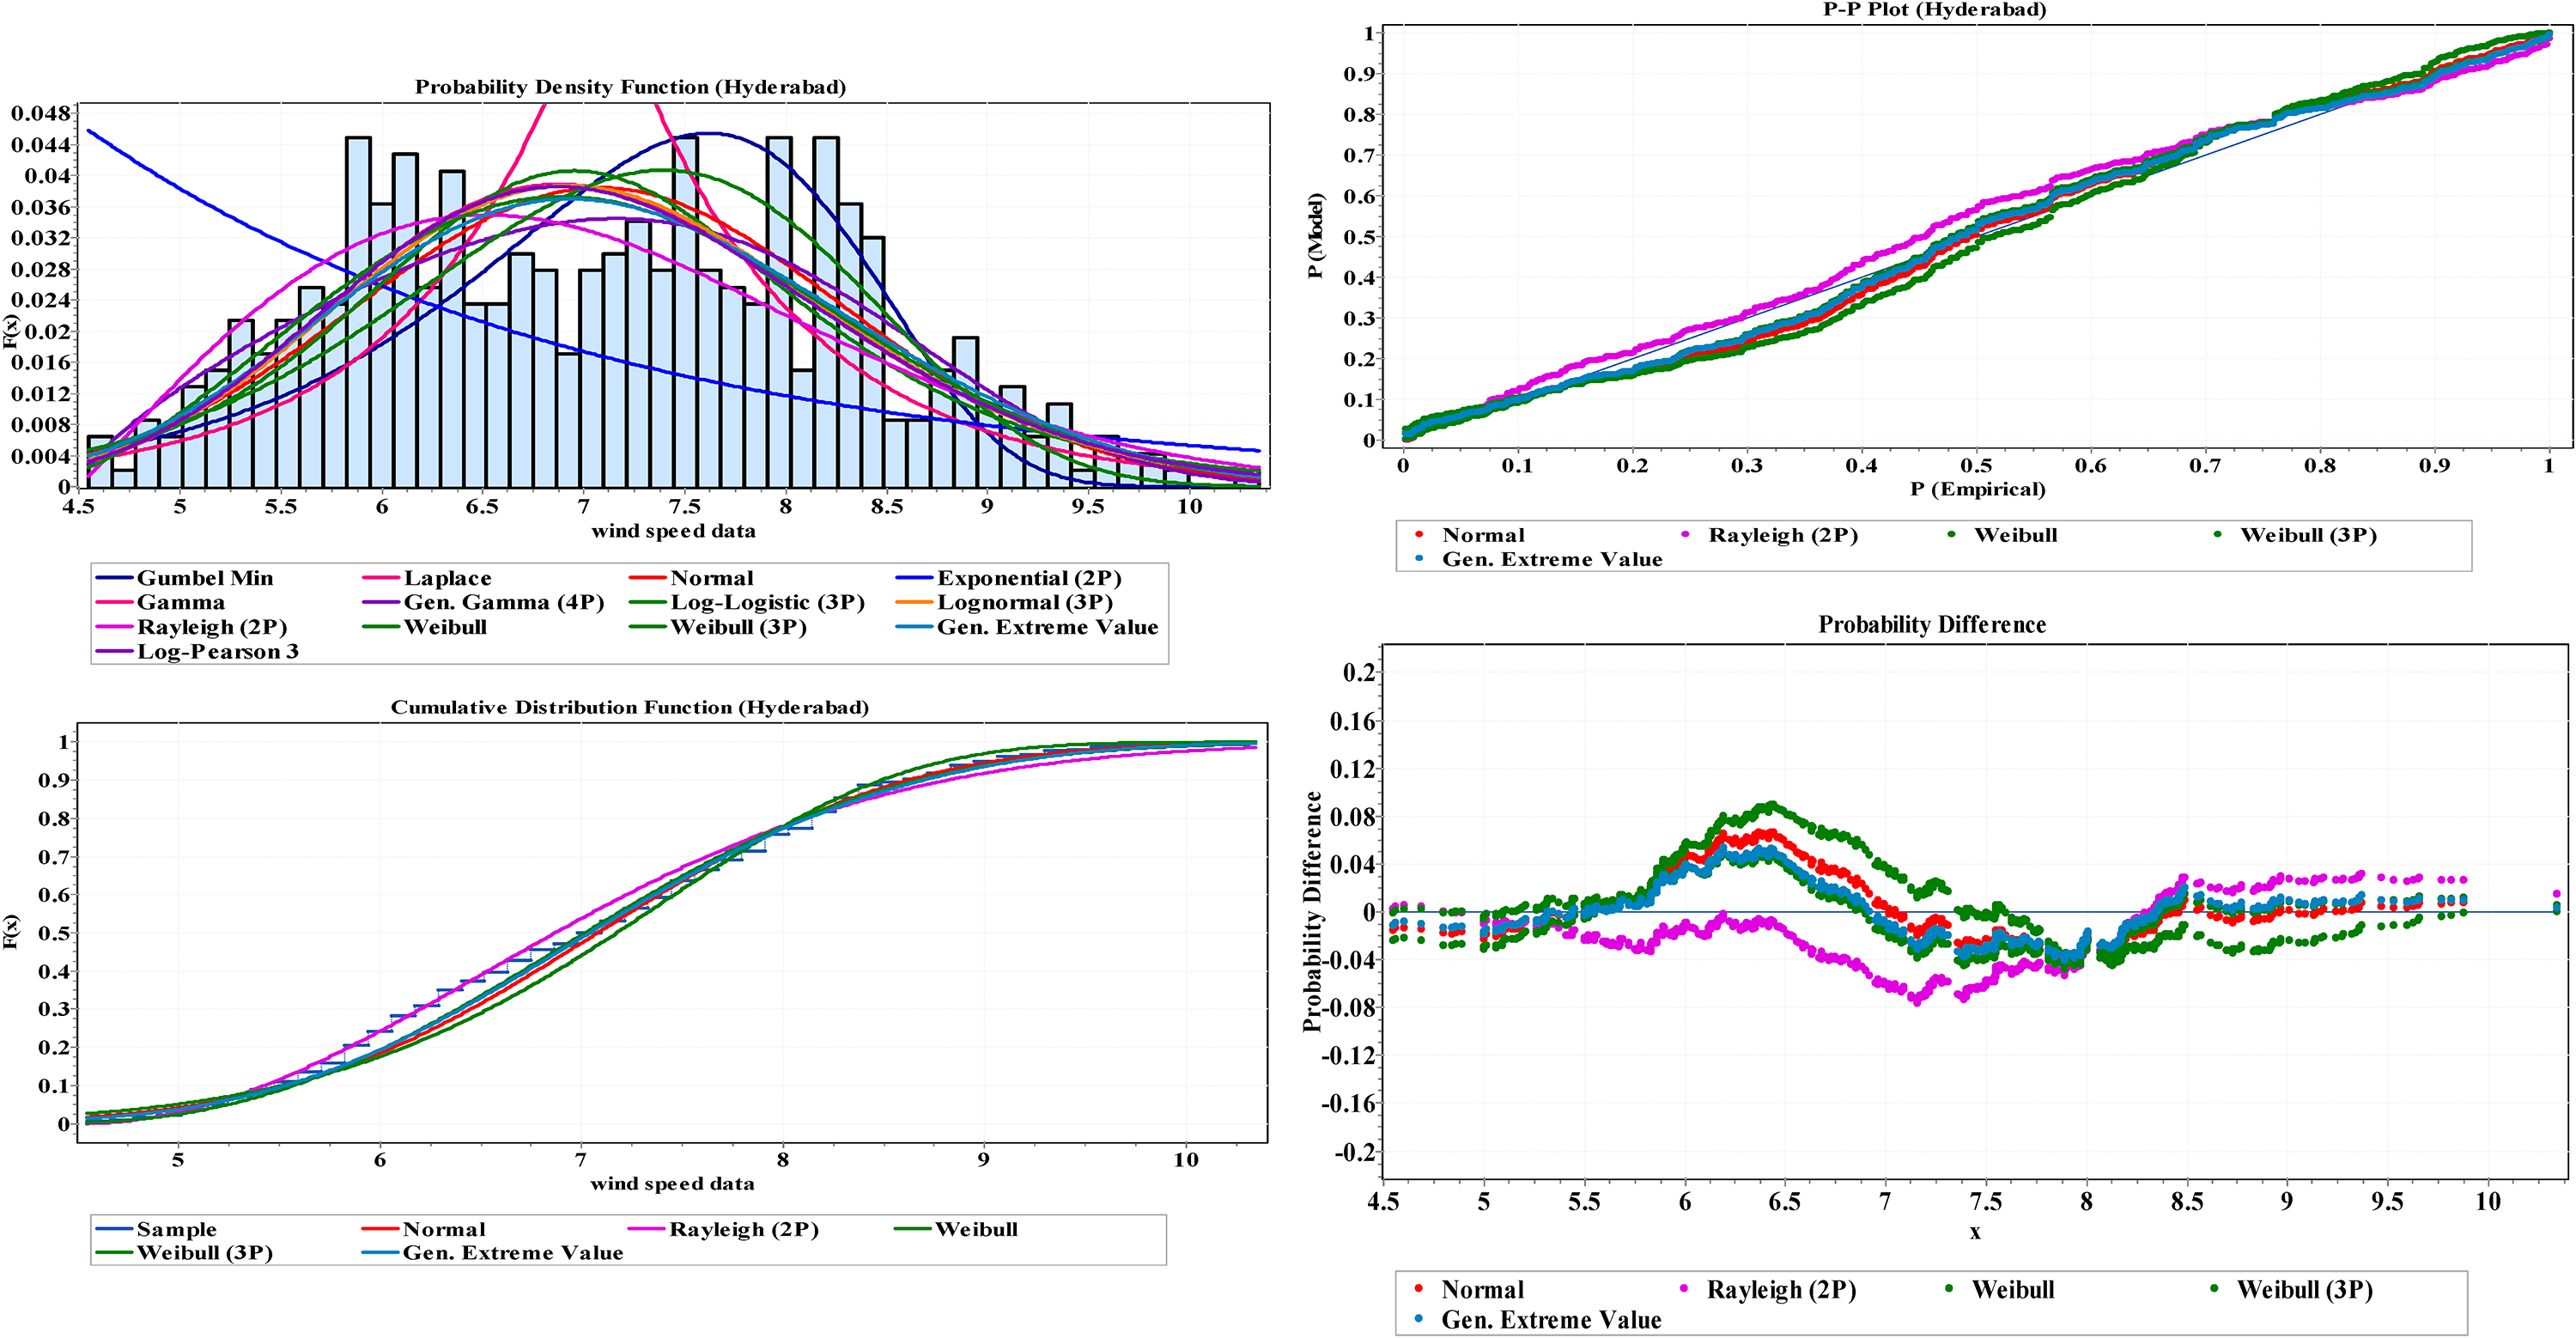
Graphical representation of the fitted distribution models of wind speed data collected at Hyderabad.
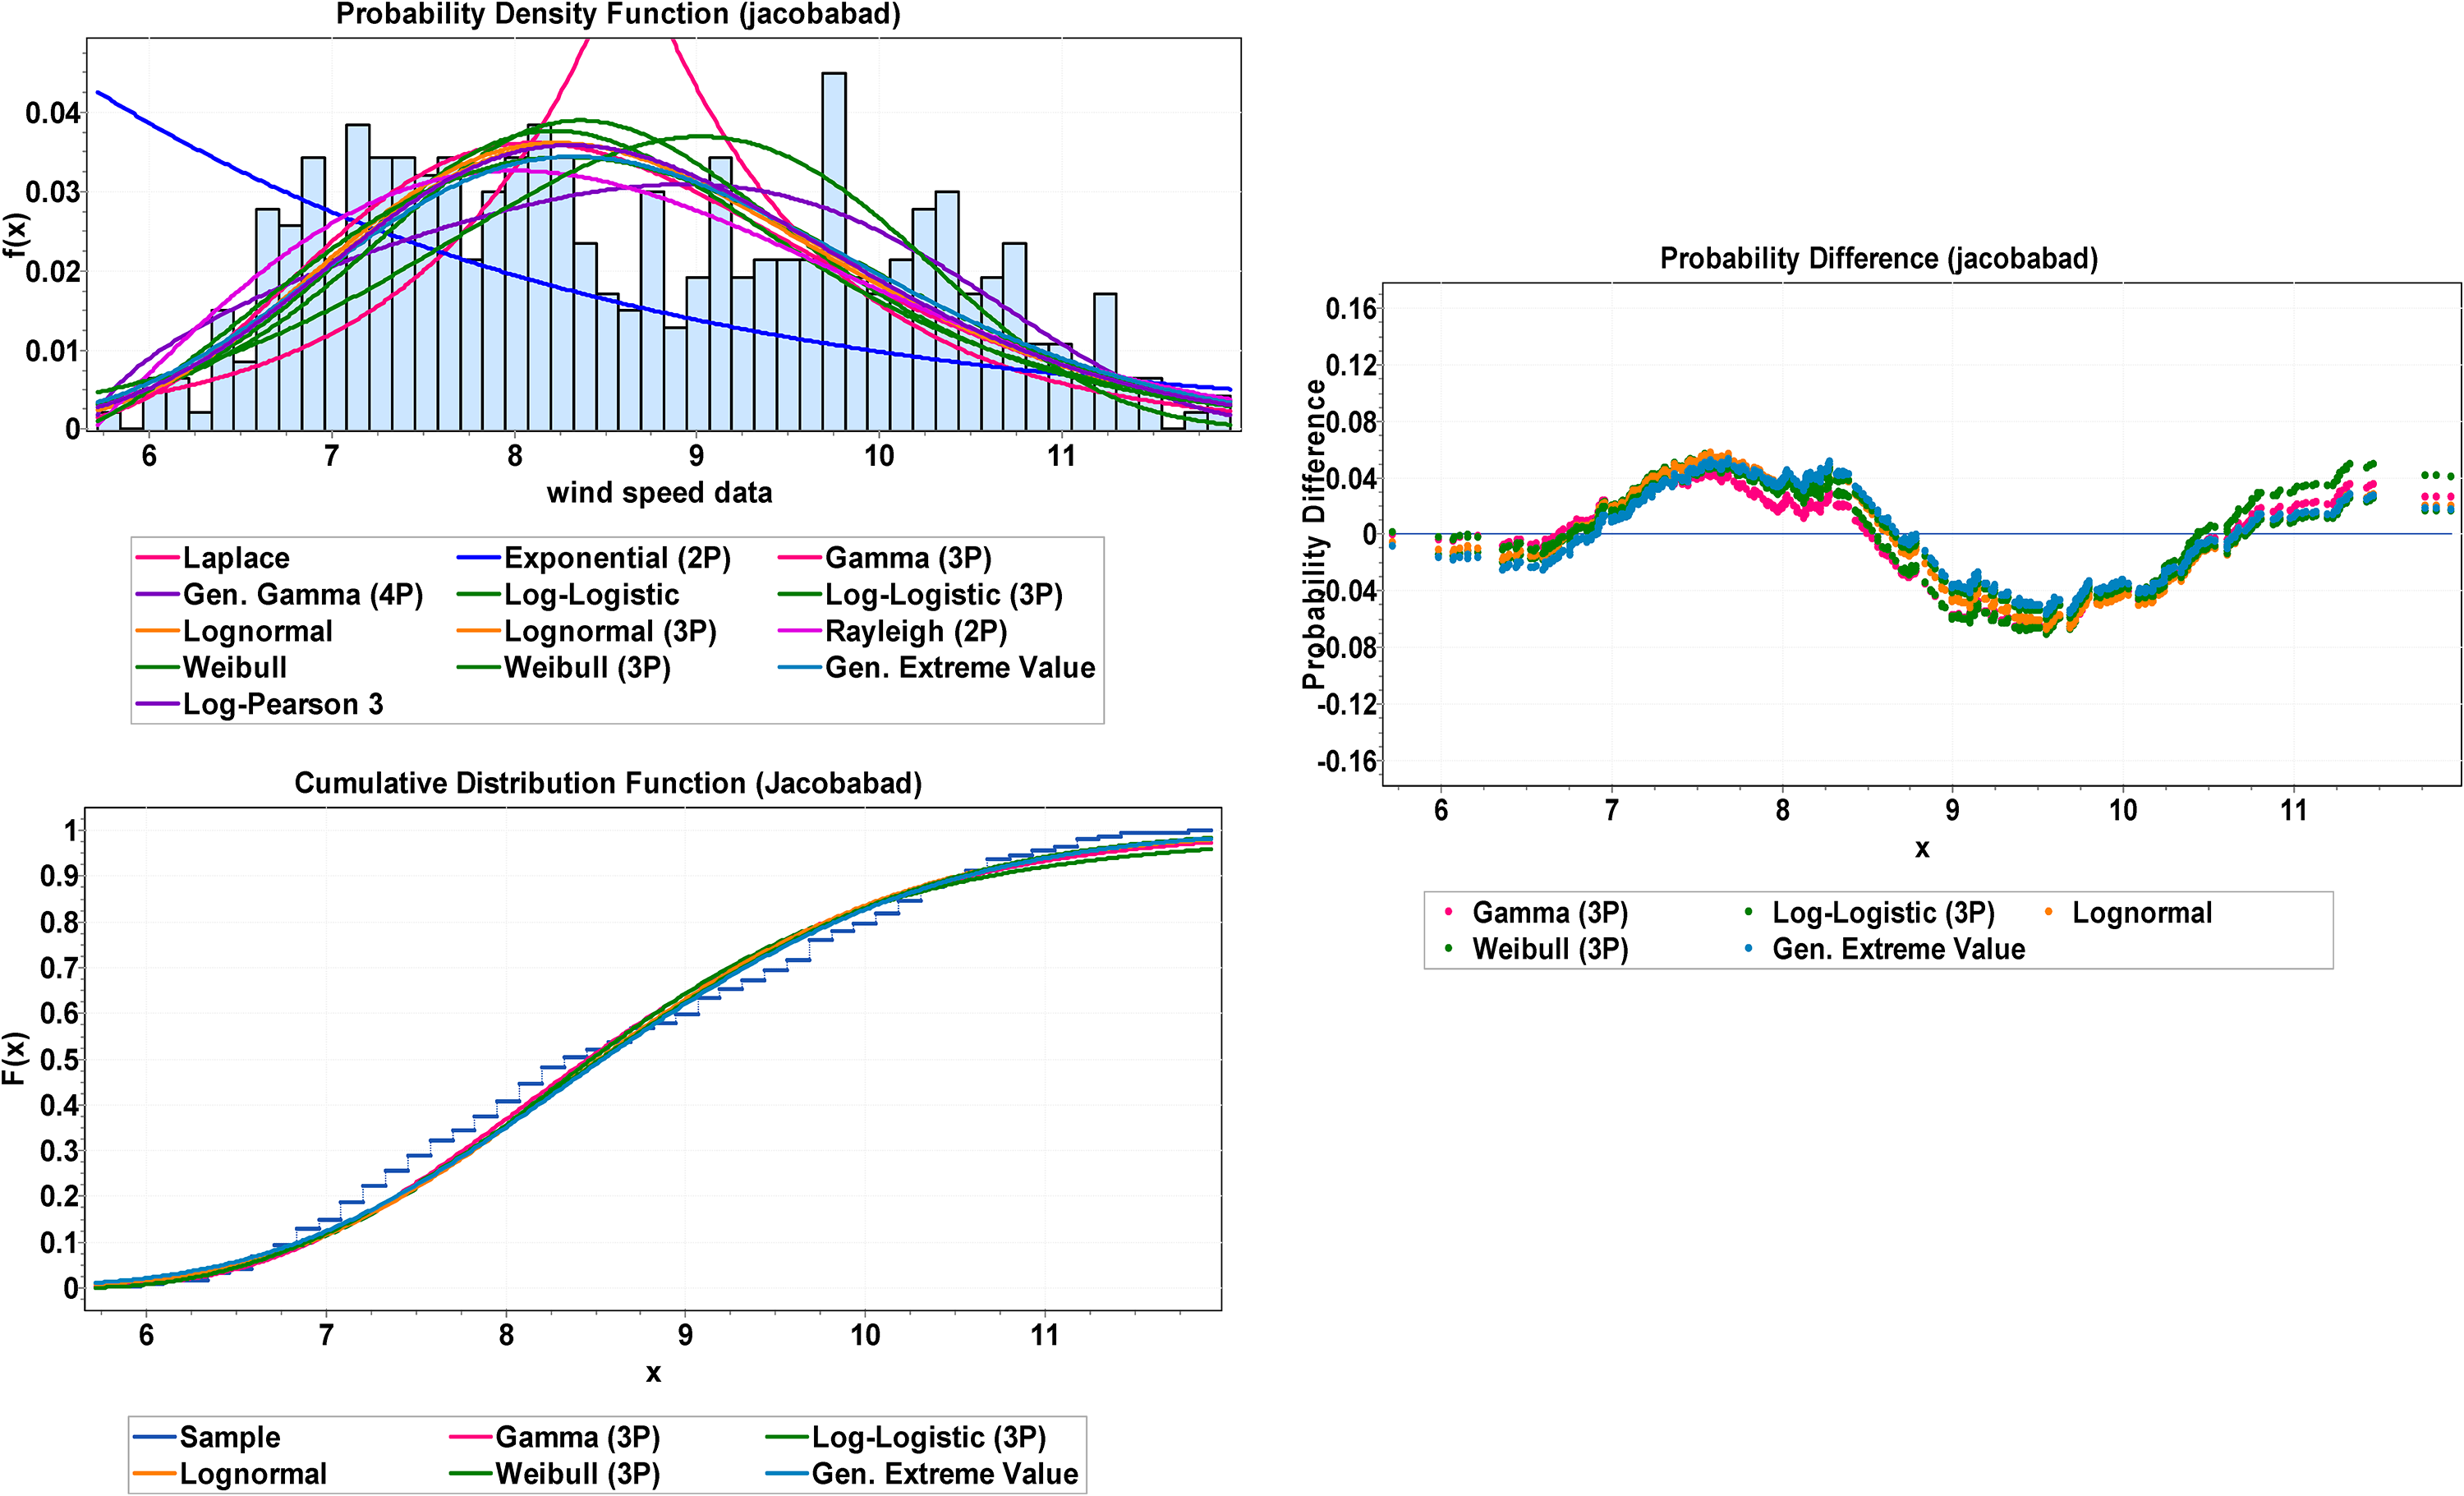
Graphical representation of the fitted distribution models of wind speed data collected at Jacobabad.

Graphical representation of the fitted distribution models of wind speed data collected at Karachi.

Graphical representation of the fitted distribution models of wind speed data collected at Jamshoro.
Conclusion
We suggest a method for wind speed data to determine the most precise distribution model. The suggested methods MLE, MOM, and LMOM combined data from numerous goodness-of-fit tests, especially KS statistics, AD, chi-square, RMSE, AIC, and BIC. The smallest final value of the distribution is recommended as the more precise model for wind speed data. The study was conducted by examining wind speed from four weather stations in Pakistan. The 13 distribution models that are most commonly used for wind speed data in Pakistan have been evaluated. The obtained result shows that our method can provide an excellent conclusive result for determining the precise distribution model of wind speed data. Considering the accurate monthly wind speed data, according to different periods and sites, the performance of standard estimation methods MLE, MOM, and LMOM is studied. According to expectations, for all the data considered, MOM is significantly better than other methods based on small values as compared to other methods. In addition, the MOM has shown quite the best performance on the best of the measured data. Furthermore, the graphic representation produced to verify systematic results is consistent with the results obtained by the analysis of multiplicative combination.
This study also includes some recommendations and suggestions for future research and development, which are given below.
In the future, the methods of MLM, MLE, and MOM may be compared with other estimation methods, such as least square moments (LQ-M), partial L-moments, and least square estimation.
A study might be conducted based on a comparison between at-site frequency analysis and regional frequency analysis. The results of these analyses can be used to select better wind speed design criteria for the protection and maintenance of wind speed in Pakistan.
Footnotes
Acknowledgements
The authors would like to thank their respected reviewers, especially Yejuan Wang, for their valuable comments and suggestions that significantly improved this paper.
Authors' contribution
Tasir Khan contributed to data collection and analysis, Yejuan Wang helped in the analysis and prepared first draft. All authors contributed to the study conception and design.
Ethical statement
All experimental procedure were approved by the Animal Welfare and Ethics Committee of Lanzhou University (LZU-201805-224).
Data availability statement

Consent for publication
All the authors agree to publish this paper.
Consent to participate
Because this study involves no living organisms or their products, participant consent is not required.
Declaration of conflicting interests
The author(s) declared no potential conflicts of interest with respect to the research, authorship, and/or publication of this article.
Funding
The author(s) received no financial support for the research, authorship, and/or publication of this article.