



Abstract
This study aims to analyze the risk spillover effects between the global crude oil market and the biofuel ethanol and corn markets in China, employing a DCC-GARCH-Copula-CoVaR model and basing the weekly price data from 2012 to 2021. The empirical results revealed that there were dynamic conditional correlations among international crude oil, China's biofuel ethanol, and corn markets. Following the COVID-19 outbreak, the CoVaR and ΔCoVaR changed, which caused a sharp increase in the mean values and volatility. Additionally, China's biofuel ethanol market is more vulnerable to the risk spillovers from the international crude oil market than China's corn market. However, China's markets do not appear to have obvious risk spillover effects on the global market. The implications of the results are discussed in financial market supervision, including the risk management and portfolio adjustment.
Introduction
It has got a common view of sustainable development of natural resources in order to address the climate change issue globally. Many countries launched different projects or established related policies to accelerate the energy transition. In the case of China, after President Xi declared the 30–60 target of carbon peaking and carbon neutrality, a thoughtful revolution is performing in China's society. Bioenergy, a key well-known renewable energy to replace traditional fossil fuels, which is an important component of China’s long-term strategic plan to save resources, mitigate reliance on imported energy, and promote sustainable development, has occupied a large space in the 14th Five-Year Plan of China's renewable energy development. 1 Chinese biofuel ethanol programs contribute to several national air pollution management initiatives with ambitious carbon emission targets and policies. Significantly, ethanol is the only biofuel having large-scale commercial applications and received official attention from China's policymakers. 2 However, different with Brazil in which biomass energy are mainly made from sugarcane, even though China is the third-largest ethanol producing and consuming country, with a 2,740,000 t production of biofuel ethanol in 2020, over 60% of its bio-ethanol production was corn-based ethanol, according to the American Renewable Fuels Association (RFA), which implicates the relationship between the corn market and ethanol consumption market cannot be ignored.3–5 In fact, most of the researchers have paid much attention to the problems of competing food with people and competing fields with food when developing the biofuels in China. But few of them considered the influence from the international energy market.
Just starting from 2009, China has been promoting the market-oriented reform of refined oil market, biofuel market, and agricultural commodity market step by step and making them in line with the international markets (crude oil market, etc.). 6 It is well documented that market opening can increase the domestic market's sensitivity to the volatility of the foreign market. Especially, price fluctuations caused by external shocks, such as COVID-19, may also result in risk spillovers. 7 The frequent occurrence of tail risk events, such as the Sino–US trade war in 2019 and the global epidemic outbreak in 2020, has led to sharp fluctuations in international crude oil prices and food prices, and has caused a more serious impact on the fragile biofuel market.7, 8 In terms of oil prices, since the outbreak of the COVID-19 epidemic, both international and domestic oil prices have experienced a “V-shaped” reversal: the price of Brent crude oil futures fell during the period from January to June 2021, with a maximum decline of 79.37%, and then climbed all the way up, reaching a maximum of US $83.54 per barrel by November 2021, with an increase of 483.79%; In terms of corn price, since the outbreak of the epidemic in January 2020, the CBOT has shown a “anti N” significant fluctuation. As the domestic corn market is not as open and linked as crude oil, the domestic corn price has shown a unilateral upward trend for a year, rising from RMB 1911 per ton to RMB 2849 per ton in January 2021, with the highest increase of 49.08%, and has declined slightly since the beginning of the autumn, which have seriously affected the production order and living consumption.
However, there is no sufficient information of international crude oil on China's corn and biofuel ethanol markets, which is vital to the healthy development of the whole energy system in China. Therefore, to fill this gap, this paper is to investigate the intertwined relationships of international oil prices, China's domestic corn and biofuel ethanol prices, and further explore the complexity nature of risk spillovers between foreign and domestic markets.
The remainder of this paper is organized as follows: The literature review is in the second section. The methodology is introduced in the third section. The data and descriptive statistics are presented in the fourth section. The empirical results are discussed in the fifth section. Then the conclusions and suggestions are offered in the sixth section 6.
Literature review
Much effort has been made to quantify the relationships and dynamic volatilities of energy and food markets.9–11 Based on the literature review, we found that most of the existing studies discussed the bilateral relationship between two markets, such as fossil energy and food,12–14 food and biofuels,15,16 biofuels and fossil energy17,18 of domestic markets. With a high level of marketization, price volatility is always regarded as a proxy variable for the risks of market dynamics.18,19 Studies based on liberal market-oriented countries’ domains, but they gave controversial results. For example, Dimitriadis and Katrakilidis revealed both long-term and short-term causal relationships from the corn market to the crude oil market in the United States from 2005 to 2014. 20 Robles and Cooke found a negative relationship between crude oil prices and grain prices. 21 However, Taghizadeh-Hesary et al. found that food prices responded positively to oil price increases for eight Asian countries during 2010–2016. 22
It is easy to understand the causal link from the crude oil market to the agricultural market, since crude oil prices are always seen as a predetermined factor of agricultural commodity prices.23,24 For the theoretical mechanism of grain market to oil market, Ciaian and Kancs well documented two possible channels, input channel and biofuel channel, through which oil prices might be influenced by agricultural market prices. 25 On the input channel, it indicates that an increase in agricultural production can lower the demand for fuel, which implies that falling food prices can result in falling oil prices. For the biofuel channel, it has two diametrically opposed effects. On one hand, since some agricultural products (such as corn, soybeans, etc.) are inputs for biofuel, a decline in agricultural prices will result in biofuels being more affordable and appealing. Considering oil is one of the major inputs for agricultural commodities, an increase in demand for biofuels will result in increased biomass production and oil prices. On the other hand, rising biofuel production will result in more energy being available overall, which will lead to lower oil prices. But this theory is still lack of empirical evidences due to some limitations, such as data. 26
Some scholars conducted research on the relationship of the three markets since biofuels have seen significant global growth in recent years as a clean energy substitute for fossil oil to reduce carbon emissions.3,5,27 Serletis and Xu discovered the close relationship between the crude oil market and the biofuel raw material (corn) market, and the ethanol policy strengthened volatility and spillovers of the two markets. 28 Dimitriadis and Katrakilidis also discovered long-term and binary causal relationships between crude oil and corn prices, as well as ethanol and corn prices and crude oil prices. 20 But there is a lack of studies in the case of China. Several papers with a common researcher, Haixia Wu, introduced the financial econometrics method to study the co-movements of China's oil, biofuel, and corn markets in terms of price volatility and risk spillovers.27,29 However, the sample period of such studies is from 2003 to 2013. The data generation process cannot transmit the real market signal, because only after 2009 did China start the market reform of the oil, agricultural products market and ethanol industry, which means that only the data samples after 2009 can be used in the financial measurement model. Therefore, their results lack practical significance. And it only characterized the market dynamics but neglected the risk spillover.
In addition, spillover effects from international market to domestic market have attracted most attention with more and more global extreme events happening.12,13 Most studies have fully explored the characteristic of extreme risk spillover between energy and grain markets during the financial crisis. For example, Dahl et al. 30 showed that in the before-2006 sub-sample, the price fluctuation transmission between crude oil and agricultural products was very weak, but the information asymmetry and dual direction risk transition were intensified during the financial crisis. Lu et al. 31 also discovered a significantly altered change in the dynamics of volatility spillovers in the US crude oil and agricultural products market after the 2008 financial crisis. It found a two-way volatility spillover effect between the crude oil market and the agricultural products market as the crisis occurred. While in the late stage of the crisis the risk spillover changes, only the medium- and long-term volatility of the corn market was transmitted to the crude oil market, and the crude oil market had no spillover effect on agricultural products. Furthermore, Hanif et al. 32 studied the nonlinear dynamic correlation and risk spillover effect between the international energy market and the international grain market, and found the asymmetric risk spillover between the two markets. 32 When most researchers attached importance to the crossing borders effects, lots of researchers began to conduct research on market volatility and risk spillover effect of the international energy on domestic agricultural products market,12,13 international energy market and the domestic financial market, 33 domestic new energy market,34,35 or domestic grain market and biofuels. 36 After the shock of global public health crisis in the beginning of 2020, the international crude oil market showed sharp fluctuations,37,38 which also aroused some chain effects on other types of markets and showed different characteristics than ever.7,39 But such kind of research is in the very early stage. The characteristics of COVID-19's shock on different markets and their co-movements are not fully captured. Musa et al. 40 used ARDL and VECM models, and Hung 37 used the wavelet coherence method to investigate the effects of the COVID-19 pandemic, both before and after it, on global food and crude oil prices. They both found a strong correlation between international crude oil price and international grain price during the COVID-19 pandemic, but the spillover effects of agricultural products market to the crude oil market over time have significant heterogeneity, which means it needs in-depth analysis of COVID-19 shock on different market prices and their relationships.
Above all, it can be seen as a consensus that fundamental factors, such as natural disasters, geopolitical events, supply demand of oil, and the increase of biofuels production, all of which are interrelated, will have combined effects on the volatility of the markets.41,42 What's more, we found most of the current studies were based on liberal market countries. As we argued before, with the advancement of China's market-oriented reform process, the interaction between domestic and foreign markets has increased, and the links between international crude oil, domestic bio-ethanol and corn markets must be enhanced, which will pose huge challenge of the risk management of energyfood system. It is believed, on one hand, that China's case can be good to other developing countries that are undergoing reform and open. On the other hand, China's energy market has a nontrivial role in the world economy, which reveals the research significance.
In general, this paper not only helps to provide new evidence for the development of biofuel energy in China before and after COVID-19, but also conducts applied research on price volatility and spillover effects, for which this methodology may have some implications for other market dynamics and risk analysis.
Methodology
As to the modeling, GARCH (generalized autoregressive conditional heteroskedasticity) series models, such as EGARCH, BEKK-GARCH, and DCC-GARCH, are always used to detect the volatility of markets or between markets.43,44 Value at Risk, that is
In this section, the dynamic conditional correlations between the international crude oil market and China's corn and biofuel ethanol markets are modeled by using a DCC-GARCH model. Then, the joint distribution of these markets is obtained by using Copula-CoVaR models to estimate the
Marginal distribution modelling
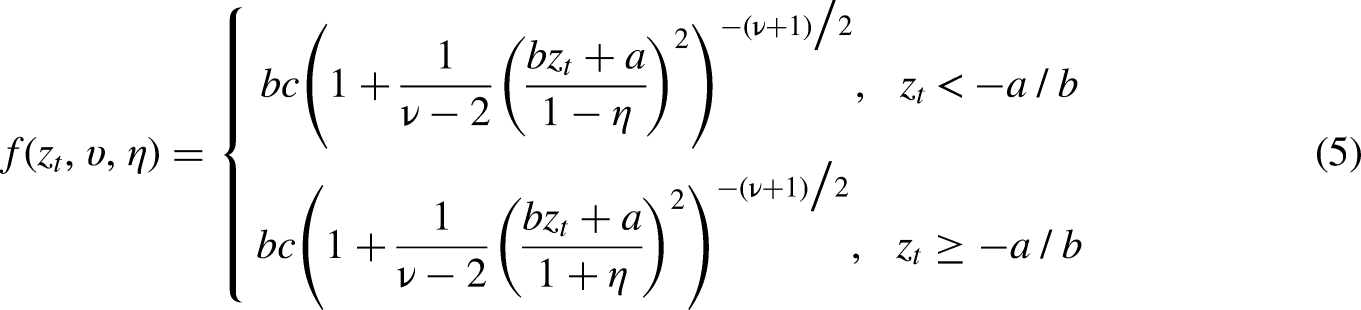
We calculate the marginal distributions for international crude oil and China's corn and biofuel ethanol markets, by using an ARMA(1,1)-GJR-GARCH(1,1) model. The returns series



Bivariate Copula modelling
According to Sklar's
54
theorem, for bivariate time series





DCC-GARCH specification
In addition to utilizing the Copula model to estimate the joint distribution, Engle's 55 DCC specification is also an important method for capturing the dynamic conditional correlations and calculating the values of CoVaR.
The details of the DCC-GARCH model are illustrated as



Estimation of coVaR and ΔCoVaR
In this section, the
Recall that the unconditional

Accordingly, the






Data and descriptive statistics
In this paper, we mainly adopt weekly data of international crude oil, China's corn, and fuel ethanol frequency price series, ranging from January 6, 2012 to December 24, 2021, which are collected from the financial database IFind (Tong Hua Shun). At present, only the prices of ethanol 93 # and ethanol 97 # products are provided in the IFind database. The price of ethanol 93 # is selected here mainly according to the Notice on Adjusting the Price of Denatured Fuel Ethanol (FGBNY 2011 [316] Document1) issued by the National Development and Reform Commission of China in February 2011.2
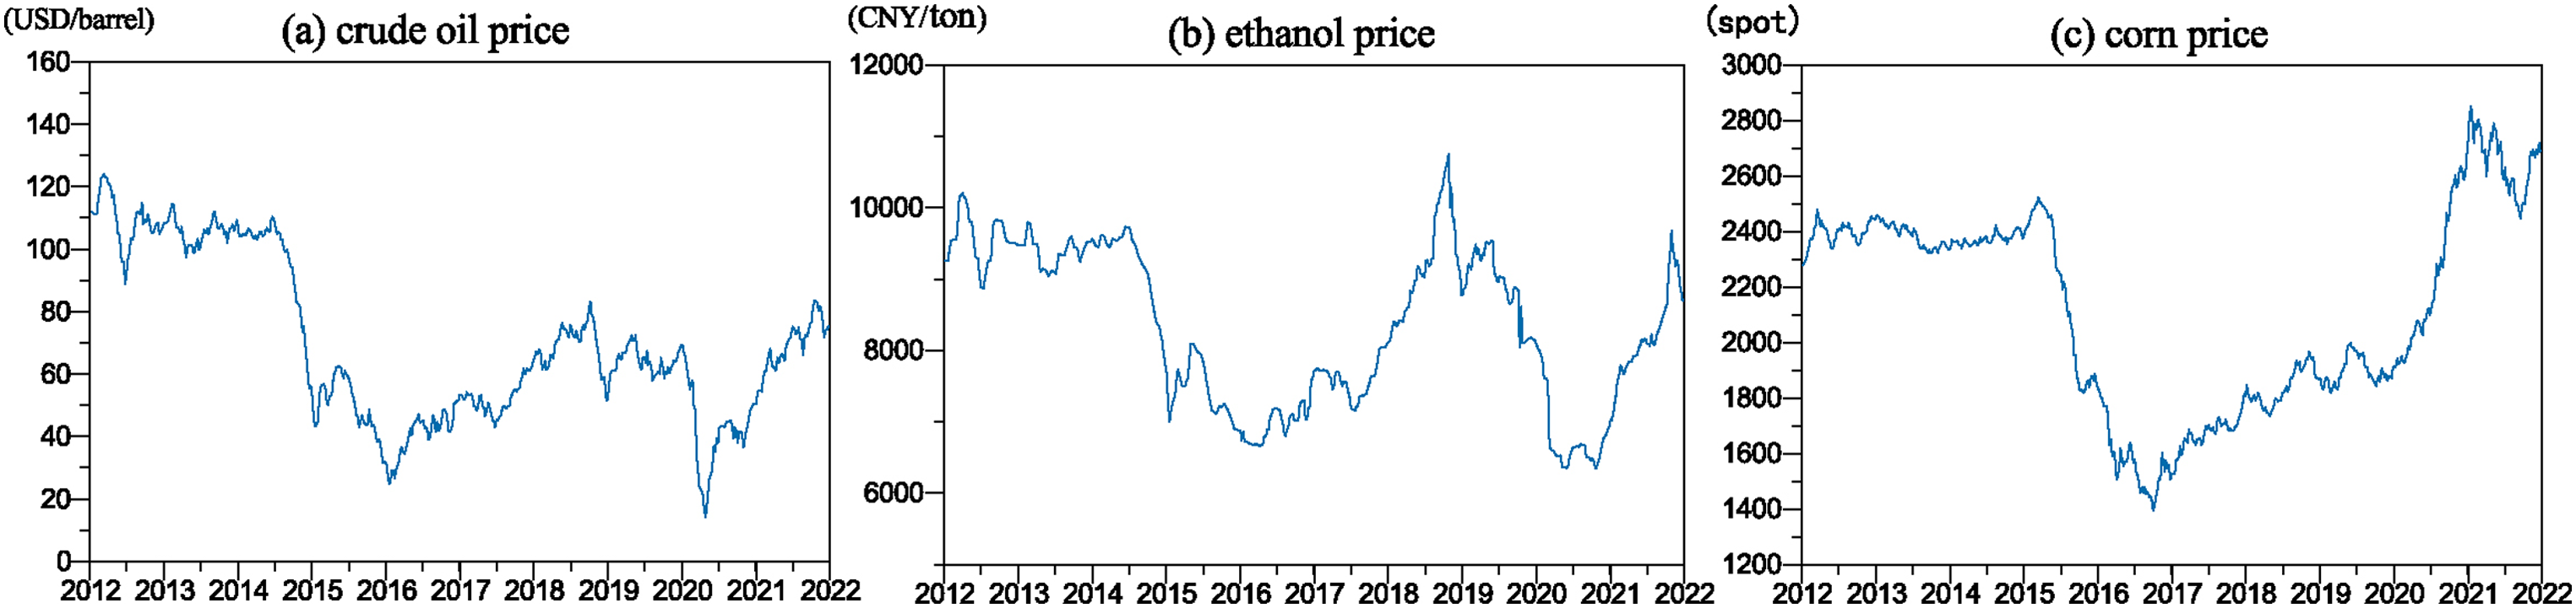
In detail, the international crude oil price selects the Organization of Petroleum Exporting Countries (OPEC) basket crude oil spot price (USD per barrel), the fuel ethanol price selects the spot wholesale price (CNY per ton) of fuel ethanol in China, and the corn price selects the corn futures index settlement price (spot) of the Dalian Commodity Exchange. We dropped some missing data to make a balanced panel data sample of three markets, and finally, we got a 521-sampling data. Figure 1 displays the price trends of three markets during the sample period.
Price trends of crude oil, biofuel ethanol and corn from 2012 to 2021.
According to Figure 1, the markets for China's corn, biofuel ethanol, and international crude oil are somewhat interconnected. It is evident that thethree markets frequently face price fluctuations and trend convergence, particularly between 2012 and 2018. More precisely, from 2012 to 2014, prices in all three markets were roughly steady, fell drastically from 2014 to 2016, and then slowly recovered after 2016. As a result, all three markets have gone through “U-shaped” ups and downs since 2014. Furthermore, during COVID-19 in 2020, the price of foreign crude oil fell from 80 USD per barrel to 15 USD per barrel, and the price of China's biofuel ethanol also fell from a high of 10200 CNY per ton to 6400 CNY per ton. The price of China's corn, on the other hand, has risen steadily from 1800 CNY per ton to 2800 CNY per ton. Those significant swings demonstrate how natural disasters, such as COVID-19, can affect price fluctuations and market correlation.
It should be noted that here we employ the weekly price rather than the daily price because only weekly (or even half-monthly) data are available for biofuel ethanol in China. In order to ensure accurate and stable statistical characteristics, after Wu and Li
27
, we also adopted the logarithm of the first order difference of prices in the adjacent two weeks to reduce the measurement error. In statistics, the results of the overall trend of price volatility and risk spillover are not affected theoretically. The formulas we used are as follows:

Descriptive statistics of price returns of crude oil, biofuel ethanol and corn.
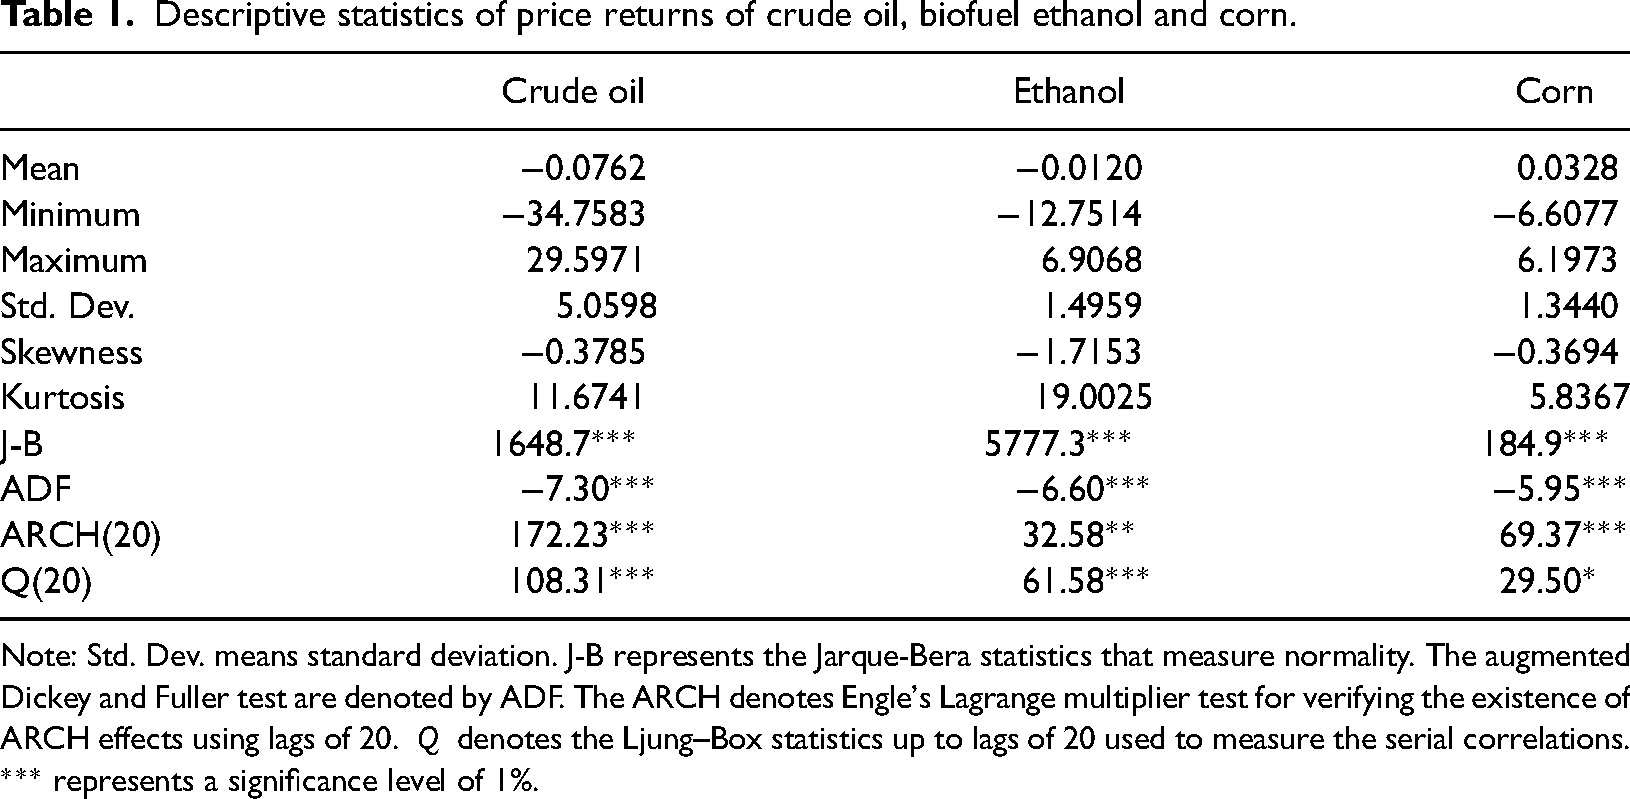
Note: Std. Dev. means standard deviation. J-B represents the Jarque-Bera statistics that measure normality. The augmented Dickey and Fuller test are denoted by ADF. The ARCH denotes Engle's Lagrange multiplier test for verifying the existence of ARCH effects using lags of 20.
From Table 1, the mean values of price returns in the three markets are all extremely close to zero. However, the negative skewness of each return series suggests that markets all have a high likelihood of negative return trends. At the same time, all return series have a coefficient of kurtosis that is much higher than three, indicating that normality does not exist and the data have a heavy tail. According to the results of the Jarque-Bera test, it shows that all the price return series violate the normal distribution rule at the 1% level of significance. As shown in Table 1, all the return series reject the hypothesis that there is a unit root according to the ADF test, suggesting they are stationary. In addition, only when there is clear conditional heteroscedasticity in the disturbance term can the volatility be calculated through the ARCH or GARCH model. Generally, the ARCH test can be used to assess whether a time series exhibits conditional heteroscedasticity. According to the result of the ARCH test, each return series exhibits heteroskedasticity and volatility clustering with the ARCH effect. Finally, the Ljung–Box test for serial correlation demonstrates that there are no correlations in the standardized residuals (Q).
Results and discussion
Estimation of the marginal model
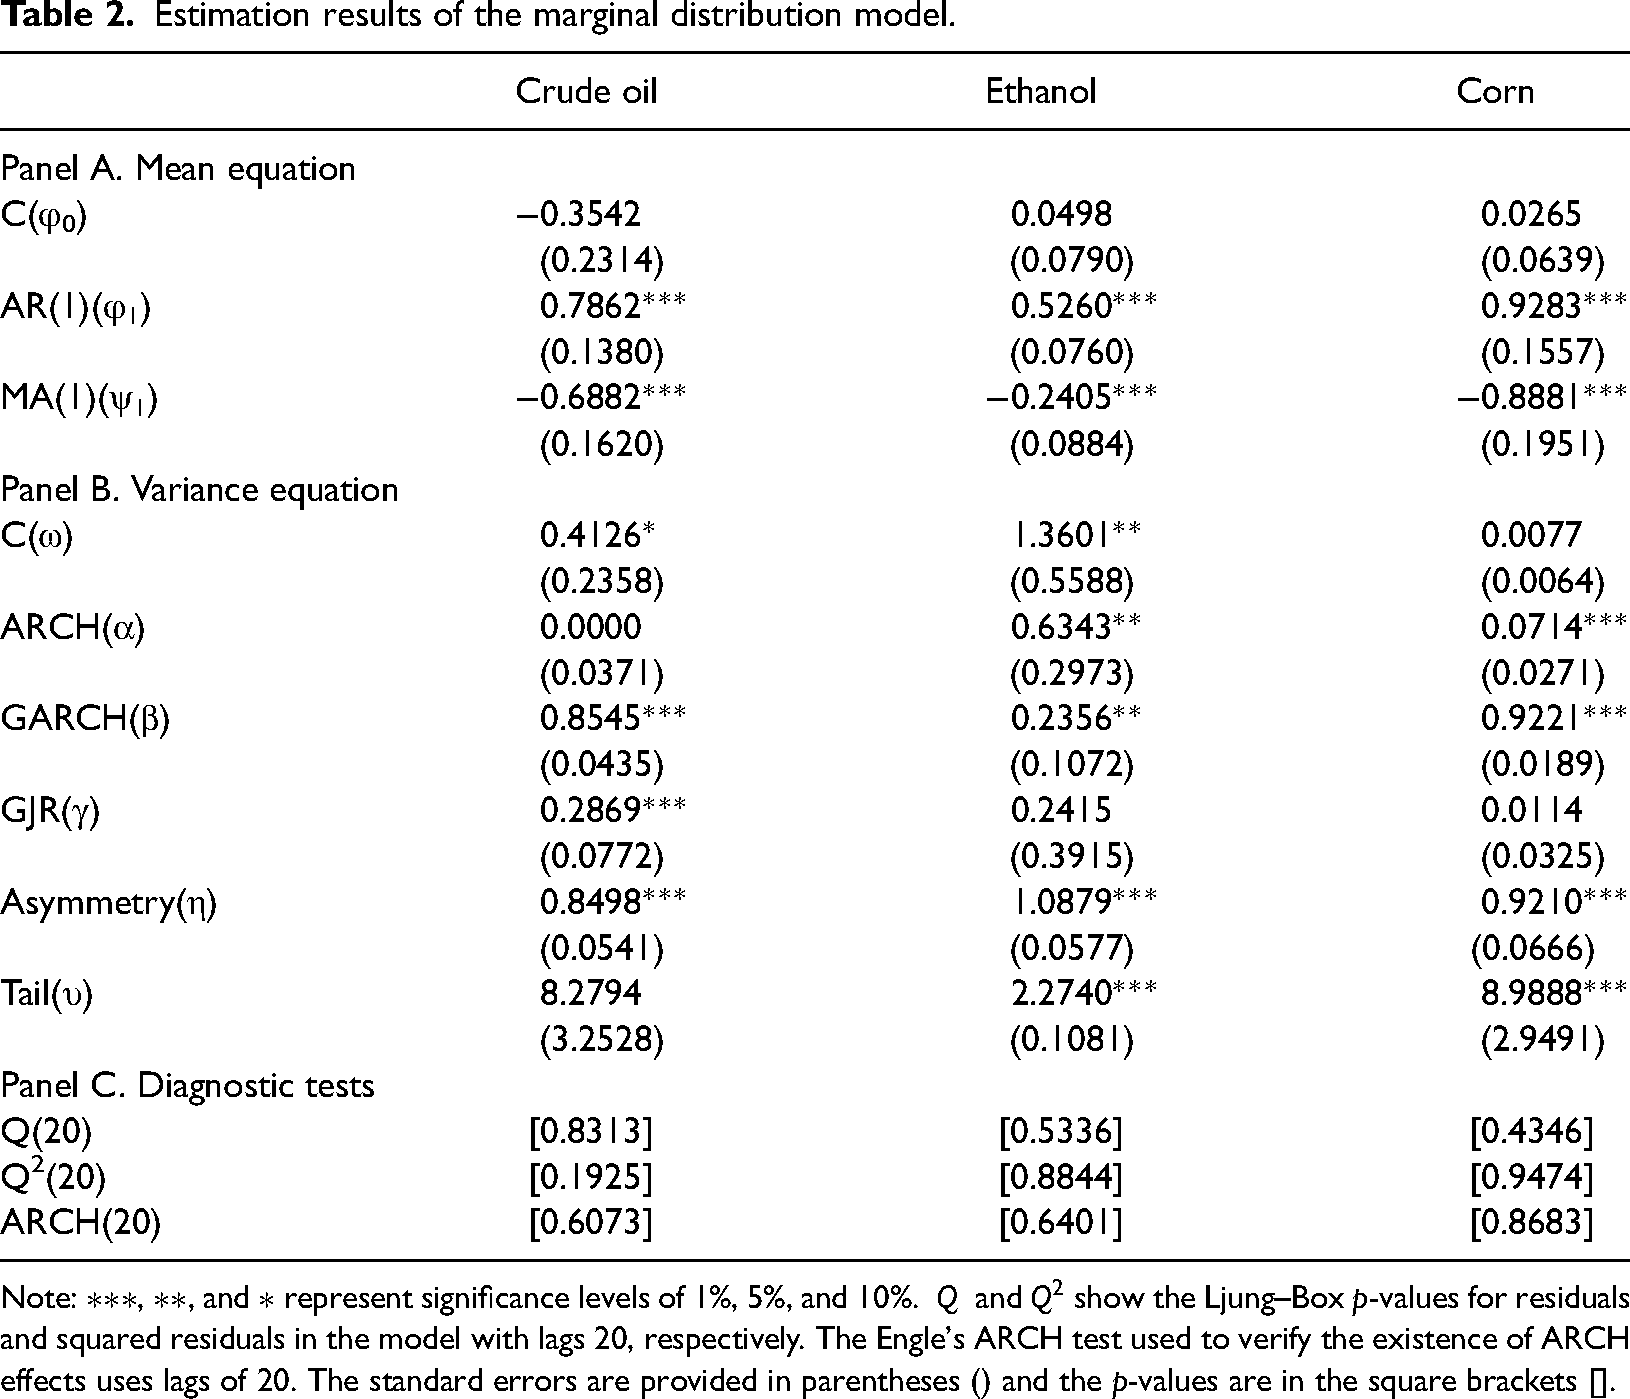
Table 2 lists the different parameters' estimation of ARMA(1,1)-GJR-GARCH(1,1) marginal model. They used to quantitatively depict correlations and marginal distributions of random variables, which can character risk spillover of crude oil, biofuel ethanol and corn markets.
Estimation results of the marginal distribution model.
Note:
As displayed in Panel A of Table 2, it can be concluded that price volatility in previous weekly returns can swiftly affect current returns based on the statistical significance at the 1% level of the coefficients of the lagged terms AR (1) and MA (1) for all series.
Turning to Panel B, it can be summarized that return distributions are asymmetric and the heavy tail is biased to the right. Because the coefficient
Panel C displays the goodness-of-fit results for the model. There is no evidence of autocorrelation based on the Ljung–Box tests for serial correlation in the standardized residuals (Q) and squared standardized residuals (Q2). And there are no ARCH effects in the model residuals being proved by the ARCH-LM test.
Estimation of Copula and DCC models
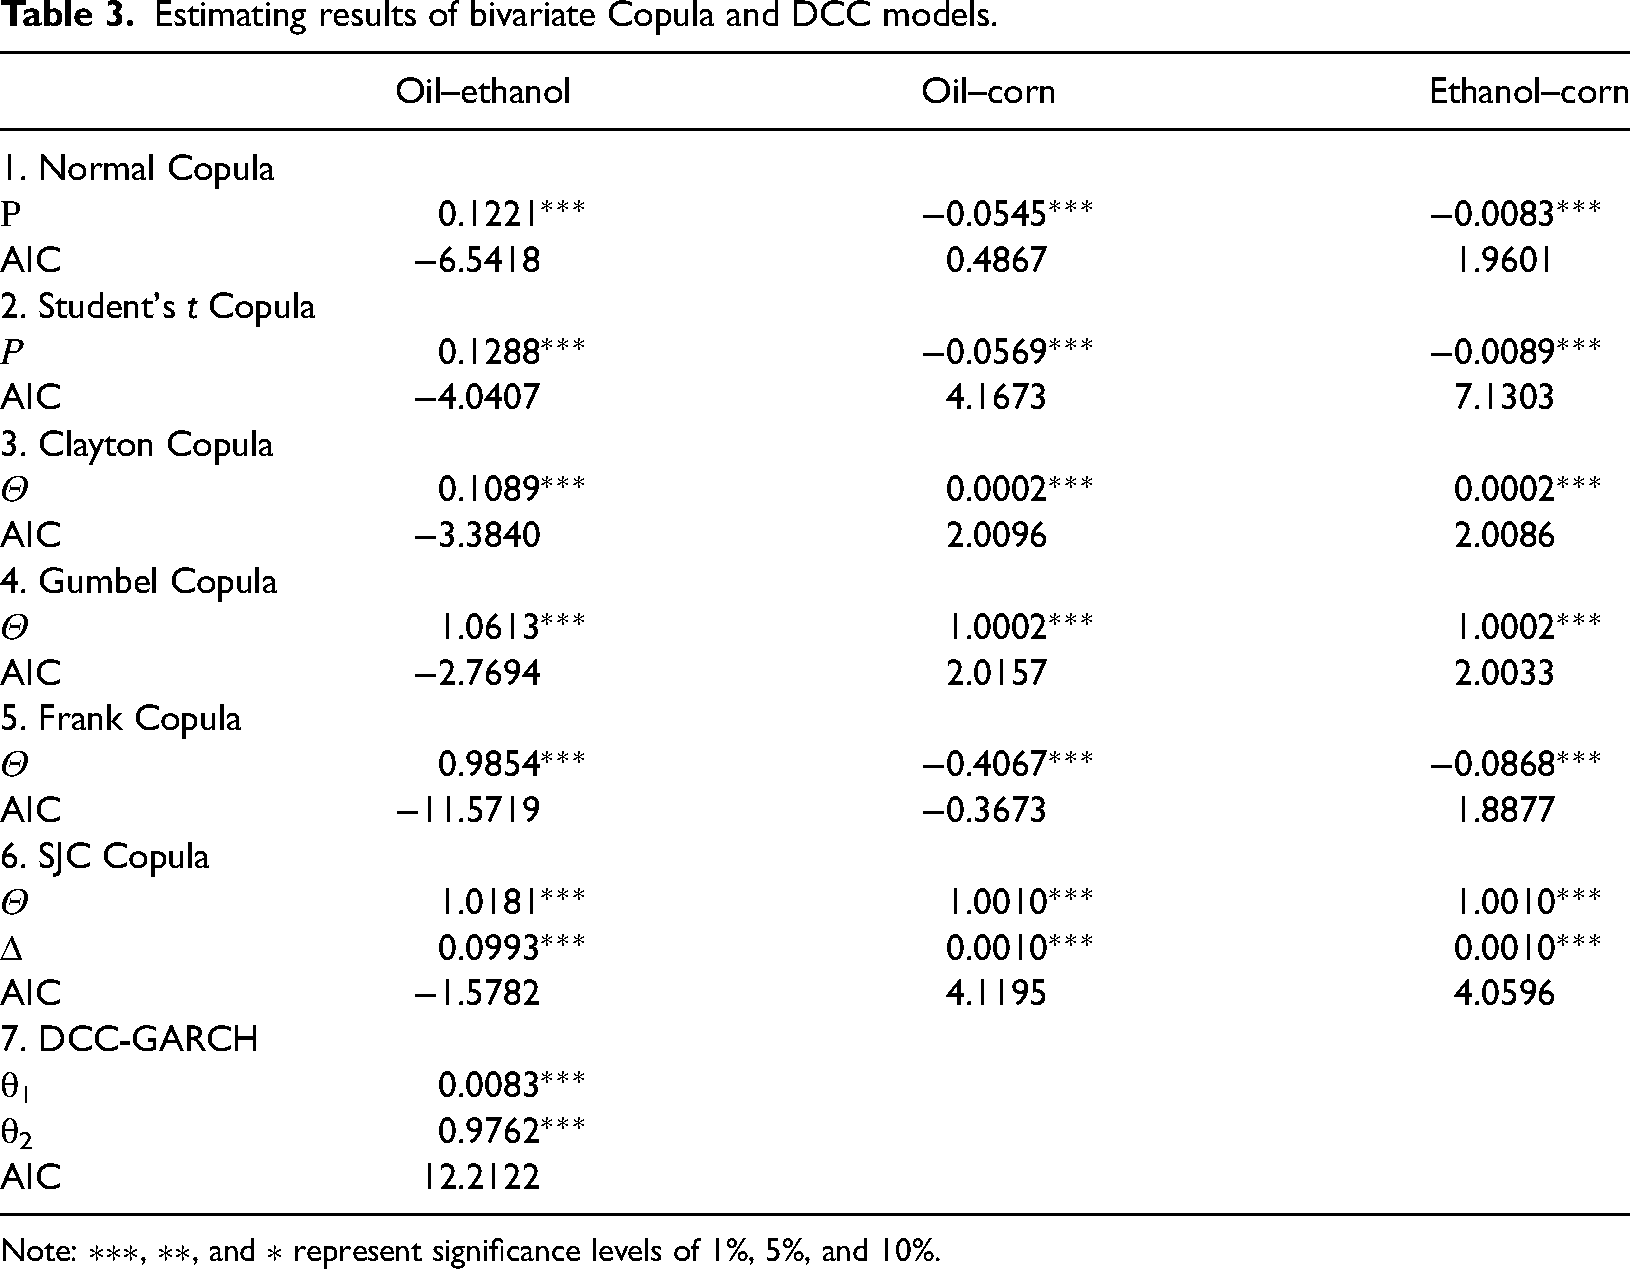
The correlation coefficient could be estimated by the Copula model and the DCC-GARCH model. In order to get an accurate result, this paper first adopts a variety of Copula models in this section, including two elliptical Copulas of Gaussian Copula and Student's t Copula, and four Archimedean Copulas of Clayton Copula, Gumbel Copula, Frank Copula, and symmetrized Joe–Clayton (SJC) Copula. Then, a formulated DCC-GARCH model is adopted to estimate the volatility between various series, which can be indicated by a dynamic time-varying correlation coefficient rather than a constant. Table 3 provides the coefficient estimation and shows the fit of the bivariate copulas for three pairs (oil-ethanol, oil-corn, and ethanol-corn).
Estimating results of bivariate Copula and DCC models.
Note:
As demonstrated in Table 3, the Frank Copula, generating the lowest AIC, shows better performance than the other Copula models. By comparing the parameters of two elliptical Copulas, results indicate the absence of tail dependence and the existence of symmetric dependence, because the Gaussian Copula is not only symmetric in the center and tails but also not fat-tailed. And the Normal (Gaussian) Copula outperforms the Student's t Copula for each pair, which can capture the characteristics of relationship better. As a robustness check, seeing from the result of DCC-GARCH in Table 3, the estimated ARCH coefficient (
In order to visualize the change of correlation among crude oil, corn, and biofuel ethanol markets in different years, a time series plot of dynamic correlation coefficients is calculated and depicted. We use rho_12, rho_13, and rho_23 to denote the dynamic conditional correlation coefficients of the pairs oil-ethanol, ethanol-corn, and oil-corn, respectively. Figure 2 depicts the fluctuating trends of rho_12, rho_13, and rho_23, indicating that their correlation has obvious time-varying characteristics.

Dynamic conditional correlations of crude oil, biofuel ethanol and corn.
Figure 2 clearly depicts the strong co-movement of pair-to-pair markets. The price volatility of international crude oil obviously influences the change of correlation between the international crude oil market and China's domestic markets for biofuel ethanol and corn. The results show that the higher the crude oil price, the weaker the correlation, while the lower the oil price, the closer the correlation. For example, during the period of sharp plunge in international crude oil price from 2012 to 2015, rho_12 increased from 0.20 to 0.37, and rho_23 decreased from −0.03 to −0.10, indicating that dynamic correlation, whether positive or negative, such as between international crude oil and China's biofuel ethanol or international crude oil and China's corn market, is both increased. Results show that rho_12 decreases from 0.37 to 0.12 and rho_23 recovers from −0.10 to −0.03 from 2015 to 2020. It indicates that the rebound in international crude oil price after a brief plunge due to COVID-19 led to a weakening of the degree of dynamic correlation between crude oil and ethanol and crude oil and corn markets. At the same time, rho_12 increased from 0.12 to 0.23, and rho_23 decreased from −0.03 to −0.15 and then recovered to −0.04, illustrating that the dynamic interaction between the global crude oil market (rho_12) and the ethanol and corn markets (rho_23) in China are both greatly impacted by the volatility of the global crude oil market.
The possible explanation for the above phenomenon is that, crude oil is the main raw material for biofuel ethanol, so their prices move in the same direction with a positive dynamic correlation. However, the dynamic correlation coefficient between crude oil and corn shows alternating positive and negative correlation. For this result, on the one hand, natural disasters, and extreme risks such as the COVID-19 epidemic make food production decline; on the other hand, China's corn temporary storage reform in 2016 was not fully marketized before, and the price is controlled by the government. Thus, it shows a weak correlation overall and the instability of alternating positive and negative correlations. Furthermore, rising crude oil price leads to the expansion of the biofuels industry, rising corn costs, and more use of ethanol as a substitute for oil than before, so the correlation weakens; conversely, when oil price falls, more oil is used for the production, processing, and transportation of corn and biofuel ethanol, so the correlation strengthens.
Risk spillover effects
In this part, we calculate the risk spillover from international crude oil market to China's domestic biofuel ethanol and corn markets by using the value at risk (
Var, coVaR and ΔCoVaR of each market.

Note: The table provides the mean values, and standard deviation in parentheses ().
According to Table 4, the crude oil market's
Besides,
Figure 3 illustrates China's biofuel ethanol and corn markets'

Risk spillovers from international crude oil to China's biofuel ethanol and corn markets.
The possible explanation is that, on the one hand, after 2018, the promotion policy of the National Development and Reform Commission of China on biofuel ethanol has changed from a positive attitude to a cold attitude, resulting in a more vulnerable and smaller biofuel industry. On the other hand, China's corn market has become more internationally aligned, but its price is somehow controlled by the government due to food security. Therefore, the
Conclusions and implications
Obviously, the rise in the price of fossil energy will increase the demand for corn based biofuel energy. In this way, the research on the relationship between crude oil and agricultural products (corn) should be further expanded and include biofuel ethanol, which is what this paper endeavor to. Based on a DCC-GARCH-Copula-CoVaR model, this paper characterized the volatility of international crude oil, China's biofuel ethanol, and corn markets and measured the risk spillover effects among the three markets by using weekly data spanning from 2012 to 2021. Empirical analysis revealed several findings.
First, after a series of robustness check, the ARMA-GJR-GARCH model as the best DCC-GARCH approach reveals the obvious co-movements of international crude oil, China's biofuel ethanol, and corn markets, which means the volatility of international markets has significant impacts on the dynamic relationship between international crude oil market and China's biofuel ethanol and corn markets since the market reform in 2009 in China. Surprisingly, China's domestic corn and ethanol markets are not as relevant as the international and domestic markets. What's more, volatility dynamics, that is based on dynamic conditional correlations tests, showed significant variation of each two markets among the international crude oil, domestic biofuel ethanol and corn markets, which finds the crude oil has a decisive influence on the other two markets during the tail risk events. However, the impact of crude oil on ethanol market is positive and durable, while the influence on corn market is changed with time and strengthened only after 2017. One interesting finding is that, when the international crude oil price rises during the tail risk event, the correlation between international oil and China's biofuel ethanol markets tends to weaken; and when the crude oil price falls, the correlation strengthens, which indicates the price of energy in domestic China has slow response to the price rising rather than the price falling. After a reality check, we give a possible explanation that prices of ethanol fuel in China highly related to the gasoline price and certainly closely related to the crude oil prices. But the price mechanism is still controlled by the government and gasoline oligopoly. As to the reaction of corn market, it needs to be clarified that until 2016, the prices of corn market have been reformed, which leads to a changeable correlation overall and instability of alternating positive and negative correlation with crude oil price change. The risk spillover measurers,
As the global energy system faces deep uncertainty now, Amidst COVID-19 pandemic and war in Europe, different markets' prices signals can offer useful tools to monitor the wide range of potential risk of energy transition. Traditional marketization theory believes that market shocks hinder the healthy development of the economic system, but when it comes to tail risks or extreme events, such as COVID-19 in our case, the so-called imperfect marketization protects the turbulence of the domestic market to some extent findings of this paper not only provide a new case study of energy-. Based on price co-movements of different markets, it is effective to capture the dynamics of different markets and even the extreme events shocking.
The findings of this paper reveals are not only making a new case of energy-food nexus study, but also have important significance for investors and governments. On the investor side, we have provided empirical and quantitative evidence of the characteristics of China's energy and food markets, which will help to build an effective portfolio and adjust their investment positions. For governments, especially for developing countries, risk management is crucial to a country's market security. The influence of the international market is indivisible. The turbulence of crude oil will have a significant impact on the ethanol and corn markets. It is necessary to establish a joint risk prevention and supervision mechanism to control cross market risk transmission during crises such as the COVID-19. The government can play a beneficial role in coping with cross-border economic shocks. As shown in this paper, the government's intervention in the corn market price mechanism helps avoid shocks to the domestic market.
We recognized the limitation of the data in this paper that we can only make empirical studies based on a sample from 2012. To conduct a study on the market's co-movement and risk spillover after the shock COVID-19 is of much importance, but it is difficult to fully popularize the result since such a shock is revolutionary and unprecedented. Moreover, how to fully reveal the impacts of COVID-19 in a relative long-term view is not further explored due to the limitation of methods.
Footnotes
Authors’ contribution
Jin Zhang: conceptualization; methodology; validation; formal analysis; review and editing. Zhenqing Lin: methodology; software; original draft; formal analysis; data curation; review and editing. Jinkai Li: resources; review and editing; supervision; funding acquisition; project administration.
Declaration of conflicting interests
The authors declared no potential conflicts of interest with respect to the research, authorship, and/or publication of this article.
Funding
The authors disclosed receipt of the following financial support for the research, authorship, and/or publication of this article: This work was supported by the Youth Program of National Science Foundation of China, Humanities and Social Sciences Youth Foundation, Ministry of Education of the People's Republic of China, and National Social Science Foundation of China (grant numbers 72204230, 18YJC790216, 20BJL034, and 21ZD108).
