



Abstract
High-energy consumption and high-emission industries contribute a lot to economic development, but their carbon emissions are also huge. In order to achieve the dual-carbon target as early as possible, it is necessary to reduce the carbon emissions of high-energy consumption and high-emission industries. This paper selected five representative factors (population, per capita gross domestic product (GDP), energy intensity, energy structure and carbon emission coefficient) and adopted the logarithmic mean divisia index (LMDI) method to decompose the driving factors of carbon emissions. Therefore, this paper uses Tapio decoupling model to analyze the decoupling relationship between the two factors with the greatest impact on carbon emissions and carbon emissions. The results show that: (i) There is a good decoupling between high-energy consumption and high-emission industries and per capita GDP, and the impact of per capita GDP on carbon emissions will gradually decrease in the future; (ii) The decoupling relationship between carbon emissions and energy intensity is poor. For some industries, the reduction of energy intensity can help reduce carbon emissions. Finally, this paper puts forward some suggestions to promote carbon emission reduction. This paper provides theoretical support for studying how to reduce carbon emissions and formulate relevant emission reduction policies in the high-energy consumption and high-emission industries.
This is a visual representation of the abstract.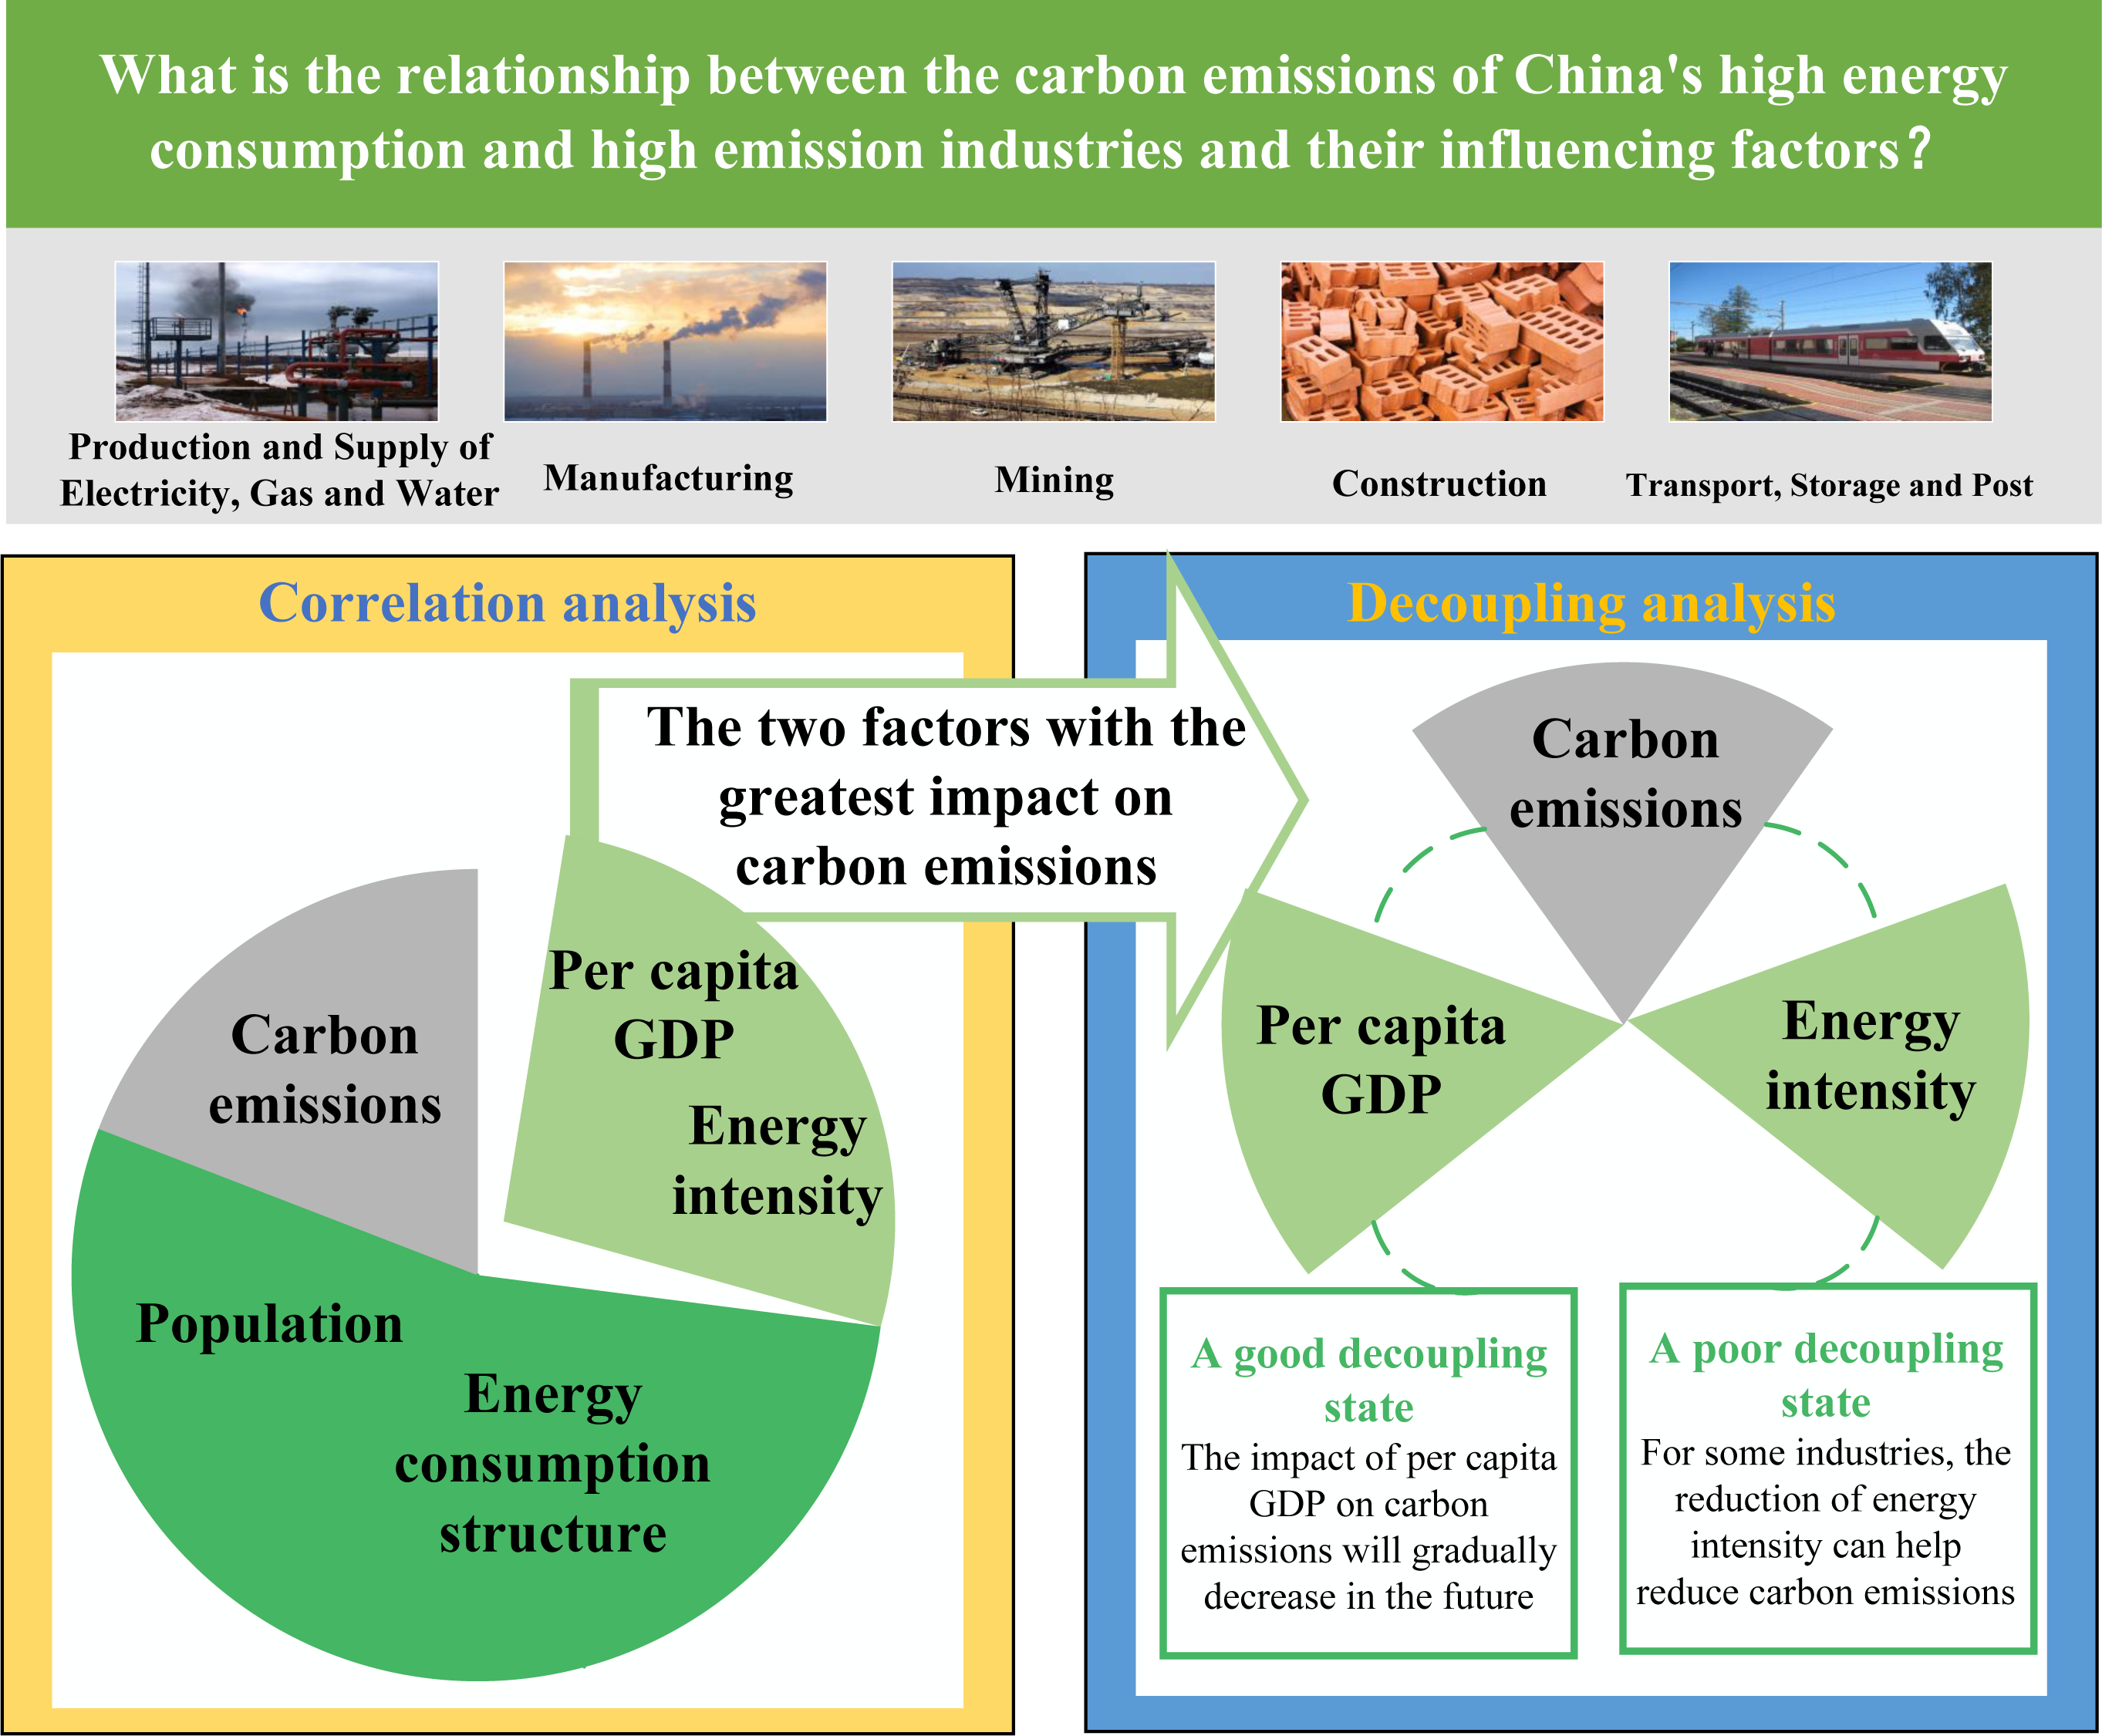
Keywords
Introduction
China is now the world's largest carbon emitter. 1 Improving the quality of economic development and controlling carbon emissions effectively have become a problem that must be faced on its development path, as the Chinese government has proposed the dual-carbon target. Although the COVID-19 pandemic has reduced China's carbon emissions within a certain time frame, 2 it has also affected economic development. 3 This reduction in carbon emissions is short-lived, and as economic activity recovers, carbon emissions rise back to previous levels 4 or even higher. 5 If we want to control carbon emissions without affecting economic growth, we should focus on the source of carbon emissions. China should focus on the carbon emissions of different carbon emitters with the goal of studying emission reduction paths adapted to each of them.
When focusing on carbon emissions, it is obvious to find that the use of land, 6 the production of industry, and the development of population 7 are all the main sources of carbon emissions. Among them, high-energy consumption and high-emission industries (later referred to as the TH industries), such as mining and transportation, have contributed greatly to the development of China's economy while generating considerable carbon emissions due to the irrational nature of the energy structure. The Chinese government has made reducing carbon emissions from the TH industries an important goal and has been vigorously promoting relevant policies for many years. 8 Since the 13th and 14th 5-year plans in 2020, China has been focusing on the TH industries and has repeatedly mentioned the need to control the carbon emissions of the TH industries before the formal introduction of the dual-carbon target. In April of the same year, the Ministry of Industry and Information Technology also issued a guideline to strengthen carbon emission control in the TH industries. China is concerned about reducing carbon emissions deeply. The carbon emissions of the TH industries are huge, and China can start from there if it wants to achieve the dual-carbon target.
In fact, the carbon emissions of the TH industries are not only influenced by the amount of energy consumption, but more importantly by potential factors, such as energy structure, energy intensity, and per capita gross domestic product (GDP). These factors influence carbon emissions directly or indirectly from several perspectives. Accordingly, it is the most effective means to help China reach the double carbon target as soon as possible that to analyze the correlation between these factors and the carbon emissions of the TH industries, to find the factors that are most closely related to them, and to explore ways to reduce carbon emissions of the TH industries from this starting point.
In addition, after obtaining the driving factors of carbon emissions of the TH industries, analyzing the existing rules of decoupling state of the carbon emissions and the driving factors is a prerequisite for formulating emission reduction policies in accordance. 9 Decoupling analysis studies the rate of change between two target objects. The relationship between two target objects can be calculated by decoupling over a period. At this point refer to the decoupling value table, which can get the corresponding decoupling status. When the two factors present a coupling state, it indicates that they have a strong correlation. When the two factors show a strong decoupling state, it proves that the two factors have little correlation. Strong decoupling is ideal for studying the relationship between carbon emissions and economic development. 10 If economic development and carbon emissions are taken as examples to conduct decoupling analysis, when the two are strongly decoupled, it indicates that carbon emissions are decreasing with the acceleration of economic growth. It shows that economic development is no longer at the cost of environmental pollution. 11
Based on the TH industries, this paper first calculated their carbon emissions, and then used the LMDI model to analyze the five influencing factors of carbon emissions, and obtained the influential factors with the greatest correlation. After that, Tapio decoupling model was used to study the decoupling relationship between influencing factors and carbon emissions, analyze the rules of decoupling, and finally provide some suggestions for policymakers. The significance of this study is as follows: As the carbon emissions of the TH industries are an important part of China's carbon emissions, analyzing the influencing factors of their carbon emissions and formulating corresponding emission reduction policies can help China alleviate the pressure of carbon emissions. The rest of this paper is organized as follows, Section 2 reviews the relevant literature, Section 3 describes the models and methods to be used, Section 4 presents the data sources and processing methods, and Section 5 describes the relevant conclusions and recommendations.
Literature review
When environmental pollution becomes more and more serious, countries all over the world have introduced a series of policies and regulations to reduce greenhouse gas emissions. 12 Among them, China formally proposed the dual-carbon target in 2020. This target is a challenge to China's own economic development,13, 14 and it is also a big test to control carbon emissions. However, the establishment of the dual-carbon target is also a positive incentive, such as promoting the adjustment of China's energy structure, technological innovation, and industrial transformation and upgrading. Based on the proposal of the dual-carbon target, scholars have conducted a series of related studies, some studying the impact of the carbon trading mechanism on the dual-carbon target in this scenario 15 while others have studied the path to achieve the dual-carbon target. The most widespread research is to provide recommendations for achieving the dual-carbon target based on carbon emissions. The research on carbon emissions can start from the perspective of countries, 16 target at specific regions or industries, or simultaneously study the relationship between carbon emissions, economic and energy factors in multiple countries.17, 18 In order to make a more targeted study of carbon emissions, this paper takes China as an example to study the relationship between carbon emissions of the TH industries and their influencing factors. As the main contributors to China's carbon emissions, promoting the reduction of emissions from the TH industries is the key to achieving China's dual-carbon target. 19
While promoting the development of China's economy, the TH industries have brought huge carbon emissions. According to the data provided by the official website of the China Bureau of Statistics, the top ten energy-consuming industries in terms of energy consumption account for 56.7% of the total energy consumption and 81.6% of the total energy consumption in the industrial sector. 20 Since 2008, the macro-control measures taken by China in response to the financial crisis have brought a huge market demand for the production capacity of the TH industries, leading to a certain extent to blind investment. 21 This not only wastes energy and emits greenhouse gases, but also causes overcapacity in the TH industries. At present, China faces problems such as a large proportion of dirty energy consumption 22 and high carbon emission intensity. 23 Research on how to reduce carbon emissions from the TH industries has become a top priority for China to achieve its dual-carbon target.
In recent years, studies on the relationship between energy consumption and carbon emissions of the TH industries are mainly represented by one industry at national, 24 provincial, 25 regional, 26 or industry level. For example, manufacturing industry, 27 thermal industry, 28 mining industry, 29 power generation industry, 30 transportation industry, 31 or general industrial sector. 32 These industries all belong to the TH industries, but in general, there is a lack of studies on the characteristics of carbon emissions from the perspective of the TH industries in general. Energy plays an important role in global economic activities, 33 and coal is the most widely used energy source in China. 34 China is the world's largest coal consumer 35 and its consumption is reflected in various industry sectors. China consumes a variety of energy sources, but coal, as a cheap and widely available source, accounts for the largest share of energy. Therefore, this paper identifies five TH industries with coal consumption as the standard and analyzes the factors influencing their carbon emissions.
Scholars usually use the IDA method to study energy consumption problems, compared to the SDA method, IDA requires data that are easy to obtain and the results are easy to cite. 36 The IDA method has two forms, the arithmetic means index method (AMDI) and the logarithmic mean index method (LMDI). 37 The LMDI model, which is based on the KAYA equation, is the model that is widely used in the analysis of carbon emissions at various levels. 38 By using this model, the influence of the influencing factors can be presented in numerical form. Therefore, in this study, based on the calculated carbon emissions, the KAYA equation is introduced to identify the drivers of carbon emissions in the TH industries, and then, based on the LMDI model, the influence of different influencing factors is calculated.
The combination of LMDI model and decoupling model can better analyze the relationship between driving factors of carbon emissions and carbon emissions. 39 When calculating the decoupling situation, scholars usually use the decoupling indicator and Tapio model 40 to analyze the decoupling of carbon emissions and economic development. The decoupling indicator was first proposed by OECD. Then Tapio proposed the Tapio decoupling model in 2005 and classified the decoupling status into eight categories. 41 Compared with the OECD decoupling indicator, the Tapio decoupling indicator is not sensitive to the choice of the base period. At the same time, Tapio introduces the concept of "elasticity" into the model, and divides the decoupling elasticity into two parts. In addition, the Tapio decoupling indicator is also an elasticity analysis, so it is not limited by statistical dimensional differences. With the increasing attention to greenhouse gas emissions, the Tapio decoupling model has been widely used in the environmental field. 42
In summary, this paper studies the impact of factors on carbon emissions in the TH industries by using a combination of LMDI model and Tapio decoupling model. The innovations of this paper are as follows: First, nowadays, when some studies are limited to specific regions and industries, while others study carbon emissions at the national macro level, this paper starts from the TH industries, without being bound by regions and industries, and aims to explore the carbon emission characteristics of the TH industries. Secondly, based on the decomposition of influencing factors by LMDI model, a decoupling model was established to further analyze the relationship between influencing factors and carbon emissions. Thirdly, after the decoupling state between carbon emissions and driving factors is obtained, the significance and changing rules of corresponding decoupling state are analyzed for specific industries.
Model specification
Carbon emissions model
In this paper, three major energy sources commonly used in the TH industries during 2001–2018 are used to calculate carbon emissions. These three main energy sources are coal, natural gas, and crude oil. To calculate carbon emissions, the values of energy consumption and discounted CO2 coefficient are used. The data on energy consumption is obtained from the Yearbook of the National Bureau of Statistics of China. The discounted CO2 coefficient is respectively from the Guidelines for Compilation of Provincial Greenhouse Gas Inventory (Climate [2011] No. 1041 of the Development and Reform Office).
The carbon emissions can be obtained through Equation (1):

Decomposition model of LMDI factors for the TH industries
Based on LMDI model, this paper analyzes the influencing factors of carbon emissions and uses the KAYA decomposition formula to express the relationship between the target variable and influencing factors. Compared with other studies, this paper considers the TH industries as a whole and conducts an influence decomposition analysis on the influencing factors and carbon emissions.
Decomposition of relevant influencing factors
Equation (2) is based on the KAYA equation.


According to the LMDI model, the target variable of carbon emissions can be decomposed into population, per capita GDP, energy intensity, energy structure, and carbon emission coefficient of energy. Therefore, the change of carbon emission from the base year to the target year is decomposed into the change of five influencing factors, and the decomposition formula is as follows:

According to the LMDI model proposed by Ang WB, the changes of the five influencing factors can be calculated by Equations (5)–(9):






Tapio decoupling model of carbon emissions and influencing factors in the TH industries
The LMDI model was used to calculate the influence values of the influencing factors on carbon emissions, and the direction of influence. The factor that has the greatest impact on carbon emissions can help us to further study the change in the relationship between the two factors and carbon emissions, and provide more concrete and feasible suggestions for the development of the TH industries, this paper introduces the decoupling model to analyze the change of the relationship between the factors that have greatest impact and carbon emissions.
Therefore, this paper takes carbon emissions and per capita GDP as examples to describe the calculation process of decoupling model. The relationship between carbon emissions and per capita GDP can be obtained through Equation (11):

Tapio decoupling indicators are divided into 8 types according to the size of the decoupling index, as shown in Table 1.
Types of Tapio models.

Empirical results and discussions
LMDI model data source
According to Equation (10), the data needed are carbon emissions, population, per capita GDP, energy intensity, and energy consumption structure.
Carbon emissions
According to the data from The National Bureau of Statistics of China, coal consumption accounted for more than 60% of the total energy consumption in all industries from 2001 to 2018. Coal is one of the main fossil energy used in China.
Therefore, when selecting the TH industries, this paper classifies the industries based on the coal consumption from 2001 to 2018. According to the statistics and ranking of coal consumption in various industries, the top five coal consumption industries are production and supply of electricity, gas and water (ES), manufacturing (MF), mining (MN), construction (CT), transportation, transport, storage, and post (TS).
After identifying five industries of the TH industries and taking the consumption of coal, crude oil and natural gas during 2001–2018 as the total amount of energy consumption, their carbon emissions were calculated according to Equation (1) in section 3.1.
Influencing factors
According the Equation (10), population, per capita GDP, energy intensity, and energy structure are selected as the influencing factors of carbon emissions.
The values of the population and per capita GDP were obtained from the Yearbook of the National Bureau of Statistics of China.
The energy intensity can be calculated by adding the total energy consumption of the TH industries and dividing it by China's GDP in the corresponding year. The drift of energy intensity of the TH industries from 2001 to 2018 is as follows:
The calculation of energy consumption structure is divided into two steps. The first step is to convert the total amount of dirty energy consumption of the TH industries into standard coal according to Equation (12) and the reduced standard coal coefficient.
Decoupling model data source
In the decoupling analysis, the carbon emissions, per capita GDP and energy intensity of the TH industries were decoupling analyzed in every 3 years. According to Equation (11), the calculation of this part of the model requires six parts of data, namely, carbon emission and its change, per capita GDP and its change, and energy intensity and its change. The base periods in this model are 2001, 2004, 2007, 2010, 2013, and 2016.
Carbon emission and its changes
Carbon emissions use the values in Section 4.1.1.
Based on the carbon emission values in Section 4.1.1, the carbon emission changes in the six periods of 2001–2003, 2004–2006, 2007–2009, 2010–2012, 2013–2015, and 2016–2018 are calculated.
Per capita GDP and its volume of change
Per capita GDP data for 2001–2018 came from China's National Bureau of Statistics.
After obtaining the data of per capita GDP from 2001 to 2018, the change in per capita GDP is calculated as in Section 4.2.1.
Energy intensity and its changes
The energy intensity values are calculated in Section 4.1.2.
Based on the energy intensity data obtained from 2001 to 2018, the change of energy intensity is calculated as in Section 4.2.1.
Decomposition of carbon emission driving factors
Taking 2001 as the base period, input the obtained data of carbon emissions and related influencing factors into Equation (13):
The annual effects of different factors on carbon emissions are calculated by using Equations (5)–(9). The annual effects and cumulative effects of influencing factors are shown in Figures 2 and 3:
It can be seen from Figures 2 and 3 that both population and per capita GDP have a positive impact on carbon emissions, that is, both have a carbon increasing effect.
Population
There is a positive correlation between population and carbon emissions. Population contributed to the increase in carbon emissions between 2001 and 2018. This influence has increased significantly in 2011, and this increase is related to the change in population size. By calculating the change in China's population from 2001 to 2012, this paper finds that the change rates of China's population increase from 2008 to 2012 are −1.17%, −3.71%, −1.08%, 28.71%, and 21.94%, respectively. The population growth rate turned from positive to negative after 2010, leading to a faster increase in population and a greater influence of population factors on carbon emissions. From 2010 to 2018, the influence of population fluctuated to some extent, but compared with 2001, it has greatly increased, which is partly related to the implementation of China's fertility policy.
Per capita GDP
Per capita GDP reflects the development of social economy. Per capita GDP has a positive impact on carbon emissions, and the increase in per capita GDP will lead to the increase of carbon emissions. Between 2001 and 2018, the influence of per capita GDP on carbon emissions has been positive. In 2001–2007, per capita GDP grew very fast, but the growth rate of per capita GDP declined in 2007–2009. From 2010 to 2015, the impact of per capita GDP on carbon emissions gradually decreased, and then increased from 2016 to 2018. In general, among the four factors, per capita GDP has the greatest impact on carbon emissions.
Energy intensity
It can be seen from Figures 2 and 3 that energy intensity and energy structure have a negative impact on carbon emissions, that is, they have a carbon reduction effect. It is an index that can measure energy efficiency. 43 Under the same circumstances, the greater the amount of energy required to produce one unit of GDP, the greater the value of energy intensity will be. From 2001 to 2009, the impact of energy intensity on carbon emissions fluctuated in both positive and negative directions. From 2010 to 2018, energy intensity had a continuous negative impact on carbon emissions. During this period, energy intensity always played a role in carbon reduction. Overall, among the four factors, the influence of energy intensity on carbon emissions is second only to per capita GDP.
Energy structure
The energy structure represents the proportion of coal, crude oil, and natural gas in total energy consumption. From 2001 to 2018, the impact of energy structure on carbon emissions fluctuated in both positive and negative directions. However, it can be seen from Figure 3 that the cumulative effect of energy structure was negative from 2013 to 2018, indicating that energy structure promoted the reduction of carbon emissions in this period. This phenomenon is related to China's progress in energy technology and the adjustment of energy structure. Overall, the energy structure ranks third among the four factors.
Decoupling analysis of carbon emission and influence factors
In the previous paper, the LMDI model based on the KAYA equation shows the influence intensity of the influencing factors of carbon emissions in the form of numbers. By comparison, it can be concluded that per capita GDP and energy intensity are the two most influential factors in carbon emissions of the TH industries. Previous researches are usually limited to the study of the decoupling relationship between the economy and carbon emissions. As the second influential factor, it is significance to analyze the relationship between energy intensity and carbon emissions. In order to study the carbon reduction potential of these two factors and find the best route to reduce carbon emissions of the TH industries, this paper innovatively introduced the Tapio decoupling model to calculate the decoupling between the influencing factors and carbon emissions, providing new ideas for studying the relationship between energy intensity and carbon emissions. After the results of decoupling are obtained, the changing rules of decoupling are explored, and the reasons for the fluctuation of decoupling are analyzed based on national policies.
Decoupling between per capita GDP and carbon emissions
According to Section 4.1.1 and Table 1, the decoupling of per capita GDP and carbon emissions in different industries is shown in Table 2:
Decoupling index of carbon emissions and per capita GDP of the TH industries from 2001 to 2018.
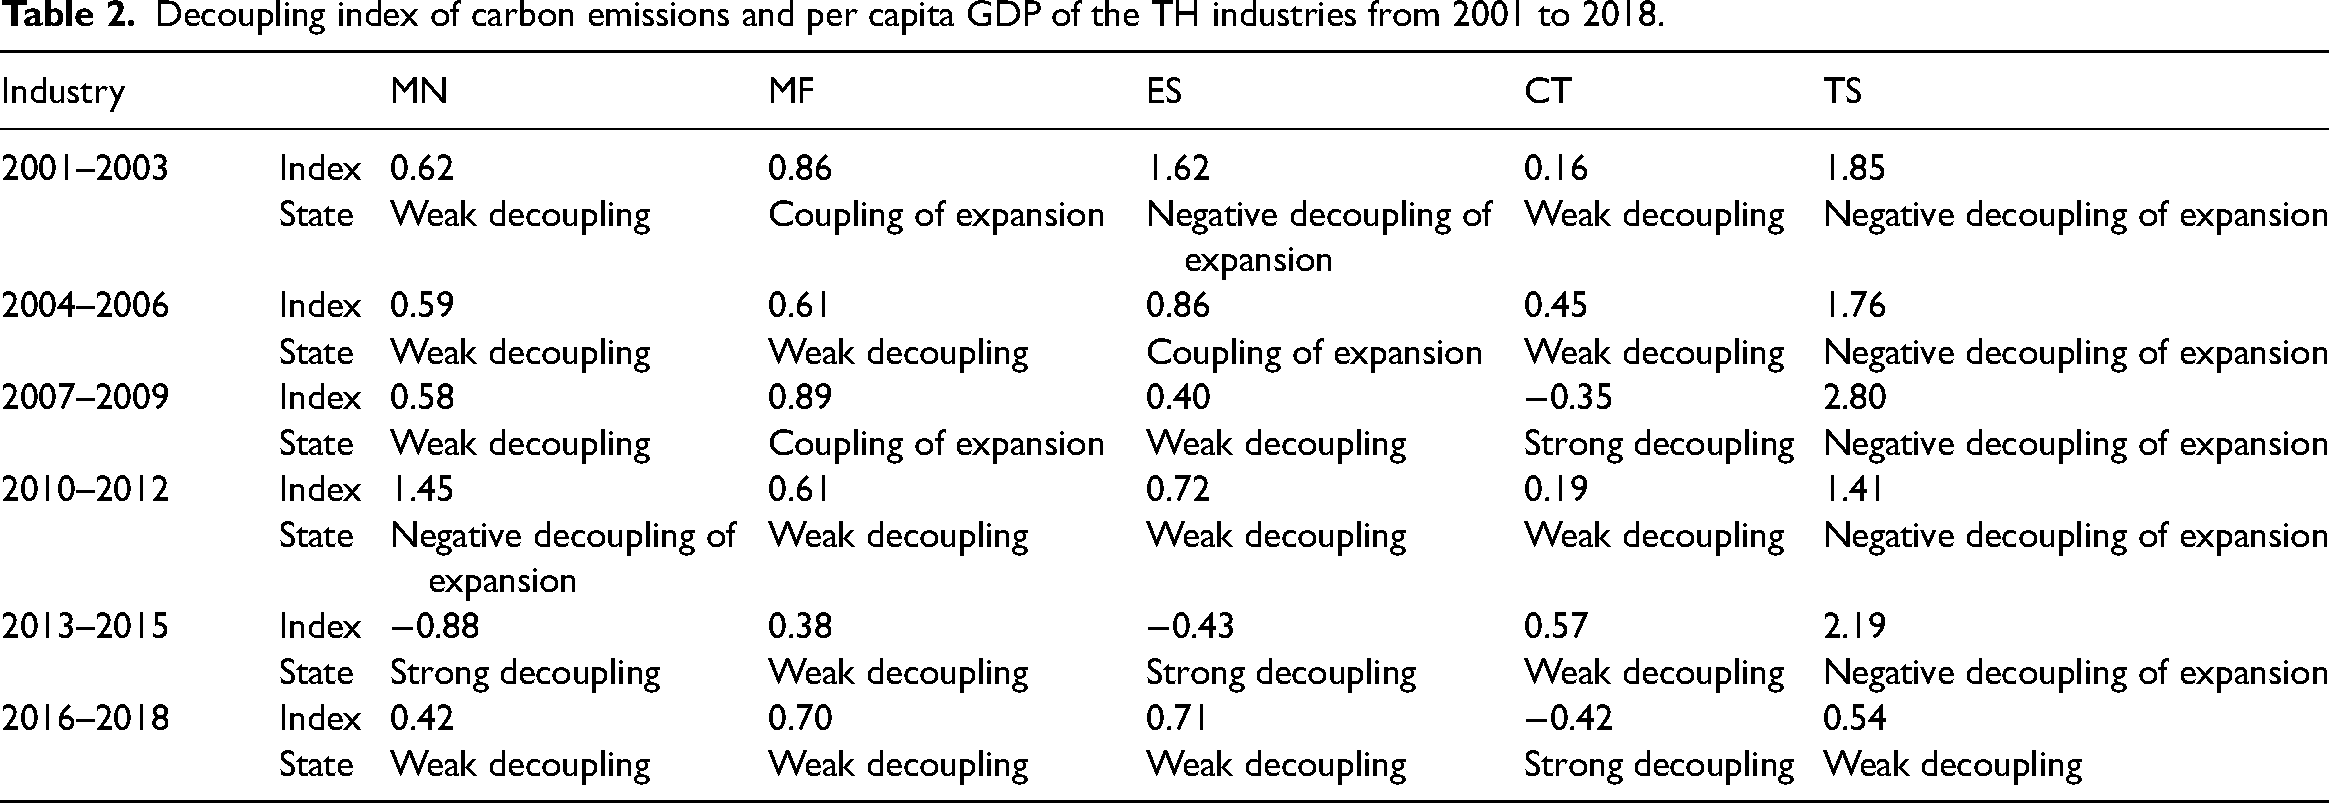
As can be seen from Table 2, carbon emissions of the TH industries and per capita GDP show a good decoupling state. There is a weak decoupling relationship between carbon emissions of the MN industry and per capita GDP, that is, the correlation between them is gradually weakening. The carbon emissions of the MF industry showed a coupling trend with per capita GDP before 2009, but showed a weak decoupling state after 2010. The carbon emissions of the ES and CT industries also remained weakly decoupled from per capita GDP. The carbon emissions of the TS industry and per capita GDP maintained an expansion negative decoupling state before 2015, and the decoupling state improved and gradually turned into a weak decoupling relationship in 2016. Through horizontal comparison, this paper found that compared with the other three industries, the decoupling relationship between the carbon emissions of the MN and CT industries and the per capita GDP is the most stable. The MF and ES industries followed. The most volatile sector was the TS industry. This is related to the production characteristics of the TS industry, indicating that the carbon emissions of the TS industry are greatly affected by the economy. Compared with the previous targeted analysis of the decoupling relationship between the economic development of an industry and carbon emissions, this paper innovatively analyzes the decoupling state between carbon emissions and per capita GDP of the TH industries. The TH industries are the main object of China's industrial emission reduction and this paper is more efficient and horizontal comparative analysis among multiple industries.
Decoupling between energy intensity and carbon emissions
The decoupling relationship between carbon emissions and energy intensity of the TH industries is shown in Table 3.
The decoupling relationship between carbon emissions and energy intensity of the TH industries.

In Table 3, the decoupling of the TH industries and energy intensity is poor. The relationship between carbon emissions of the MN industry and energy intensity is oscillating between expansion negative decoupling and strong negative decoupling, it shows that in the MN industry, carbon emission is closely related to energy intensity, and they change in the same trend. As shown in Figure 1, the energy intensity of the MN industry decreased continuously from 2001 to 2018, which means that energy intensity promoted the reduction of carbon emission during the study period. There is a close relationship between energy intensity and carbon emissions, which is related to the industry characteristics of the MN industry. The phenomenon may be associated with the MN industry's own industry characteristics. Like the MN industry, the relationship between carbon emissions and energy intensity of the MF and ES industries is also poor, it indicates that the carbon emissions of the MF and ES industries is still closely related to energy intensity during the study period. The relationship of the CT industry between the carbon emissions and energy intensity is better than the MN, MF, and ES industries, it had shown a decoupling relationship with energy intensity during 2001–2018, but overall still showed a strong coupling relationship. As shown in Figure 1, as the carbon emission intensity of the CT industry continues to decline, the decline in carbon emissions is also promoted. For the CT industry, with the gradual decoupling of energy intensity and carbon emissions in the future, the decline of energy intensity in promoting the decline of carbon emissions will gradually slow down. The TS industry is the same as the MN industry, and the decoupling relationship between carbon emissions and energy intensity is also poor. In the future, energy intensity still has great potential in promoting the reduction of carbon emissions in the MN, MF, TS, and ES industries. A decline in energy intensity represents an increase in energy efficiency. The improvement of energy efficiency will play a positive role in reducing carbon emissions in these four industries. Overall, the decline in energy intensity played a positive role in promoting the reduction of carbon emissions in the TH industries between 2001 and 2018. By comparing the relationship between carbon emissions and energy intensity in different industries, this study reflects the different dependence of these five industries on energy utilization, and provides theoretical support for further proposing more appropriate emission reduction methods for different industries.
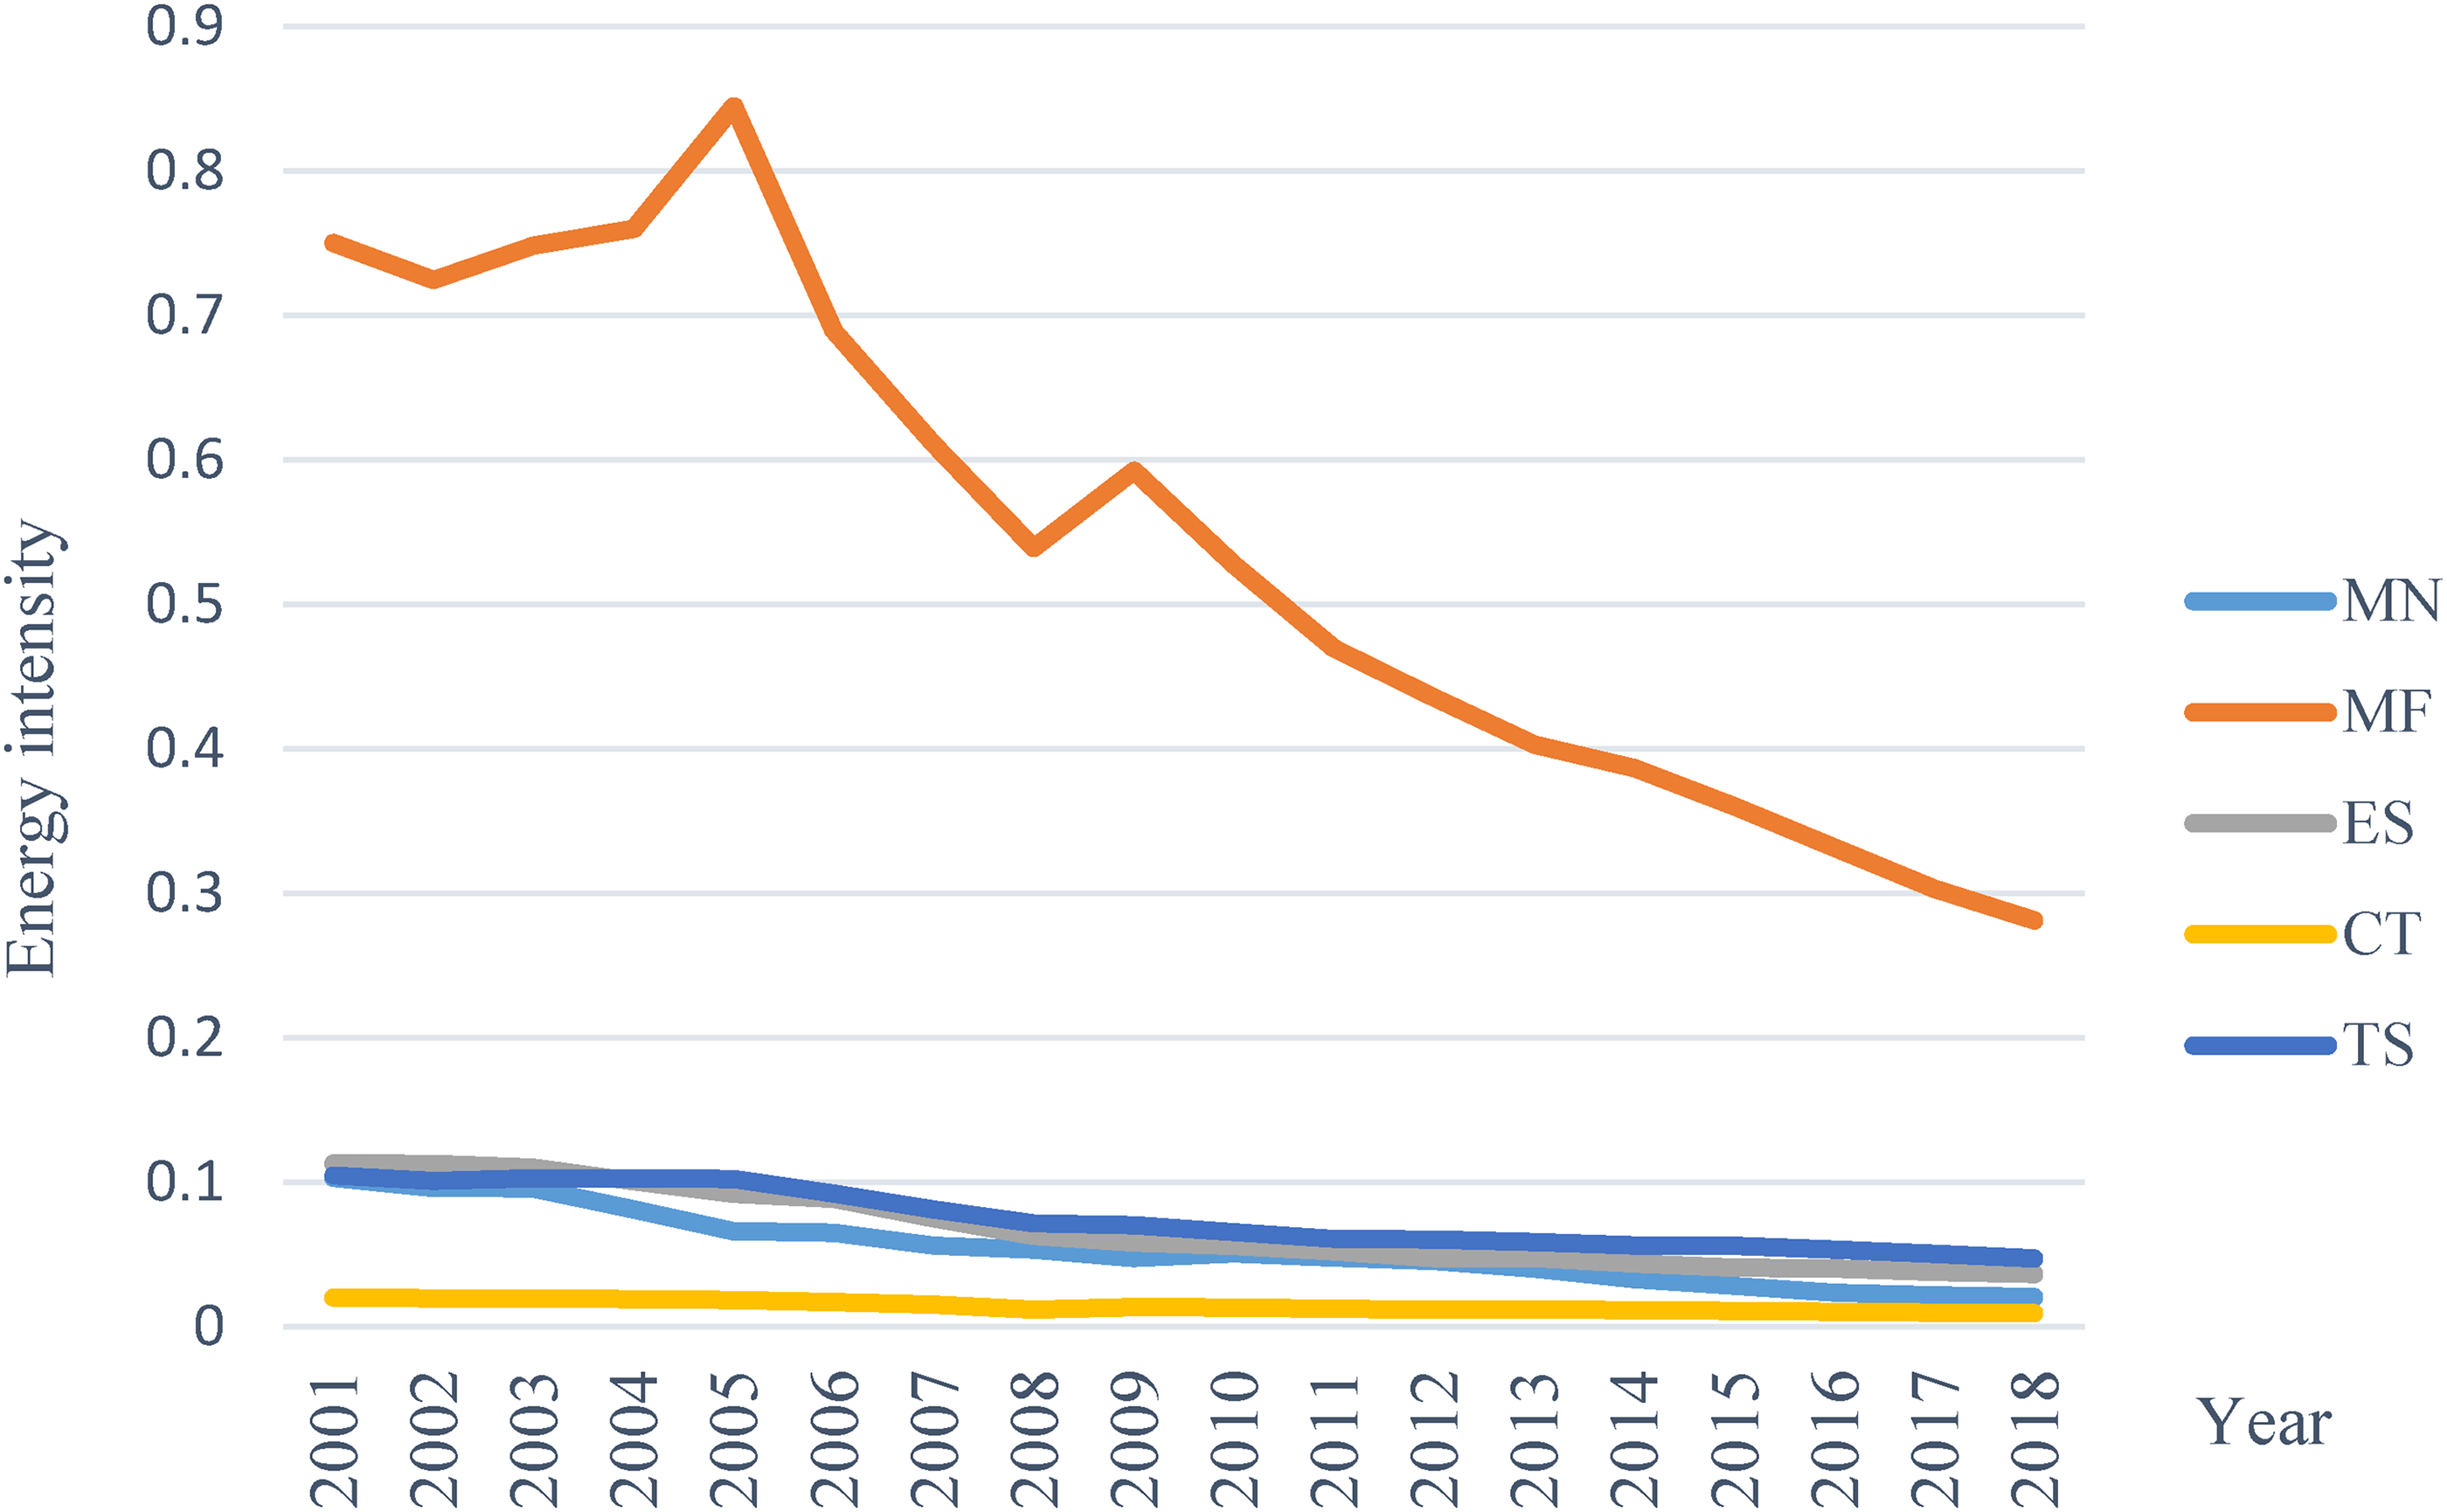
The trend of energy intensity in the TH industries from 2001 to 2018.
Conclusions and suggestions
Conclusions
According to the blue bar in Figure 2, it can be observed that from 2001 to 2009, compared with other influencing factors, population had little influence on carbon emissions, but after 2010, population's positive influence gradually increased, which is related to China's population growth rate. By 2018, the influence of population had fluctuated slightly, but it was growing compared with the previous decade. According to the black line in Figure 3, population has a small impact on carbon emissions of the TH industries. It can be predicted that with the liberalization of China's population policy, the impact of population on carbon emissions may gradually increase in the future. However, due to its small base, the overall impact is still small. By observing the purple bar in Figure 2, it can be found that during the whole study period, the energy structure has a great impact on the TH industries and shows periodic fluctuations. This is related to the policy orientation during fluctuations. Under the dual-carbon target, with the reform of China's energy structure, the proportion of dirty energy such as coal will be smaller and smaller. According to the green line in Figure 3, it is expected that the impact of energy structure on the TH industries will always be negative in the future, that is, with the optimization of energy structure, it will play a positive role in the reduction of carbon emissions. According to the green bar in Figure 2 and the red line in Figure 3, per capita GDP has been positive throughout the study period. Economic development promotes the increase of carbon emissions of the TH industries. As can be seen from Table 2, the two have always shown a good tendency of decoupling, and the impact of per capita GDP on carbon emissions will gradually decrease in the future, indicating that China's economic development model is gradually transforming. According to the gray bar in Figure 2 and the blue line in Figure 3, the influence of energy intensity is a fluctuating state. As can be seen from Table 3, combining with the decoupling model, the decoupling relationship between energy intensity and carbon emissions has regularity, which is a periodicity of strong negative decoupling—expansion negative decoupling—strong negative decoupling, which is inseparable from China's relevant policies. Optimization of energy intensity in the future is still an important direction to reduce carbon emissions of the TH industries. 24
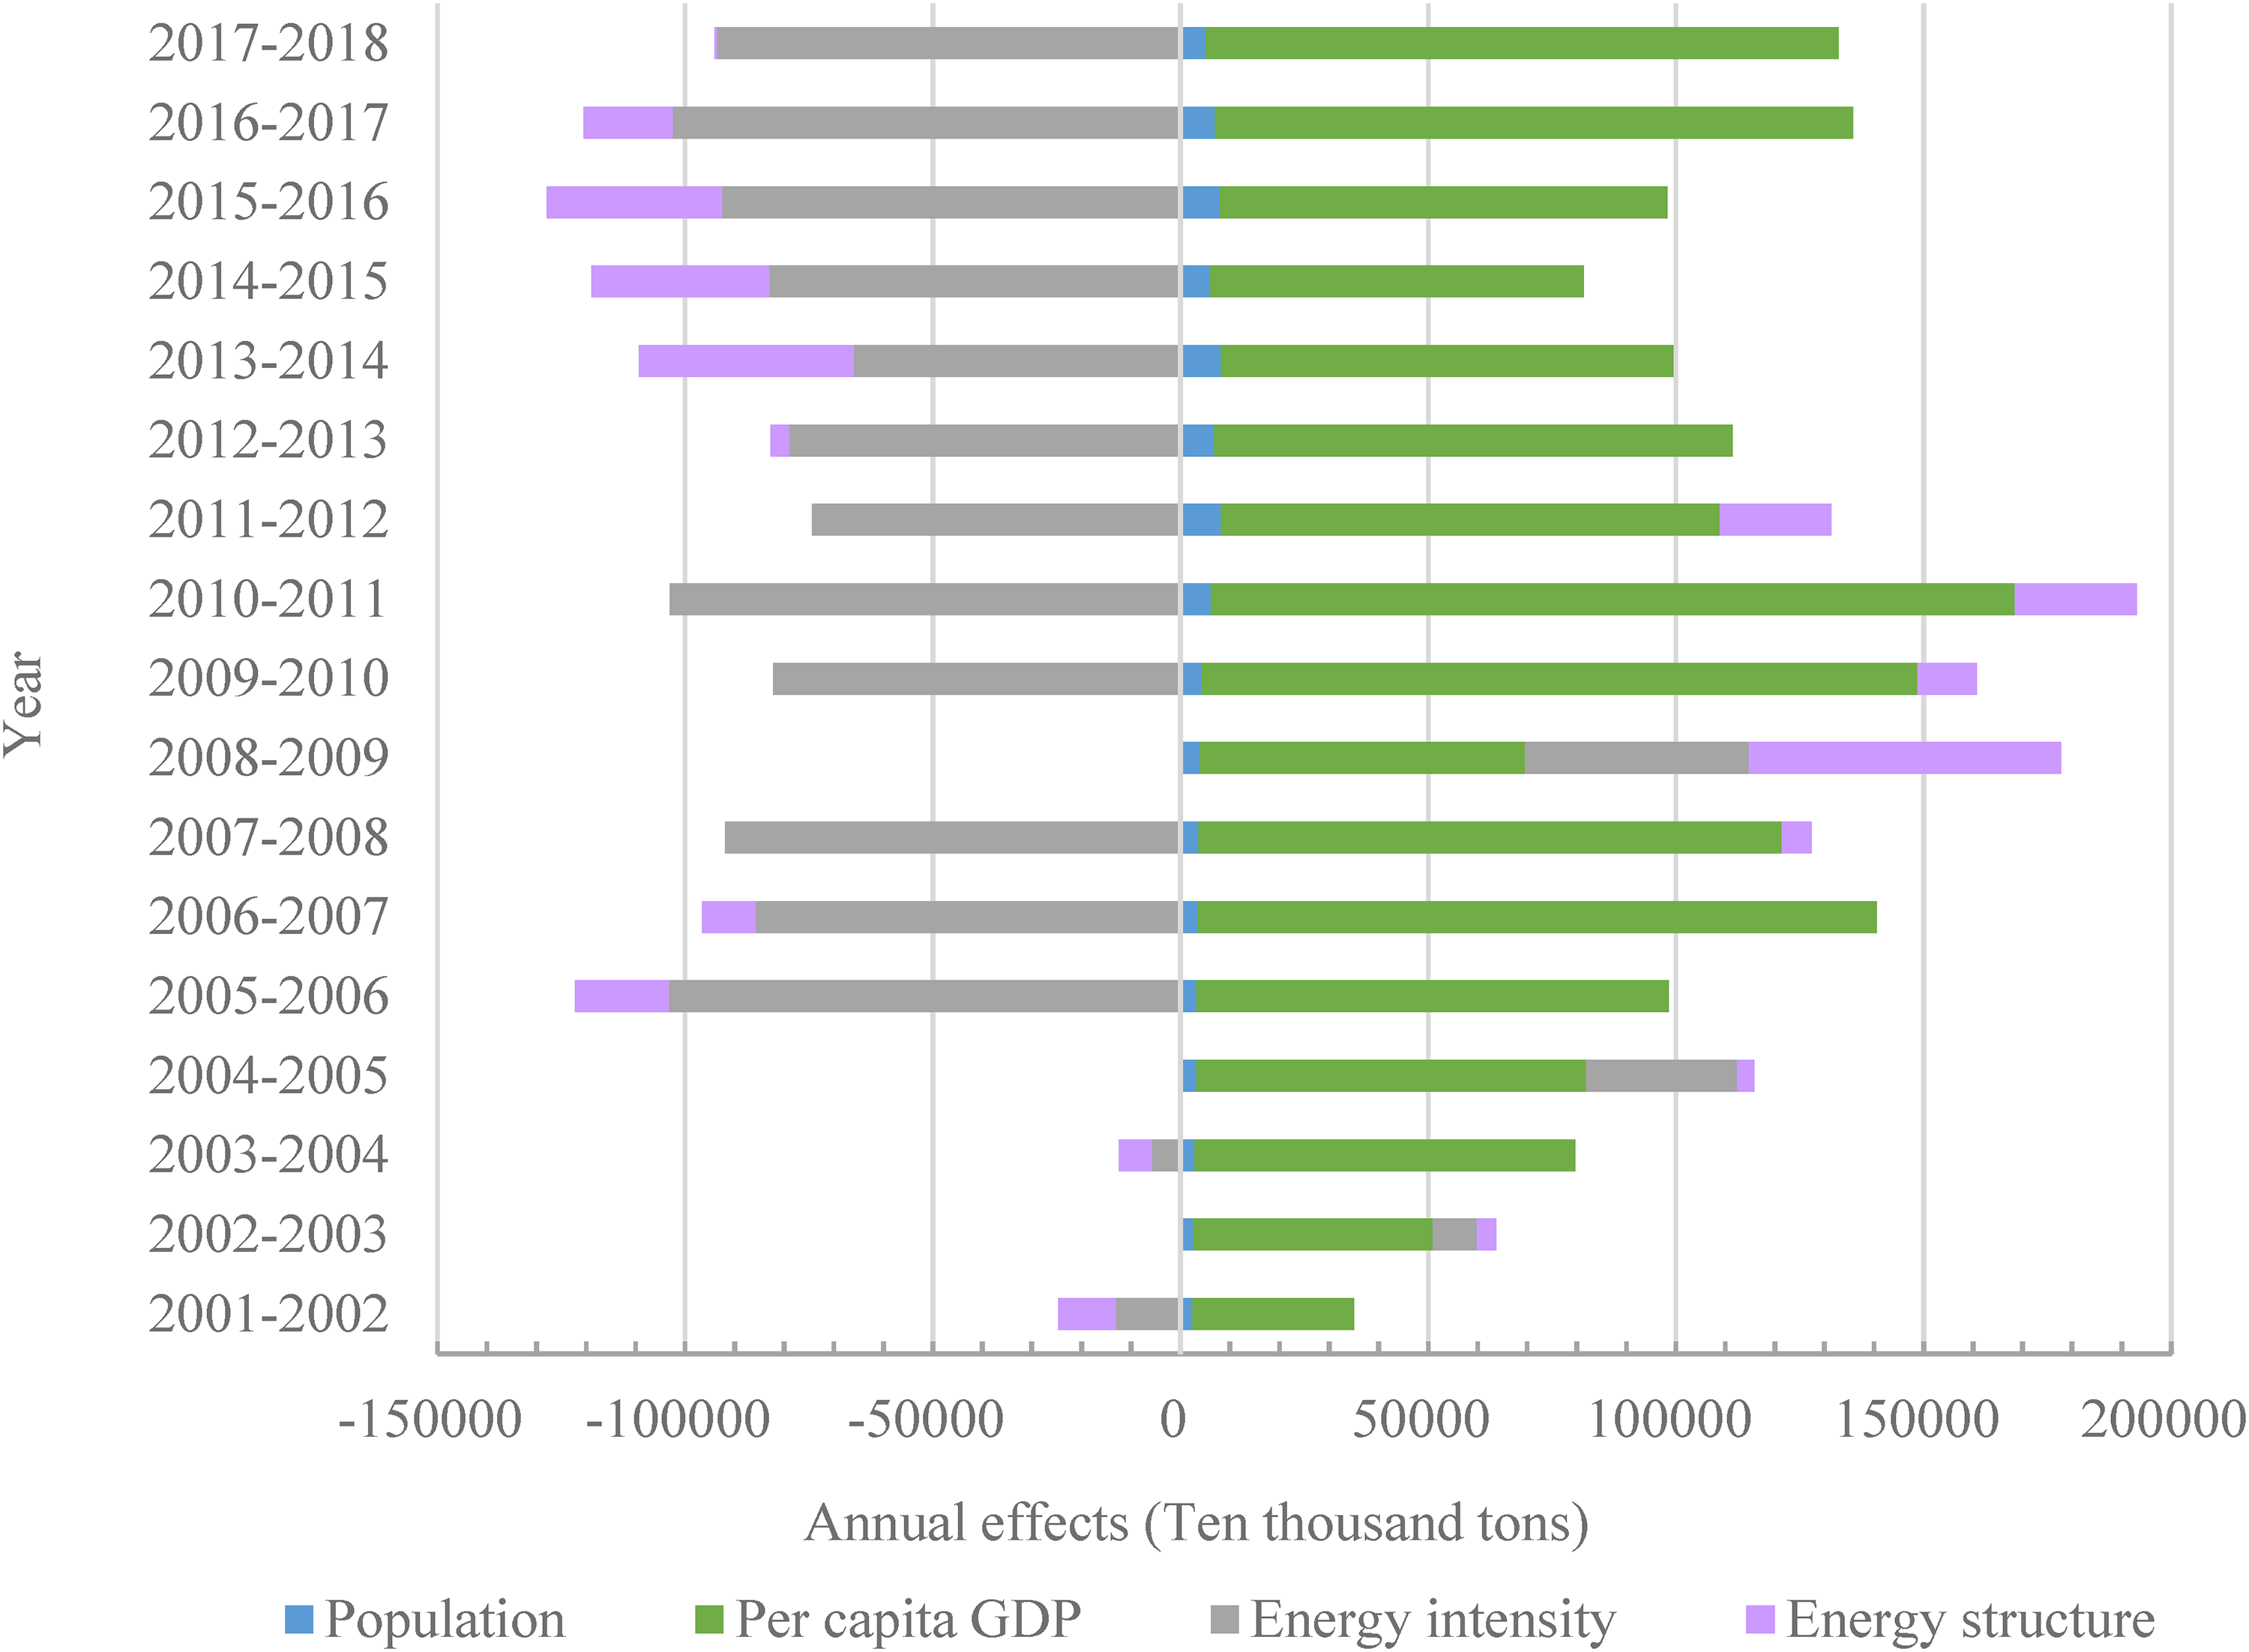
Annual effects of influencing factors on carbon emissions.
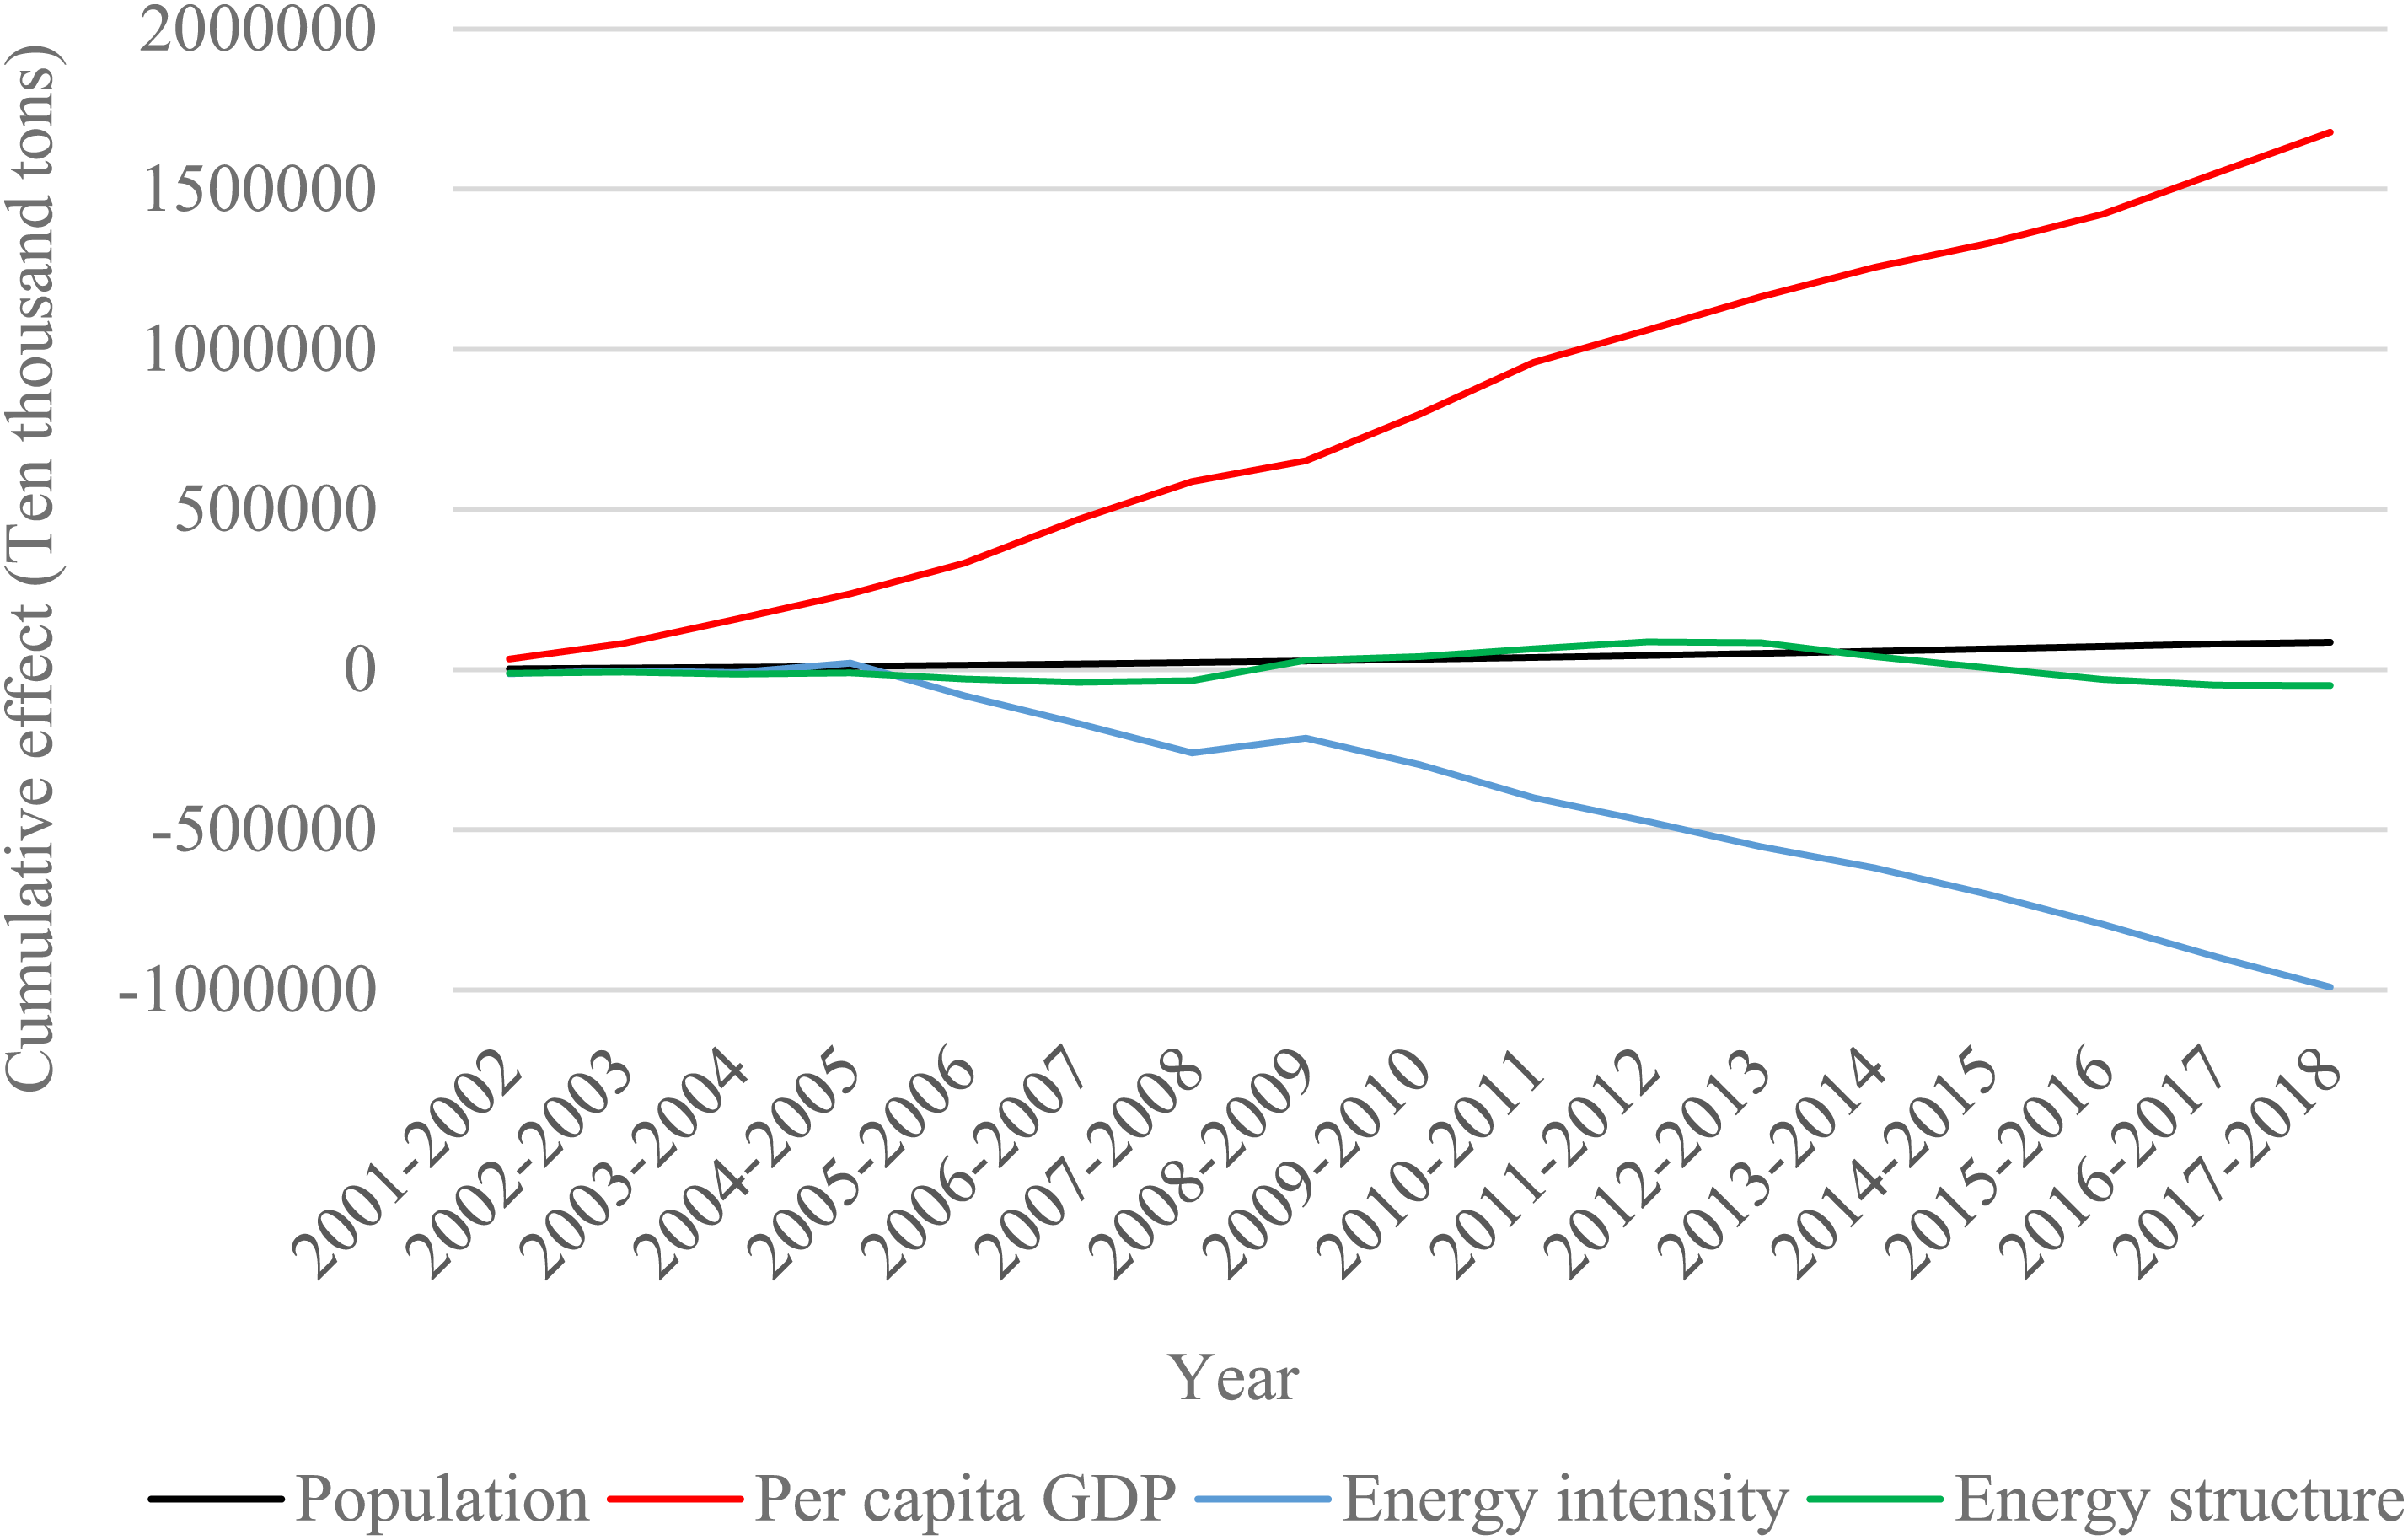
The cumulative effect of influencing factors on carbon emissions.
Although the scope of the existing literature is like the present work, this paper provides some new ideas for achieving carbon emission reduction in many new aspects. First, different from the studies that usually analyze a specific industry, this paper innovatively integrates multiple industries with high-energy consumption and high emission, and considers them as a whole to study the relationship between their carbon emissions and influencing factors. Compared with the study of a single industry, the research carried out in this paper is more comprehensive and more conducive to the formulation of emission reduction policies at the level of the TH industries. Second, after studying the influence of influencing factors on carbon emissions, this paper selects the two most influential factors and introduces the decoupling model for further analysis, to provide more in-depth theoretical support for reducing carbon emissions. Finally, in terms of methodology, this paper not only uses the decoupling model to analyze the relationship between economic development and carbon emissions, but also innovatively uses the decoupling model to analyze energy intensity and carbon emissions, and analyzes the different decoupling conditions of each industry. This paper also has some limitations. In Section 4.3, if specific policies of different periods in China are properly introduced for analysis, it will be more conducive to the formulation of carbon emission reduction policies.
Suggestions
By analyzing the relationship between carbon emissions and driving factors of the TH industries, this paper can provide suggestions for the development direction of the TH industries. The specific contents are as follows:
Substituting capital for energy consumption. Increase capital investment in technology,
44
so as to promote the development of green and clean energy structure without affecting the production of the TH industries, to reduce the consumption of dirty fossil energy. Improve technology, technological progress can reduce carbon emissions. Governments should increase support for researchers in clean energy technologies to reduce environmental carbon emissions. The government should provide financial and technical support in the early stage of research of clean energy-related technologies in the TH industries. After the technology is mature, we should actively help the enterprises to market their technology, so that the technology can gain economies of scale as soon as possible, which can effectively help the TH industry to achieve emission reduction targets quickly. For some foreign high-energy consumption and high-emission enterprises, it is necessary to do a job in the qualification review before entering, while welcoming foreign enterprises to enter, but also for the country's emission reduction targets. Consider optimizing policies according to the characteristics of regional and industry differences.
45
The government should formulate different emission reduction policies according to the different conditions of different regions and industries.
46
For industries with high-energy consumption, technical subsidies can be given to promote their optimization of energy structure, or policies can be formulated to promote their simplification of operation process, so as to achieve the effect of emission reduction. Perfect the carbon trading market and stimulate the development of technology through the means of carbon trading. To be able to develop effective and can achieve promotion of low-carbon technology projects of the industry, the government can give it more carbon emissions power, and enterprise in the case of carbon emissions by itself, the more carbon emission power, you can sell more carbon emissions in the carbon trading market power, to gain more benefits. In this way, it can promote the enthusiasm of the TH industries to research and develop clean energy technologies.
Highlights
The relationship between TH industries and high-emission industries is analyzed.
The reasons for the change of correlation degree of influencing factors are analyzed.
The influencing factors with the greatest emission reduction potential are obtained.
Supplemental Material
sj-pdf-1-eae-10.1177_0958305X221140567 - Supplemental material for Reduce carbon emissions efficiently: The influencing factors and decoupling relationships of carbon emission from high-energy consumption and high-emission industries in China
Supplemental material, sj-pdf-1-eae-10.1177_0958305X221140567 for Reduce carbon emissions efficiently: The influencing factors and decoupling relationships of carbon emission from high-energy consumption and high-emission industries in China by Xiaopeng Guo, Rong Shi and Dongfang Ren in Energy & Environment
Footnotes
Declaration of conflicting interests
The author(s) declared no potential conflicts of interest with respect to the research, authorship, and/or publication of this article.
Funding
The author(s) disclosed receipt of the following financial support for the research, authorship, and/or publication of this article: This work was supported by the Fundamental Research Funds for the Central Universities, the National Key R&D Program of China, the Beijing Social Science Planning Project, (Grant Nos. 2019FR002, 2020YFB1707802 and 22GLC041).

Supplemental material
Supplemental material for this article is available online.
References
Supplementary Material
Please find the following supplemental material available below.
For Open Access articles published under a Creative Commons License, all supplemental material carries the same license as the article it is associated with.
For non-Open Access articles published, all supplemental material carries a non-exclusive license, and permission requests for re-use of supplemental material or any part of supplemental material shall be sent directly to the copyright owner as specified in the copyright notice associated with the article.
