



Abstract
During the inhibition path of carbon emissions, the role of green finance is of increasing concerns, among which, green credit is regarded as crucial instrument. However, there exist insufficient empirical explorations on effects of green credit. Therefore, this study introduced intergovernmental panel on climate change method to calculate regional carbon emissions based on eight fossil fuels from 2008 to 2019 in China. Subsequently, spatial measurement, threshold regression, and intermediary model were further applied to examine how green credit may affect carbon emissions regarding the restraining effect, threshold effect, transmission mechanism, and spatial heterogeneity. The results show that: (1) green credit can effectively inhibited China's provincial carbon emissions although there existed regional inconsistency. (2) Appropriate levels of environmental regulation and marketization can enhance the repress effect of green credit. (3) Green credit can suppress provincial carbon emissions through optimizing the energy consumption structure, while there exists no intermediary effect of industrial structure upgrading during impact path. (4) Considering endogeneity, green credit can still significantly inhibit regional carbon emissions. These findings further enrich the current literature and provide references for policy design of constructing efficient carbon neutralization path.
Keywords
Introduction
Carbon emissions are negative externalities associated with economic activities. Long-term uncontrolled carbon emissions have caused extreme climate including greenhouse effect, melting glaciers, droughts, and floods, which have become the global challenge faced by mankind.1,2 Strengthening the global climate governance cooperation and promoting low-carbon economy have become the primary strategies of many countries.3,4 As the world's major carbon emitter, the carbon emission in China reached 10.15 billion tons in 2021, accounting for 30.2% of the global total emission.5,6 Aiming at low-carbon economy, China has actively responded to global carbon emission reduction actions, and made solemn commitment in the Paris Agreement on Climate Change to achieve carbon peaking by 2030 and carbon neutrality by 2060 (namely “30·60” goal).7,8 However, compared with developed countries, developing countries face severe challenges especially considering uncertainties resulted from post-epidemic era.9,10 Therefore, it is importance for developing countries to formulate an efficient carbon neutralization policy system with reference to local conditions. In particular, coupling industry-finance-market-policy, China should develop scientific carbon control policy system and achieve the “30 · 60” goal.
Regarding the “30 · 60” goal, a series of researches have been conducted on path explorations, advocating the importance of economic structural adjustment, energy replacement, technological innovation, and green innovation on carbon emission reduction.5,11–15 However, the scientific path plan urgently needs sufficient funds to be escorted. In order to balance the relationship between carbon emissions and finance, the academic community began to pay attention to the relationship between green finance and carbon emissions, since green finance is regarded as the important instrument of carbon control.16,17 As the crucial instrument of green finance, green credit utilizes credit leverage to restrict the development of pollution- and energy-intensive industries, and thus reducing environmental risks. 18 Compared with traditional credit policy, green credit integrates the strategies of environmental protection and sustainable development with credit service system, which stimulates social funds into green industries and reduces the cost of industrial energy transformation, thus minimizing the total cost of carbon neutralization society.19–21 However, the existing literature regarding green credit and carbon emission reduction remain at the theoretical level, most of which, focuses on the relationship between traditional credit policy and environment governance, while the conclusions are inconsistent due to differences in research perspectives, research subjects, and green characteristics. 22
On the other hand, faced by “30 · 60” strategic goal, there exists various factors affecting carbon emission reduction, and thus it is necessary to further deepen the relationship between green credit and carbon emissions. In particular, spatial heterogeneity resulted from different regional element systems should be clarified; and potential transmission mechanism should be captured as well as considering both market and government impact on the inhibition path. The abovementioned research gaps can reduce the integrity of the research pedigree. Therefore, the main contributions of current research include: ① systematically portray how green credit reduces carbon emissions; ② clarify the threshold effect and intermediary transmission paths of repress impact; ③ reveal the associated spatial heterogeneity; ④ provide empirical evidence for countries with economies in transition. The rest of this research is organized as follows: theory and hypotheses are outlined in Section 2, while methods and data are elaborated in Section 3. Section 4 indicates the results and discussion. Section 5 draws the conclusions.
Theories and hypotheses
Green credit and carbon emission
Green credit presents distinct properties of top-level policy, which restricts the extension of pollution-intensive industries and prevents environmental risks through credit leverage. Gianfrate and Peri 23 argued that green credit is the crucial policy instrument to enhance fund mobility and economic transformation as well as carbon emission reduction. Glomsrød and Wei 24 claimed that green credit could achieve carbon emission reduction of 470 million tons by 2030 if it could be operated on a reasonable track. In addition, green credit restricts the provision of loan and implements punitive high interest rate for pollution- and energy-intensive industries as well as surplus industries, and thus increasing their financial costs, 25 which subsequently stimulate enterprises to promote green production. 11 In detail, through fund formation mechanism and fund oriented mechanism, green credit provides increasing funds to emerging industries of energy conservation and environmental protection, while restricting loans to energy- and pollution-intensive industries. In the short term, large-scale capital can be raised to promote green industries and thus accelerating the industrial transformation and upgrading as well as achieving carbon emission reduction 18,26, 27 . Moreover, through credit catalytic mechanism, not only short-term profitable projects but also long-term sustainable projects can receive investment, generating catalytic effect on industrial transformation and upgrading, which subsequently reduce carbon emissions. Therefore, the first hypothesis can be proposed:
Green credit can significantly curb provincial carbon emission.
Threshold effects of degree of marketization and environmental regulation
There exist preconditions for the inhibition effect of green credit on regional carbon emissions. Regarding economic system in China, government regulations and marketization are important factors affecting the repress impact of green credit.10,18 As a financial policy instrument, with the deepening of financial reform, the marketization characteristics of green credit have become increasingly prominent. In order to vigorously promote carbon emission reduction, the government should reduce the access threshold and administrative control to activate market flexibility through policy, investment promotion and other aspects. 9 ,26 Yi Gang, from the central bank of China, indicated that the role of the market should be fully extracted to improve the financial system and consolidate the impact path 9 (Lyu et al., 2022). Ruiz et al. 28 claimed that in the immature stage of market-oriented development, repress impact of green credit depends on policy regulation as the remedy. Environmental regulation can be an important impact factor of green credit on carbon emissions since it can promote energy conservation, emission reduction, and low-carbon development of microeconomic entities, as well as increase the cost of pollution and institutional compliance. Romano et al. 29 further argued that active green environmental regulation policy could promote investment in green production and achieve the purpose of carbon emission reduction. In addition, Xia and Li 30 explored the micro level of enterprises and believed that in the immature stage of the market, environmental regulation is one of the effective means to optimize the efficiency of green credit allocation and reduce carbon emissions. Therefore, as an external constraint, environmental regulation can affect the costs and profits of economic activities, thus affecting the green credit decisions of microeconomic entities. However, different intensities of environmental regulation may result in asymmetrical costs and benefits of economic activities, which can dynamically affect the carbon reduction effect of green credit. Hence, environmental regulation (ER) and degree of marketization (DM) may directly affect the effectiveness of green credit in the path of carbon emission reduction and the following two hypotheses are proposed:
DM generates threshold effect during the inhibition process of green credit on provincial carbon emission.
ER has threshold effect during inhibition process of green credit on provincial carbon emission.
Transmission mechanism of green credit
Green credit can significantly promote the optimization of regional energy consumption structure (ECS), which is the key factor of carbon emission reduction. 19 ECS is closely related to the quality of the environment, since large proportion of coal, oil, and other fossil fuels can cause excessive carbon emissions. Therefore, ECS optimization can effectively promote carbon emission reduction.25,31 Green credit can generate “crowding-out effect” on energy- and pollution-intensive industries. In detail, environmental pollution can be internalized as the financing cost of polluting enterprises, thus accelerating the upgrading of carbon emission equipment and technology, enhancing the substitution of clean energy for fossil energy consumption, promoting ECS, and subsequently achieving carbon emission reduction. In addition, green credit plays capital-oriented role by providing low-cost credit through structural monetary policy, diverting capital flow into green industries, and promoting green industry expansion. Subsequently, the production and consumption of clean energy can be enhanced and ECS can be optimized, thus reducing carbon emissions.26 Hence, H4 is proposed as follows:
ECS plays an intermediary role during the repress impact of green credit.
Industrial structure upgrading (ISU) remains one of the important paths to reduce energy consumption as well as carbon emissions. Green credit can divert capital to different enterprises through differential interest rates, which is essentially the capital flow process among various industries, thus resulting in differences in the development of industrial sectors and industrial structures. 32 Particularly, green credit can promote both replacement of traditional energy with clean energy and environmental pollution projects by environmental protection projects. 33 From macroeconomic perspective, green credit can be conducive to the elimination of energy- and pollution- intensive industries, and promote the capital transfer from polluting industries to low-energy and clean industries, thus contributing to regional energy conservation and carbon emission reduction.2, 34 Furthermore, green credit contributes to forcing pollution-intensive enterprises to carry out technological innovation and product/service upgrading, forming green incentive effect on the industry. Capital flow from credit institutions to green enterprises generates a signal to the society to develop green economy. As a policy instrument, green credit creates strong guiding effect on industrial investment, diverting capital flow to energy-saving and environment-friendly industries, such as high-tech industry, knowledge- or service-based economy, and so on, which facilitates ISU as well as carbon emission reduction. 21 Therefore, the following hypothesis is proposed:
ISU plays an intermediary role during the repress impact of green credit.
Theoretical mechanism model
According to abovementioned analysis, a theoretical mechanism model is presented in Figure 1 to portray how green credit repress carbon emissions. In detail, the inhibition path, transmission path, and possible threshold effect of green credit on carbon emissions are integrated to visually present the research context. The logical inhibition path of green credit on carbon emissions is stereoscopically displayed, which echoes the research hypothesis.

Impact mechanism of green credit on carbon emissions.
Methods and data
Model construction
(1) Spatial metrology model setting:
SDM model is prior to SAR and SEM model since it integrates the advantages of both models. Therefore, SDM was introduced to explore the transmission mechanism and spatial correlation between green credit and provincial carbon emissions in China. The model construction is shown as follows:

(2) Exploratory spatial analysis
Examining spatial correlation of economic variables remains the key step in establishing spatial econometric models. Moran I index can reflect the similarity degree of spatial adjacency or spatial adjacency regional unit attribute values, which is usually applied to test the spatial correlation of variables. In detail, the Global Moran's I ∈[1-1], I ∈ [-1-0) represents negative relationship while I ∈ (0-1] indicated positive relationship.

(3) Spatial matrix
The establishment of weight matrix is the premise of introducing spatial econometric model for empirical analysis since reflection of location relevance stays as the core of the empirical analysis of spatial econometric model. Common spatial weight matrices include proximity, geographical, and economic weight matrices. Since carbon emissions are not only generated from local but also from adjacent regions, this study explored the relationships among variables taking the geographical weight distance into account. Hence, the geospatial matrix is constructed as follows. In detail,

Impact of green credit may be affected by external factors. Therefore, ER and DM were treated as threshold variables to conduct the threshold model. Subsequently, possible threshold effects under the situations with different threshold variables can be portrayed.


Data and index selection
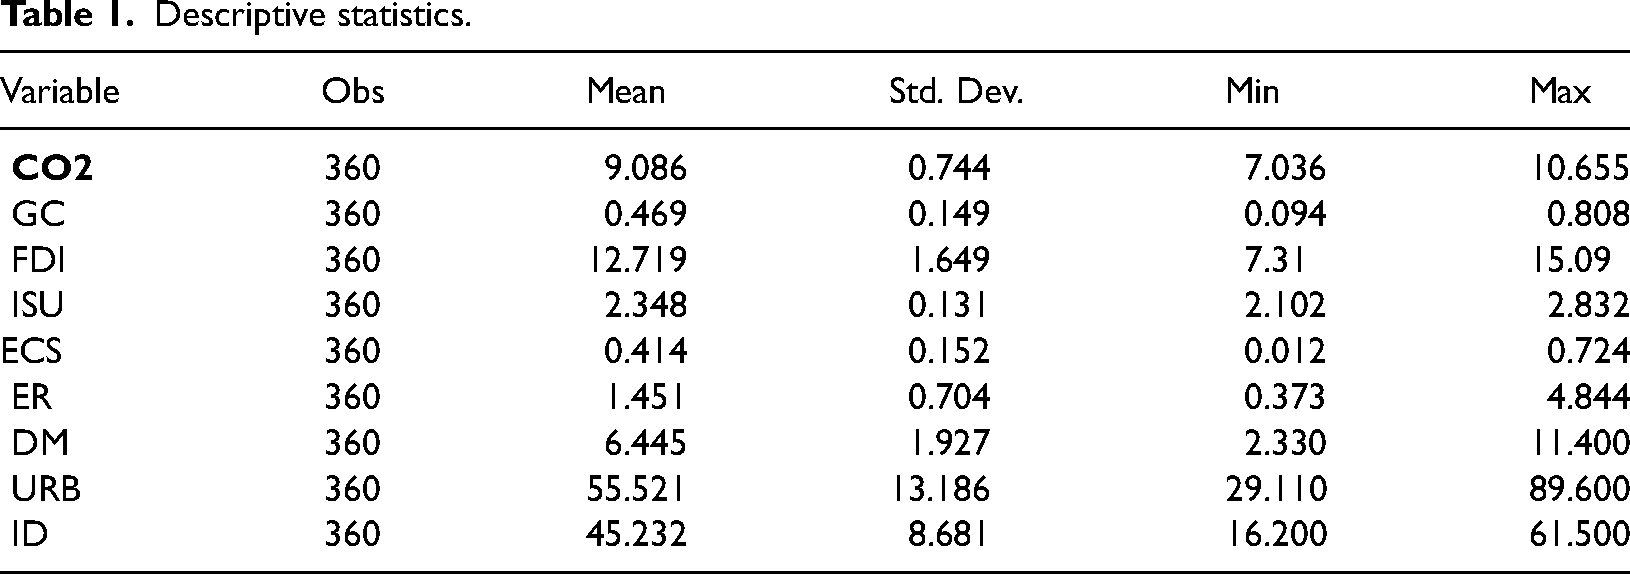
Based on provincial panel data, this research examined the relationship between green credit and China's provincial carbon emissions. In order to avoid large differences in regression coefficients, some variables were logarithmically processed to eliminate the impact of heteroscedasticy, and interpolation processing was carried out for individual missing data. Relevant variable data were collected from China Statistical Yearbooks. The statistical description of variables is shown in Table 1. In particular, the deviation of each variable (except for the natural logarithmic variable) is relatively small, which implies that the fluctuations of variables such as carbon emissions, green credit, ISU, Foreign direct investment (FDI), environmental regulation, and marketization degree of China's province remains relatively stable; while the maximum value, minimum value, mean value and deviation value of each variable are significantly different, implying the significant differences among carbon emissions, green credit and related variables, despite overall growth trend remains significant.
Descriptive statistics.
(1) Explained variables

(3) Threshold variables
(4) Control variables
The research introduced the ratio of secondary industry in regional GDP to measure ID. 38

Results and discussion
Statistical analysis
(1) Unit root test
To ensure scientific research, LLC and Fisher unit root tests were applied before introducing the spatial econometric model to verify the stability of variables. Table 2 presents the results. In particular, according to the results of LLC and Fisher tests, all variables except ER pass the significance test. Therefore, there exists no unit root for the selected variables except for ER. Thus, selected data can be concluded to be relatively stable and the regression results are overall reliable. However, the existence of unit root of ER may not reject the existence of cointegration, and further cointegration testing is required.
Unit root test.

***p < 0.01, **p < 0.05, *p < 0.1.
(2) Cointegration test
Targeting at long-term stability among variables, Pedroni test and Westerlund test were introduced to conduct homogeneous and heterogeneous panel tests respectively, of which, the null hypotheses refer to “there exists no cointegration relationship.” The test results presented in Table 3 indicate that the P-values of Pedroni test and Westerlund test are less than 0.01, rejecting null hypotheses. Therefore, there exists long-term cointegration relationship among variables selected and the econometric model can be applied for regressive analysis.
Cointegration test.

(3) Spatial correlation test
The carbon emissions of neighboring regions can indirectly affect the carbon concentration of neighboring provinces due to the impact of airflow, water flow, and industrial transfer. Therefore, with application of geographic weight matrix, Moran's I of green credit and carbon emissions were calculated. As can be seen from Table 4, the Moran’ I indexes of green credit and carbon emissions from 2008 to 2019 pass the significance test and fall between [0.406−0.701], [0.287−0.329], respectively, indicating the existence of positive spatial autocorrelation. Therefore, it is rational to apply spatial econometric model.
Moran's I index of GC and CO2 emission from 2008 to 2019.

***p < 0.01, **p < 0.05, *p < 0.1.
In order to further analyze the spatial heterogeneity of GC and CO2 emissions, the Moran's I scatter diagrams of green credit and carbon emissions were portrayed through STATA. As shown in Figures 2 and 3, the positive spatial autocorrelation of GC and CO2 emissions have been further verified since the selected variables are clustered in the first and third quadrants.

Moran's I scatter of carbon emission.
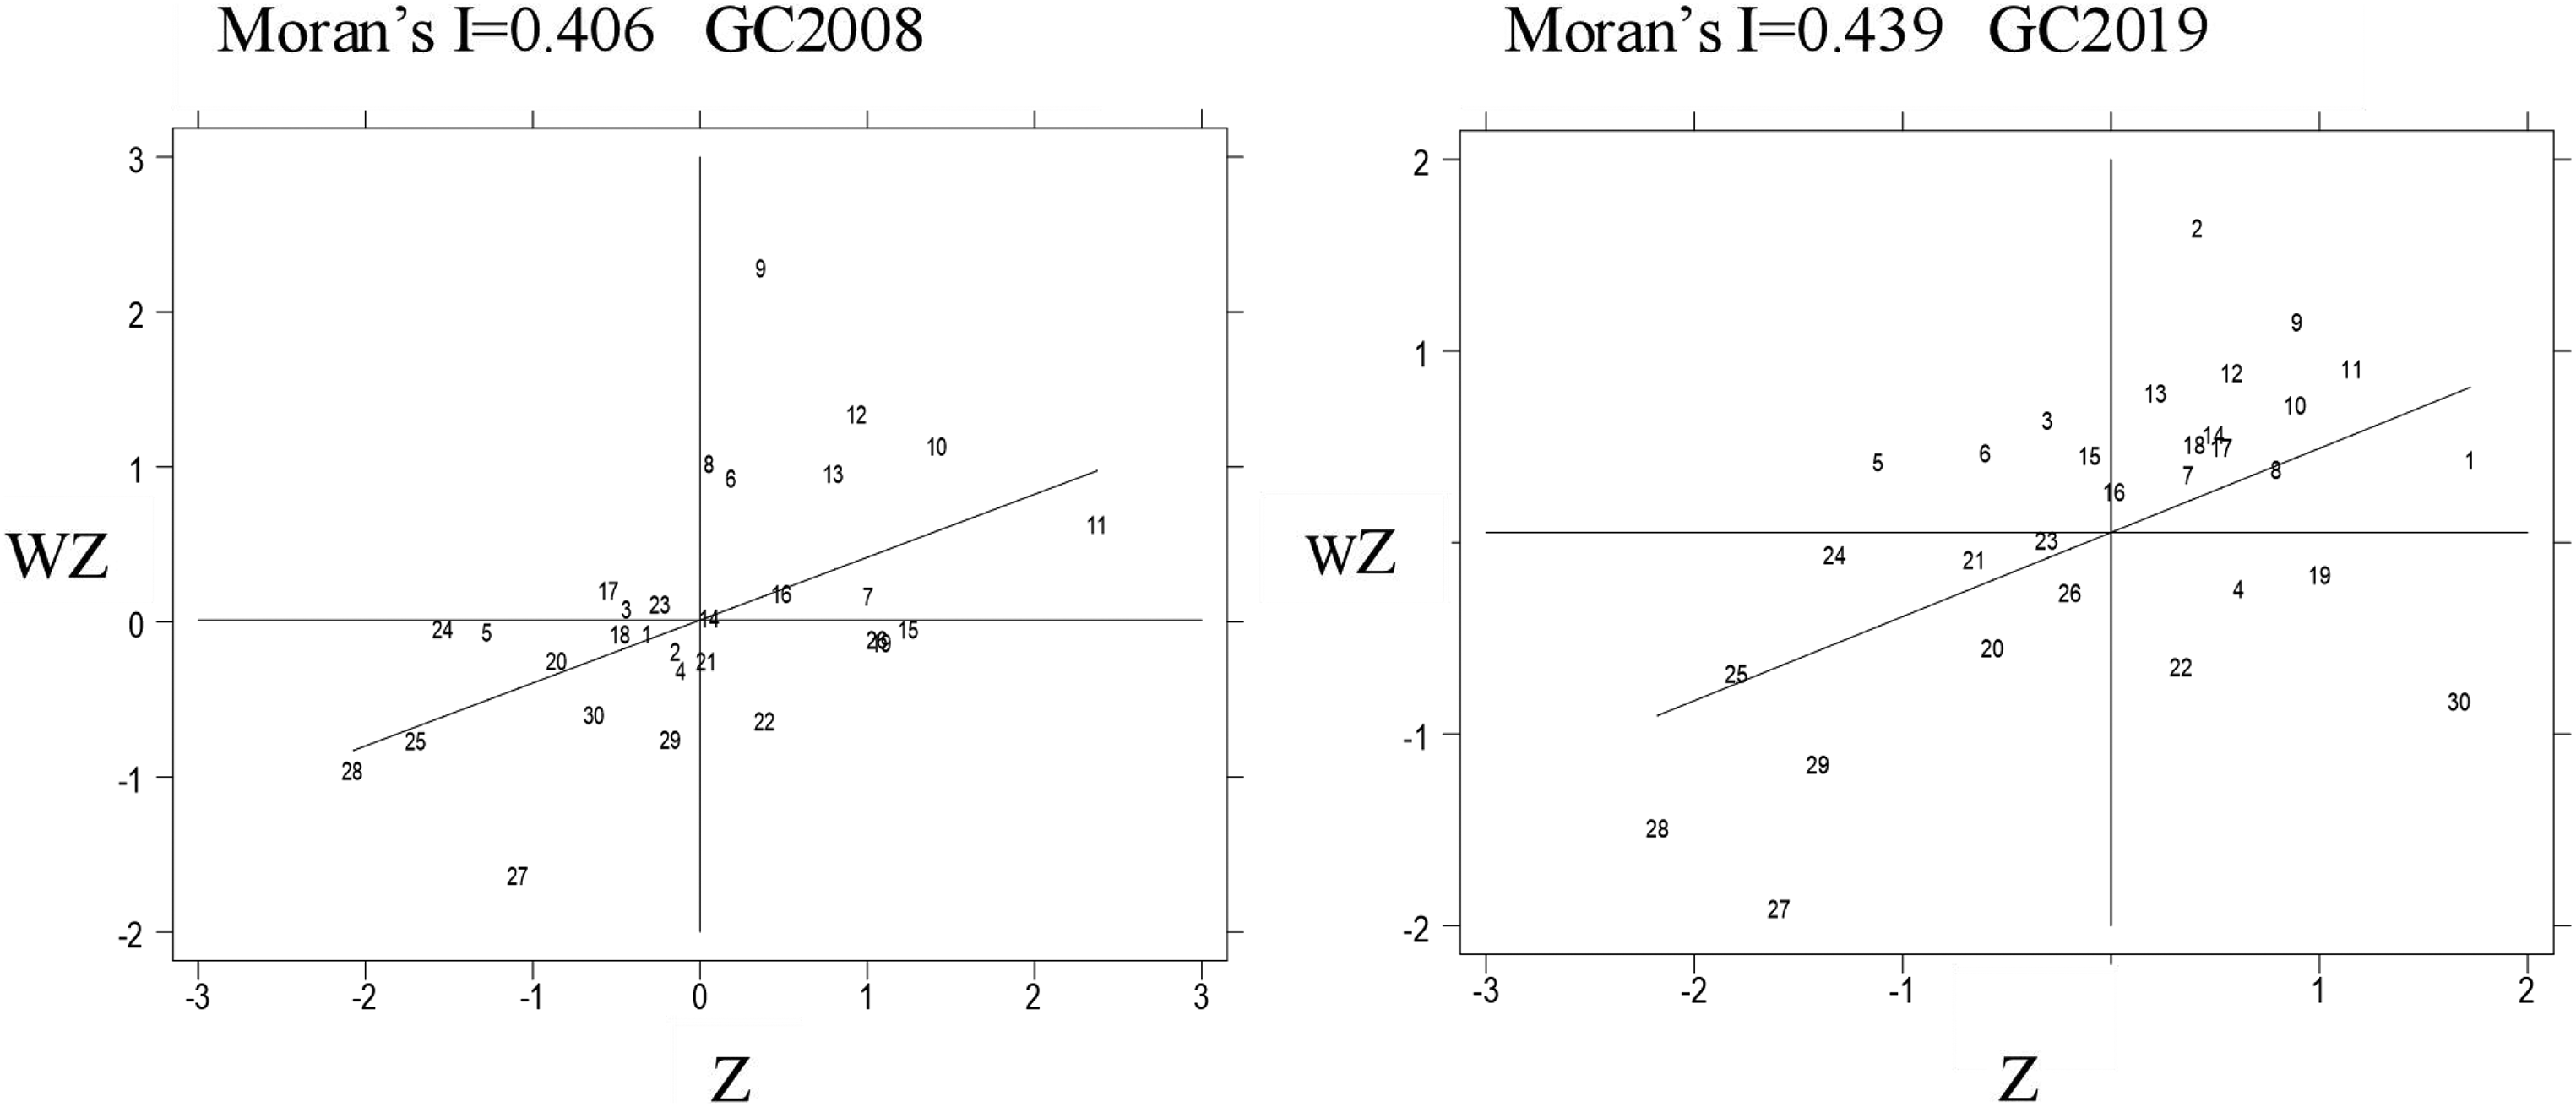
Moran's I scatter of green credit.
Analysis of direct effects
(1) Selection of spatial model
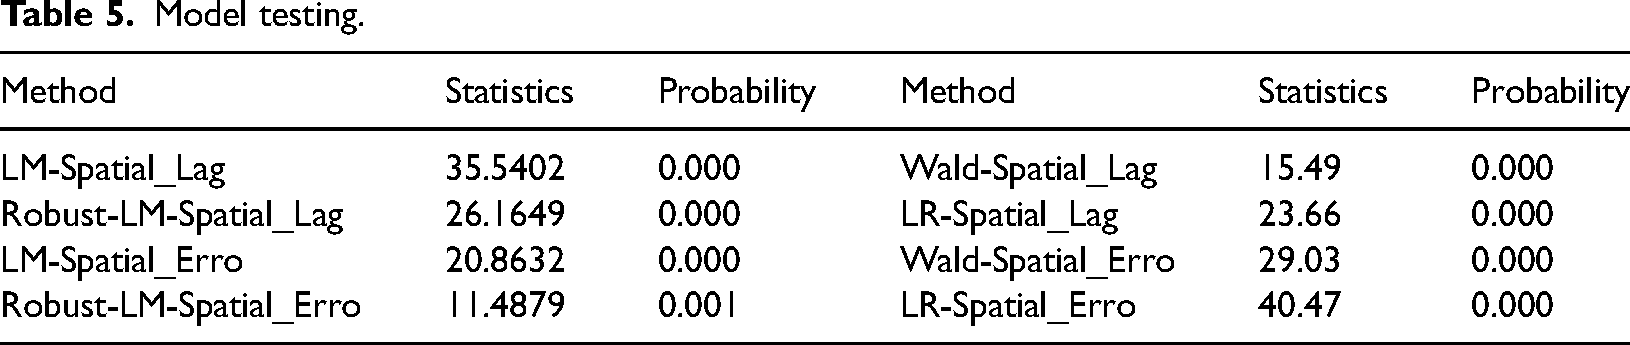
During the process of exploring the relationship between GC and CO2 emissions, best-fitted spatial model should be determined at first. With reference to Anselin's 40 research, Hausman test result shows that the selected model passes the 1% significance test, indicating the fixed effect model to be more suitable. In addition, as shown in Table 5, the statistics of LM and R-LM tests pass the significance test, where the statistics of SAR model is greater than that of SEM model, indicating SAR to be more appropriate. Moreover, the statistics of Wald and LR tests pass the significance tests, showing that SDM model cannot degenerate into SAR or SEM models. Therefore, the subsequent analysis mainly refers to SDM model.
Model testing.
(2) Relationship between green credit and carbon emission
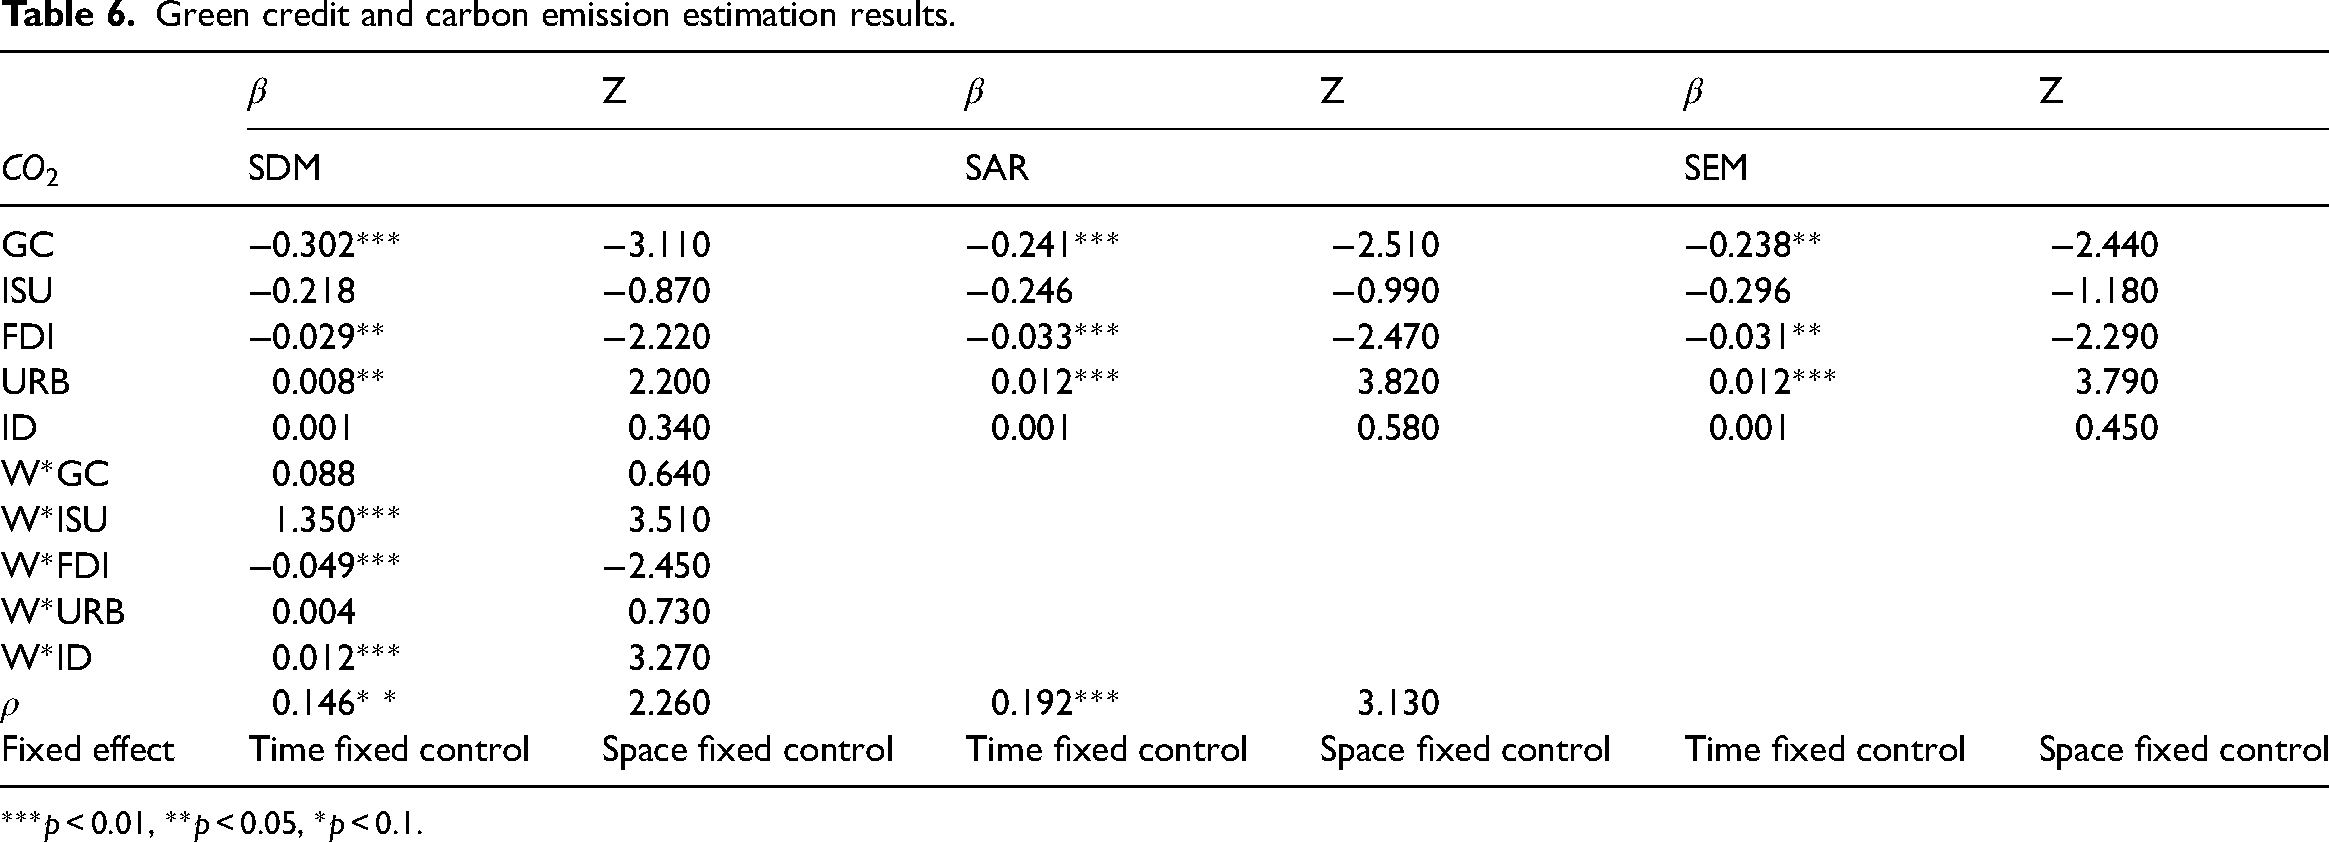
The regression results are presented in Table 6, the impact path of green credit on carbon emission refers to −0.302***, passing the 1% significance test. The possible reasons include that green credit can reduce the proportion of non-green industry credit through capital flow selection; promote ISU; and eventually achieve industrial carbon emissions reduction. Therefore, H1 is accepted. Regarding control variable, FDI significantly suppresses regional carbon emissions (−0.029**), which verifies the pollution halo theory and denies the pollution paradise theory. On the other hand, industrial structure upgrading has restrained regional carbon emissions (−0.218) to a certain extent while the impact is not significant, indicating that regional industrial structure upgrading is insufficient. In addition, the level of urbanization and industrialization remain the major carbon sources, which is also the root of government commitment to the construction of new-type urbanization and industrial transformation.
Green credit and carbon emission estimation results.
***p < 0.01, **p < 0.05, *p < 0.1.
Endogenous test
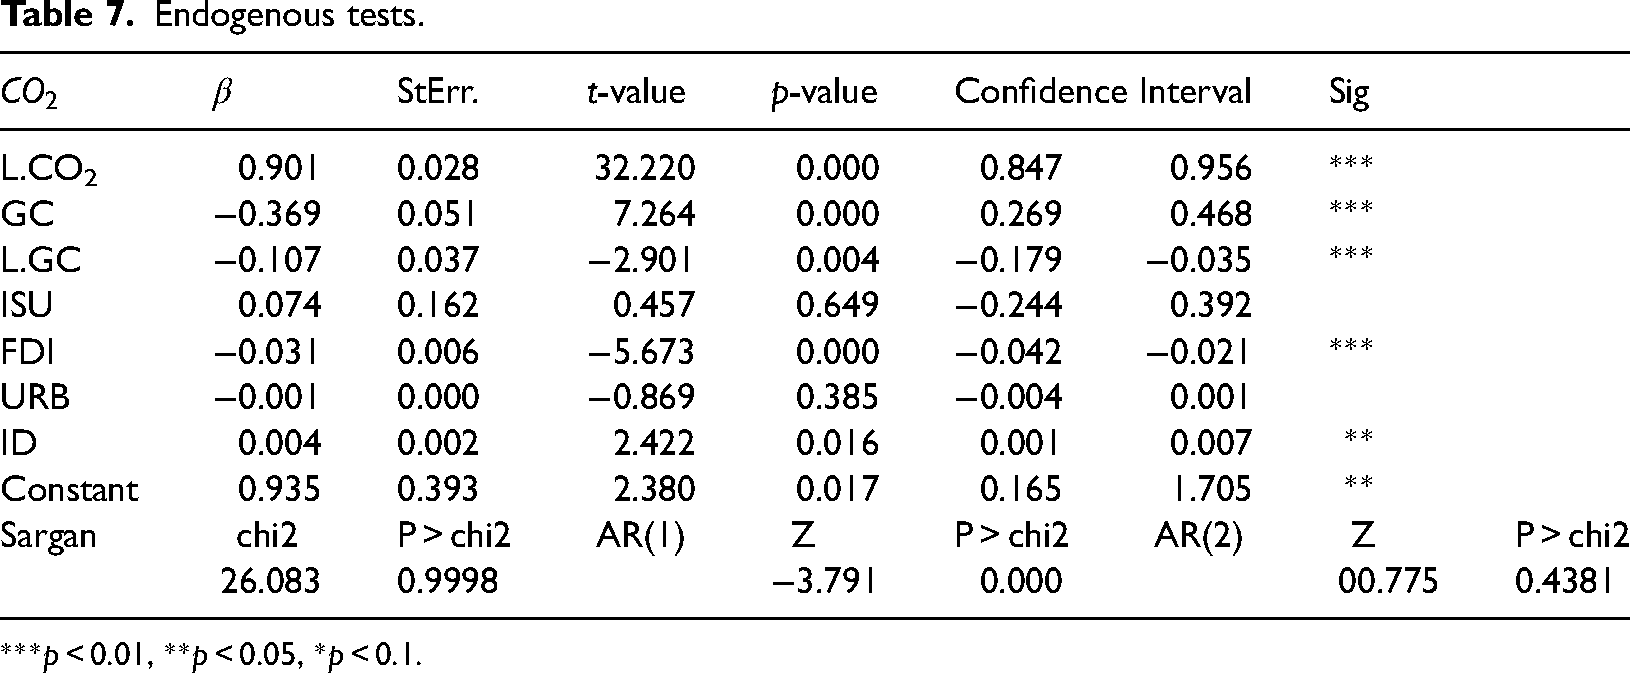
Considering endogenous problems such as two-way causality or omitted variables, which may hinder the reliability of research conclusions, SYS-GMM model was applied. In particular, lag of one period of CO2 emissions (L.CO2) was considered as instrument variable (IV), while lag of one period of green credit was considered as explanatory variable to minimize the research deviation caused by the existence of endogenous problems. In detail, as can be seen from Table 7, the coefficient of L.CO2 remains positive, verifying the robustness of current research and reflecting the accumulation of CO2 emissions in regions. Hence, application of SYS-GMM model is rational. On the other hand, the result of AR (2) suggests that the random error term does not have second-order sequence correlation, while Sargan test suggests the validity of IV. Furthermore, coefficient of GC is −0.369, passing 1% significance test. Thus, GC can still effectively restrain CO2 emissions, while its impact path has been enhanced after concerning the relevant endogenous problems, which further verifies the robustness of current research.
Endogenous tests.
***p < 0.01, **p < 0.05, *p < 0.1.
Threshold effect analysis
There exist external factors affecting the repress impact of GC, among which government regulation and DM are considered as core factors. 10 Therefore, possible threshold effects are explored considering environmental regulation and marketization degree as threshold variables in order to further clarify the internal mechanism of inhibiting process.
(1) Degree of marketization
Government cannot solely ensure the healthy development of green credit system while the market also plays important role. The DM is a necessary prerequisite, which can facilitate financial system innovation; innovate financial derivatives; optimize the allocation of credit resources; promote green industry and low-carbon development. However, it is still doubtful to what extent marketization will affect impact path of GC on CO2 emissions. Therefore, this study explored the threshold effect of marketization degree with reference to Hansen's work, 41 of which, the results are presented in Table 8.
Threshold effect test.
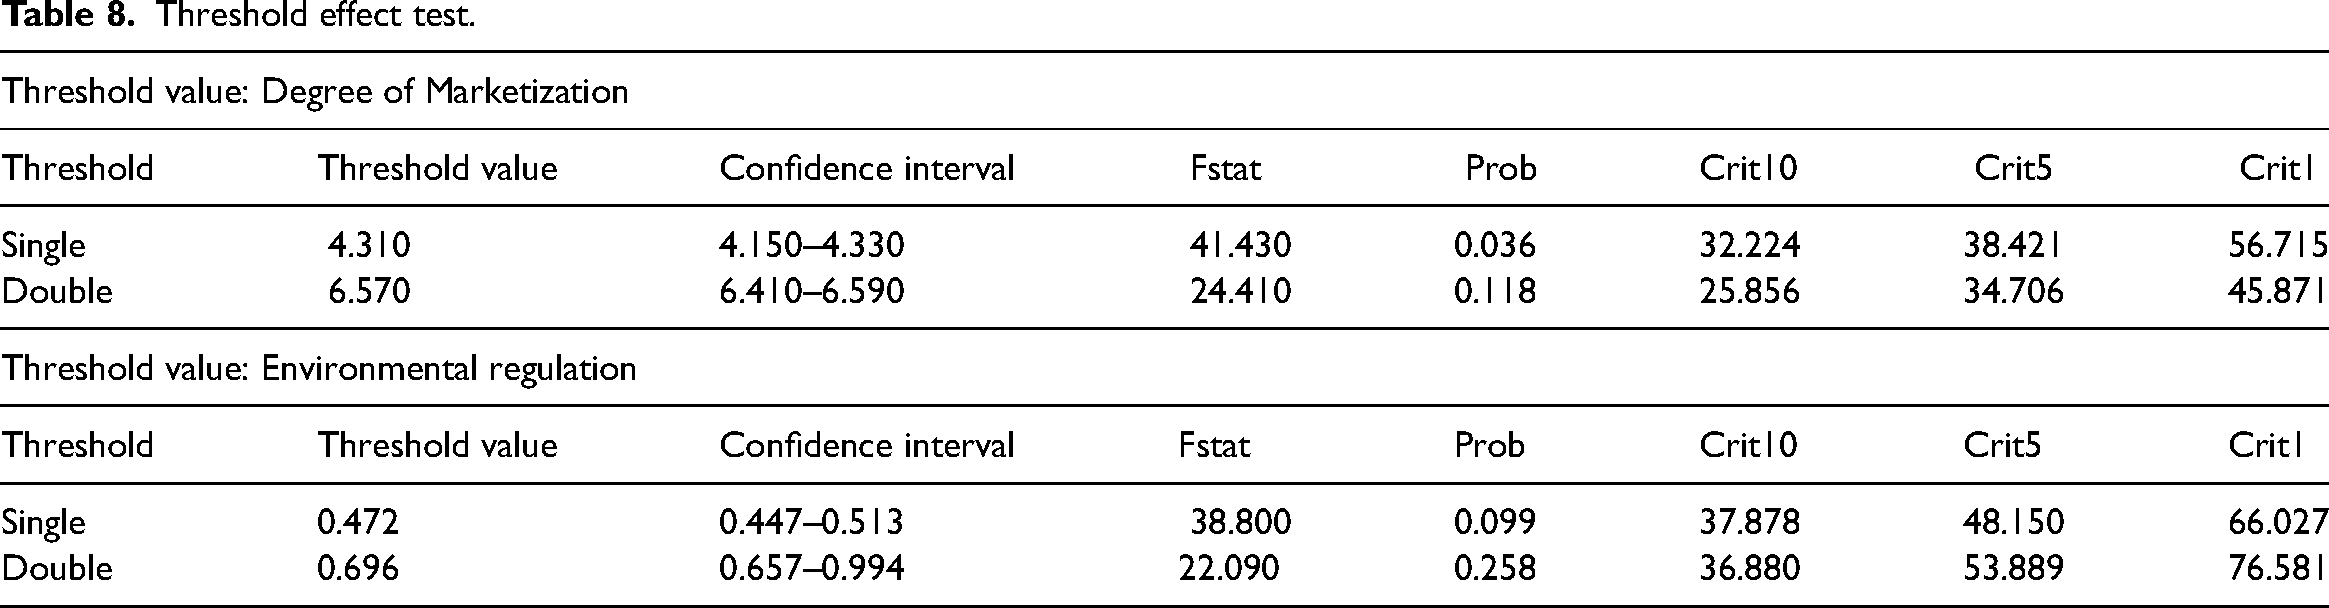
In detail, single threshold effect of MD pass the 5% significance test with the corresponding P-value to be 0.036; while the double threshold effect is insignificant with corresponding P-value to be 0.018. Hence, the single threshold effect of MD exists with its value being 4.310 that falls into 95% confidence interval. Regarding Figure 4, the accuracy of threshold value has been further verified. Thus, it can be concluded that the threshold effect estimation of marketization degree is rational.
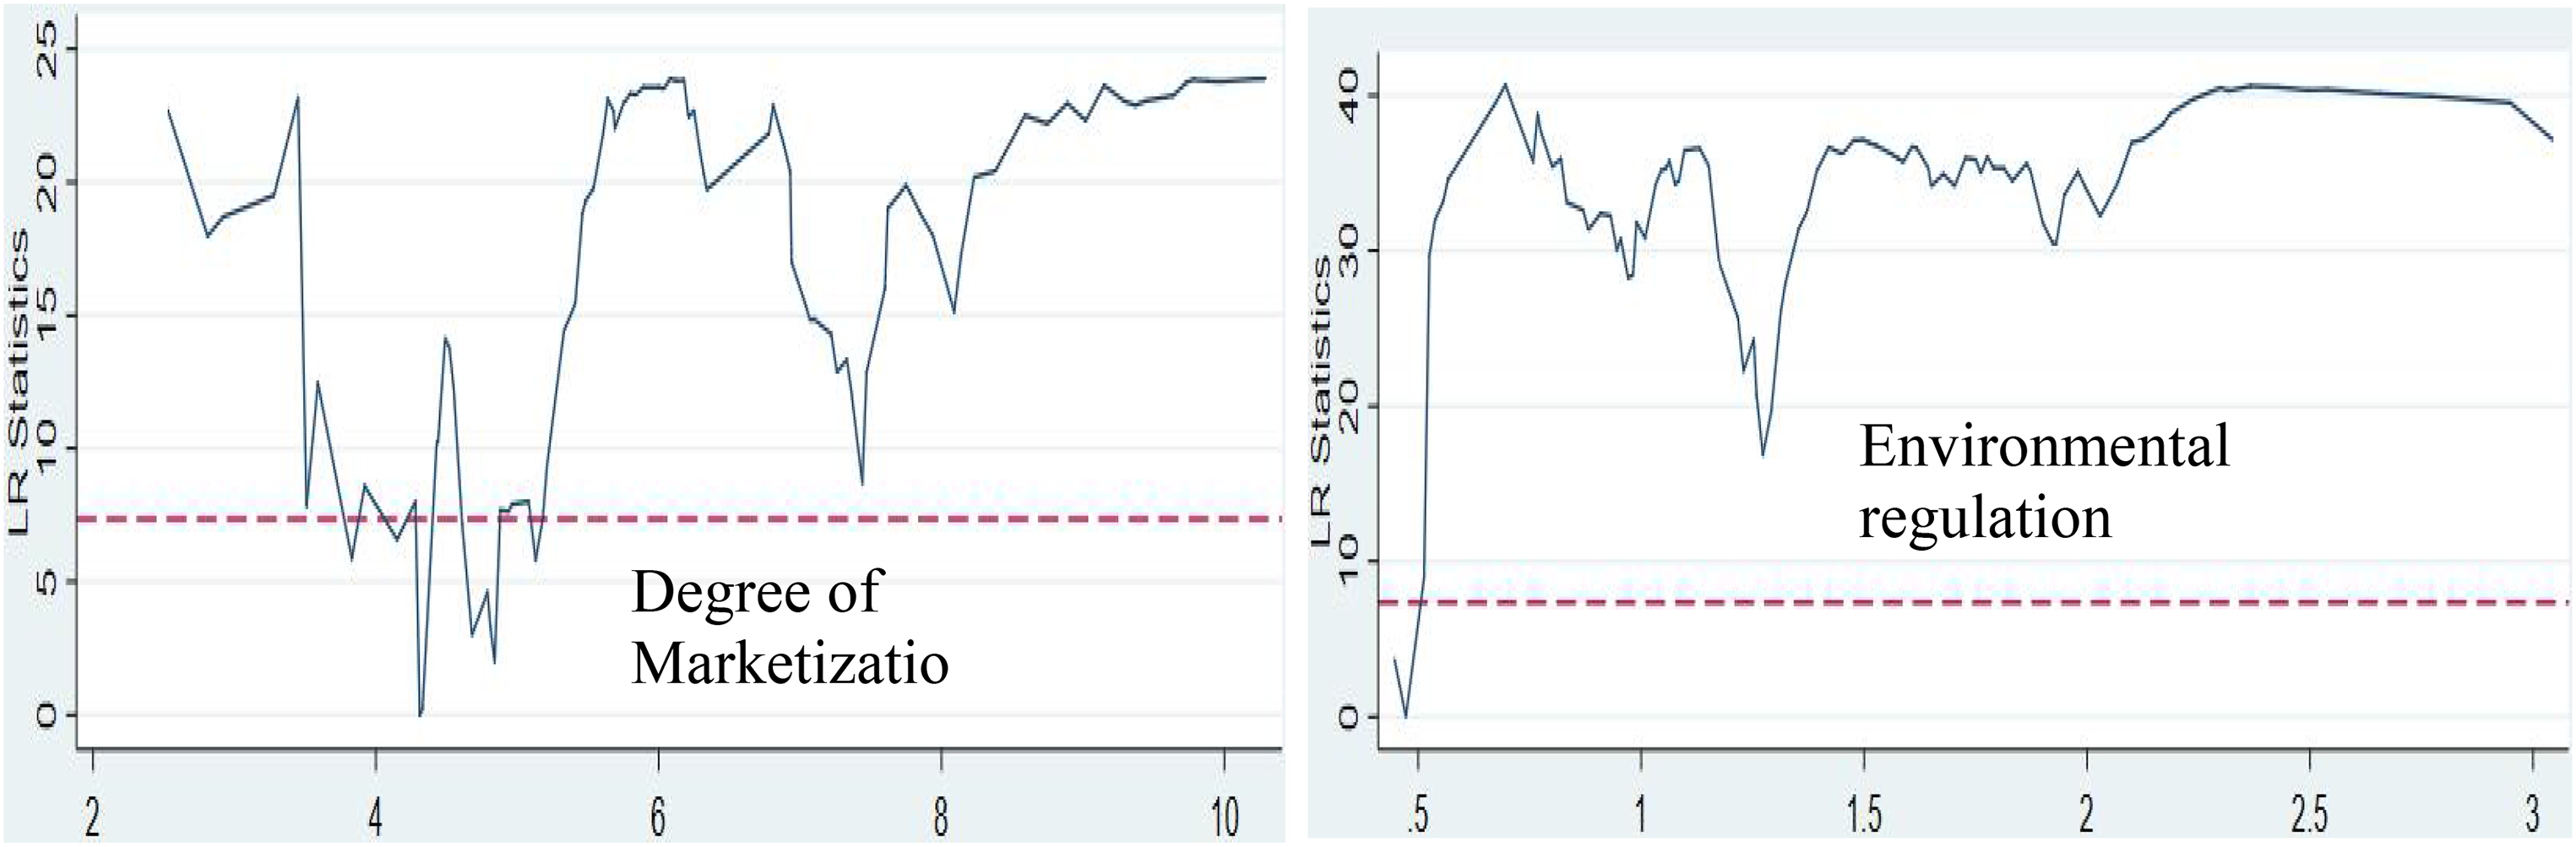
Relationship between threshold value and LR.
On the other hand, Table 9 M1 indicates the regression results of the impact of GC on CO2 emissions by taking DM as threshold variable. When DM < 4.310, low level of marketization restricts the repress impact of green credit; when DM > 4.310, for every 1% increase in green credit, carbon emission reduction will be suppressed by 0.280%. Therefore, H2 is accepted.
Threshold effect regression results.

***p < 0.01, **p < 0.05, *p < 0.1.
(2) Environmental regulation.
Green credit can grow healthily under the sufficient marketization, while the environmental regulation is necessary before market is fully mature. The government promotes green credit system and enforces environmental liability insurance through guarantee discount and other policy systems to provide driving force for green industry and restrict non-green industry. However, due to differences in regional economic structures, ER remains inconsistent, which may restrict its implementation effect. Thus, ER was considered as threshold variable to examine the possible threshold effect.
As shown in Table 8, the single threshold of ER is significant at the 10% level, with P-value being 0.099; while double threshold effect is insignificant with corresponding P-value being 0.258. Therefore, there exists single threshold of ER, of which, the threshold value is 0.472, falling within the 95% confidence interval. Thus, threshold value division is considered reasonable. Furthermore, referring to Figure 4, the rationality of threshold value has been verified.
In addition, Table 9 M1 presents the regression results of the impact of GC on CO2 emissions taking ER as threshold variable. In detail, when ER > 0.472, the impact of green credit on carbon emission changes from inhibition to stimulation. Therefore, ER has a double-sided sword effect, the scale of which, should raised attention by local governments. Appropriate ER scale can promote green credit and cover the shortages brought by insufficient marketization, thus achieving the purpose of restraining regional carbon emissions. However, environmental regulation that exceeds the affordability of the market may result in resistance to the development of GC and CO2 reduction. Therefore, H3 is accepted.
Spatial heterogeneity analysis
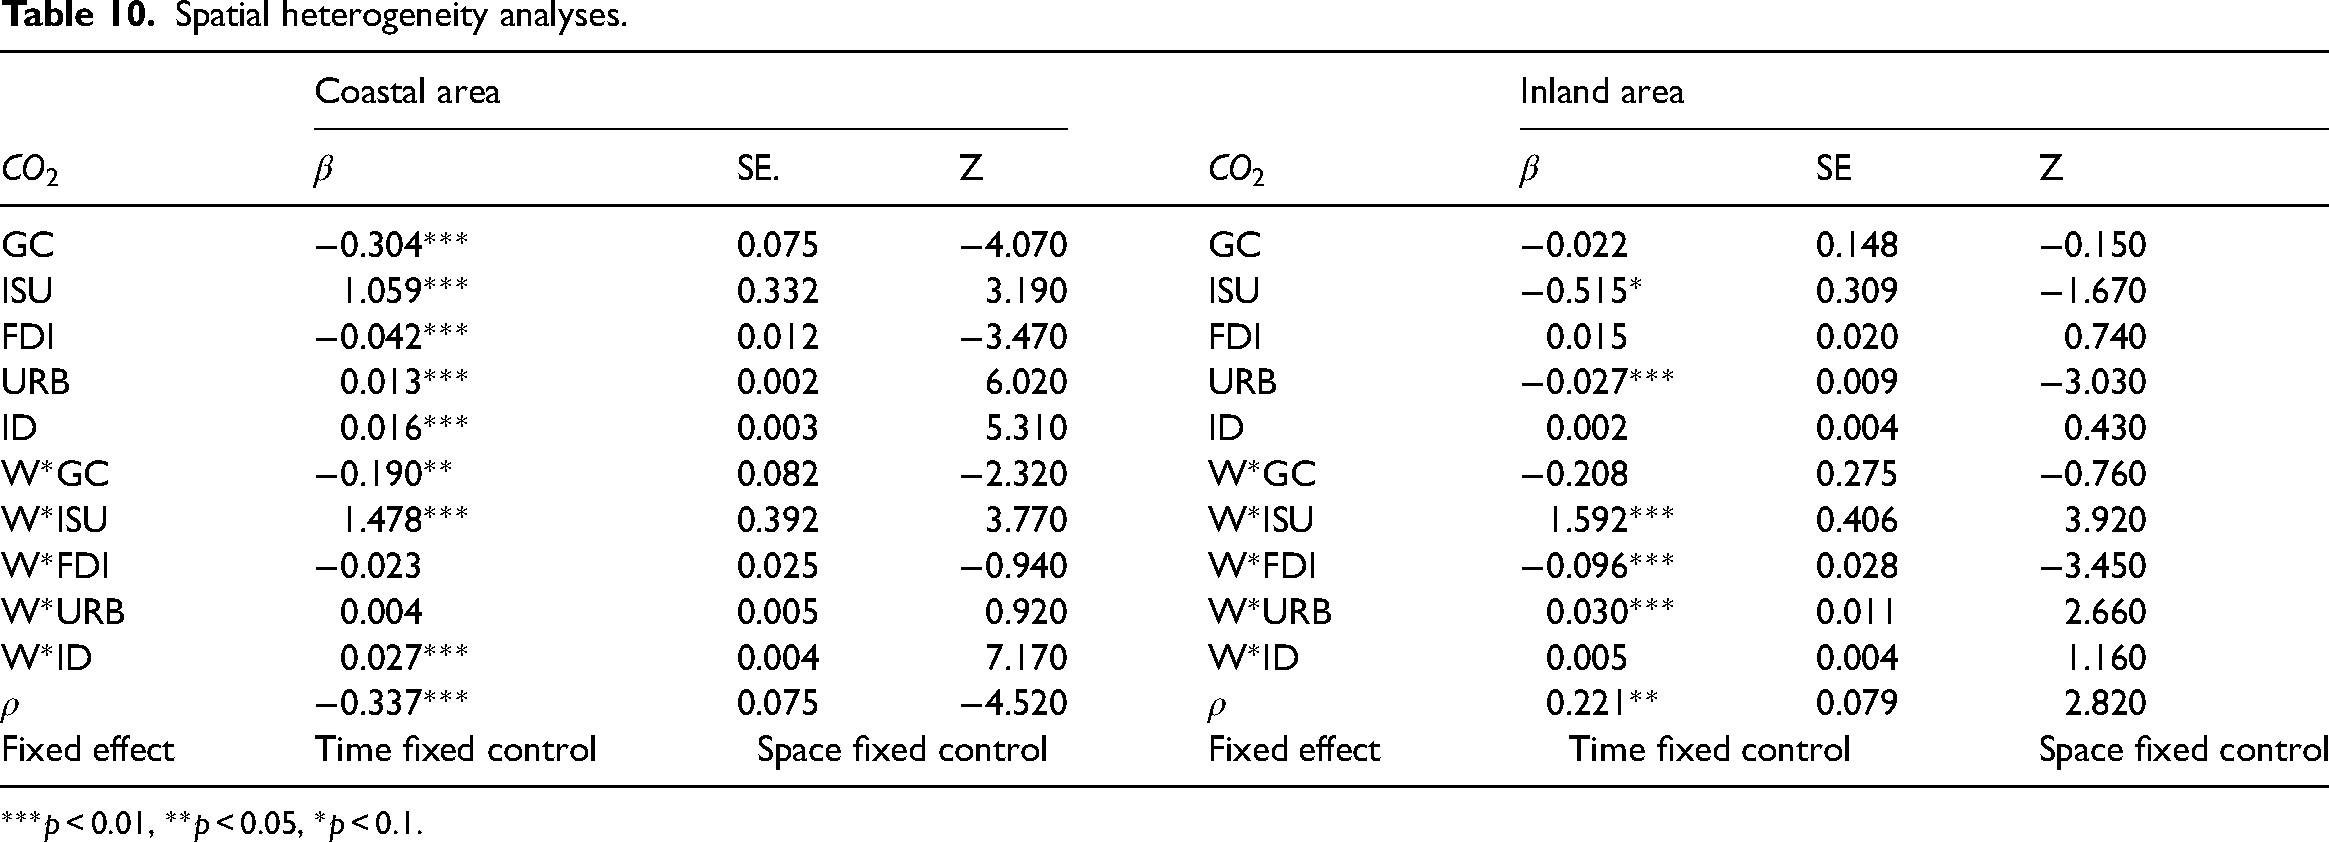
China has a vast territory, which exists significant differences in regional factor resources as well as green credit systems. The repressing effect of GC in different regions may be inconsistent, which increases the difficulty of carbon emission control. Aiming at clarifying the differences in repress impact of GC, this research divided regions into coastal and inland economic zones to verify spatial heterogeneity, which can facilitate the formulation of national policies and achieve synchronization of regional carbon emission control.
As shown in Table 10, the impact of GC on carbon emission in coastal areas (−0.304***) is more significant than that in inland areas (−0.022). Possible reasons include that the country has carried out industrial transformation and structural upgrading in coastal areas to develop into pacesetters. Compared with inland area, coastal area enjoys more complete green credit system, which can alleviate financing constraints and curb regional carbon emissions by implementing policy dividends to green industries. Regarding inland area, which is the carrier of pollution- and energy-intensive industries, the transformation of economic structure is restricted as well as the development of green credit. Therefore, carbon emission reduction in inland area remains severe.
Spatial heterogeneity analyses.
***p < 0.01, **p < 0.05, *p < 0.1.
Transmission mechanism analysis
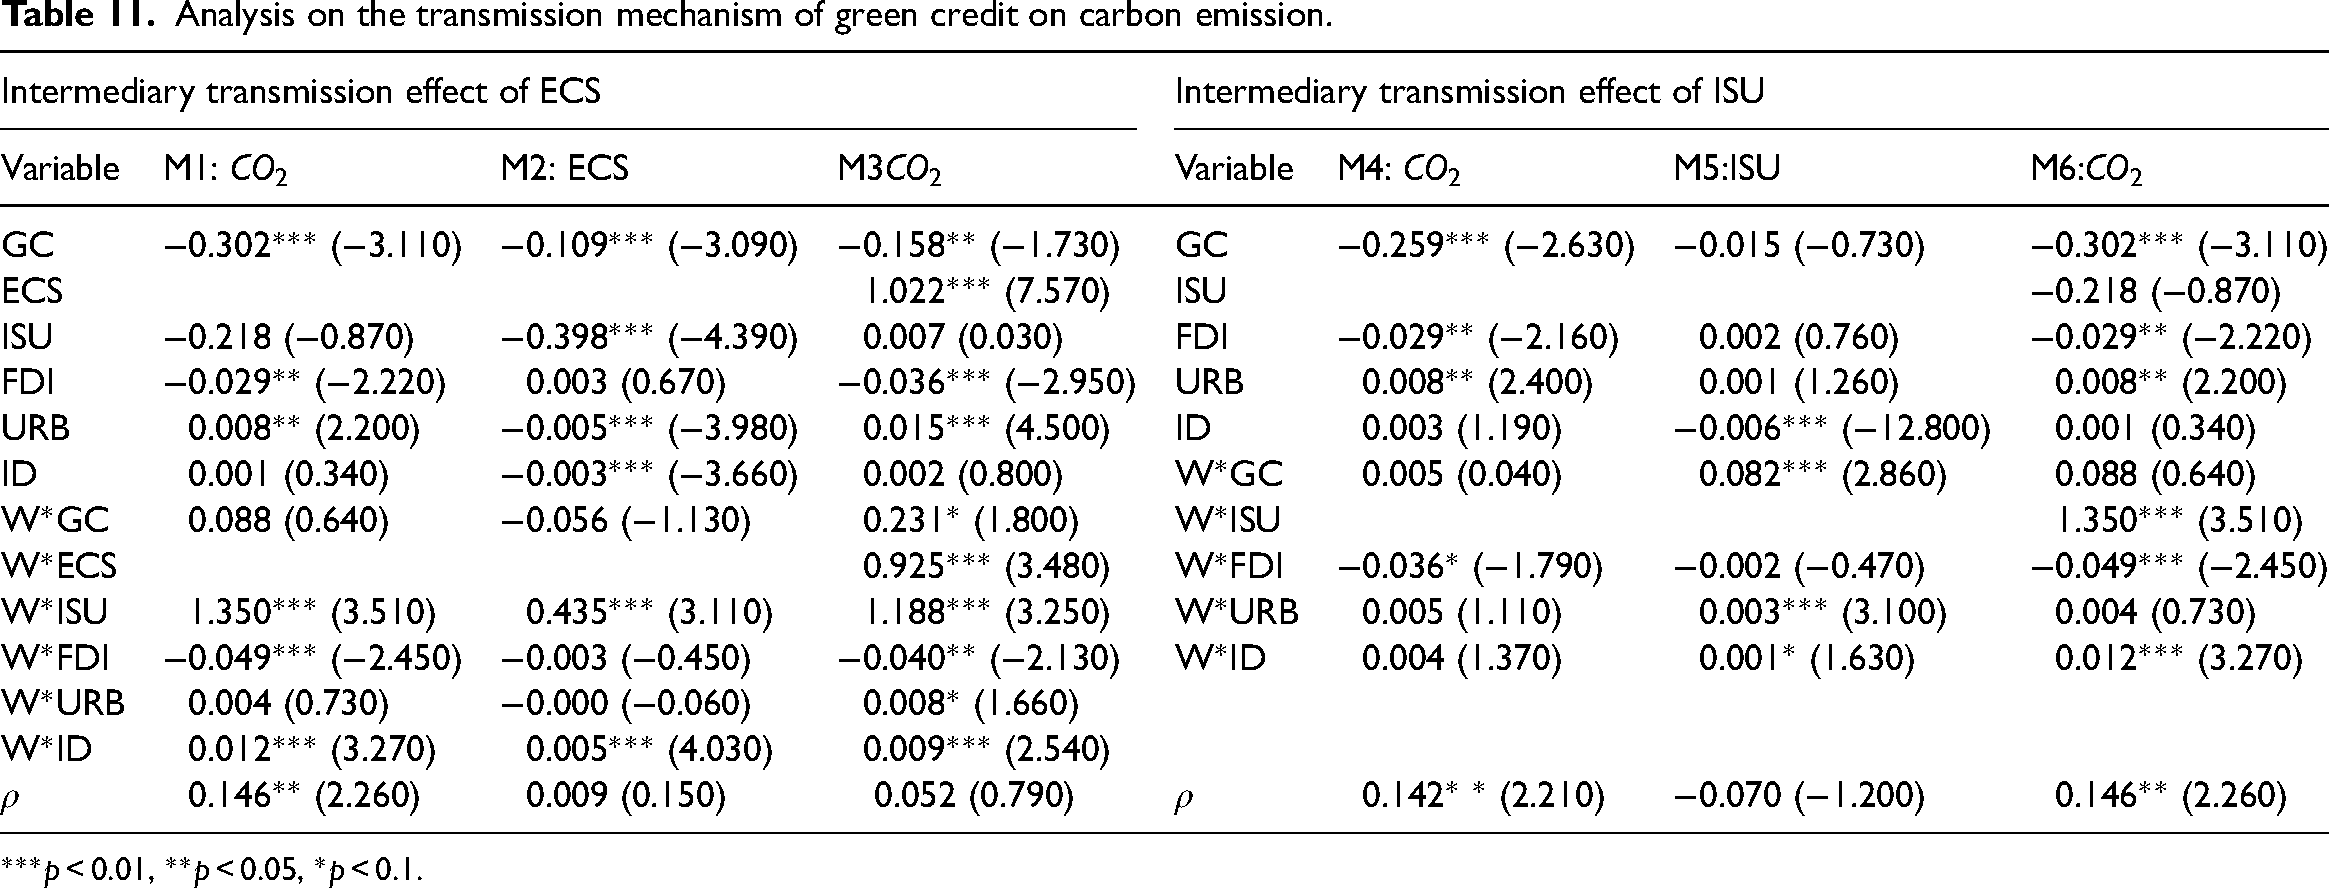
The realization of carbon emission reduction stimulated by green credit requires the participation of intermediary variables. To scientifically verify the inhibition path of GC, this study regarded ECS and ISU as intermediary variables to conduct further regression analysis. The results are presented in Table 11.
Analysis on the transmission mechanism of green credit on carbon emission.
***p < 0.01, **p < 0.05, *p < 0.1.
(1) Intermediary transmission effect of energy consumption structure
As shown in Table 11 M2, the coefficient of GC on ECS remains significant, accounting to −0.109, indicating that GC can promote ECS through accelerating the utilization of clean energy and thus reducing CO2 emissions. The coefficient of GC on CO2 refers to −0.302, passing 1% significance test. On the other hand, M3 presents the results after considering ECS, where the impact path of GC on CO2 decreases from −0.302 to −0.158. Therefore, ECS generates partial intermediary effect during the process of curbing CO2 through green credit. Moreover, Table 12 shows the results of Bootstrap test. The indirect effect of GC on CO2 refers to −0.451, passing the 1% significance test, with the confidence interval not covering zero, which further verifies the partial intermediary effect. Thus, H4 is accepted. The possible reasons may include: GC can facilitate the capital flow into green industry and form industrial clusters; GC may compress credit capital of traditional industries and stimulate their transform to green industries; sustainable green credit policy can promote competition levels and encourage fastening carbon emission reduction.
Robustness test: bootstrap test.

***p < 0.01, **p < 0.05, *p < 0.1.
(2) Intermediary transmission effect of industrial structure upgrading
As can be seen from Table 11 M4, the impact path of GC remains significant, referring to −0.259. Considering ISU, M6 shows that the impact path of GC increases from −0.259 to 0.302, which has been strengthened. Moreover, M5 indicates that CG cannot promote ISU. Therefore, there exists no intermediary transmission effect of ISU in the repressing process of GC. Table 12 shows the results of Bootstrap test. The indirect effect of GC on CO2 refers to 0.103, remaining insignificant, with the confidence interval covering zero, which further verifies the inexistence of intermediary effect. Hence, H5 is rejected. Theoretically, GC provides financial support for ISU and promotes the development of green industry, which subsequently results to effective carbon emission reduction. However, in practice, due to the profit driven by traditional industries, the development of regional GC and ISU has not reached the optimal equilibrium. Therefore, increasing efforts should be paid to effective promotion of industrial structure upgrading.
Conclusions and policy implications
Conclusions
Pursing the “30·60” goal, this research explored how green credit inhibits provincial carbon emissions based on provincial panel data collected from China. In particular, the inhibition effect, threshold effect, and intermediary transmission effect of green credit on carbon emissions were verified. Furthermore, considering regional heterogeneity, differences in impact paths of green credit were clarified. The research findings include: ① Green credit can effectively inhibit China's provincial carbon emissions although there exists spatial heterogeneity, which is consistent with theoretical analysis carried out by Glomsrød and Wei 24 and empirical study conducted by Hu31. ② During inhibition process of green credit, marketization degree and environmental regulation generate the threshold effects, which is consistent with existing literature.28–30 ③ Green credit can reduce the proportion of coal consumption and optimize the energy consumption structure to curb regional carbon emissions. However, the intermediary transmission effect of current ISU tends to be insignificant, failing to achieve the purpose of carbon emission reduction. Although the results indicate the existence of intermediary transmission path of industrial structure upgrading, which is verified by current literature, the insignificance of intermediary transmission effect is inconsistent with existing literature.21,32 Possible reasons may include selection of indicators for industrial structure upgrading or control variables of panel data. Therefore, it is necessary to divide the industrial structure into indicators such as industrial structure upgrading, industrial structure rationalization, and industrial structure adjustment for comparative analysis to clarify the role of industrial structure. ④ Considering endogeneity, green credit can still significantly curb regional carbon emissions, which further verifies the robustness of the research.
Policy implications
Promoting green credit system: Regional government should clarify policy requirements and access standards of green credit policy. Stimulating and restricting mechanisms need to be promoted to optimize the green credit policy and encourage capital flowing into green industry. Innovative green credit products and services can be developed as well as the green credit standard system. Restrictions on traditional industries can be strengthened to create incentives on green investments and green transformation.
Defining scope of threshold effect: Both environmental regulation and marketization should be thoroughly considered to strengthen the preconditions of inhibition process and their intensities should be scientifically defined to consolidate the carbon emission reduction inhibition path and enhance effectiveness of regional carbon emission reduction governance.
Portraying transmission mechanism of CO2 emission reduction: Green credit reform needs to be deepened to innovate credit products and optimize the allocation efficiency of credit resources. In detail, financial guarantee can be issued for energy structure transformation and industrial structure upgrading, in order to optimize the in-depth transformation of industrial structure and deepen the carbon emission suppression path of green credit.
Clarifying spatial heterogeneity: Regional differences regarding carbon emission reduction and their inhibition paths should be examined. According to the regional characteristics, the carbon emission target should be set differently under the background of innovation driven. Therefore, rational green credit policy system can be formulated consistent with regional development to ensure the reliability and validity of the policy. Regional carbon emission supervision mechanism can be established to accurately grasp the heterogeneity of carbon emission inhibition and adjust the strength of green credit policies, thus optimizing the efficiency of carbon emission reduction policy.
Footnotes
Availability of data and materials
The datasets used and/or analysed during the current study are available from the corresponding author on reasonable request.
Consent for publication
Not applicable.
Declaration of conflicting interests
The author(s) declared no potential conflicts of interest with respect to the research, authorship, and/or publication of this article.
Ethics approval and consent to participate
Not applicable.
Funding
The author(s) disclosed receipt of the following financial support for the research, authorship, and/or publication of this article: This work was supported by the National Social Science Fund of GuangXi Province, National Natural Science Foundation of China, (grant numbers 20FJL003, 72064009, 72262010, 72264008).
