



Abstract
This study explores the effect of green bonds, oil prices, and the coronavirus disease 2019 (COVID-19) pandemic on industrial carbon dioxide (CO2) emissions. In this context, this study examines the United States of America (USA), which is the biggest economy in the world, uses weekly data between March 6, 2020 and September 30, 2022, and applies a novel wavelet local multiple correlation (WLMC) approach under time-varying and frequency-varying perspective. The novel empirical findings shows that (i) there is a strong negative (positive) co-movement between industrial CO2 emissions and green bonds in the short-run (long-run); (ii) there is a strong positive (negative) co-movement between industrial CO2 emissions and oil price in the medium-run (long-run); (iii) there is a strong negative (positive) co-movement between industrial CO2 emissions and the COVID-19 pandemic in the medium-run (long-run); (iv) the oil price is the dominant factor, whereas there are changing effect of the variables on each other at different times and frequencies; and (vi) overall, there are long-run asymmetric and dynamic correlations between industrial CO2 emissions and variables. Hence, the empirical results highlight the asymmetric, time-varying, and frequency-varying effects of green bonds, oil prices, and the COVID-19 pandemic on industrial CO2 emissions by presenting fresh and novel evidence. Moreover, the study proposes policy implications for the USA government.
Introduction
As global warming continues to increase due to the increasing greenhouse gas emissions, focus on human-made activities has been getting even greater consideration. In this context, various studies have been focusing on environmental degradation by using various environmental indicators, such as carbon dioxide (CO2) emissions (e.g. Refs.1–4), carbon emission intensity (e.g. Refs.5,6), ecological footprint (e.g. Ref. 7 ), and load capacity factor (e.g. Refs.8–11). Also, many different factors, such as economic growth and energy consumption, have been included in these studies to examine their role and effect on environmental degradation. There is growing literature about environmental quality degradation and its determinants.
Meanwhile, the world has been still facing a recent health phenomenon named coronavirus disease 2019 (COVID-19) since the last times of the year 2019, 12 it spread very quickly to other countries, 13 and it was defined as pandemic on March 10, 2020, by the World Health Organization (WHO). With the occurrence of COVID-19, many administrative measures and mobility restrictions, such as social distancing, quarantines, local lockdowns, flight bans, and closure of some places like schools, have been applied by countries.14,15 In this process, many economic and financial indicators, such as economic growth, employment, stock market index, and welfare, have deteriorated.16–18 Hence, COVID-19 caused both health and economic crises at the same time. 19 Hence, in addition to administrative measures, countries also have taken various monetary (e.g. increasing funding by central banks, central banks’ purchasing of treasury bonds) and fiscal measures (e.g. minimum wage support, deferral of payments to governments) to decrease negative effects of the COVID-19 that results from both the pandemic as well as restrictive administrative measures.20,21
From a health perspective, COVID-19 has caused totally 7535 million cases and 6.8 million deaths on the global scale as of January 31, 2023. As country-based, the United States of America (the USA) has the highest share, which has a total of 100.9 million cases, followed by China (98.5 million), India (44.7 million), France (38.4 million), Germany (37.8 million), and Brazil (36.8 million). 22 Only the number of total cases shows the detrimental effect of the COVID-19 pandemic on the USA since January 21, 2020, which is the first confirmed case of the pandemic in the USA. 23
Although the COVID-19 pandemic has harmed the health and economy, however, the result for the environmental quality is a bit different. Depending on following a stay-at-home approach 24 and declining total demand, 25 total demand in some areas, such as oil, individual car usage, and industrial manufacturing, has dropped significantly. 26 In turn, there is a significant decrease in total industrial CO2 emissions that results from fewer travels through airplanes due to the travel restrictions in the aviation industry, closure of manufacturing industries due to mobility restrictions, less fossil fuel source usage for offices (i.e. used for transport in cars and personnel services, heating, cooling, and lighting of large office buildings), decreasing energy demand depending on the before-mentioned development.27,28 The progress trend of both industrial CO2 emissions and COVID-19 pandemic cases is presented in Figure 1(a).
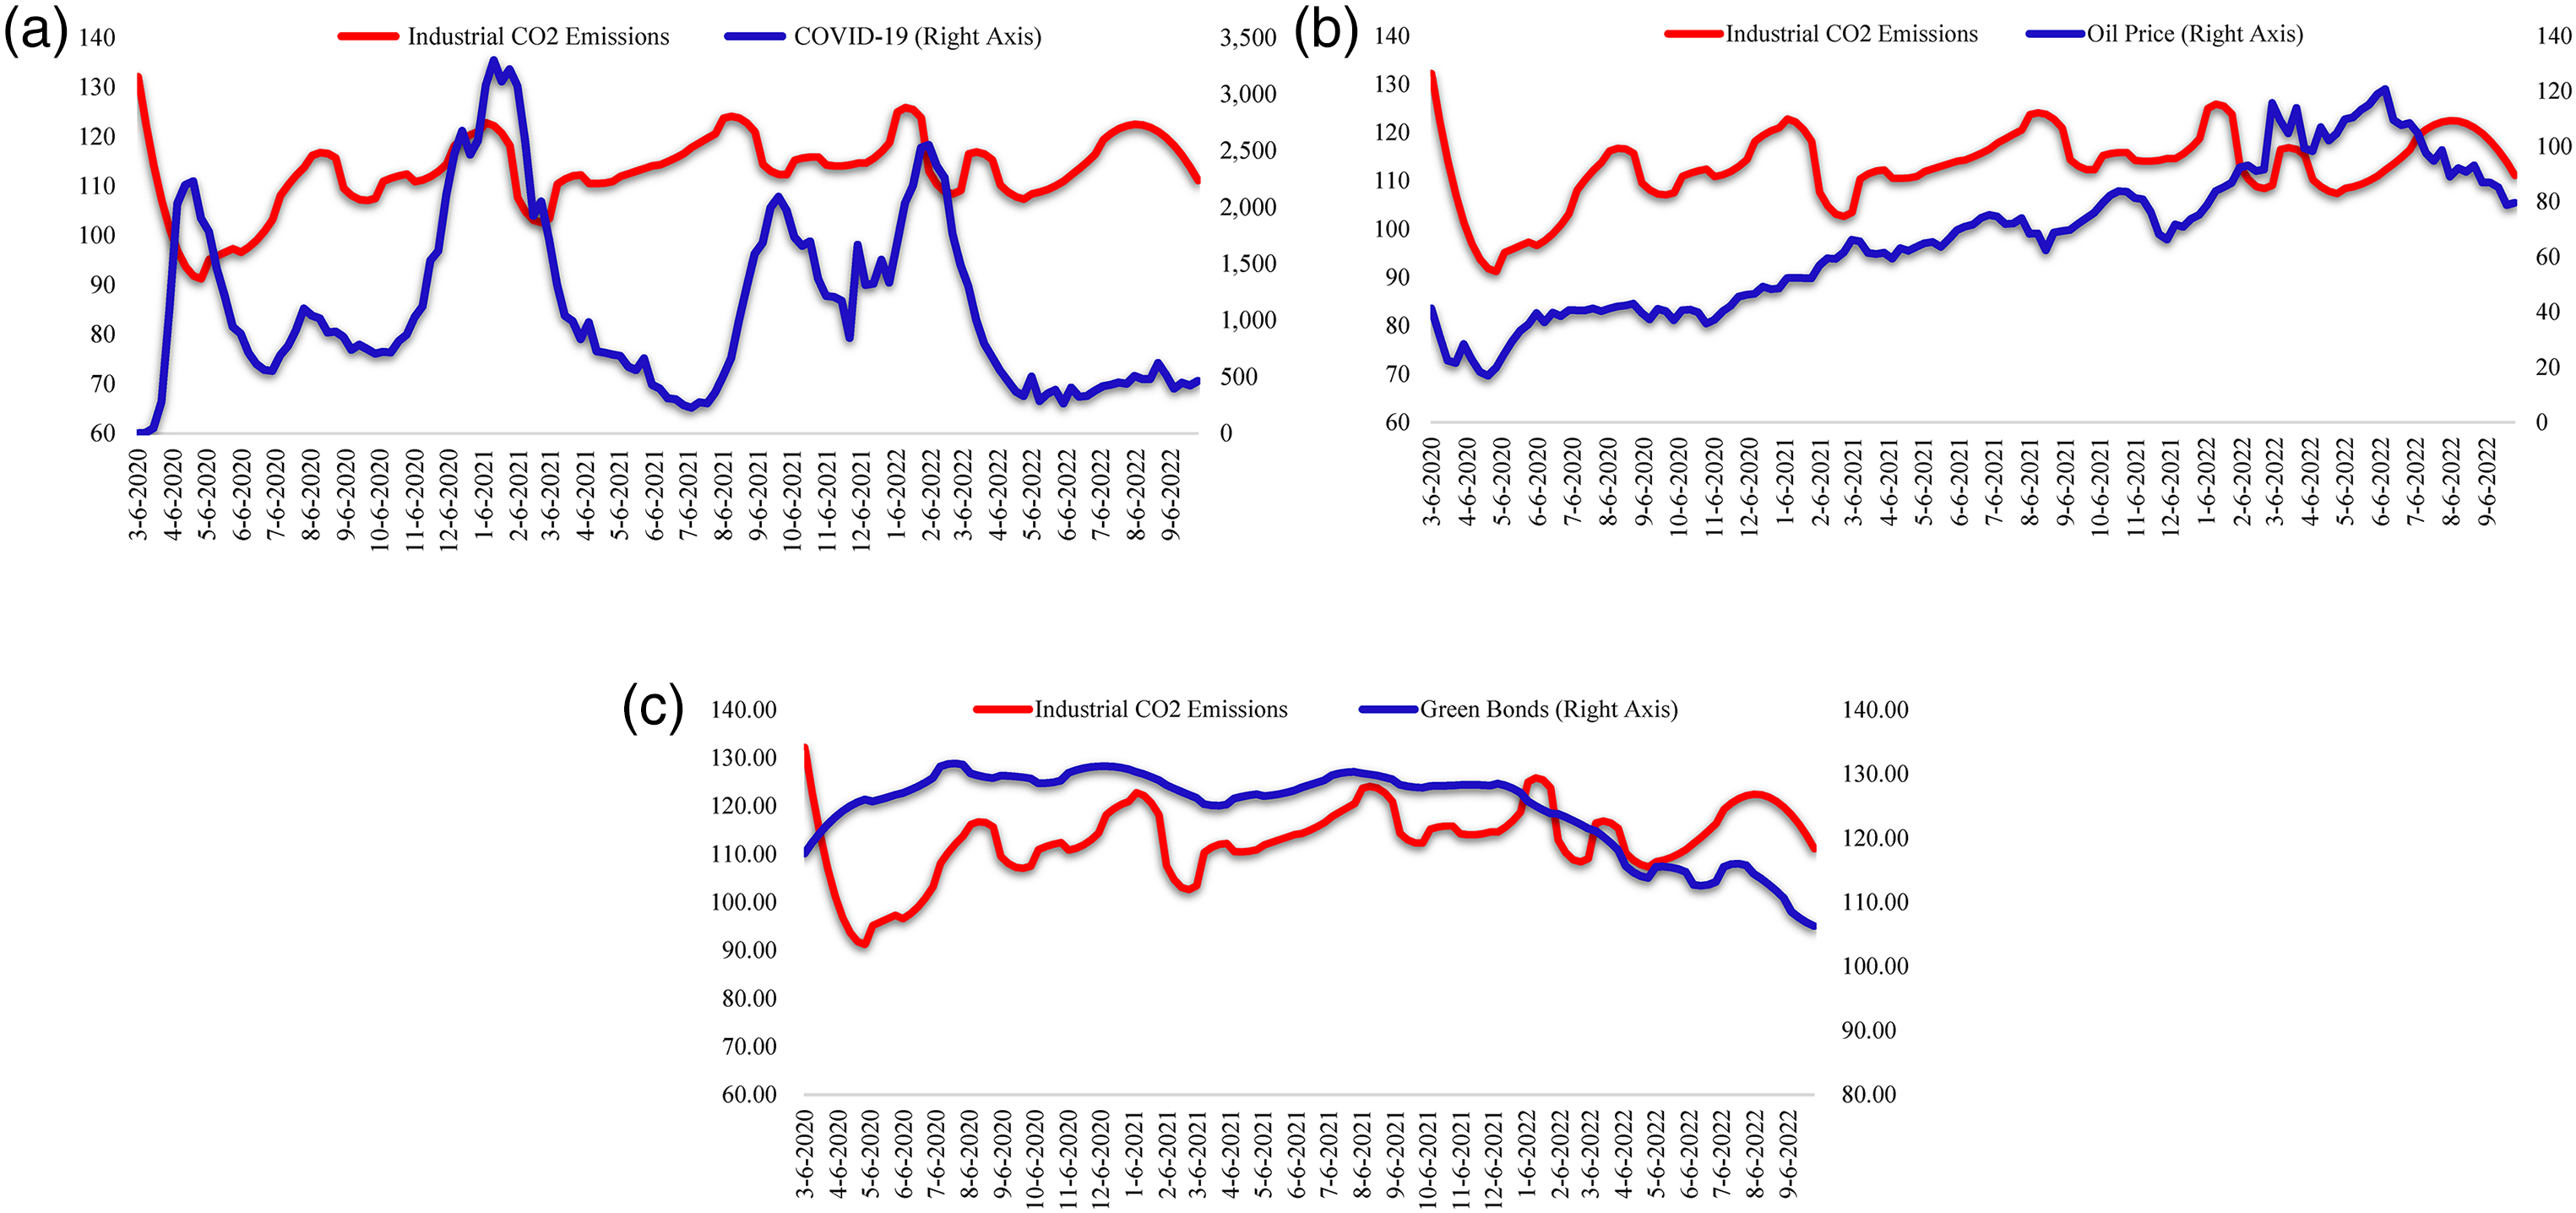
The trend of industrial CO2 emissions, COVID-19, oil price, and green bonds. Note: The unit for industrial CO2 emissions is a million metric tons; the unit for COVID-19 is a person; the unit for the oil price is USD/barrel; the unit for green bonds is a basis point.
As reflected in Figure 1(a), industrial CO2 emissions had a decreasing trend at the initial stages of the pandemic, however, have been rising as restrictions are relaxed in the transition to new-normal life. On the other side, the oil price has had a very high volatile trend in the both USA and the world market throughout the COVID-19 pandemic period. 29 The progress trend of the industrial CO2 emissions and oil price is shown in Figure 1(b). As Figure 1(b) reflects, oil prices declined by an important amount in April 2020. The main cause of such a fall in the oil price is the declining total demand for oil at global and country levels that results from the COVID-19 pandemic30,31 and measures, are taken to fight the pandemic, such as mobility restrictions and local lockdowns. Also, excessive oil production by some oil-exporter countries, such as Saudi Arabia, had a critical role in such a fall in the oil price. 28 Changes in the oil price are significant because they are evaluated as a leading indicator for most sectors and macroeconomic indicators, such as current account balance, foreign exchange rates, and gross domestic product.32–36 Also, restrictions on tourism and international flights have become an important determinant of such a fall in the oil price.37,38 However, oil prices continued to increase steadily and exceeded $100 for a barrel in March 2022. Based on the current literature, increasing oil prices can provide an opportunity for a transition to alternative clean energy sources (e.g. Ref. 39 ) by increasing public interest in fossil sources, 40 however high oil prices can deter innovation and green energy development, such as green bonds. 41 Hence, the effect of changes in oil prices on the environment depends on mainly the characteristics of industry and energy sectors in countries. 42
While crude oil is the main energy source throughout history, 43 it has been changing recently due to the increasing interest in environmental quality by countries and societies. In this process, investments and financing in green energy by countries and investors have been increasing by replacing or divesting from fossil sources through increasing renewable energy production capacity.28,39,44,45 Depending on such an increase in clean and renewable energy investments and finance, the stock prices of such companies have been also increasing. 46 Thus, it can be concluded that green finance has a significant role in the transition to a carbon-neutral economy and in fighting climate change and global warming. 47 However, as is in the case of the oil price, the effect of innovation on the environmental quality depends on mainly the characteristics of countries as well. 48
Based on the explanations above, changes in oil prices by affecting the amount of fossil fuel consumption, the progress of the COVID-19 pandemic through affecting overall consumption in the economy, and the development of green bonds by enabling the transition from fossil fuel energy to the renewable energy can be influential on CO2 emissions, especially on industrial CO2 emissions. The industrial sector has been generally using a high amount of energy, which is produced by fossil fuel sources, and energy advances are not sufficient in lowering the current level of CO2 emissions. However, important changes in industrial CO2 emissions can be expected due to the restrictions applied against the pandemic. Hence, it can be questioned what is the interrelationship between industrial CO2 emissions, green bonds, oil prices, and the COVID-19 pandemic by considering the multiple relationships among them and how can they change over time in different frequencies? To answer this research question, this study investigates the effects of green bonds, oil prices, COVID-19 pandemic on industrial CO2 emissions in the USA as the biggest economy in the world. In the current literature, the empirical results of the studies show that there is a relationship between industrial CO2 emissions, green bonds, oil prices, and the COVID-19 pandemic. However, according to the best knowledge of the authors, no study has comprehensively examined the interrelationship by considering the multiple relationships between all these factors.
In the examination of the interrelationship between industrial CO2 emissions, green bonds, oil price, and the COVID-19 pandemic, this study includes weekly data on March 6, 2020 and September 30, 2022, and a novel wavelet local multiple correlation (WLMC) approach under time-varying and frequency-varying concepts. Through applying such a comprehensive methodology, the empirical findings show that there is a strong co-movement between industrial CO2 emissions and green bonds, oil price, and the COVID-19 pandemic; oil price is the dominant factor; there are changing effects of the variables on each other at different times and frequencies. Overall, there are long-run asymmetric and dynamic correlations between industrial CO2 emissions and variables that highlight the asymmetric, time-varying, and frequency-varying effects.
This study achieves various contributions to the current literature. First, the study applies a novel WLMC approach to assess the co-movement between the variables of investigation. To analyze the above-mentioned association needs both bivariate and multivariate frameworks and there lies the seminal contribution of this study from methodological point. Here, a superior and novel framework compared with the existing literature is adopted. While the studies of Habib et al. 49 and Xuefeng et al. 50 have implemented conventional wavelet techniques (i.e. continuous wavelet coherence-CWT, partial wavelet coherence-PWC, and multiple wavelet coherence-MWC), this study has applied a new and innovative method, which is the WLMC approach. Because bivariate wavelet methods cannot capture the interrelationship between more than two variables simultaneously, Polanco-Martínez et al. 51 introduce a multivariate version of the wavelet coherence approach. The WLMC approach is able to analyze multivariate time series dynamically over time horizons, considering the time evolution that conventional statistical methods cannot do. Because this study includes weekly data, the fluctuations and volatility of these variables can be captured through the WLMC approach. 52 Hosseini 53 notes that during the post-pandemic era, the mitigating effects of oil gas prices on the renewable sector will be complex. Thus, a new insight into this complexity is provided by analyzing the multivariate relationship between green bonds, oil prices, COVID-19, and CO2 emissions. It is defined that oil price plays the dominant role among the variables during the medium-run and long-run. Hence, the WLMC methodology not only provides a novel contribution in terms of design but also can offer much more in-depth understanding about the complex interrelationship between variables.
Based on the best knowledge of the authors, there have been only a limited number of studies that use the WLMC approach. For this reason, using such a recently developed approach for the empirical examination can increase the novelty and contributions of the study. Second, this study considers green bonds, oil prices, COVID-19 pandemic as explanatory variables by benefitting from the current literature. Fourthly, this study uses weekly data between March 6, 2020 and September 30, 2022, which is a quite long dataset. Hence, this study contributes to the literature by uncovering firstly the USA case to present a dynamic relationship between the variables in a multivariate context in both short-run and long-run at different frequencies. Thus, this study presents a more comprehensive result of the factors that drive industrial CO2 emissions in the USA.
The other parts of the study are organized as follows. The next section reviews the related literature about the variables. Section “Methods” provides information about methods. Section “Empirical results and conclusions” presents the results and discussion. The final section presents conclusions and policy inferences.
Literature review
CO2 emissions and green bonds
Fatica and Panzica 54 research the effect of green bonds on carbon intensity for the green bonds issuance until 2019 performing panel data analysis and define green bonds have a decreasing effect on carbon intensity. Meo and Abd Karim 55 work on the effect of green bonds on CO2 emissions in ten green financing supporting countries for the period November 2008 to June 2019 applying a quantile-on-quantile regression approach and state that green bonds have a lowering effect on CO2 emissions. Marín-Rodríguez et al. 56 uncover the role of green bonds on CO2 emissions at the global scale for the period between 01.01.2014 and 03.10.2022 and conclude that green bonds have a significant effect on CO2 emissions, whereas the effect can be either negative or positive according to time and frequency. Similar to these studies, Wang and Zhi 44 and Li and Jia 45 reveal that green finance (i.e. green bonds) has a supporting effect on environmental quality.
On the other hand, Hammoudeh et al. 57 examine the time-varying effect of green bonds on CO2 emissions in the USA for the period between July 30, 2014 and February 10, 2020 by using the time-varying Granger causality approach and define that green bonds do not have causality to CO2 emissions. Thus, by considering the studies in the current literature, it can be concluded that the literature about the effect of green bonds on CO2 emissions is not still certain, but it has been developing.
CO2 emissions and oil price
The literature has various studies that examine the effect of oil prices on CO2 emissions. Balaguer and Cantavella 58 uncover the effect of oil price on CO2 emissions in Spain for the period 1874–2011 using the ARDL approach and define that an increase in the real oil price provides a decrease in CO2 emissions. Erdoğan et al. 59 examine the effect of energy prices on CO2 emissions in 25 Organization for Economic Cooperation and Development (OECD) countries for the period 1990–2014 applying dynamic ordinary least squares (DOLS), fully modified ordinary least squares (FMOLS), and augmented mean group (AMG) approaches and determine that increasing energy price decreases CO2 emissions.
In addition, Zhang et al. 60 examine the effect of energy prices on CO2 emissions in China for the period 1979–2014 using a dynamic stochastic general equilibrium model and define that energy price shocks and rising energy prices reduce CO2 emissions. Li et al. 61 examine the effect of energy price on CO2 emissions in China for the period 2002–2016 in the context of the STIRPAT model and determine that energy price has a significant negative effect on CO2 emissions. Also, Abumunshar et al. 62 study Turkey's case for the period of 1985–2015 Performing canonical cointegrating regression, DOLS, FMOLS, and ARDL approaches, and state that increasing oil price has a decreasing effect on CO2 emissions. Malik et al. 63 focus on the Pakistan case for the period 1971–2014 applying symmetric and asymmetric ARDL models and conclude that positive shocks in oil prices have a statistically significant effect in the long-run and they cause a decrease in CO2 emissions.
Moreover, Shan et al. 64 examine the effect of energy prices on CO2 emissions in selected 7 OECD countries for the period 1990–2018 performing cross-sectional ARDL, AMG, and Dumitrescu–Hurlin causality test approaches and conclude that increasing prices of fossil fuel energy has a mitigating effect on CO2 emissions. However, the effect of increasing oil prices is different (i.e. it has an increasing effect) on CO2 emissions in India 65 and 22 African countries. 66
On the other hand, some studies in the current literature have considered the COVID-19 pandemic in oil price examination. For instance, Kartal 67 examines oil prices in both pre-pandemic (between July 25, 2019, and March 10, 2020) and pandemic (between March 11, 2020, and October 30, 2020) periods through multivariate adaptive regression splines and defines that the COVID-19 pandemic affects the importance of variables that affect domestic oil prices. Hence, in line with the studies in the current literature, it can be concluded that increasing oil prices is expected to have a generally mitigating effect on CO2 emissions.
CO2 emissions and COVID-19 pandemic
As a recent black swan phenomenon, 21 the COVID-19 pandemic has had a detrimental effect on many economic and financial indicators. On the other hand, the literature about the effect of the COVID-19 pandemic on environmental quality has not matured. For example, Le Quéré et al. 68 focus on the global case and define that although there is an average 17% decrease in CO2 emissions, however, it is temporary. Similarly, Liu et al. 69 determine an 8.8% decrease in CO2 emissions in the first stage of the pandemic, whereas it has been reversing in later times as restrictive measures are eased and economies recover.
Also, Chevallier 70 examines the effect of the COVID-19 pandemic on CO2 emissions in the USA for the period January 3, 2000 to May 8, 2020 using a dynamic conditional correlation (DCC) approach and defines that the pandemic (proxied by the number of deaths and confirmed cases) has a decreasing effect on CO2 emissions. Habib et al. 49 focus on the global case for the period December 31, 2019 to May 31, 2020, and define that the pandemic is the most significant factor in decreasing CO2 emissions. Haxhimusa and Liebensteiner 27 uncover the case of 16 EU countries for January 1, 2020 to March 23, 2020, and conclude that CO2 emissions of the power sector decreased an 18.4%. Therefore, by considering the studies in the current literature, it can be concluded that the COVID-19 pandemic has a decreasing effect on CO2 emissions.
Evaluation of the literature
As a summary of the empirical literature review, which is summarized in Table 1, it can be stated that (i) green bonds have a generally decreasing effect on CO2 emissions, the literature regarding the effect of green bonds on CO2 emissions is limited, and it has been developing; (ii) increasing oil prices is expected to have a generally mitigating effect on CO2 emissions; and (iii) COVID-19 pandemic has a decreasing effect on CO2 emissions. In this context, some countries’ cases, such as the USA, EU countries, and OECD countries have been examined. Moreover, various econometric approaches, such as ARDL, have been applied for empirical examination of the effect of green bonds, oil prices, COVID-19 pandemic on CO2 emission.
Empirical literature summary.
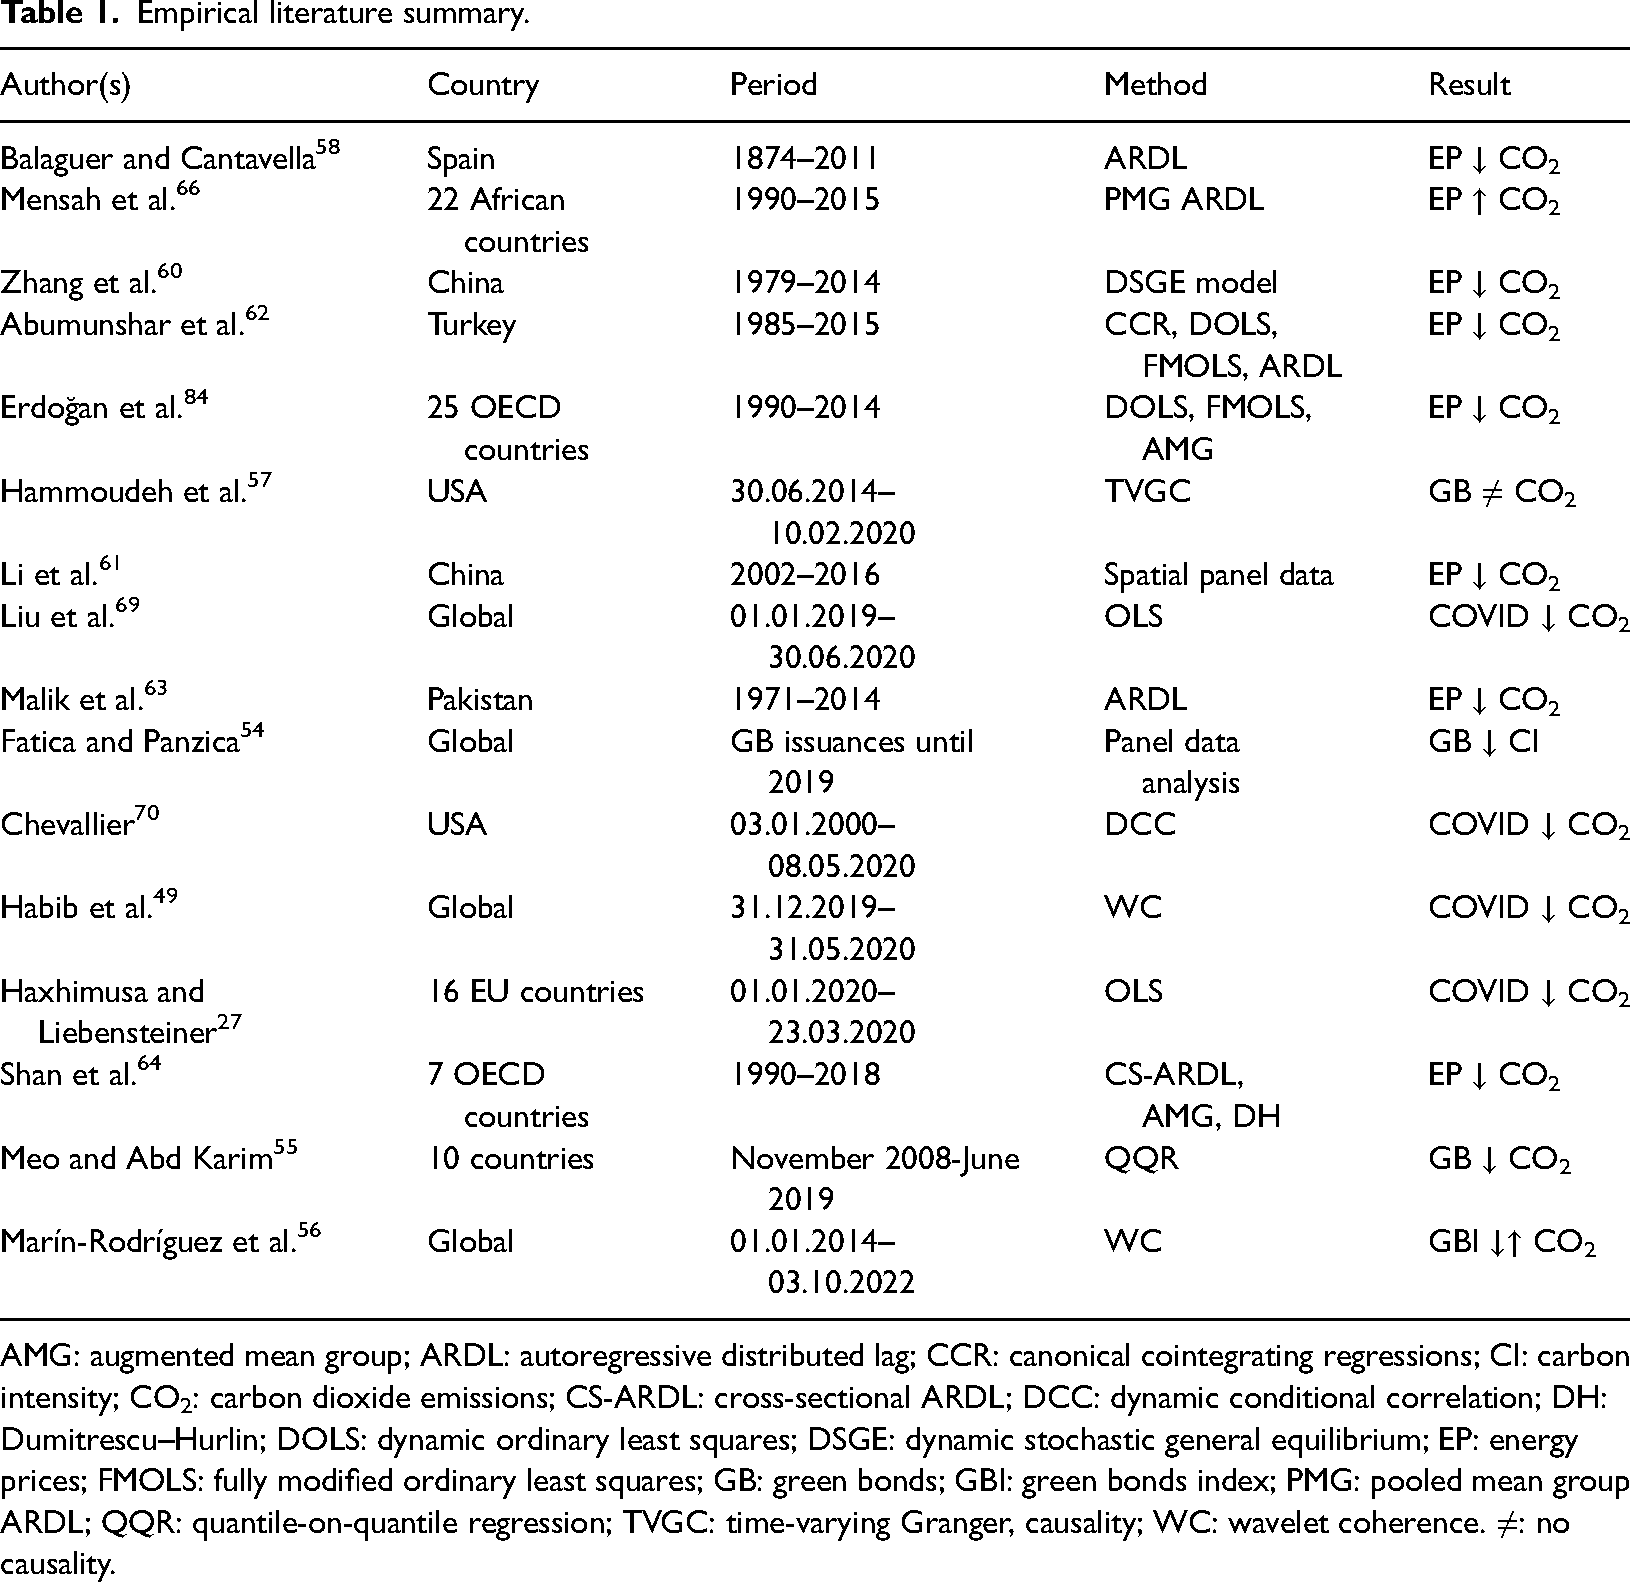
AMG: augmented mean group; ARDL: autoregressive distributed lag; CCR: canonical cointegrating regressions; CI: carbon intensity; CO2: carbon dioxide emissions; CS-ARDL: cross-sectional ARDL; DCC: dynamic conditional correlation; DH: Dumitrescu–Hurlin; DOLS: dynamic ordinary least squares; DSGE: dynamic stochastic general equilibrium; EP: energy prices; FMOLS: fully modified ordinary least squares; GB: green bonds; GBI: green bonds index; PMG: pooled mean group ARDL; QQR: quantile-on-quantile regression; TVGC: time-varying Granger, causality; WC: wavelet coherence. ≠: no causality.
Although the literature includes various studies, no study except for Chevallier 70 has focused on the USA case, which is the biggest economy in the world and has a lighthouse role for other countries. Also, Chevallier 70 includes a very short dataset in his study (i.e. January 3, 2000–May 8, 2020) and applies a well-known and classical approach (i.e. DCC), and focuses on only the effect of the COVID-19 pandemic that does not consider the effect of green bonds and oil price at the same time. Hence, it is concluded that the current literature has a gap and this study aims at closing this gap. Thus, this study focuses on the USA case as the biggest economy; considers green bonds, oil prices, and the COVID-19 pandemic at the same time in terms of their effect on industrial CO2 emissions; uses a quite long dataset between March 6, 2020 and September 30, 2022; and applies a novel WLMC approach under time-varying and frequency-varying perspective. Hence, this study contributes to the current literature.
Methods
Data
The case of the USA, which is the leading economy in the world, is examined to investigate the effect of green bonds, oil prices, COVID-19 pandemic on industrial CO2 emissions with empirical analysis. For this paper, the weekly data between March 6, 2020 and September 30, 2022, is taken into account. The weekly average of the data for each variable is calculated to create a dataset for empirical analysis. Moreover, to ensure that data confirm to normal description, the logarithm form of the variables is used.
The data for industrial CO2 emissions are collected Energy Information Agency. 71 Also, data for FTSE USBIG Green Impact Bond Index and West Texas Intermediate (WTI) Crude Oil Prices are gathered from Bloomberg. 29 Furthermore, the data for COVID-19 are obtained from Ourworld. 23 Detailed information about the variables is presented in Table 2.
Variable summary.
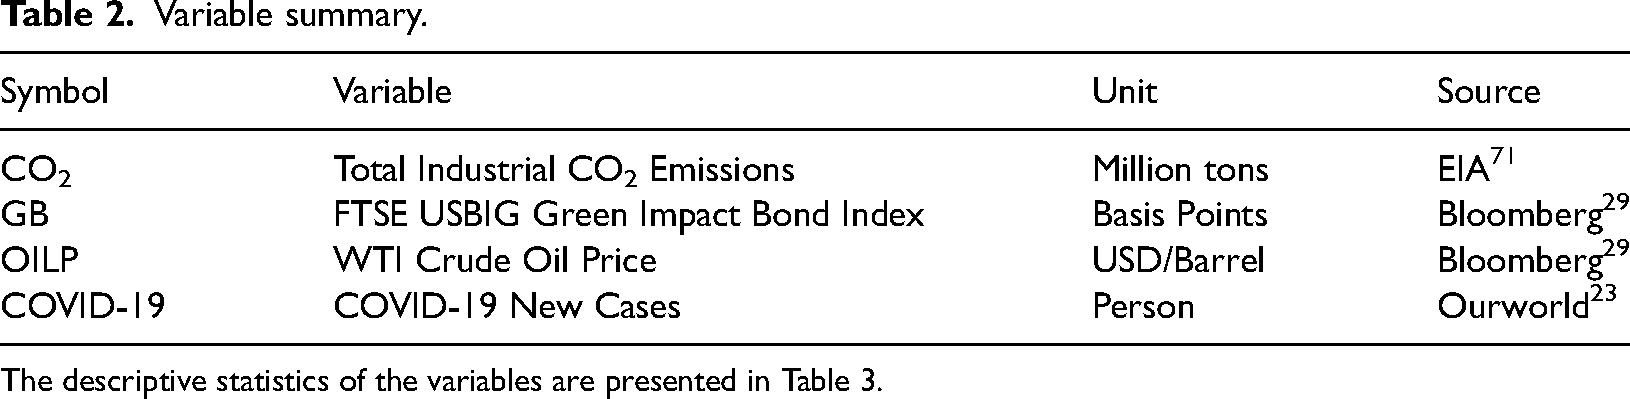
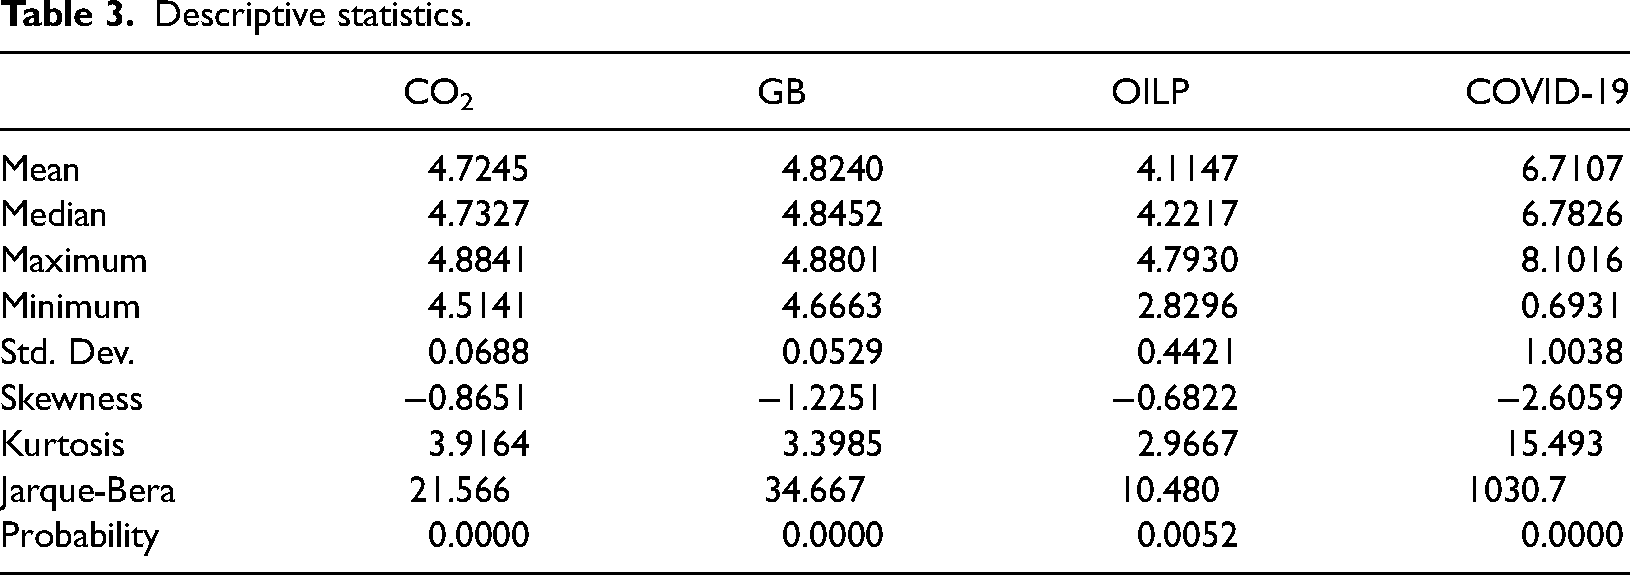
The descriptive statistics of the variables are presented in Table 3.
As Table 3 presents, the variables are not normally distributed. Moreover, Figure 2 presents Box-plot of the variables.

Box plot of the variables.
Descriptive statistics.
Methodology
The current study employed the nonlinear approach to explore the connections between green bonds, industrial CO2 emissions, COVID-19, and oil prices in the USA. Figure 3 presents the empirical methodology applied in this study.

The applied methodology.
An eight-step methodology is used to examine the relationship between industrial CO2 emissions, green bonds, oil prices, and the COVID-19 pandemic in the USA as follows:
▪ In the first step, the variables are defined based on the current literature. ▪ In the second step, data from different sources, such as EIA,
71
Bloomberg,
29
and Ourworld,
23
are collected for the defined variables. ▪ In the third step, the BDS test is applied to examine the stationary of variables.
72
▪ In the fourth step, Spearman's rank correlation is examined to understand basic correlations between variables. ▪ In the fifth, sixth, and seventh steps, wavelet local multiple correlations for bivariate, three-variate, and four-variate cases are applied, respectively.
51
▪ In the last step, the conclusion and policy inferences are presented based on the empirical result.
Empirical results and discussion
Preliminary tests outcomes
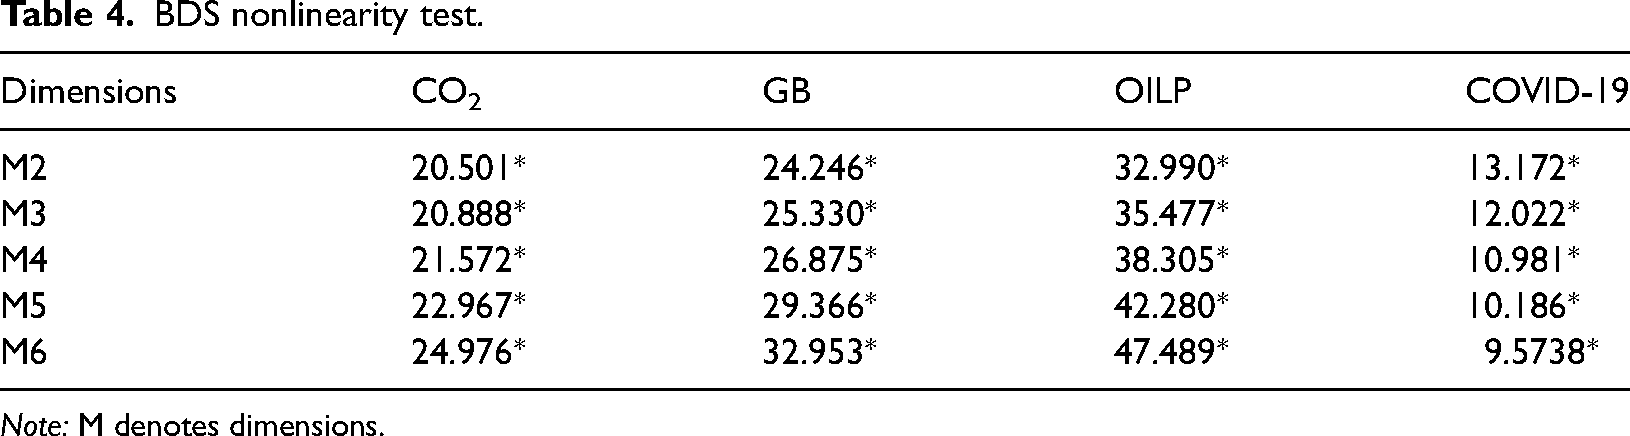
As an initial test, the nonlinearity of the industrial CO2 emissions, green bonds, oil price, and COVID-19 is controlled using the BDS test 72 and the results are presented in Table 4.
BDS nonlinearity test.
Note: M denotes dimensions.
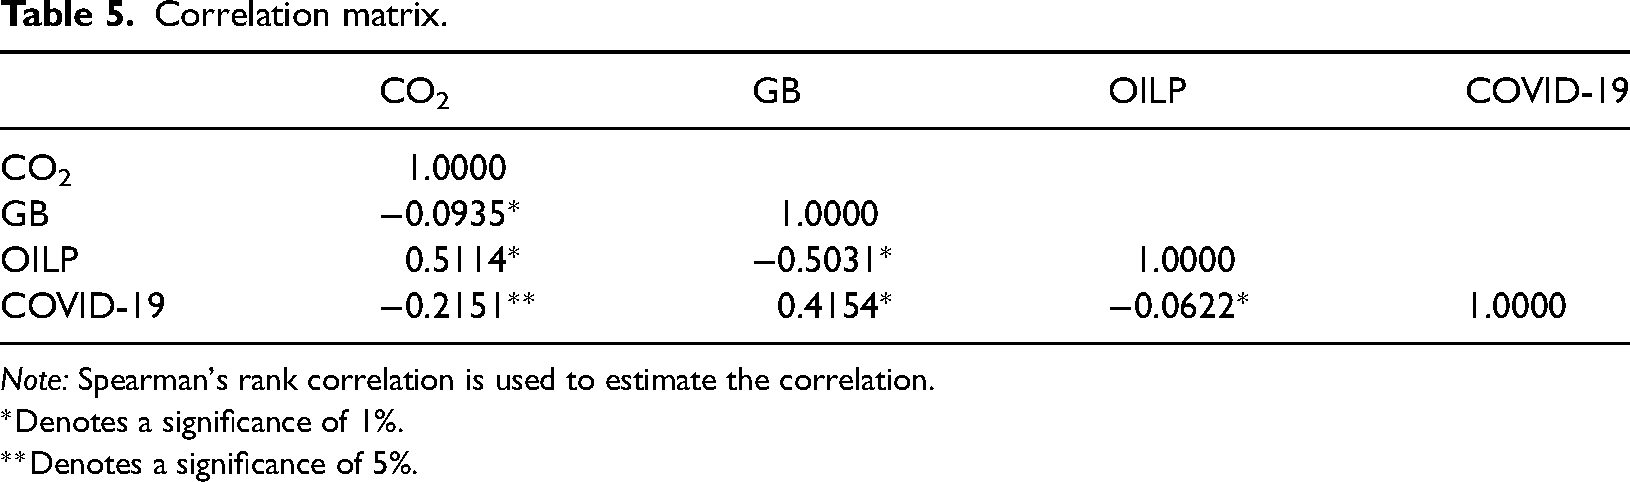
Based on Table 4, the results show the nonlinearity of the attributes of the variables. Thus, the BDS test results validate the usage of nonlinear techniques. Moreover, correlation coefficients between variables are presented in Table 5.
Correlation matrix.
Note: Spearman's rank correlation is used to estimate the correlation.
*Denotes a significance of 1%.
**Denotes a significance of 5%.
Based on Spearman's rank correlation in Table 5, there is a positive correlation between industrial CO2 emissions, green bonds, oil prices, and the COVID-19 pandemic. However, the static nature of Spearman's rank correlation prevents researchers from seeing how the correlation evolves. It is crucial to grasp the correlation dynamics to comprehend how these variables interact over time. Hence, it is achieved to analyze the short-run and long-run dynamic connection between industrial CO2 emissions, green bonds, oil price, and COVID-19 at various frequencies in a multivariate setting using a novel WLMC approach.
WLMC for the bi-variate case for the industrial CO2 emissions, green bonds, oil price, and COVID-19 pandemic
In all WLMC figures, the horizontal axis indicates time and the vertical axis indicates frequencies. Also, scales 1 (week) to scale 16 (weeks) represent the frequencies. Moreover, the black lines represent the correlation values.
The WLMC detects areas of dependence between two variables in the time–frequency domain. The cooler (warmer) color shows the less strong (more intense) time–frequency domain dependencies. In the time–frequency domain, colder and warmer colors depict the least and most intense dependences. The correlation is not significant if there is a blank space. The value of the spectral correlation is displayed in the vertical sidebar (it ranges from blue/negative to red/positive).
This bivariate study gives researchers a rough idea of the variables’ correlations. The WLMC for the bivariate case is presented in Figure 4. 1 The WLMC for industrial CO2 emissions and oil price connection is shown in Figure 4(a).

(a) WLMC between industrial CO2 emissions and oil price. 4b. WLMC between industrial CO2 emissions and COVID-19. (c) WLMC between CO2 emissions and green bonds.
The cold color at the period of scale 16–32, which depicts the long-term, depicts a negative correlation between industrial CO2 emissions and oil price. This conclusion is based on the correlation between oil price and energy use, mostly electricity use.73,74 It is fascinating to note that the correlation for long-run frequencies turns negative, with the correlation at approximately 0.50, as shown by the cold color. During the second wave of the COVID-19 pandemic, several lockdown measures were implemented in the USA that restricted travel, which lead to a reduction in energy consumption, especially those produced by the industrial sector emitting fossil fuel sources, such as coal and oil. 2 All these measures initiated by the USA altered the association between industrial CO2 emissions and oil prices. The connection between CO2, carbon allowances, 3 and productivity can be used to elucidate these long-run trends. When fuel prices are low, there is a significant demand for coal as the literature has demonstrated.73,75 On the demand side, the COVID-19 outbreak-related economic disturbances and management efforts have caused a global slowdown in production and transportation that result in a sharp decline in global demand for oil and a consequent reduction in oil prices. As a result, there was a long-run fall in the price of carbon permits due to a decline in the demand for emission permits. In 2020, most Americans stayed at home, except in China, where virus-related travel bans are relaxed, and oil is naturally used for transportation. Between April and August 2020, there was a 30% oil demand decline. Additionally, COVID-19 caused a significant decrease in construction, tourism, and eating outside, and the number of factories closing, with the majority remaining closed even after the constraint, was gradually relaxed. All of these contributed to decreased energy consumption, oil price, and industrial CO2 emissions.
Figure 4(b) shows the WLMC results between COVID-19 and industrial CO2 emissions. The WLMC demonstrates that the association is positive in the medium- and long-term from early 2020 to the middle of 2021 with an average coefficient of 0.5. Governments eased restrictions and lockdowns due to an increase in vaccination rates that helped to reduce the number of COVID-19 new cases between 2020 and 2021. This policy choice has led to higher carbon emissions in the USA. Industrial CO2 emissions have grown due to the USA's decisions to relax its travel restrictions that permit international travel and open up the bulk of its production facilities to the public. As a result, in 2021, greenhouse gas emissions surged somewhat more quickly than the entire economy mainly due to a sharp increase in coal-fired power generation, which rose 17% from 2020, and a quick recovery in road transportation. Industry, which saw the most moderate decline in emissions in 2020 (6.2%), recovered in 2021 (3.6%), which makes up slightly over half of the difference from 2019 levels. The smallest increase in greenhouse gas emissions came from buildings in 2021, which is up only 1.9% from 2020 and makes up only 25% of the decrease from 2020.
These results support the research of Habib et al., 49 which identifies a positive correlation between CO2 emissions and COVID-19 at low frequency. Nonetheless, utilizing our approach, it is explicitly looked at the variables that affect each other at various frequencies. Thus, in contrast to Habib et al., 49 the findings demonstrate a novel medium and long-run connection between COVID-19 and CO2 emissions. Also, the WLMC method allows researchers to confirm the significance of the connection. As a result, a significant positive association is seen in the medium and long-run, whereas insignificant association surfaces in the short-run. Compared to the traditional wavelet coherence approach, this method provides unquestionably more accurate and pertinent information. As shown in Figure 4(b), the end of the different lockdowns, the subsequent restart of economic activity, and the decline in coronavirus infections had a detrimental effect on the ecosystem. As shown by the study of Shah et al., 28 economic activity and CO2 emissions move together. This study also aligns with the study of Shah et al., 28 who consider the global economy and reported that there is a positive association between CO2 emissions and COVID-19 in the long-run. This study affirms the pandemic pollution haven hypothesis, which claims that a surge in FDI inflows will result in a rise in CO2 owing to an expansion in commercialization operations in nations Jia et al. 76 Also, this study provides a fresh perspective on the weak connection between CO2 and COVID-19 in the short-term in the USA.
However, in the long-term, from the middle of 2021 to late 2022, a negative correlation surface between industrial CO2 emissions and COVID-19 with a negative coefficient of approximately 0.5. The emissions projection takes into account the ongoing recovery from pandemic lows in 2020. The early coronavirus pandemic resulted in widespread lockdowns, the lowest level of energy consumption in decades in the USA, and more than 10% fewer emissions. As the economy started to rebound in 2021, it recovered 6.2%, but continued supply chain problems and new coronavirus subtypes slowed the recovery. The reduced increase in emissions in 2022 occurred amid the conflict between Russia and Ukraine, the ensuing energy crisis, and significant inflation. As a result, consumption and production are being reduced, which lowers industrial CO2 emissions.
We provide the WLMC outcomes for the connection between green bonds and industrial CO2 emissions in Figure 4(c). The results point to a significantly adverse correlation between CO2 and green bonds in the USA in the short and medium-run from 2020 to 2021, which indicates that larger investment in clean energy reduces emissions. This expected result is due to initiatives to reduce ecological emissions, such as the Paris Agreement in 2015 and the Kyoto Protocol in 1995. This implies during these periods; green bonds contribute to the decrease in industrial CO2 emissions in the USA. However, in the long-term between 2020 and 2020, there is evidence of a positive correlation between green bonds and industrial CO2 emissions in the USA.
WLMC for the bi-variate case for green bonds, oil price, and COVID-19 pandemic
The WLMC between the oil price and the COVID-19 pandemic is displayed in Figure 5(a). The outcomes demonstrate the negative association (cold color) in the long-run domain as predicted (frequencies of 16–32). These findings are consistent with those of Ibrahim et al., 77 who showed a negative long-run connection between COVID-19 and oil prices. Because of this reduction, oil consumption decreased, which reduced barrel prices. 78

(a) WLMC between oil prices and COVID-19. (b) WLMC between green bonds and COVID-19. (c) WLMC between green bonds and oil price.
The oil sector experienced a demand shock due to the COVID-19 pandemic because of the lockdown tactics. 79 The undeniable “Oil Price War” between Saudi Arabia and Russia is one rationale for such changes in the oil price. 80 To stabilize market shares, Saudi Arabia and OPEC suggested a reduction in oil output in March 2020. Russia took issue with this approach and expanded its output as a result. Saudi Arabia then retaliated by raising its output. These subsequent steps sparked a pricing war that significantly lowered oil prices. However, in 2022, there is a positive connection between COVID-19 and oil prices. After, the ease of lockdown in most nations, consumption and production increase, which increases the demand for crude oil; thereby increasing its price.
The connection between green bonds and COVID-19 is presented in Figure 5(b). The graph demonstrates how COVID-19 has a significant effect on green bonds. In the medium and short-term, from 2020 to 2022, there is evidence of a positive connection between green bonds and COVID-19 in the USA. Besides, in the long-term from 2020 to 2021 which is the peak of COVID-19, there is a positive connection between green bonds and COVID-19 in the USA. However, from mid-2021 to 2022, there is evidence of the negative connection between green bonds and COVID-19 in the USA with negative coefficients of approximately 0.4.
The connection between oil prices and green bonds is presented in Figure 5(c). Regarding this connection, there is evidence of a negative correlation between green bonds and oil prices. Specifically, in the medium- and long-term, the relationship between green bonds and oil prices is negative with the coefficient of approximately 0.4.
WLMC for the three-variate case for COVID-19 pandemic, green bonds, and oil price
This study proceeds by assessing the multi-correlation between variables, as shown in Figure 6. 4 It is possibly better to comprehend the connection between these factors owing to the multivariate analysis that enables researchers to pinpoint the dominating variable. According to Polanco-Martínez et al., 51 this variable optimizes the numerous correlations and may be utilized to describe the other variables for each frequency.

(a) WLMC between green bonds, oil price, and COVID-19. (b) WLMC between green bonds, oil price, and COVID-19.
The outcomes from the tetra WLMC show fascinating results at different frequencies. In the long-run (16–32), the correlation is positive, with roughly a coefficient of 0.80. In addition, in the medium-run (8–16), the strength of the correlation dwindles while in the short-run (2–8), the positive correlation is weak compared to the medium and long-run. The outcomes in the figure are highly intriguing and reveal a connection between green bonds, oil prices, and the COVID-19 pandemic. It is conceivable to see how the COVID-19 pandemic outbreak has disrupted several economic operations (from production to tourism), which has the associated effect of a decrease in individual consumption, a decrease in corporate profitability, and consequently a lack of access to financing for technological innovation and research and development. Environmentally sound practices have been abandoned in favor of a decline in coronavirus infections. As Shah et al. 28 noted, this obstructs the goal of green development.
Conversely, the coronavirus has vastly expanded market uncertainty and volatility. Investors were affected by this lost trust and rebalanced their position to clean and brown markets. Thus, there was a significant shift in the price of stocks due to heightened uncertainty, unfavorable market sentiment (oil drop), and increased volatility. In keeping with the substitution effect, high oil costs encourage businesses to utilize renewable energy sources. 81 On the other hand, lower oil price discourages people from using cleaner energy because of “the high expense related to the construction and installing renewable energy systems.” 75 Since oil is so cheap, increasing the generation of energy from fossil fuel-based sources also means increasing oil usage. This discovery shows how asymmetrically connected these markets are. Investments in renewable energy change in response to a rise in the risk in the oil market and vice versa. In reality, when the oil price rises, investors shift their capital from the oil market to the green energy sector in anticipation of larger returns from these businesses. As investors look for lucrative prospects, this implies that markets for renewable energy experience a surge in trading and purchase operations. These findings can be interpreted in terms of “flying to quality” effects from the standpoint of investors: a market where investors try to purchase safe assets and sell unsafe assets. 82
The oil price significantly influences the dynamics of correlations, particularly over the long-run, as seen in Figure 6(b). Also, Figure 6(b) enables researchers to comprehend the frequency-dependent contributions of each parameter to the multivariate correlation.
Green bonds are the factor that most strongly influences the dynamic correlation at the short-run frequency level, but oil price dominates over the medium-run and long-run. This outcome demonstrates how important the oil price is in connection to these other variables. This outcome may be understood by the long-run drop (intensification) in the price of oil, which will decrease (intensify) the production costs of sectors of the economy that primarily depend on fossil fuel energy. These industries could thus predict a higher (lower) coal demand as CO2 emissions will rise (fall) in response to changes in coal use.
WLMC for the three-variate and four-variate cases for industrial CO2 emissions versus green, oil price, and COVID-19
Figure 7 5 shows that COVID-19 and green bonds (see Figure 6(a)), oil price and COVID-19 (see Figure 6(b)), and oil price and green bonds (see Figure 6(c)) tend to move industrial CO2 emissions. However, the effect varies at various frequencies.

(a) WLMC between green bonds and COVID-19 versus CO2 emissions. (b) WLMC between oil price and COVID-19 versus CO2 emissions. (c) WLMC between oil price and green bonds versus CO2 emissions.
In the long-run (frequency 32–16), green bonds and COVID-19 drive industrial CO2 emissions positively during the study period. The inherent dynamics may explain this unexpected finding between these indicators during the COVID-19 pandemic phase. Bivariate analysis shows that each has separate effects on industrial CO2 emissions, but when taken together in a multivariate correlation model, they predict comparable correlation patterns. According to Haxhimusa and Liebensteiner, 27 the decrease in CO2 emissions brought on by COVID-19 was caused by a natural occurrence rather than by any administrative achievements. The globe is currently reaping advantages from the climate but at the expense of economic prosperity. Thus, it might not ultimately result in the structural transformation needed to accomplish the long-run aim of supplying low-carbon energy. Suppose the climate change-related policies are not persuasive enough to support the transition to renewable energy. In that situation, emissions are more inclined to rise after the COVID-19 rebound begins, as we have observed in the findings of the study. Although green bonds and COVID-19 have reduced CO2 emissions at certain periods in the bivariate case, this has not been reflected in the mitigation of industrial CO2 emissions when dealing with the multivariate case, mainly due to the absence of effective climate initiatives that could have been learned from the initial environmental effects of the pandemic. This suggests that the pandemic's advantages have not been fully realized and that things have been restored to normal as a result of the vaccine's successful delivery. Additionally, as shown by Fareed et al., 83 only developed nations’ economies can embrace climate change technologies broadly. Other developments provide supplementary help for these nations. Therefore, CO2 emissions are affected by clean technological innovations via system improvements.
Figure 8 shows the results, which are very similar to Figure 7. The outcomes of the multivariate correlation study support the conclusions of the bivariate analysis and demonstrate that these variables have a long-run association, meaning that at low frequencies, they do not affect one another. These conclusions offer important knowledge about the connections between green bonds, oil prices, COVID-19, and CO2 emissions. Understanding these nexuses at short and long frequencies is especially beneficial for policymakers because it offers a clear framework to support the stability of the energy market. This multivariate study offers convincing proof that the level of oil price influences the temporally shifting relationship between green bonds, oil price, the COVID-19 pandemic, and CO2 emissions.
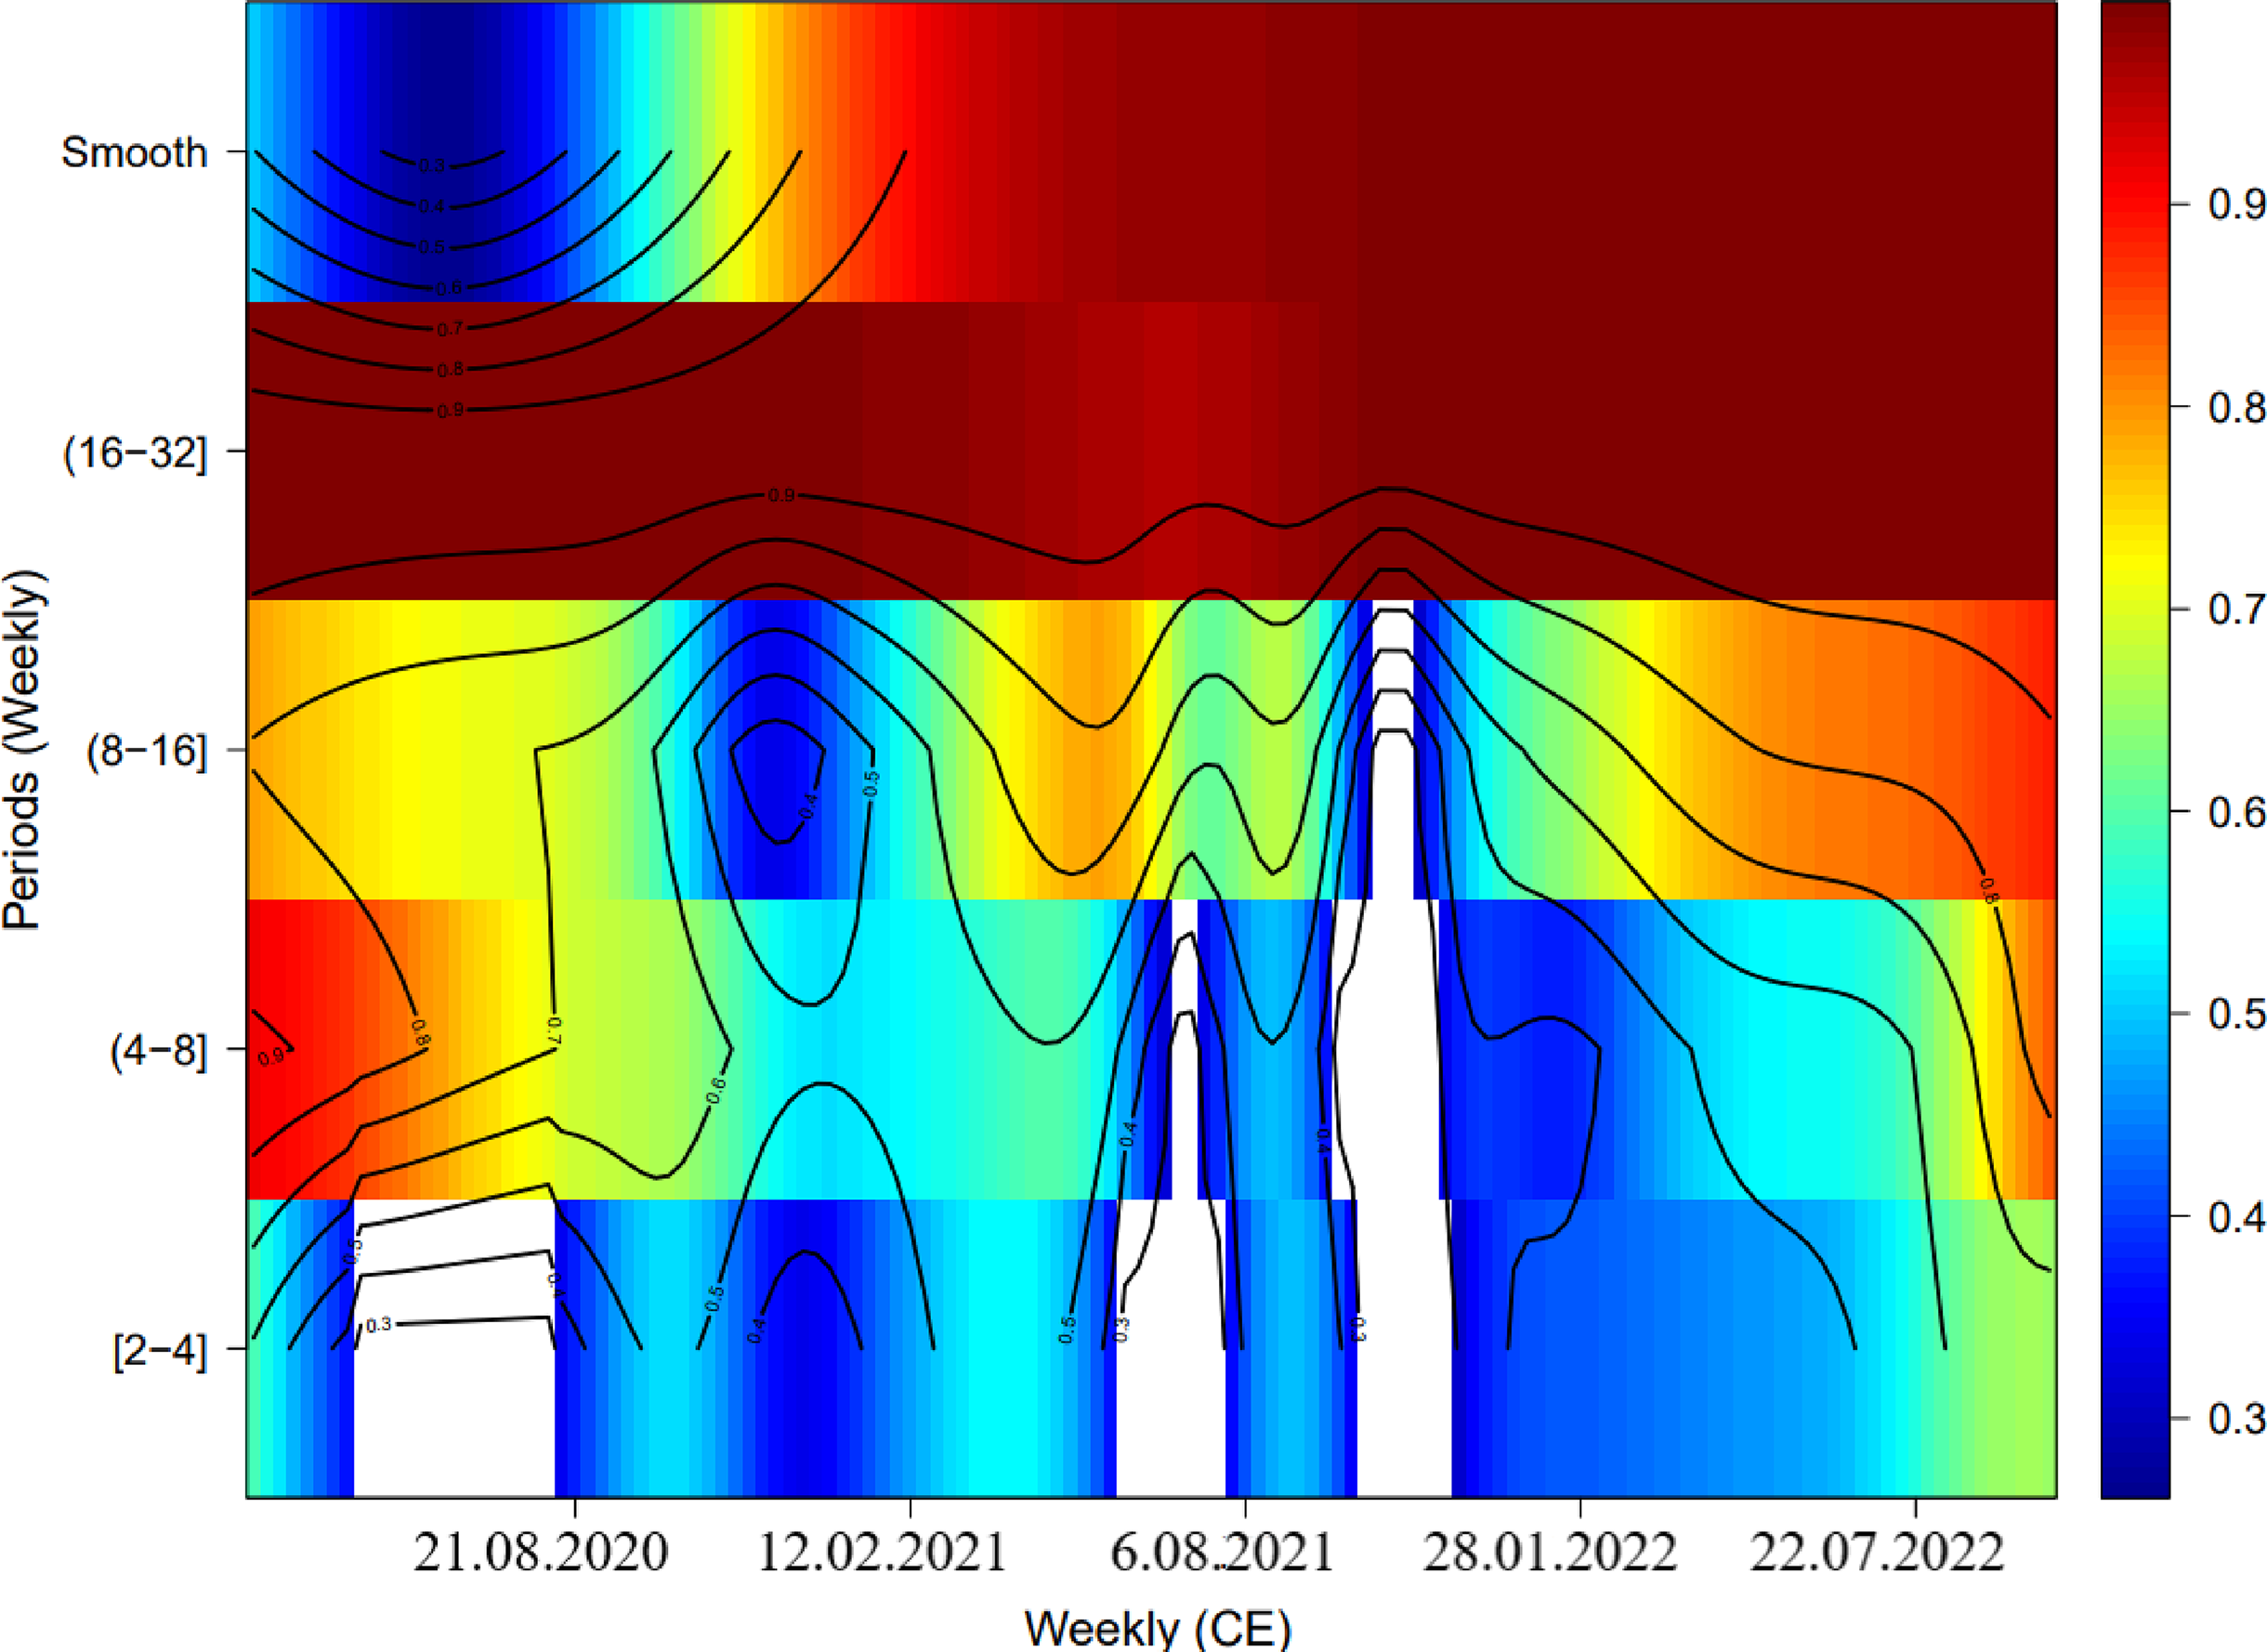
WLMC between green bonds, oil price, and COVID-19 versus CO2 emissions.
Also, it is discovered that the effect of green innovation is crucial for mitigating climate change. By lowering the CO2 emissions cost and consequently mitigating the intensity of CO2 emissions, such technologies have the potential to accomplish the “win-win” of environmental conservation and economic development. The empirical findings indicate that this association is medium-run, so it will take some time until emerging innovations and associated production systems are broadly accessible. The oil price is still a “dominant” factor, even though green innovation has become more effective throughout this time. To support sustainable growth and green innovation during and after COVID, there is a critical need for coordinated policies and reforms. With integrated synergy, plans for socioeconomic growth on a larger scale, and an environment to promote resource availability and low emissions are required.
Conclusion and policy inferences
Conclusion
The world is in grave danger from the COVID-19 pandemic, which negatively influences every element of life, particularly the global economy. Since the COVID-19 pandemic first surfaced in December 2019, it has had a wide range of negative effects on the world economy, including problems with resource consumption, a new recession, supply-chain disruption, and financial collapse. The economic effects of the pandemic worsen as the world gets more integrated. In addition to increasing health costs and reducing the labor force, the pandemic has significantly disrupted the supply and demand chain. Manufacturers have been forced to lay off some of their workers or postpone their business operations to avoid further losses. After the pandemic began, there was a sharp drop in oil consumption due to the closure of factories and businesses, lower travel rates, and other mobility restrictions. As a result, the government, healthcare sectors, and businesses need resilient and strong management to address these concerns of recession and de-growth. This study examines the association between green, oil prices, the COVID-19 pandemic, and industrial CO2 emissions in the USA for the period March 6, 2020 and September 30, 2022. There is presently scant proof of a connection between green bonds, oil prices, the COVID-19 pandemic, and industrial CO2 emissions. As the best knowledge of the authors, this study is the first to use the newly established WLMCs to evaluate the effects of green bonds, oil prices, and the COVID-19 pandemic on industrial CO2 emissions. Furthermore, this study uses the wavelet coherence approach as a robustness check for the WLMCs and it is seen that the results are consistent.
Policy inferences
The results reveal a variety of compelling and intriguing findings. For example, this study contends that the COVID-19 pandemic may increase the level of CO2 emissions in the long-run; however, it will reduce industrial CO2 emissions in the medium-run in the USA. The governments eased restrictions and lockdowns due to an increase in vaccination rates that helped to reduce the number of new cases of the COVID-19 pandemic between 2020 and 2021. These policy choices have led to higher industrial CO2 emissions in the USA. Industrial CO2 emissions have grown due to the USA's decisions to relax its travel restrictions, permit international travel, and open up the bulk of its production facilities to the public. The empirical results also revealed a negative correlation between oil prices and the COVID-19 pandemic, which may be a result of the oil industry's unexpected shock to demand growth. The majority of bivariate and multivariate empirical outcomes reveal a significant relationship between green innovation, oil prices, and the COVID-19 pandemic.
It may be concluded from the evidence that there is a significant positive relationship between industrial CO2 emissions and green bonds, which might be inferred from these results that the USA is moving away from its goal of becoming carbon neutral by 2050. Consequently, it may be necessary for the USA to invest in cleaner and more environmentally friendly energy sources. Such investments may pay off for future generations, and energy security and climate-linked problems may be managed with sound planning and policy. Hence, a few viewpoints are disused from the paper's results from a policy standpoint. The USA needs to make significant investments and concentrate on things, such as contact tracking, vaccination, and pandemic handling. To attain long-run sustainable growth, the USA may nevertheless make an effort to anticipate budgets that take energy efficiency and greener resources into account. Policymakers and health specialists should also offer effective strategies to mitigate the COVID-19 pandemic shocks and their consequences on the ecosystem, human health, business, and all other economic sectors. To forecast the results of the COVID-19 pandemic, they could enlist the aid of disruptive technologies. Future health and environmental problems may benefit greatly from the deployment of these cutting-edge technologies being developed to combat the pandemic. There could be a pressing necessity for relief measures for people, who might go missing. Planning for the medium-run and long-run is crucial for the economic crises’ rebalancing and re-energizing. Resources are now scarce in several developing and growing nations, forcing them to rely on fossil fuels and non-renewables in the long-run. During and after the COVID-19 pandemic, there is a critical need for coordinated changes and policies to preserve green innovation and steady growth.
To stimulate resource supply and low CO2 emissions, it is necessary to implement socioeconomic development strategies on a larger scale. The COVID-19 pandemic, ecological difficulties, and the availability of resources should all be regularly re-evaluated and re-assessed by policymakers in the USA. There is a pressing necessity for counter-cyclical government policies that can further contribute to boosting the recovery of the economy and promoting advancement in technological fields to lessen the negative effects the pandemic had on green bonds. In this respect, the government has a crucial role to play, which states that the recovery plans must consider the energy sector. They must make sure that the green energy sector emerges from this pandemic stronger than ever so that future investment and supply are not disrupted. In the post-pandemic period, the USA may still settle for inexpensive nonrenewable sources of energy due to the low cost of fossil fuels and the high cost of embracing green energy. Because of this, the banks may play a crucial role in this situation by encouraging ultra-low loan rates to lessen the threats posed by the high capital expenditures associated with green energy projects. The global climate catastrophe is not the only issue alleviated by green energy investments. Additionally, it might help unemployed people to find work. Thus, industries and businesses can be restored amid the trying times of the post-COVID-19 pandemic crisis.
According to many experts, the COVID-19 pandemic may have diverted the spotlight away from the world's climate issue. Still, because of the continuing pandemic, the globe has to take greater measures to address the situation. The government recovery initiatives present a once-in-a-generation chance to enhance and improve renewable energy investment. Therefore, it is advised that the USA economic stimulus plans should have components for allocating funds to promote green bonds. Such a pattern was also present during the global financial crisis in 2008 when numerous nations combined short-run stimulus with long-run investments in CO2 emission-reducing technologies. The governments must expand their investments in sustainable energy as the economy continues to gain momentum.
Footnotes
Authors’ contributions
The authors have contributed equally to this work. All authors read and approved the final manuscript.
Availability of data and materials
The data will be available from the authors on request.
Consent for publication
The authors are willing to permit the Journal to publish the article.
Declaration of conflicting interests
The authors certify that they have NO affiliations with or involvement in any organization or entity with any financial interest (such as honoraria; educational grants; participation in speakers’ bureaus; membership, employment, consultancies, stock ownership, or other equity interest; and expert testimony or patent-licensing arrangements), or non-financial interest (such as personal or professional relationships, affiliations, knowledge or beliefs) in the subject matter or materials discussed in this manuscript.
Ethics approval and consent to participate
Not applicable.
Funding
The authors received no financial support for the research, authorship, and/or publication of this article.
