



Abstract
This work aims to explore the impact of intellectual property income (a guarantee for promoting technological advance) on energy efficiency (indicating the technological advance) considering the mediation role of trade openness. To this end, this article uses the available data of 50 countries from 2000 to 2019 to study the influence of intellectual property income and trade openness. The Fully Modified Ordinary Least Square and Dynamic Ordinary Least Square methods are applied in this article to study the long-term relationship between different variables. The empirical results show that there is a mediation effect between intellectual property income and energy intensity. In other words, intellectual property income can not only directly affect energy intensity, but also indirectly affect energy intensity through trade openness. Fully considering the impact of regional heterogeneity, the countries are divided into high-income (HI) countries and middle-income (MI) countries. The results indicate there are noticeable regional differences in the impact of intellectual property income on energy intensity via the mediation effect of trade openness. The improvement of intellectual property income and trade openness benefits the HI countries most, but not for MI countries. Targeted policy implications are proposed to enable a reduction in energy intensity for countries at different income levels.
Introduction
In the context of concerns about climate change and fossil energy consumption, reducing energy intensity, as a key component of sustainable development, has attracted increasing attention. Distinguishing from previous studies focusing on the factors behind energy efficiency and greenhouse gas emissions, this article mainly studies the reasons for the change in energy intensity. The reduction of energy intensity will solve the problems of energy security and poverty to a certain extent, 1 and the concern about climate change. 2 According to the International Energy Agency (IEA, 2020) report, the effective improvement of energy efficiency is very important for reducing greenhouse gas emissions, bearing about 40% of the heavy responsibility.
Influenced by COVID-19, the energy efficiency improvement process is hindered. 3 The additional energy demand brought about by COVID-19 will have a certain impact on the energy intensity. Before the outbreak of COVID-19, the energy intensity excluding weather factors decreased by 1.5% and 1.6% in 2018 and 2019, respectively. However, in 2020, the global energy intensity is only 0.8% lower than the previous year (IEA, 2020), which is far lower than the average annual improvement of more than 3% required to achieve the global climate and sustainable development goals. Comprehending the factors that contribute to the alteration in energy intensity is imperative for enhancing energy efficiency. Generally, energy intensity in high-income (HI) countries is usually lower than that in low-income countries. 4 Further research on the factors that influence the energy intensity of countries with various income levels is essential.
Historically, most technological advances have been in HI countries. 5 The United Nations Framework Convention on Climate Change (UNFCCC) proposes the United Nations technology transfer mechanism to encourage HI countries to transfer technology to low- and middle-income (MI) countries. The U.S.–China Clean Energy Research Center is a representative cooperation mechanism. To a certain extent, enhancing the inter-country transfer process of intellectual property rights and emphasizing the enforceability of such rights in recipient countries can result in greater economic benefits. The intellectual property income of each country, that is, the patent fees charged externally represents the country's scientific research and technology level. 6 Investigating the intellectual property income is innovative and meaningful for energy intensity change in different income countries. In general, the increase in intellectual property income represents the progress of technology in a country with more advanced machines to improve energy efficiency and reduce energy intensity. 7 We will test this hypothesis in the subsequent analysis.
Besides, many countries adopt restrictive measures such as traffic control and limiting population movement due to the spread of COVID-19, which have impacted world trade and primarily affected trade openness. The change in trade openness has brought new challenges to the reduction of energy intensity both in developed and developing countries. For example, many commodities between various countries are transported by ocean shipping or air transportation. Due to varying epidemic prevention policies in different regions, the commodity transportation cycle will probably be prolonged. This phenomenon will change the trade openness to a certain extent and affect the energy intensity. Ordinarily, the impact of trade openness on energy intensity can be affected by the income levels of different countries,8,9 and we will test this hypothesis in the subsequent analysis.
Using the panel data of 50 countries from 2000 to 2019, the contribution of this article is to study the impact of intellectual property income (a guarantee for promoting technological advance) on energy efficiency (indicating the technological advance). Whether intellectual property income can directly or indirectly affect energy intensity is the core part of our study. This article is committed to the potential influencing factors behind energy intensity, mainly including three aspects: (1) Whether or not the intellectual property income can affect energy intensity for countries at different income levels? (2) Is there any difference in the impact of trade openness on energy intensity of countries with different income levels? (3) Does intellectual property income affect energy intensity by the mediation effect of trade openness?
The rest of this article is organized as follows: Literature review section presents a brief review of the literature on intellectual property income, trade openness and energy intensity. The model, method, and data section introduces the model, methods, and panel data used in the article. The results and discussion section provides the results and specific analysis. The conclusions and policy implications section summarizes the main conclusions and puts forward policy implications.
Literature review
Econometric methods are widely used to study the relationship between energy intensity and other factors to explore the factors behind energy intensity. Taking the United States, for example, three-quarters of the reduction in energy intensity is due to the improvement of energy efficiency. 10 The input and production of high-tech products, 11 trade openness12,13 and per capita GDP14,15 and other factors may change the energy intensity. This paper mainly studies the relevant literature in the following three parts: (1) investigating the relationship between intellectual property protection and energy intensity, (2) studying the impact of trade openness on energy intensity, and (3) exploring other factors affecting energy intensity.
Intellectual property protection and energy intensity
The first part concerns the relationship between intellectual property protection and energy intensity. For the indicator of intellectual property protection, the current research is mainly measured by the number of patent applications and the amount of technology investment. 16 However, the number of patent applications can only represent the change in patent number, not the patents actually used. In addition, the amount of technology investment represents a country's extent attached to technology to a certain extent but cannot express the degree of technological change. The intellectual property income indicator refers to the revenue generated from patents, trademarks, copyrights, and other forms of intellectual property. One advantage of using this indicator is that it can incentivize and foster innovation by protecting intellectual property rights, which can then indirectly impact the innovative forms of energy intensity. Another reason is that in the database of the World Bank, intellectual property income data is more readily available after 2000 when compared to the data on the number of patent applications and the amount of technology investment. This paper uses the indicator of intellectual property income to make up for the shortcomings of previous research.
Referring to the relevant literature, it seems that few scholars have studied the empirical relationship between the two variables. The existing research mainly focuses on the impact of intellectual property on carbon dioxide emissions and energy consumption. Specifically, 17 explores the importance of technological progress in reducing energy intensity. The results show that technological progress will directly reduce energy consumption to a certain extent. 18 studies the impact of intellectual property on carbon dioxide emissions at the urban level in China and comes to the conclusion that the effect of intellectual property protection on carbon emissions through research and development investment shows a trend of first decreasing and then increasing. 19 shows that R & D expenditure on energy-saving and emission-reduction technologies is necessary to reduce carbon emissions. 20 indicates that trademarks and eco-patents are conducive to decreasing carbon dioxide emissions. Generally speaking, the reduction of carbon dioxide emissions represents the decrease in energy consumption, which may be caused by the decline in energy intensity or people's demand for primary energy. However, with the development of the economy and society, countries usually need more fuel. Therefore, the reason is probably the decrease in energy intensity.
Ulteriorly, intellectual property is considered an important pillar in increasing the production of renewable energy. For instance, 21 shows that greater protection of intellectual property rights can accelerate the application of new technologies and equipment by relevant enterprises. In this process, backward production capacity can be eliminated, accelerating renewable energy production. However, using the panel data of 102 countries 22 indicates that the intensity of intellectual property protection will not affect the adoption of renewable energy, which is inconsistent with the empirical results of Tee et al. 21 Furthermore, the increase in intellectual property income represents the progress of science and technology to a certain extent. Some scholars have studied the relationship between technological innovation and energy intensity. For example, Pan et al. 16 discovers that technological innovation plays a vital role in reducing energy intensity. The index of technological innovation is the number of patent applications. 16 Based on the empirical analysis of China, Ma and Stern 23 denotes that technological change has been proven to be the main reason for China's energy intensity decline. The same conclusion has also been confirmed in 40 major economies 24 and China.25,26 To sum up, the research on intellectual property income on trade openness and energy intensity is still insufficient, and our research hopes to fill this gap.
Trade openness and energy intensity
The second research topic focuses on examining the influence of trade openness on energy efficiency. Trade openness can be affected by many factors, such as the development of broadband infrastructure 27 and trade tariffs. 27 There have been some articles about the impact of trade openness on energy intensity. For instance, the directed acyclic graphs (DAGs) technique is applied to study the causal relationship between trade openness and energy intensity. 16 The DAG results show that the impact of trade openness on energy intensity will reach the highest level in the long run. Taking Bangladesh as an example, a path model is established to study the influence of trade openness on energy intensity. 8 The results denote that trade openness directly negatively impacts energy intensity. Similar findings are also discovered by Zhu and Lin 28 and Salim et al. 29
Some scholars have conducted research on energy intensity in China. Using the data of 30 provinces and regions in China from 2005 to 2018, 30 finds that improving trade openness can reduce energy intensity. Moreover, for the eastern and western regions of China, the change in trade openness has only brought small regional differences. Besides, the factors that impact energy intensity in OPEC countries are often studied by researchers. Through the analysis of panel data from 1990 to 2016, trade openness will significantly reduce energy intensity by using the ARDL method. 31
In addition, based on 22 emerging countries, an empirical result shows that increased trade openness can significantly reduce energy intensity. 32 Greater trade openness can become a channel for developed countries to transfer cleaner and more energy-saving technologies to developing countries, promoting the global minimization of greenhouse gas emissions. 33 discusses the trade openness between 1999 and 2018. Taking 35 OECD countries as examples, the results show that the relationship between trade openness and renewable energy is nonlinear which exists three breakpoints. Nevertheless, some scholars find that trade openness has no significant impact on energy intensity, and the data source is based on the secondary data of nine Southeast Asian countries from 2001 to 2014. 34 It seems that there is no consistent conclusion about the impact of trade openness on energy intensity, and our article will further verify this problem.
Other factors affecting energy intensity
Apart from the above two influencing factors (i.e., trade openness and intellectual property income; see the intellectual property protection and energy intensity and trade openness and energy intensity sections), economic development may significantly impact energy intensity. For instance,35,36 denotes that there is a unidirectional relationship between per capita GDP and energy intensity. That is, per capita GDP can affect energy intensity. 37 Pan et al.16 use the SVAR model to show that economic development greatly impacts energy intensity in the short term. Using state-level data in the United States 10 indicates that the increase in per capita income plays a vital role in reducing energy intensity, and the findings are consistent with Yu 38 and Fitriyanto and Iskandar. 34 Countries or regions with higher GDP often have lower energy intensity. Similar findings can also be found in Wei et al., 26 Kepplinger et al., 39 Mahmood and Ahmad, 40 and Salim et al. 29 In addition, the economic freedom index is a useful indicator for measuring a country's level of economic freedom relative to other periods. 41 and 42 have found that the economic freedom index can influence energy intensity and trade openness. 43 uses the globalization index as a representative variable of economic freedom to study the impact of different factors on corruption. To gauge economic development, this article utilizes per capita GDP as an indicator to reflect the overall economic output of both HI and MI countries.
Additionally, energy intensity can be affected by the population. 44 Using the data collected from the International Energy Agency and the UN International Development Organization Kepplinger et al. 39 finds countries with smaller populations often have lower energy intensity. Besides, by analyzing the data of some European countries, 40 selected Asian developing countries 29 and Canada, 45 concluding that population has an impact on energy intensity. In Japan, population agglomeration in large urban areas increases energy intensity, while population dispersion in rural areas intensifies energy intensity46,47 The population is an important factor affecting the energy intensity of China, which has been verified in the research of Wei et al., 26 Wu et al., 48 and Zeng and Ye. 49 Furthermore, Yang et al. 50 confirms that 17 provinces in China are mainly affected by the total population.
Moreover, urbanization is often used to study the change in energy intensity. The key point that scholars want to check is whether the acceleration of urbanization will exert a certain pressure on energy intensity. In this regard, Sadorsky 1 examines the impact of urbanization on energy intensity in 30 provinces in China indicating that urbanization will significantly improve energy intensity. Wang et al. 51 use the dynamic panel method to study the influencing factors of manufacturing energy intensity from the new perspective of industrial robots. According to the results obtained through the GMM method, the utilization of industrial robots can significantly enhance the energy intensity of the manufacturing industry. Wen et al. 52 study the influencing factors behind the energy intensity of energy-intensive and capital-intensive industries, and explores the impact of informal producers on different sectors.
In short, many researchers have explored the impact of GDP, trade openness, and other factors on energy intensity. However, few scholars have studied the relationship between intellectual property income, trade openness, and energy intensity, especially intellectual property income on energy intensity influence is unknown. In addition, the impact of these variables on countries at different income levels may also be different, but most studies have ignored this effect.
Model, method, and data
Econometric model
To quantitatively study whether trade openness affects the impact of intellectual property income on energy intensity, this study uses the mediation effect model to analyze the influence. The conventional mediation effect model equations are shown as follows:



Figure 1 vividly describes the role of mediating variable Z. We can divide the model according to Figure 1 into three parts.
For Eq. (1), it is used to test the independent variable effect on the dependent variable without the effect of mediating variable. If the coefficient (i.e., For Eq. (2), its primary role is to explore if the independent variable influences are mediating variable. If the coefficient (i.e., For Eq. (3), it is more complicated than the other two equations. Both independent and mediating variables need to be considered, as shown in Figure 1. Only if the coefficients (i.e.,
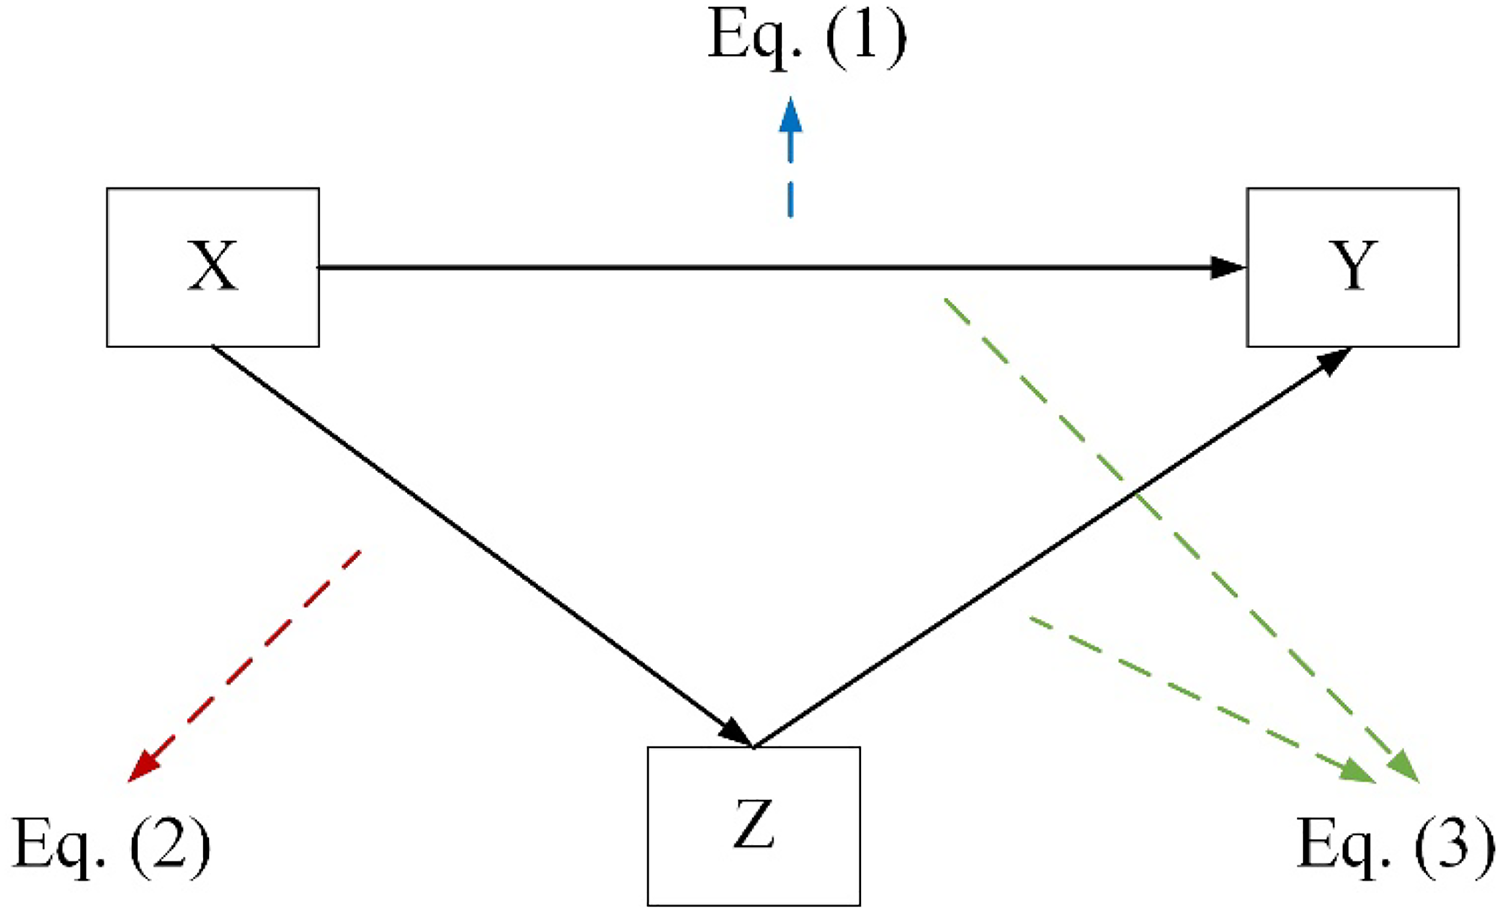
Conventional mediation effect model.
The following specific model is converted into a log-linear econometric model based on the conventional mediation effect model.



Method
The study of the relationship among the independent variable, dependent variable, mediating variable, and two control variables is divided into five steps. First, the Breusch–Pagan LM test, the Pesaran scaled LM test, and the Pesaran CD test are used for cross-sectional dependence tests. Second, considering cross-sectional dependence, the second-generation unit root test is utilized to verify the sequence's stability. On this basis, the cointegration test is used to verify the long-term relationship between variables. Then, based on the mediation effect model, the Fully Modified Ordinary Least Square (FMOLS) and Dynamic Ordinary Least Square (DOLS) estimates are employed to conduct empirical analysis. Finally, the robustness test is adopted to confirm the mediation effect.
Cross-sectional dependence tests
The cross-sectional dependence tests are the first step in empirical analysis because there is maybe an interrelated relationship between different countries. If the cross-sectional dependence exists, it will affect the reliability of the results. Three cross-sectional dependence tests are used in our analysis, namely the Breusch–Pagan LM test, the Pesaran scaled LM test, and the Pesaran CD test. The Breusch–Pagan LM test
54
can be expressed as follows:



Unit root tests
The purpose of unit root tests is to confirm whether there is a unit root in the sequence. Initially, we use four first-generation unit root tests: LLC, IPS, ADF, and PP-Fisher. The null hypothesis of these four tests is

The LLC test
56
is denoted as follows:

The IPS test
57
is also based on Eq. (12). In addition, the ADF and the PP-Fisher tests
58
are generated from p-values of independent hypotheses. We can obtain the overall statistical result from these p-values. The formula for the ADF test and PP-Fisher test look as follows:



Cointegration test
To confirm if there is a possibility of spurious regression in the research being studied, cointegration tests need to be conducted. Pedroni
61
proposed the Pedroni cointegration test, which focuses on whether there is a stable equilibrium relationship between different variables in the regression process. The main equation is:

Then, we use Johansen's Fisher cointegration test to summarize the p-values of multiple maximum likelihood estimators. 62 We mainly use this cointegration test method because we do not need to consider the heterogeneity between the different countries studied, and the calculation process is relatively simple.
FMOLS and DOLS estimator
To verify the long-term relationship between various variables, FMOLS and DOLS are used in our study. They were first proposed by Phillips and Hansen
63
and Kao and Chiang
64
respectively. Many scholars have used FMOLS and DOLS methods as long-term relationship estimation methods, such as Shahbaz, Kirikkaleli and Adebayo, Bekun65–67 and Farhani and Rejeb
68
The DOLS method addresses the lag issue of the variables being studied, while the FMOLS method addresses the problem of correlation between variables by utilizing a nonparametric approach. Subsequently, Pedroni
69
improved the method by using specific parameters to consider heterogeneity and serial correlation. Seeing that the mean FMOLS t-statistic for


Robustness test
The robustness test is essential for the reliability of model results. Robustness indicates whether the set model variables and methods impact the results if some contents of the model change. The commonly used robustness tests include several main aspects in terms of motivation and purpose. The first main purpose is to exclude the interference of other factors or alternative explanations, by adding variables or adjusting the sample period. The second main purpose is to illustrate the stability of the results under different variables and samples, mainly through the variable replacement method, adjusting the sample period, or changing the estimation method. The third main objective is to discuss the differences and similarities between groups as a way to enrich the conclusions of the article. This objective is achieved mainly by using sample groupings. The fourth main objective is to enrich the whole analysis logic by extending the regression chain, mainly using supplementary variable methods to the analysis.
Combined with the above analysis, supplementary variable method, adjusting the sample period, variable replacement method, changing the estimation method, and sample grouping are mainly selected for robustness testing. Among them, in the FMOLS and DOLS estimator section, the robustness test of changing the estimation method has been conducted by two methods, FMOLS and DOLS. In the empirical analysis of different income groups section, sample grouping tests have been performed to verify the effect of countries with different income levels on the results. Therefore, adjusting the sample period, supplementary variable method, and variable replacement method are selected in this part.
Adjusting the sample period implies that if the time range of the data set is changed, the conclusion may differ. For example, the empirical results may vary when the sample period is pushed forward by five years or delayed by ten years. Utilizing the supplementary variable method can help determine if the original conclusion is unreliable. The supplementary variable method refers to when studying the influence of independent variables, and some independent variables may be omitted, resulting in a deviation of results. In this process, we can add other variables that may impact the results. The robustness of the model is verified by observing each variable's significance after adding a new variable.
The variable replacement method mainly involves replacing the dependent variable or the primary independent variable. In some empirical analyses, a variable is usually measured by referring to the methods in the previous literature. Various schemes can be used to measure a variable which may result in a certain gap in the results. Therefore, the variable replacement method is a common means to check the robustness of the model. Since there are no appropriate replacement variables for the primary independent variables and dependent variables in this article, the replacement control variable is chosen instead.
Data
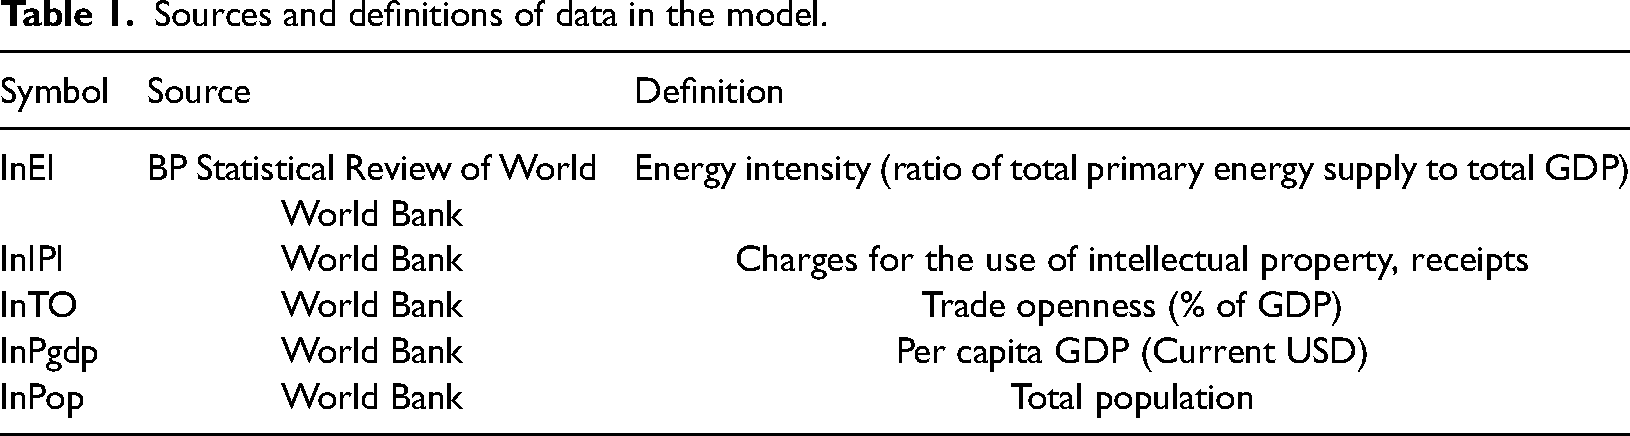
Considering the availability of data, a panel dataset covering 2000–2019 of 50 countries is utilized in this study to discover the effect of intellectual property income. Intellectual property income, energy intensity, and trade openness are set as the independent variable, dependent variable, and mediating variable, respectively. In addition, we select per capita GDP and total population as the control variables of the mediation effect model. The variable definitions are shown in Table 1, and Table 2 denotes the descriptive statistics of five variables.
Sources and definitions of data in the model.
Descriptive statistics of the variables (after logarithm).

The variable relationships of Eqs. (4)–(6) corresponding to the mediation effect model are shown in Figure 2. The black solid line represents the impact of intellectual property income on energy intensity without considering trade openness. The red dotted line indicates the effect of intellectual property income on trade openness. The blue dotted line denotes the impact of intellectual property income on energy intensity under the mediation effect of trade openness.
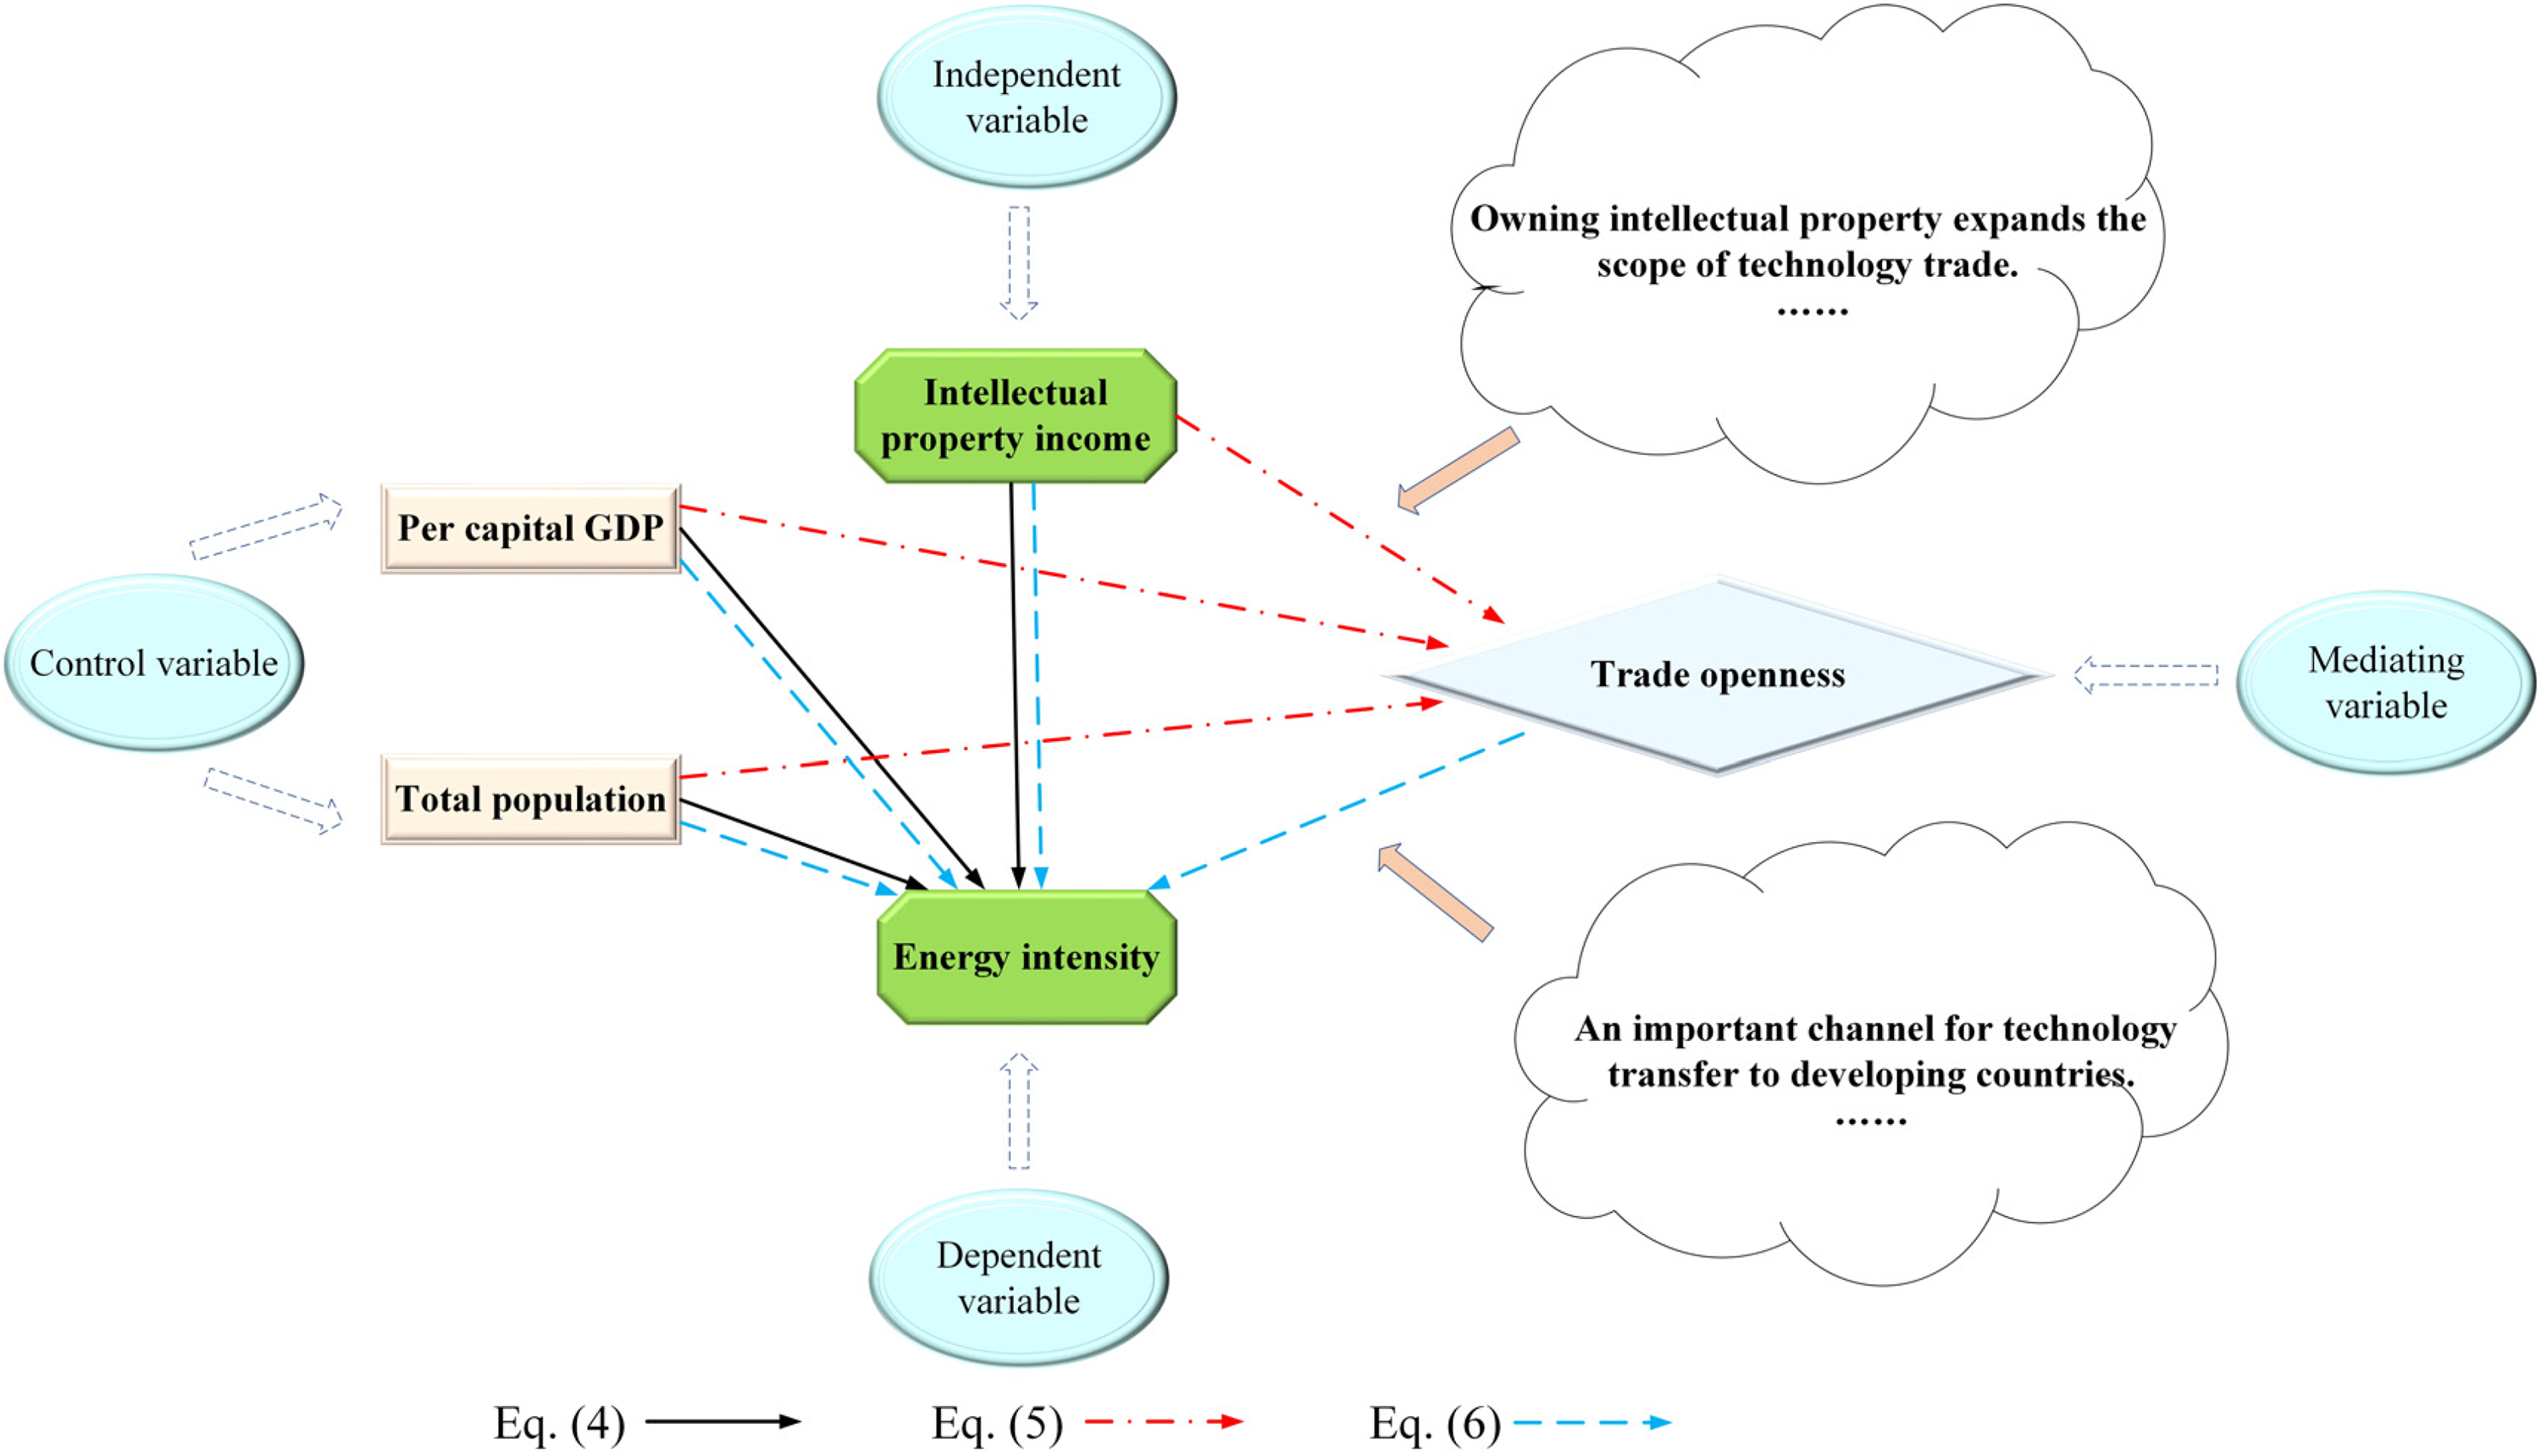
Mediation effect model between intellectual property income and energy intensity.
Results and discussion
Cross-sectional dependence tests results
Table 3 denotes the cross-sectional dependence test results of the three methods. For the three models in our study, the null hypothesis of these dependence tests is no cross-sectional dependence. The results reject the null hypothesis because the p-values are significant at 1%. This indicates the cross-sectional dependence exists in the model. It needs to be taken into account in subsequent procedures.
Results of cross-sectional dependence tests.

Notes: ***, **, and * indicate statistical significance at 1%, 5%, and 10% inspection levels, respectively. Models 1–3 correspond to the three equations of the mediation effect model.
Unit root tests results
Considering the existence of cross-section dependence, the second unit root tests are necessary for our study. 70 The first-generation unit root test ignores the cross-sectional correlation, leading to significant deviation in the empirical results. 71 As shown in Table 4, the results of the PANIC and CIPS methods are not always significant. After the first-order difference, all the p-values are significant at the 10%, indicating the series are stable.
Results of the second-generation unit root test.
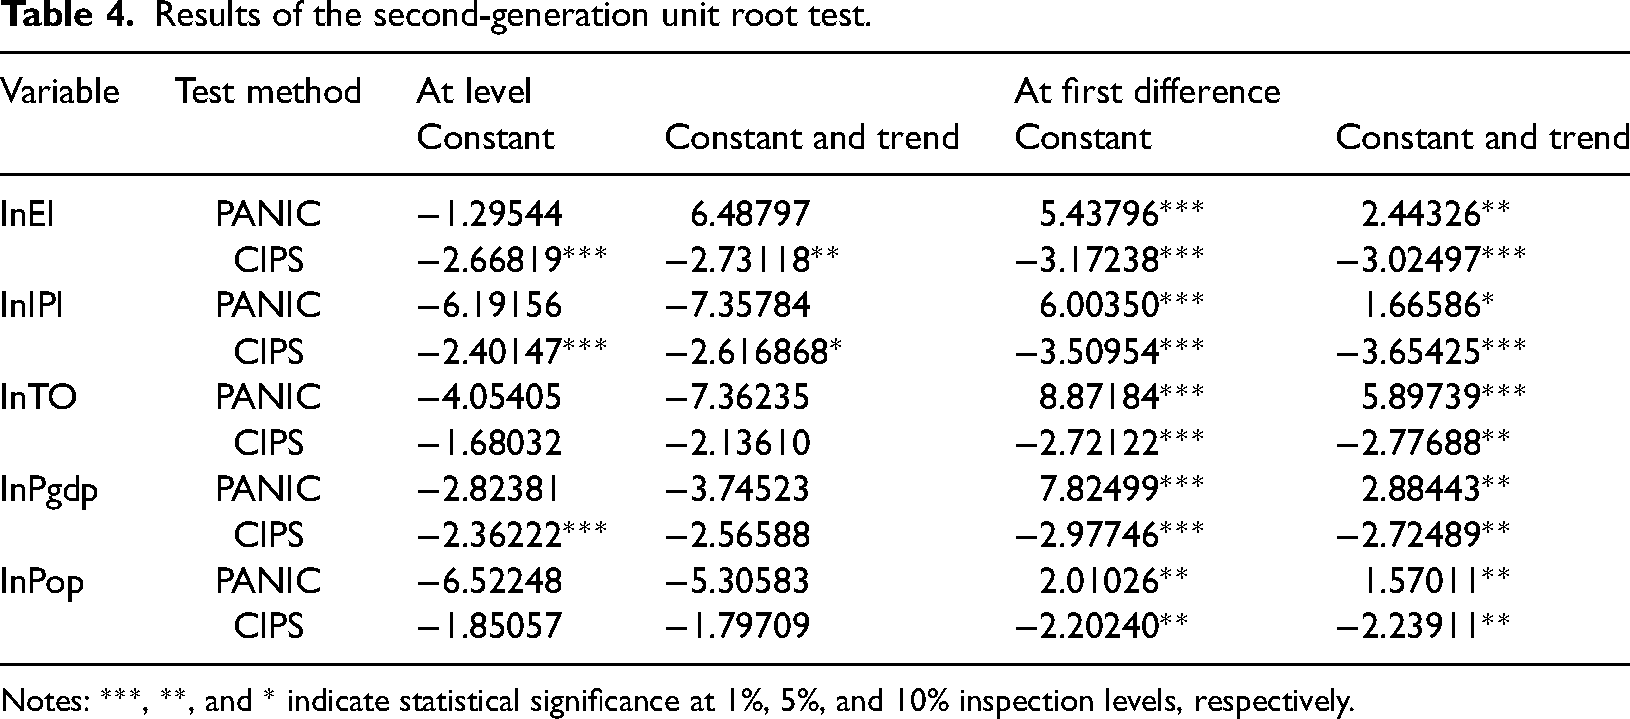
Notes: ***, **, and * indicate statistical significance at 1%, 5%, and 10% inspection levels, respectively.
Cointegration tests results
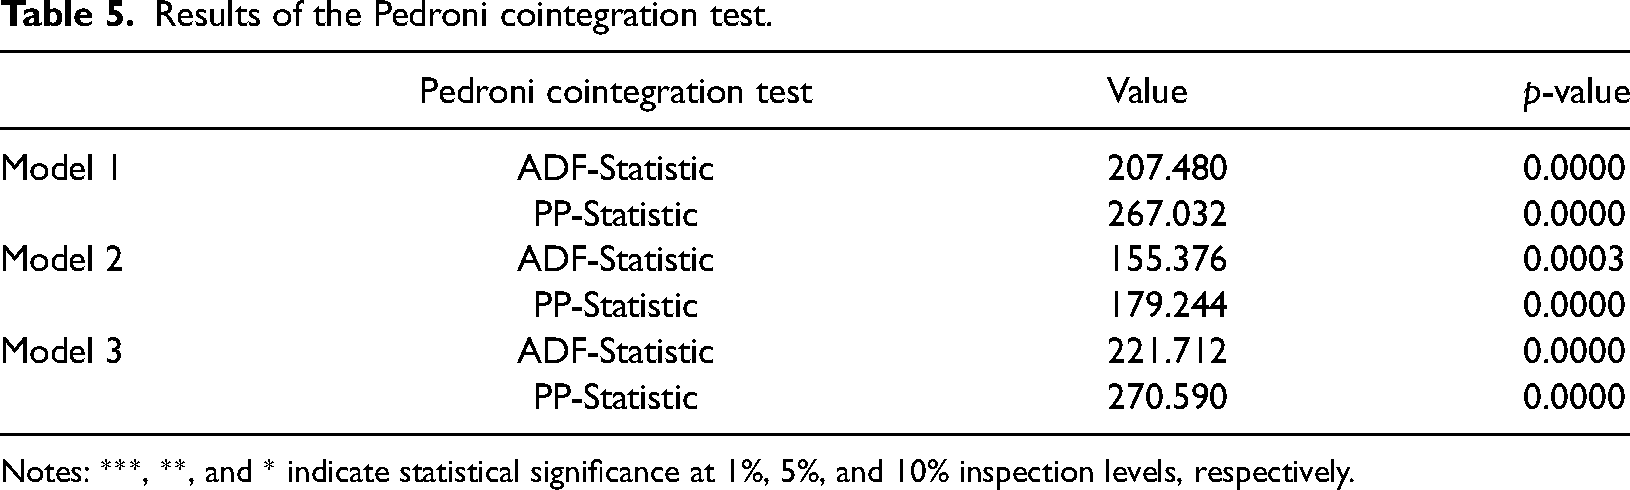
Furthermore, the Pedroni cointegration and Fisher cointegration tests are carried out. In Table 5, the Pedroni cointegration results indicate that the original assumptions are rejected. Similar conclusions can also be drawn from the Fisher cointegration test in Table 6, which means that the long-term cointegration relationship between the five variables existed in these 50 countries from 2000 to 2019. To further explore the long-term relationship between variables, FMOLS and DOLS cointegration estimations are carried out.
Results of the Pedroni cointegration test.
Notes: ***, **, and * indicate statistical significance at 1%, 5%, and 10% inspection levels, respectively.
Results of the Fisher cointegration test.

Notes: * denotes rejection of the hypothesis at the 0.05 level.
Estimator results
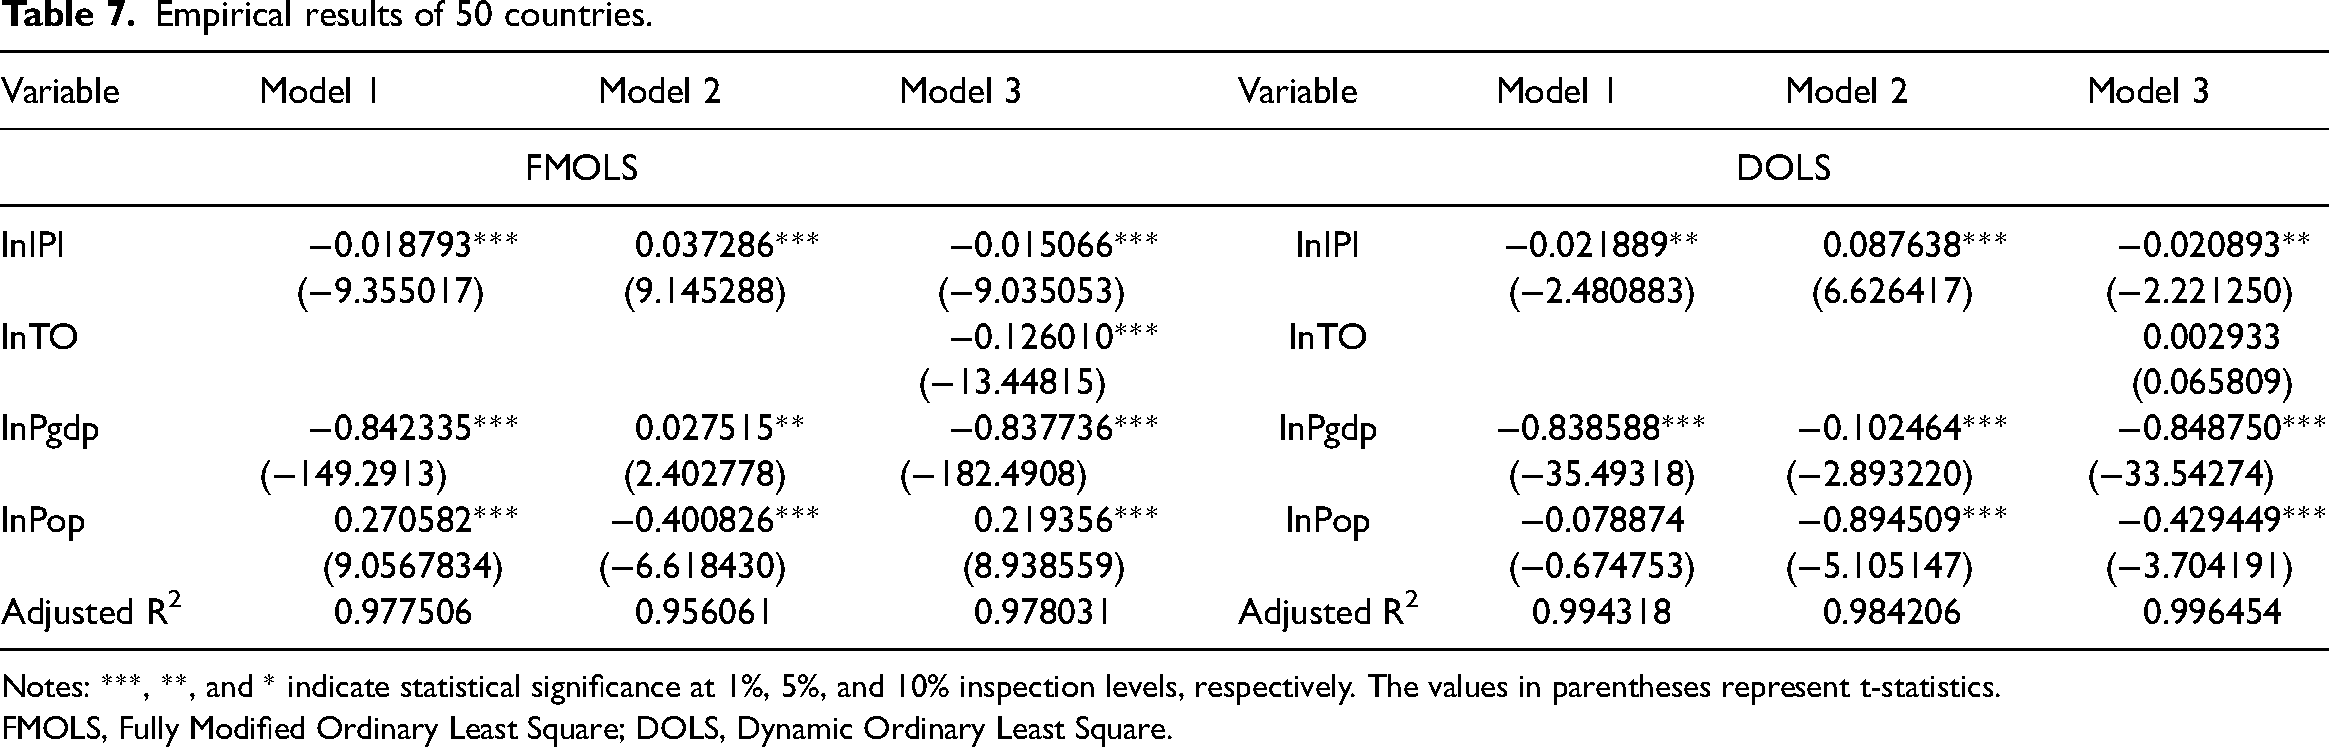
From the FMOLS and DOLS estimated results of Table 7, the first and fifth columns are the models’ variables, mainly the independent, mediating, and control variables. The FMOLS and DOLS results of the three models are listed in the second to fourth columns and six to eight columns, respectively.
Empirical results of 50 countries.
Notes: ***, **, and * indicate statistical significance at 1%, 5%, and 10% inspection levels, respectively. The values in parentheses represent t-statistics.
FMOLS, Fully Modified Ordinary Least Square; DOLS, Dynamic Ordinary Least Square.
Model (1) results indicate that the coefficient of intellectual property income is significantly negative both in FMOLS and DOLS, which means the increase of intellectual property income will reduce energy intensity. According to the results of FMOLS, increasing intellectual property income by 1% can reduce 0.018793% of energy intensity. The empirical results of model (2) indicate that at the 1% inspection level, an increase of intellectual property income by 1% can improve trade openness by 0.037286%. That is to say, improving intellectual property income can promote trade openness. In Model (3), a 1% increase in intellectual property income and trade openness lead to 0.015066% and 0.126010% decrease in energy intensity in the long run, respectively. In a word, the mediation effect of trade openness exists between intellectual property income and energy intensity. Except that the impact of trade openness on energy intensity in Model (3) obtained by DOLS is not significant, the other empirical results obtained by DOLS and FMOLS are basically consistent, which verifies the stability of the results.
Specifically, from the empirical results of these 50 countries, the increase in intellectual property income can reduce energy intensity, which denotes that the progress of technology and the adoption of advanced production methods can improve energy efficiency to some extent.72,73 On the one hand, a significant income from intellectual property indicates that a country possesses robust technological capabilities, a higher level of national development, and places a high emphasis on technological advancements. Therefore, these countries continue to adhere to the research of core equipment, such as special power chips, intelligent sensors, and UHV DC bushings. On the other hand, with the increased intellectual property income, the state has more funds to invest in technological products, reducing energy intensity.
In addition, there is a mediation effect of trade openness between intellectual property income and energy intensity. The proportion of imports and exports to total GDP can be represented by the trade openness indicator, which means a more frequent and wide range of international trade. 74 The increase in intellectual property income represents the improvement of scientific and technological capacity. Having more intellectual property rights can enhance a country's competitiveness. In the current global context, protecting intellectual property rights holds significant importance for countries with varying income levels. A country can take advantage of some technologies and products in international trade. Just as Moskalyk 75 investigated, the main reason for the growth of production efficiency in developing countries lies in the technology transfer of countries with more advanced technologies and the export of technology-intensive products. For instance, one obvious process is the transfer of energy-intensive industries to developing countries, which has worsened the environment of developing countries (Baumert et al., 2019). Moreover, enhancing trade openness can facilitate technical exchanges among different countries, allowing them to make up for technology shortages.
Robustness test result
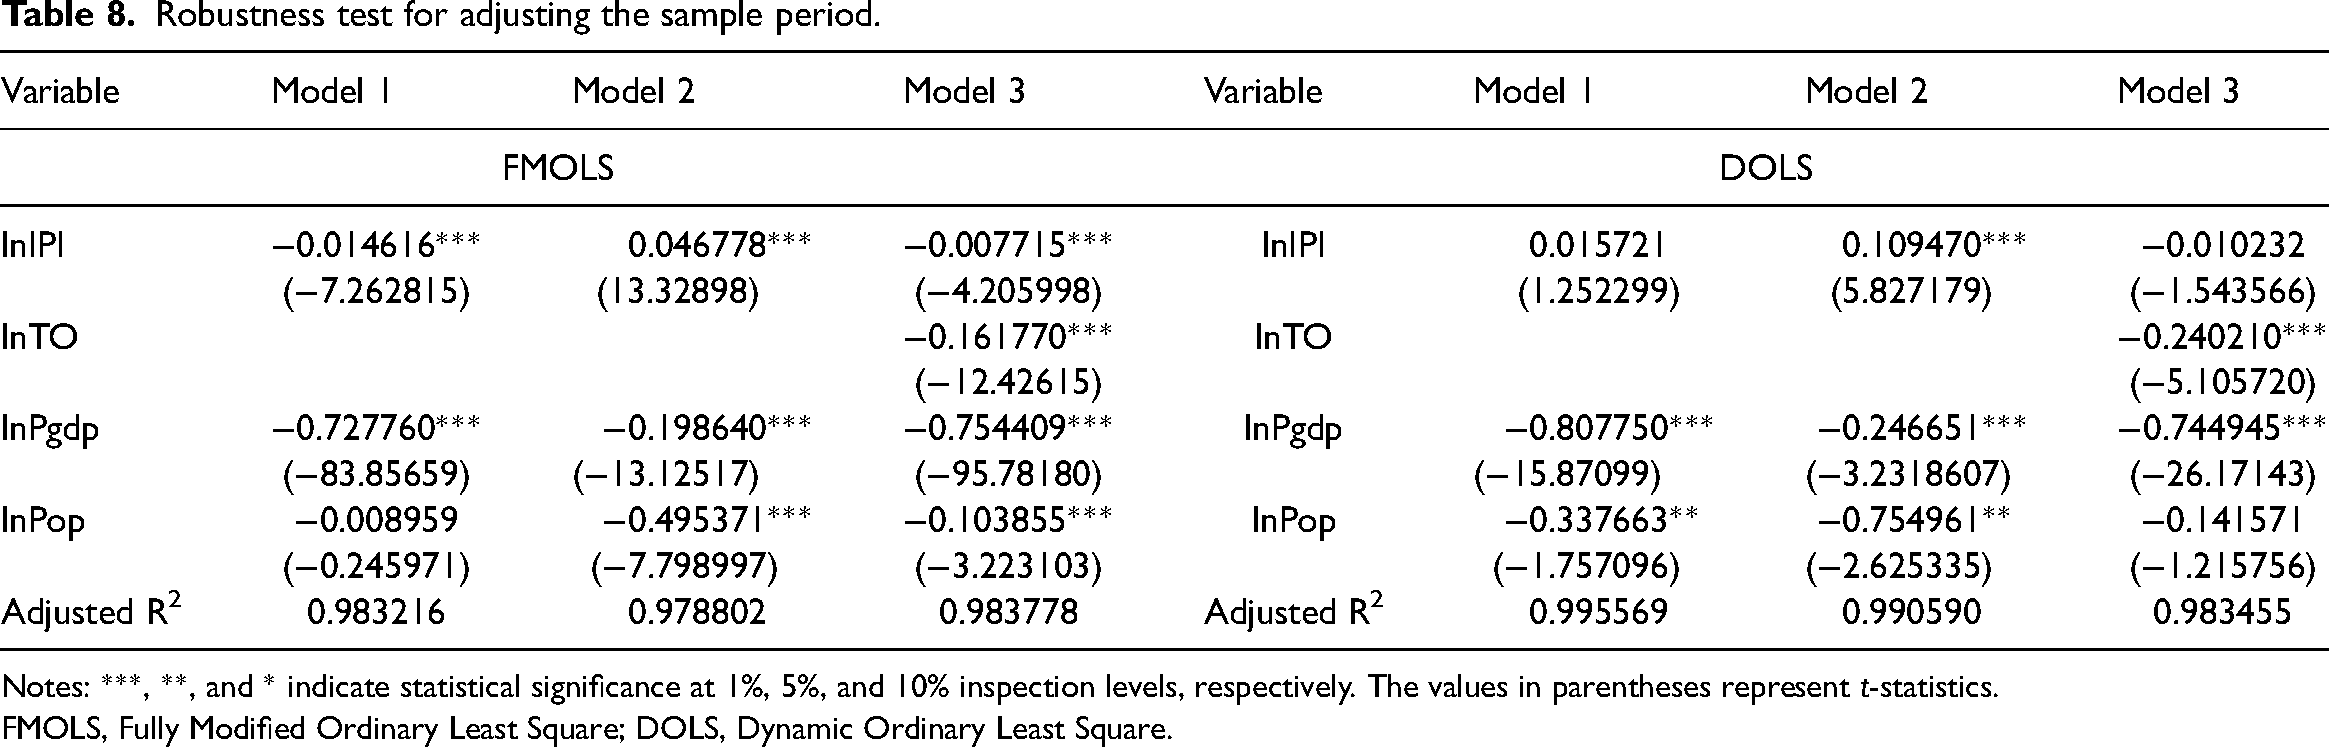
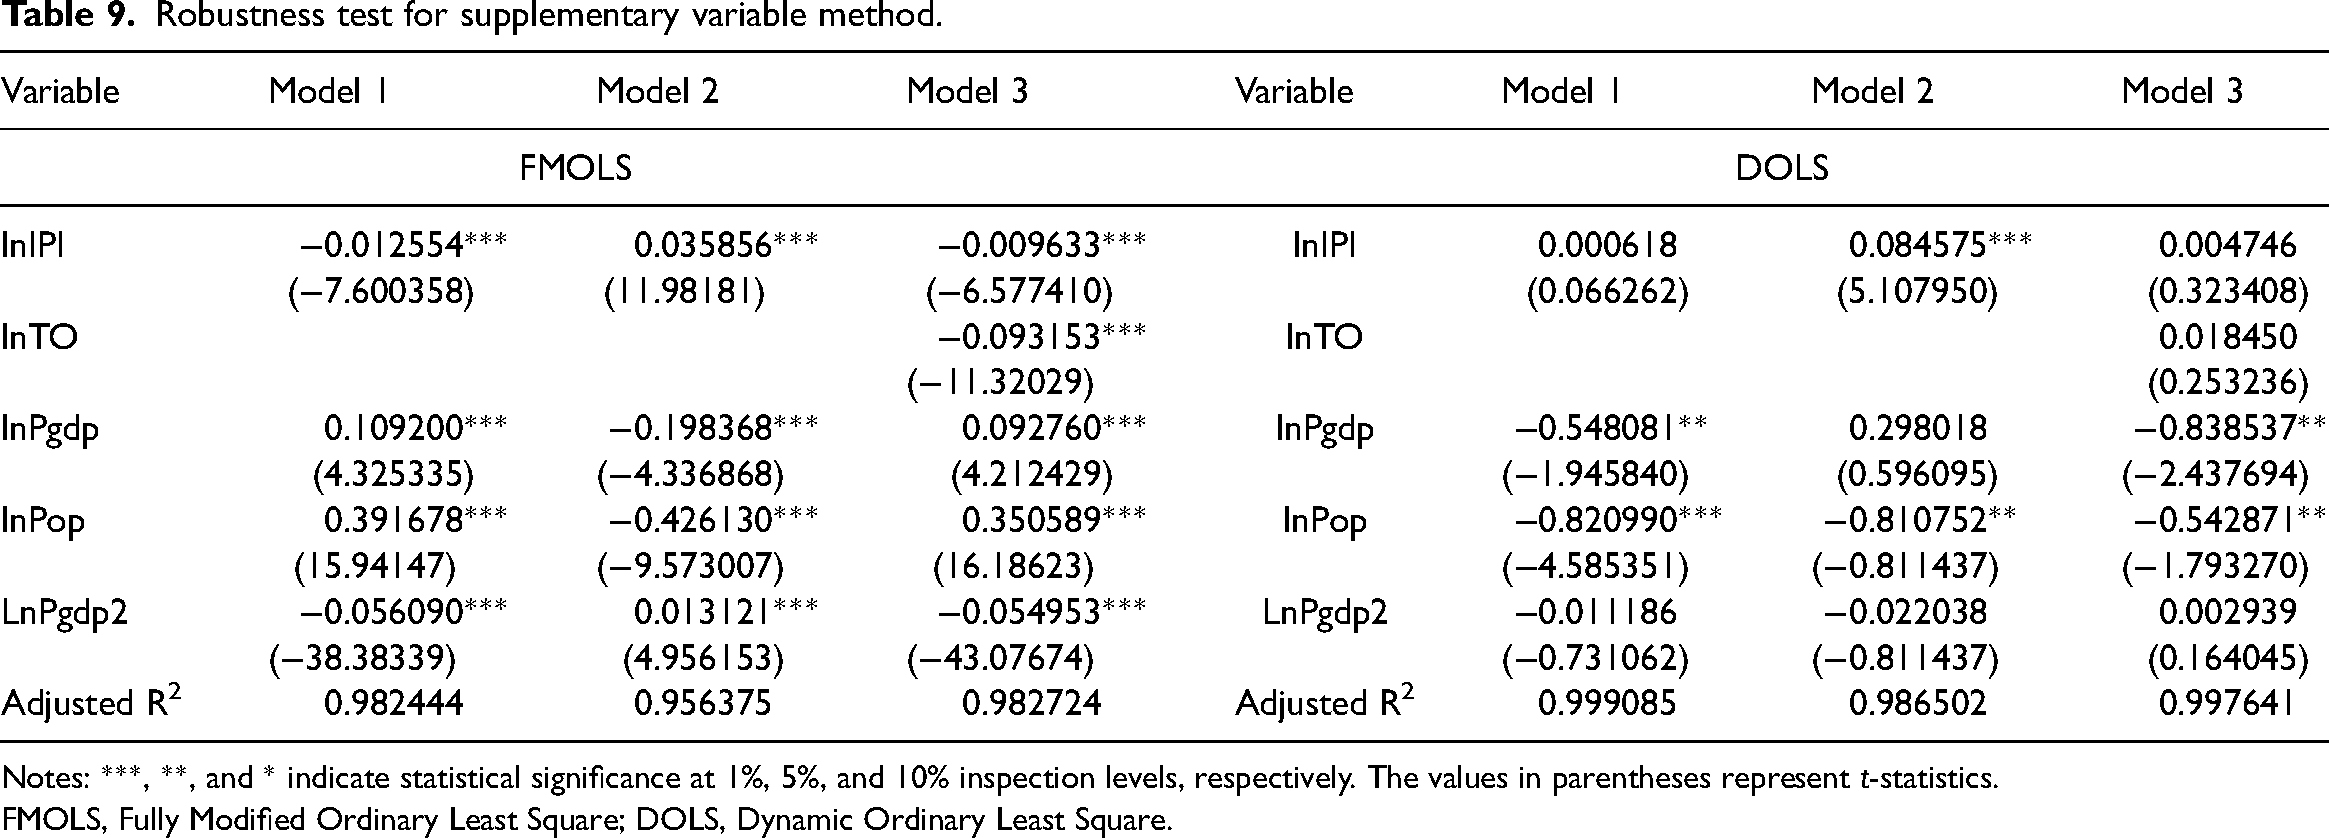
As shown in Table 8, the first method is to adjust the sample period by changing the original data from 2000 to 2019 to the new data from 2005 to 2019. The second method, called the supplementary variable method, involves adding a new variable—the square of per capita GDP (Pgdp2) in Table 9. Agovino et al. and O’Connor and Cleveland 77 have shown that adding this variable can further verify the tenability of the inverse U-shaped relationship between per capita GDP and energy intensity. Since the relationship between these two variables is not the focus of the article, there is no more detailed analysis of this part.
Robustness test for adjusting the sample period.
Notes: ***, **, and * indicate statistical significance at 1%, 5%, and 10% inspection levels, respectively. The values in parentheses represent t-statistics.
FMOLS, Fully Modified Ordinary Least Square; DOLS, Dynamic Ordinary Least Square.
Robustness test for supplementary variable method.
Notes: ***, **, and * indicate statistical significance at 1%, 5%, and 10% inspection levels, respectively. The values in parentheses represent t-statistics.
FMOLS, Fully Modified Ordinary Least Square; DOLS, Dynamic Ordinary Least Square.
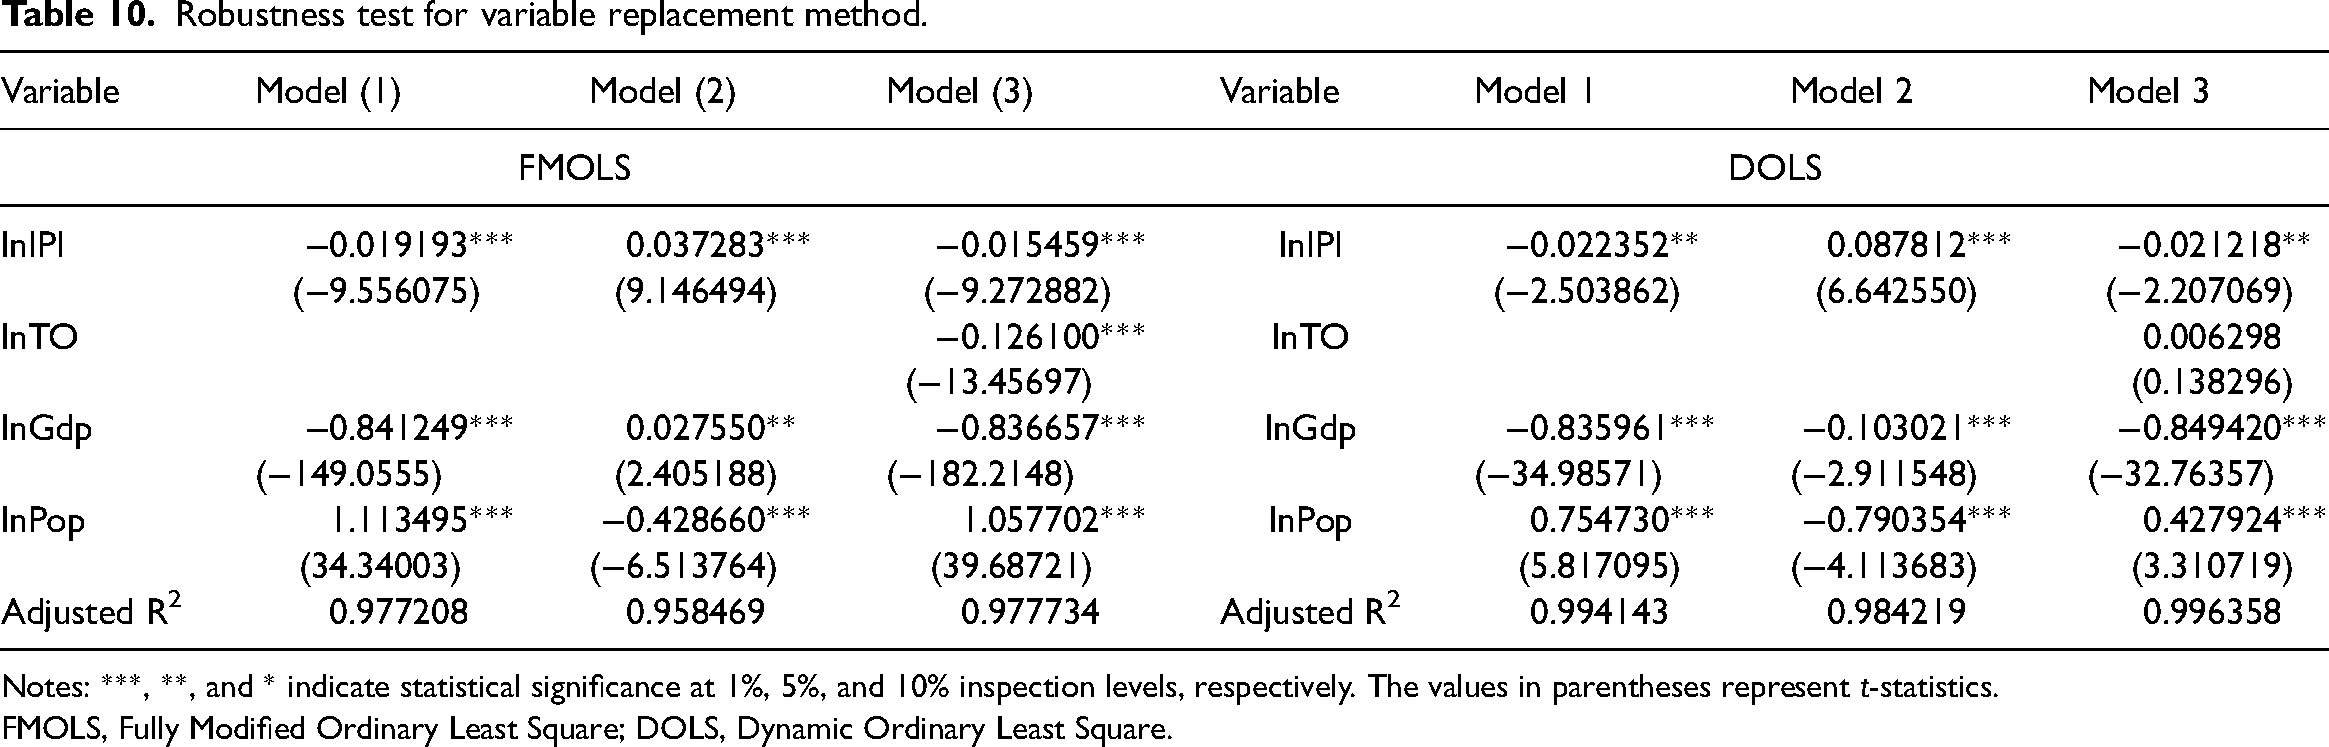
The third method is the variable replacement method. Per capita GDP is replaced by the total GDP, where the logarithm of the total GDP is expressed in lnGdp. The main independent or dependent variable is generally chosen for robustness testing. While the similar independent variable for intellectual property income is the number of patents in our article. Since the World Bank's database does not fully record the number of patents for all 50 countries studied, the results of the robustness test may be impacted by some errors. Additionally, it seems that there are no similar indicators of the mediating variable (trade openness) and the dependent variable (energy intensity). Therefore, we have decided to replace the control variable of per capita GDP with total GDP. The corresponding robustness result is listed in Table 10.
Robustness test for variable replacement method.
Notes: ***, **, and * indicate statistical significance at 1%, 5%, and 10% inspection levels, respectively. The values in parentheses represent t-statistics.
FMOLS, Fully Modified Ordinary Least Square; DOLS, Dynamic Ordinary Least Square.
The coefficients of the independent variable and mediating variable of the equation after the three robustness tests are basically consistent with the original equation. It denotes the robustness of the relationship between energy intensity, trade openness, and intellectual property income.
Empirical analysis of different income groups
Differences in energy intensity
Due to the significant differences in energy intensity, this study divides 50 countries into HI countries and MI countries according to the division standard of the World Bank. The income levels of different countries are listed in Table 11. Figure 3 shows five randomly selected countries from each income level, including the energy intensity, intellectual property income, and trade openness from 2000 to 2019.
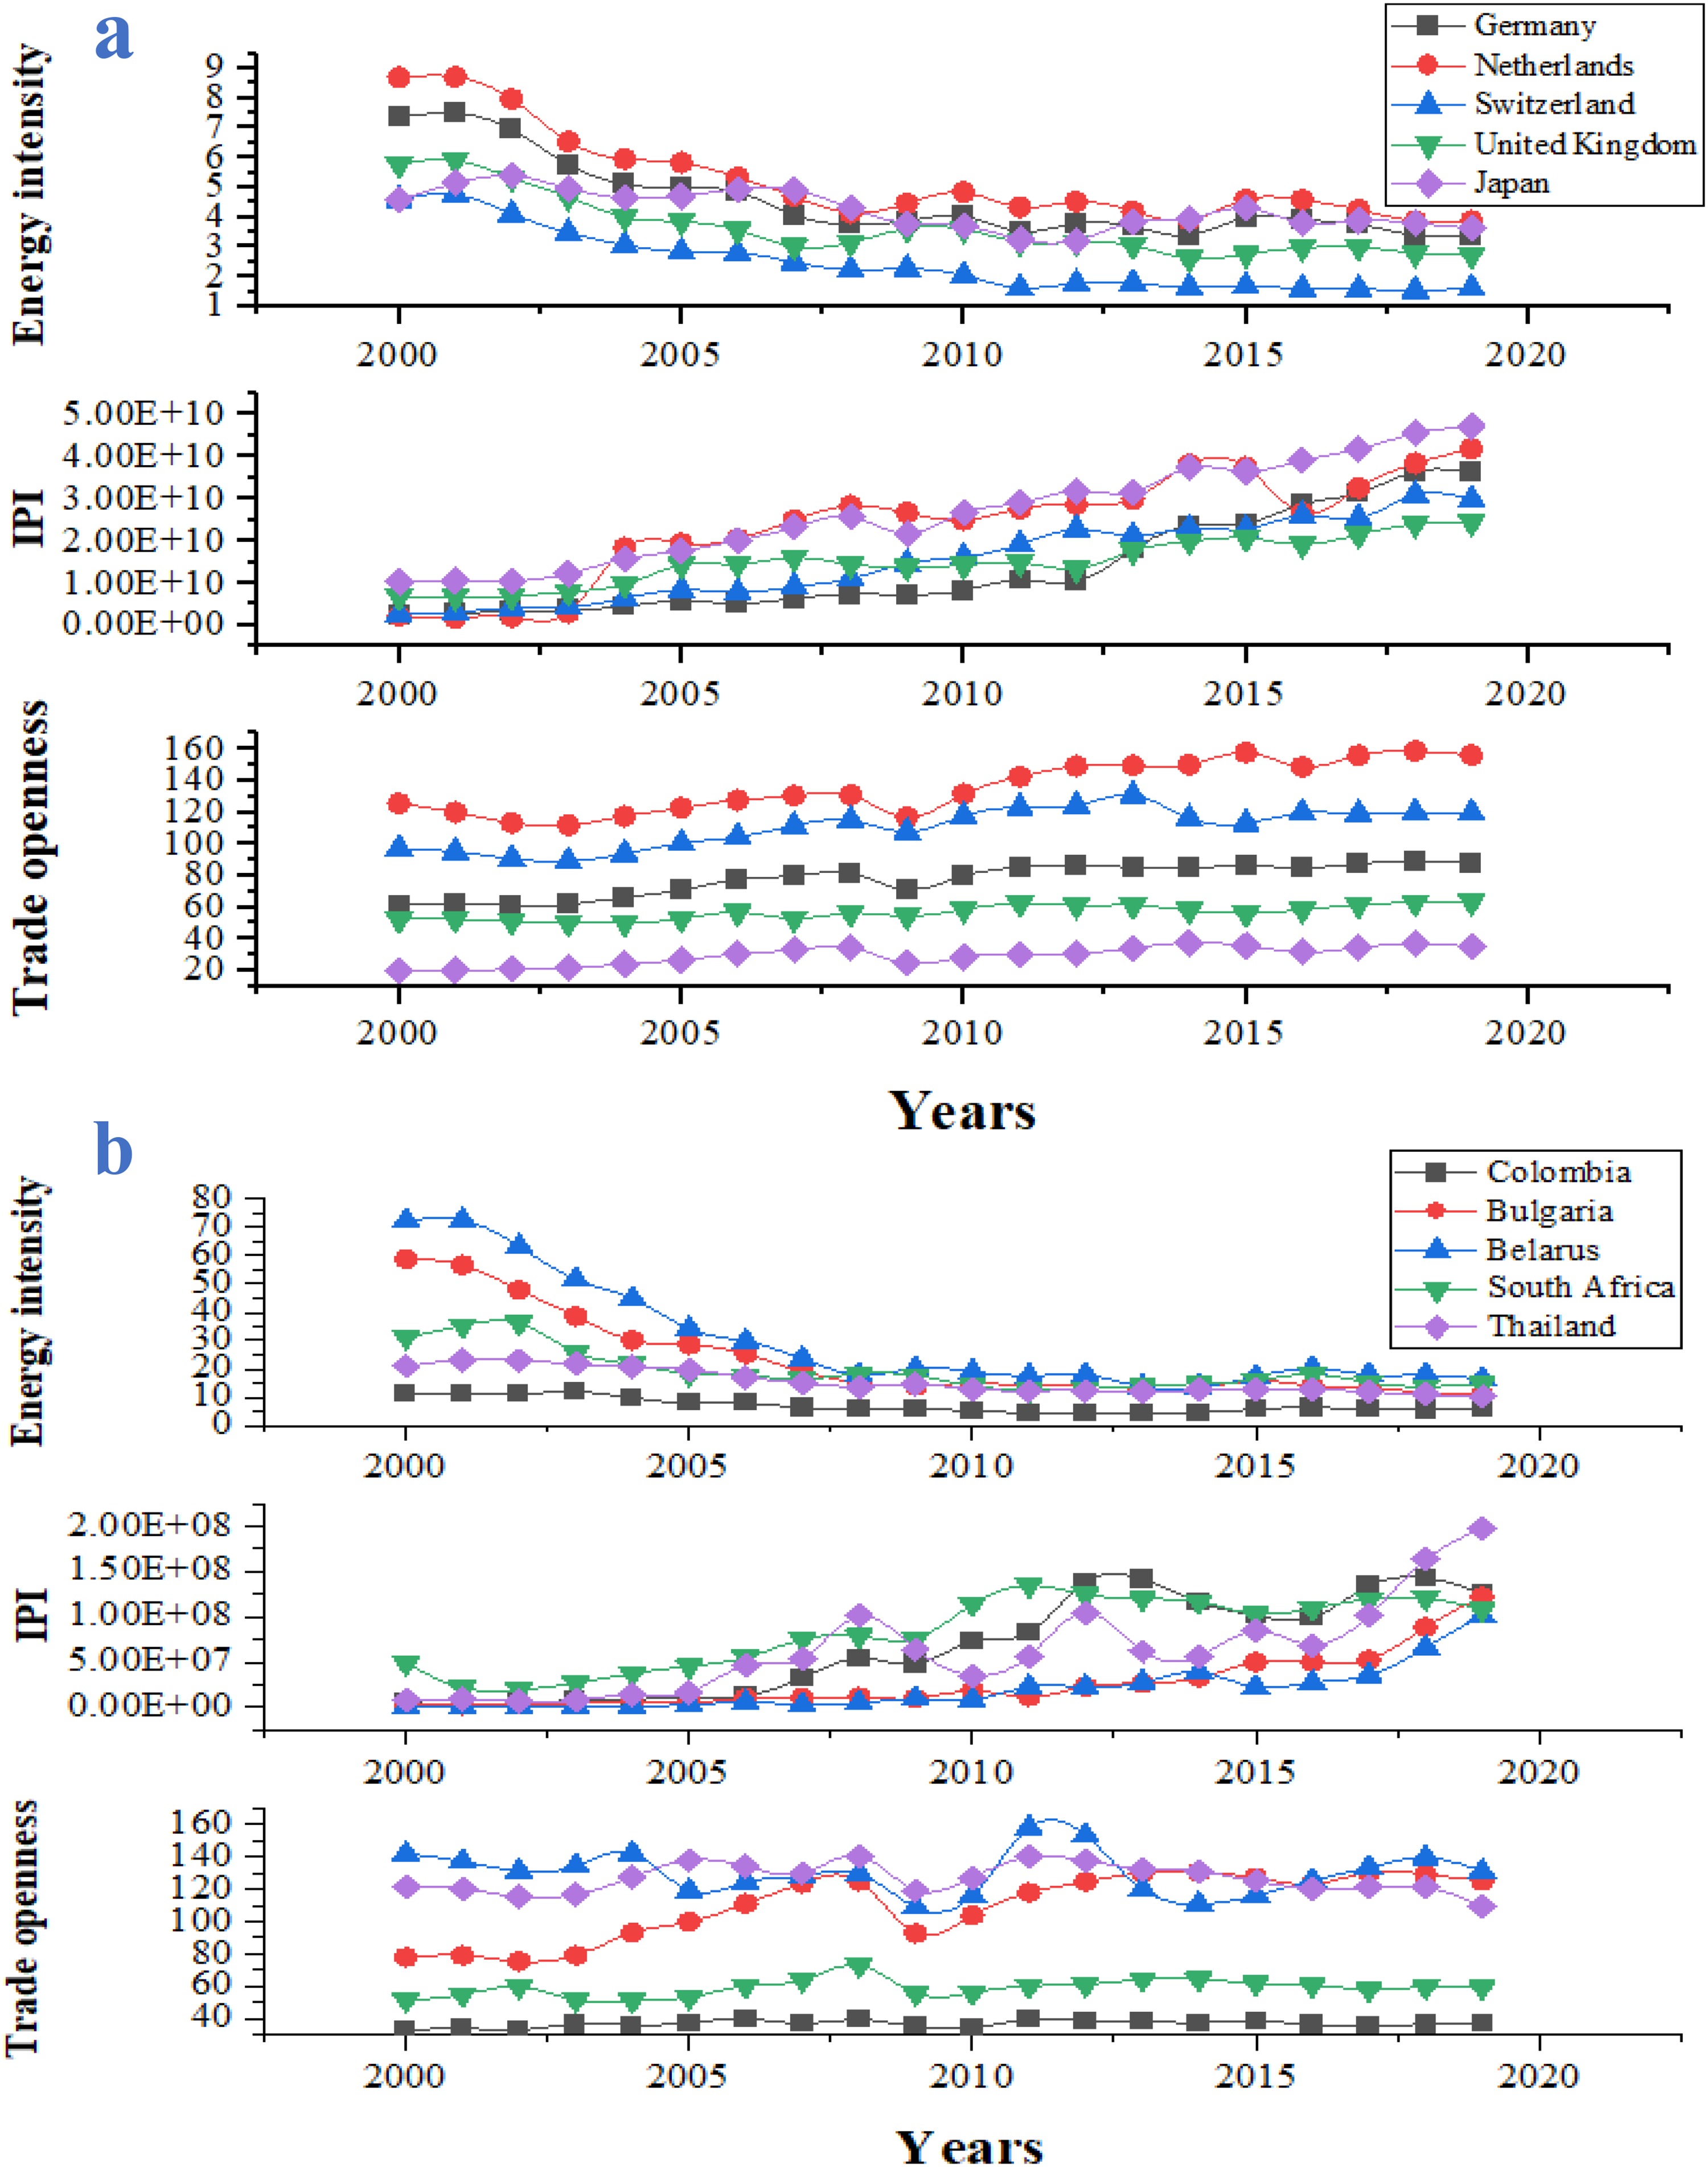
Energy intensity, intellectual property income, and trade openness from 2000 to 2019.
The classification of the different countries according to the income level.
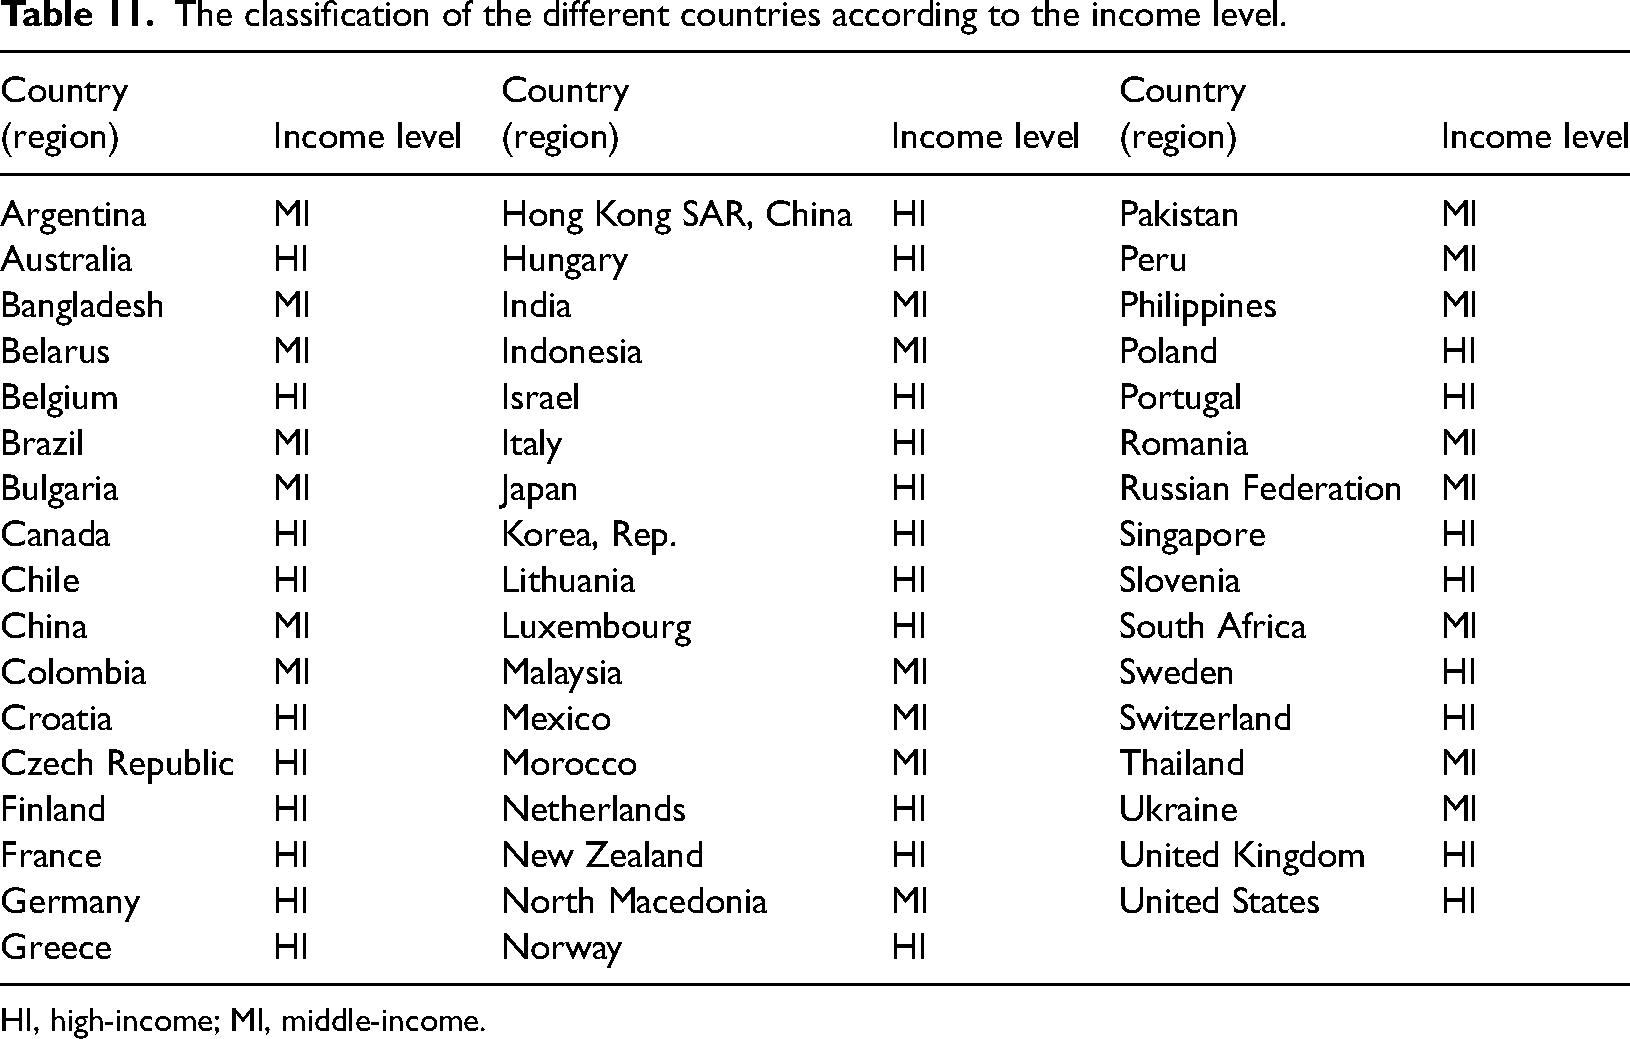
HI, high-income; MI, middle-income.
In the HI group, energy intensities in most countries ranged from 5 to 9 in 2000, gradually decreasing to approximately 2 to 4 in 2019. Trade openness exhibits an increasing trend, with a relatively stable increase rate. While in the MI group, the energy intensities of each country were usually high in 2000 and gradually showed a downward trend, which was reduced to [5,15] by 2019. The growth trend of trade openness is not as evident as that of HI countries, and some countries even demonstrate a slight downward trend.
In addition, the changes in intellectual property income can be seen at two different income levels. For example, in Figure 3(a), the intellectual property income in HI countries is generally higher than that of the MI countries, showing an obvious upward trend. In MI countries, as shown in Figure 3(b), the growth trend of intellectual property income is not as clear as in HI countries, and some countries fluctuate wildly, like Thailand. The technology transfer from HI countries to MI countries is mainly to obtain cheap production factors or prolong the life cycle of technology. MI countries are only the processing chain of global production (Zhang et al., 2017). The processing chains are maintained by obtaining standardized and mature technology and are basically unable to contact the transfer of high technology. Therefore, the intellectual property income of MI countries has not increased significantly.
Regression results for different income groups
There is a significant gap in intellectual property income among countries with different income levels. Therefore, the effects of intellectual property income across two income groups are discussed in this section. According to the mediation effect model, the empirical results of different income groups under the three equations are obtained in Tables 12 and 13. Comparative analysis of the factors behind energy intensity is essential to improving energy efficiency. Figure 4 denotes the effects of different variables for HI and MI groups. The influence of intellectual property income on energy intensity changes considerably compared with other variables’ effects. The specific analysis process of the mediation effect model is as follows.
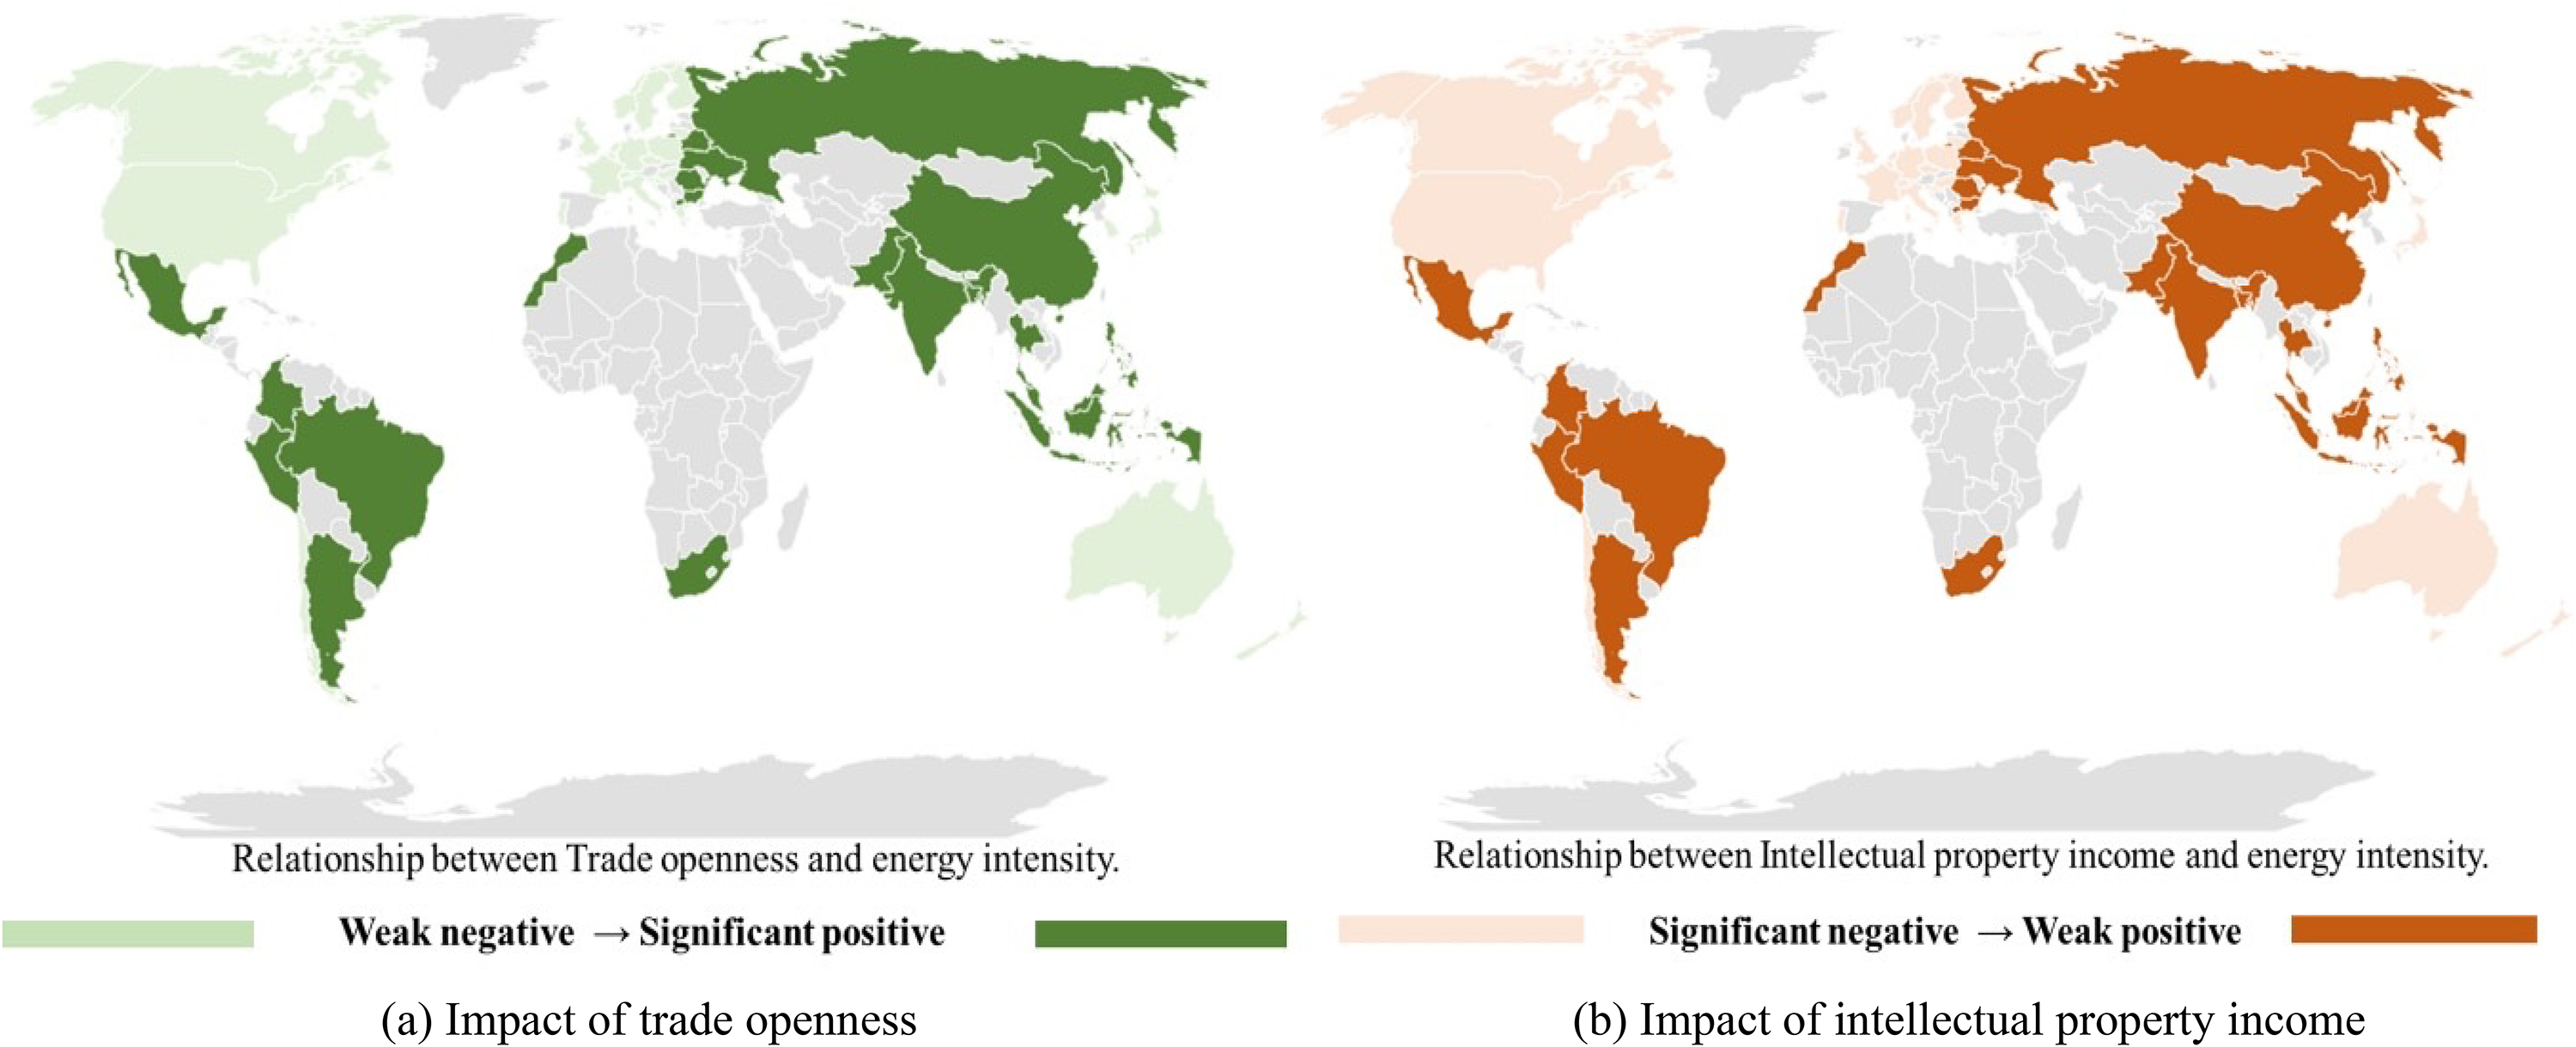
Spatial distribution of various factors affecting energy intensity.
Empirical results of HI level groups.

Notes: ***, **, and * indicate statistical significance at 1%, 5%, and 10% inspection levels, respectively. The values in parentheses represent t-statistics.
FMOLS, Fully Modified Ordinary Least Square; DOLS, Dynamic Ordinary Least Square; HI, high-income.
Empirical results of MI level groups.

Notes: ***, **, and * indicate statistical significance at 1%, 5%, and 10% inspection levels, respectively. The values in parentheses represent t-statistics.
FMOLS, Fully Modified Ordinary Least Square; DOLS, Dynamic Ordinary Least Square; MI, middle-income.
Model (1) denotes the impact of intellectual property income on energy intensity without the mediation effect of trade openness. The analysis results of FMOLS and DOLS are basically consistent. For example, the coefficient of intellectual property income is negatively linked to energy intensity for the HI countries. A 1% improvement in intellectual property income will decrease energy intensity by 0.044162% (FMOLS) or 0.033687% (DOLS). Yet the long-term relationship for the MI countries is not significant and even has a slight positive effect on energy intensity. Moreover, model 2 indicates that intellectual property income has different mediation influences on trade openness. For the HI countries, increasing intellectual property income by 1% leads to a 0.089619% (FMOLS) or 0.087164% (DOLS) rise in trade openness, but it is not significant in MI countries. Therefore, the mediation effect exists in HI countries but not in MI countries.
Furthermore, model 3 outcomes imply that the impacts of intellectual property income and trade openness have different effects on HI and MI income groups. A significant negative relevance exists for the HI countries between intellectual property income and energy intensity. While in the MI group, intellectual property income has no obvious negative effect and even a weak positive effect on energy intensity. Considering the influence of trade openness, negative effects are significant at 1% level just for the HI groups. However, the rise of trade openness will increase the energy intensity for MI countries, which is worthy of in-depth analysis.
The heterogeneous effects of intellectual property income on energy intensity suggest that intellectual property income improves the energy efficiency of HI countries, while reducing the energy intensity of MI countries. This result is consistent with the carbon transfer phenomenon due to technology transfer. 79 High energy-consuming industries have been turned into MI group, increasing the energy consumption of MI countries and polluting the local environment. 80 The conclusion is consistent with the views of, 81 confirming that the UN technology transfer mechanism established under UNFCCC may not accelerate international technology transfer in major aspects. This process has exacerbated the imbalance of world economic development, and the polarization has become more serious.
Conclusions and policy implications
Conclusions
Considering the mediation effect of the trade openness, this study investigates the detailed influence mechanism of intellectual property income on the energy intensity by employing the panel data for 50 countries covering the period 2000–2019. The main findings are summarized as follows:
Globally, intellectual property income can affect energy intensity with the mediation effect of trade openness. That is to say, intellectual property income can affect trade openness positively. Both intellectual property income and trade openness have a significant negative impact on energy intensity. The result is consistent with Adom
78
and Raiser.
79
It has been confirmed that the increase in import and export volume resulting from changes in trade structure leads to an increase in trade openness, which in turn reduces energy intensity.
78
In addition, patents are the core of intellectual property income. To reduce energy intensity worldwide, the transfer of patented technology is essential.
79
The results of the heterogeneous analysis indicate that the mediation effect of trade openness exists in the HI group, and intellectual property income increases trade openness significantly. But for the MI group, the mediation effect is not significant for DOLS analysis. The impacts of intellectual property income and trade openness on energy intensity are heterogeneous among different income groups. Trade openness only negatively affects energy intensity in the HI groups, which supports the findings of Samargandi.
31
Additionally, the increase in intellectual property income has a negative impact on the energy intensity in the HI group.
18
However, trade openness and intellectual property income will not significantly decrease energy intensity for the MI group.
Policy implications
To achieve the goal of reducing energy intensity in HI and MI countries, based on the above conclusions, some policy implications can be given as follows.
First, from the perspective of the global, intellectual property income and trade openness should be increased to reduce energy intensity. Intellectual property income indicates a nation's innovation capacity, which requires national support and investment, as well as intellectual property protection at the enterprise and individual levels. Investing in education and research, supporting start-ups, and providing tax incentives for companies investing in research and development are some ways to achieve this. 80 Additionally, while opening up trade is crucial, it is important to balance it with national economic security. To balance trade interests and national economic security, just as Ngouhouo et al. 81 say, countries may need to diversify their sources of basic resources, invest in domestic production of key commodities, or establish strategic partnerships with other countries to reduce dependence on a single trading partner.
Second, in the context of a large degree of trade openness, due to the lack of funds and the deterioration of trade, MI countries are sometimes in a very disadvantageous position in globalization. Some of them have become the primary producers of industrial and primary agricultural products, just as Pigka-Balanika 82 investigated, worsening the environment. These countries may depend too much on the benefits brought by lower production costs, which is consistent with the findings of Van Tran. 83 For example, some of the factories of large group companies are gradually shifting to Southeast Asian countries.84,85 In addition, as Berry et al. and Javorcik and Wei86,87 mentioned, weaker environmental standards in MI countries may also lead to increased pollution to some extent. Therefore, MI countries should not solely rely on technology transfer from HI countries, but rather work toward improving their regulatory systems.
Third, the intellectual property income is mainly brought by technology transfer, which involves sharing knowledge, skills, and technology between countries or organizations. However, the expected effect of HI countries to reduce the energy intensity of MI countries through technology transfer is not as good as previously expected, which may be due to restrictions on the transfer and use of certain technologies for national security reasons. Technology transfer is a complex process that requires consideration of several factors, including the protection and enforceability of intellectual property. As demonstrated by Gürkaynak et al. 88 and Hao et al., 7 when technology is transferred from HI countries to MI countries, MI countries should recognize and protect the intellectual property and may need to ensure that the intellectual property contract can be successfully implemented to a certain extent. In addition, factors such as the level of mutual trust between HI and MI countries, their respective legal systems, and transparency are likely to affect the benefits of energy intensity from technology transfer. Therefore, promoting technology transfer necessitates efforts at both policy and practical levels, as well as the cooperation and support from the international community.
As a relatively new topic, intellectual property income can be studied for its impact on climate change in subsequent research. In addition, considering the influence of nonlinear factors, we can verify whether the evolution of trade openness to energy intensity will affect the threshold effect brought by intellectual property.
Footnotes
Acknowledgments
The authors would like to thank the editor and these anonymous reviewers for their helpful and constructive comments that greatly contributed to improving the final version of the manuscript.
Declaration of conflicting interests
The authors declared no potential conflicts of interest with respect to the research, authorship, and/or publication of this article.
Funding
The authors disclosed receipt of the following financial support for the research, authorship, and/or publication of this article: This work was supported by the National Natural Science Foundation of China (grant number 72104246).
