
Abstract
Global agreements have emerged in order to achieve carbon neutrality as the needs for renewable energy sources and carbon reduction continue to grow. To achieve the global carbon neutrality goals, China, one of the largest carbon emitters, must improve urban energy efficiency. Using a three-stage slacks-based measure (SBM) technique, this study analyses the total factor energy efficiency of 270 prefecture-level cities from 2011 through 2020. It tries to monitor and evaluate energy efficiency without taking into account variations in the outside environment. China's total factor energy efficiency shows an overall rising trend, despite significant regional variations. Improved energy efficiency levels can be attributed to technical advancements, while limitations in technology contribute to lower energy efficiency in certain areas. The study highlights the importance of considering external environmental factors in evaluating energy efficiency, able to avoid an overestimation of China's overall energy efficiency. It is noteworthy that the eastern region consistently outperforms the national average in terms of energy use efficiency. Even after taking environmental factors out of the equation, the central, west, and northeast regions still have worse energy efficiency and slower rates of growth. On this basis, from strengthening energy management and planning; facilitating cross-regional sharing of expertise; take targeted policy measures to adapt to the characteristics of the western and northeastern regions and put forward policy suggestions. These guidelines contribute to international energy cooperation and carbon reduction initiatives, while promoting sustainable energy development in China.
Keywords
Introduction
Climate change has had unprecedented impacts worldwide, posing threats to food production and increasing the risk of catastrophic floods due to rising sea levels. With population growth, economic development, and improving living standards, greenhouse gas concentrations have been steadily increasing, leading to a rise in global average temperatures. According to the IPCC's Sixth Assessment Report, human activities are already to blame for a number of catastrophic meteorological and climatic events that have occurred throughout the planet. Burning fossil fuels is the primary contributor to carbon dioxide (CO2) emissions, which constitutes two-thirds of all greenhouse gases in the atmosphere. To significantly reduce greenhouse gas emissions, it is imperative to give priority to energy efficiency improvements and make the switch to low-emission energy sources. Global development must cope with a rise in energy consumption and the shift to a low-carbon economy in addition to dealing with economic globalization and climate change on a global scale.
Energy use and carbon emissions are both rising at previously unheard-of rates. The global energy consumption increased by 178.82% between 1971 and 2021, following a pattern of growth. Increasing from 4.72% of the world's energy in 1971 to 26.49% now. The urgency of mitigating climate change is underscored by the fact that, as of 2022, fossil fuel combustion constitutes approximately 67% of global greenhouse gas emissions, demanding a transformative shift towards renewable energy to achieve substantial reductions. Comparatively, the environmental benefits of renewable energy are evident. According to the World Health Organization (WHO), air pollution from burning fossil fuels causes 7 million premature deaths annually. A transition to renewable energy significantly reduces these health risks, making it a critical component for environmental health. Renewable energy deployment is a collaborative effort. The United Nations Framework Convention on Climate Change (UNFCCC) reports that international collaboration on renewable energy projects has increased by 40% since 2015, showcasing a shared commitment to addressing climate change globally. Investments in renewable energy research and development have shown a promising trajectory. The International Renewable Energy Agency (IRENA) reports that global investment in renewable energy reached USD 303.5 billion in 2021, demonstrating a 2% increase despite the challenges posed by the COVID-19 (coronavirus disease 2019) pandemic. Investments in renewable energy are not only environmentally beneficial but also economically lucrative. According to a report by the Renewable Energy Policy Network for the twenty-first Century (REN21), the renewable energy sector employed over 12 million people globally in 2021, signifying a 5% increase from the previous year. The International Energy Agency (IEA) estimates that improving the efficiency of renewable energy technologies can lead to a 12% reduction in global carbon emissions by 2050, a critical milestone in aligning with climate targets outlined in the Paris Agreement. As the world grapples with the imperative to transition towards sustainable energy practices, understanding how the judicious consumption of renewable energy contributes to overall energy efficiency becomes increasingly vital.
China produced 4.33 billion tons of standard coal, or 6.2% more primary energy, in 2021, according to the China Mineral Resources Report 2022. According to their overall production, the energy sources were ordered as follows: coal (67%), oil (6.6%), natural gas (6.1%), and non-fossil energy sources (20.3%), which include solar, wind, nuclear, and hydropower. When compared to the world energy consumption, which increased by 5.2% to 5.24 billion tons of standard coal, China attained an energy self-sufficiency rate of 82.6%. According to China's National Bureau of Statistics, total standard coal consumption would increase by 2.9% in 2022, reaching 5.41 billion tons. Despite the use of environmentally friendly energy sources including nuclear, hydro, wind, and natural gas, overall energy consumption in the nation increased by 56.2% compared to the previous year, mostly because coal usage slightly increased by 0.3 percentage points. Utilization of electricity went up 3.6%. This suggests that coal will remain the primary energy source for China for a very long time given the fact that coal still makes up the majority of the country's energy consumption structure. China is one of the major producers of greenhouse gases, one of the countries most negatively impacted by climate change, and a powerhouse in terms of energy consumption. China's primary focus currently is to promote energy conservation, reduce emissions, and expedite the progress of energy efficiency. As environmental deterioration and growing inconsistencies between resource availability and demand appear, the only way the country can sustainably boost economic growth is by taking into account all environmental and resource-related aspects and steadily improving Green Total Factor Energy Efficiency (GTFEE). 1
Renewable energy sources typically have lower environmental impacts compared to fossil fuels. Addressing air and water pollution associated with fossil fuel combustion, the adoption of renewable energy contributes to a more sustainable and healthier ecosystem. China set a target in 2020 to become carbon neutral by 2060 and meet its peak CO2 emissions by 2030. These objectives have been integrated into international agreements focusing on green and sustainable development. This is the biggest new industrial upheaval since the Industrial Revolution, offering crucial assurance for preserving national political, economic, and military progress. Thus, China's continued adaptation to global currents and trends is crucial. 2 In the pursuit of China's dual carbon objectives, this study delves into the GTFEE of Chinese cities, with a focus on enhancing total energy efficiency, particularly in terms of final energy input. This work contributes innovatively to the existing literature in several key aspects. Firstly, recognizing cities as significant contributors to energy consumption and comprehensive geographical units, this study employs a three-stage, multi-stage Data Envelopment Analysis (DEA) methodology known as the SBM (slacks-based measure) model. This novel method enables a more thorough examination of energy effectiveness in urban settings, eliminating random environmental influences and accounting for spatial interdependence between cities. Secondly, evaluating energy efficiency at the municipal level provides a better understanding of the distribution of energy use and its influencing elements. This improved evaluation method helps impartially assess energy efficiency in different regions, particularly those with environmental disadvantages. By accurately identifying the reasons for low energy efficiency, governments and relevant departments can implement targeted policies and measures to promote improvement. This approach also facilitates knowledge sharing and exchange among cities, collectively advancing sustainable energy development. Thirdly, this study selects a series of economic, social and environmental related influencing factors, focusing on the symbiotic relationship between economic production goals and environmental protection. By improving GTFEE, China can navigate the challenges of economic growth while contributing to a cleaner and ecologically friendly environment. Ultimately contributing to a more comprehensive understanding of the intricate relationship between energy efficiency, economic goals, and environmental preservation in the context of China's dual carbon objectives.
Improving total energy efficiency, particularly in terms of final energy input, is a viable strategy to minimize greenhouse gas emissions while still achieving economic production goals. This strategy would minimize China's vulnerability to the consequences of climate change. Given the challenges of both economic growth and environmental preservation, enhancing GTFEE is essential for the nation's sustainable development. The model's structure is displayed in Figure 1.
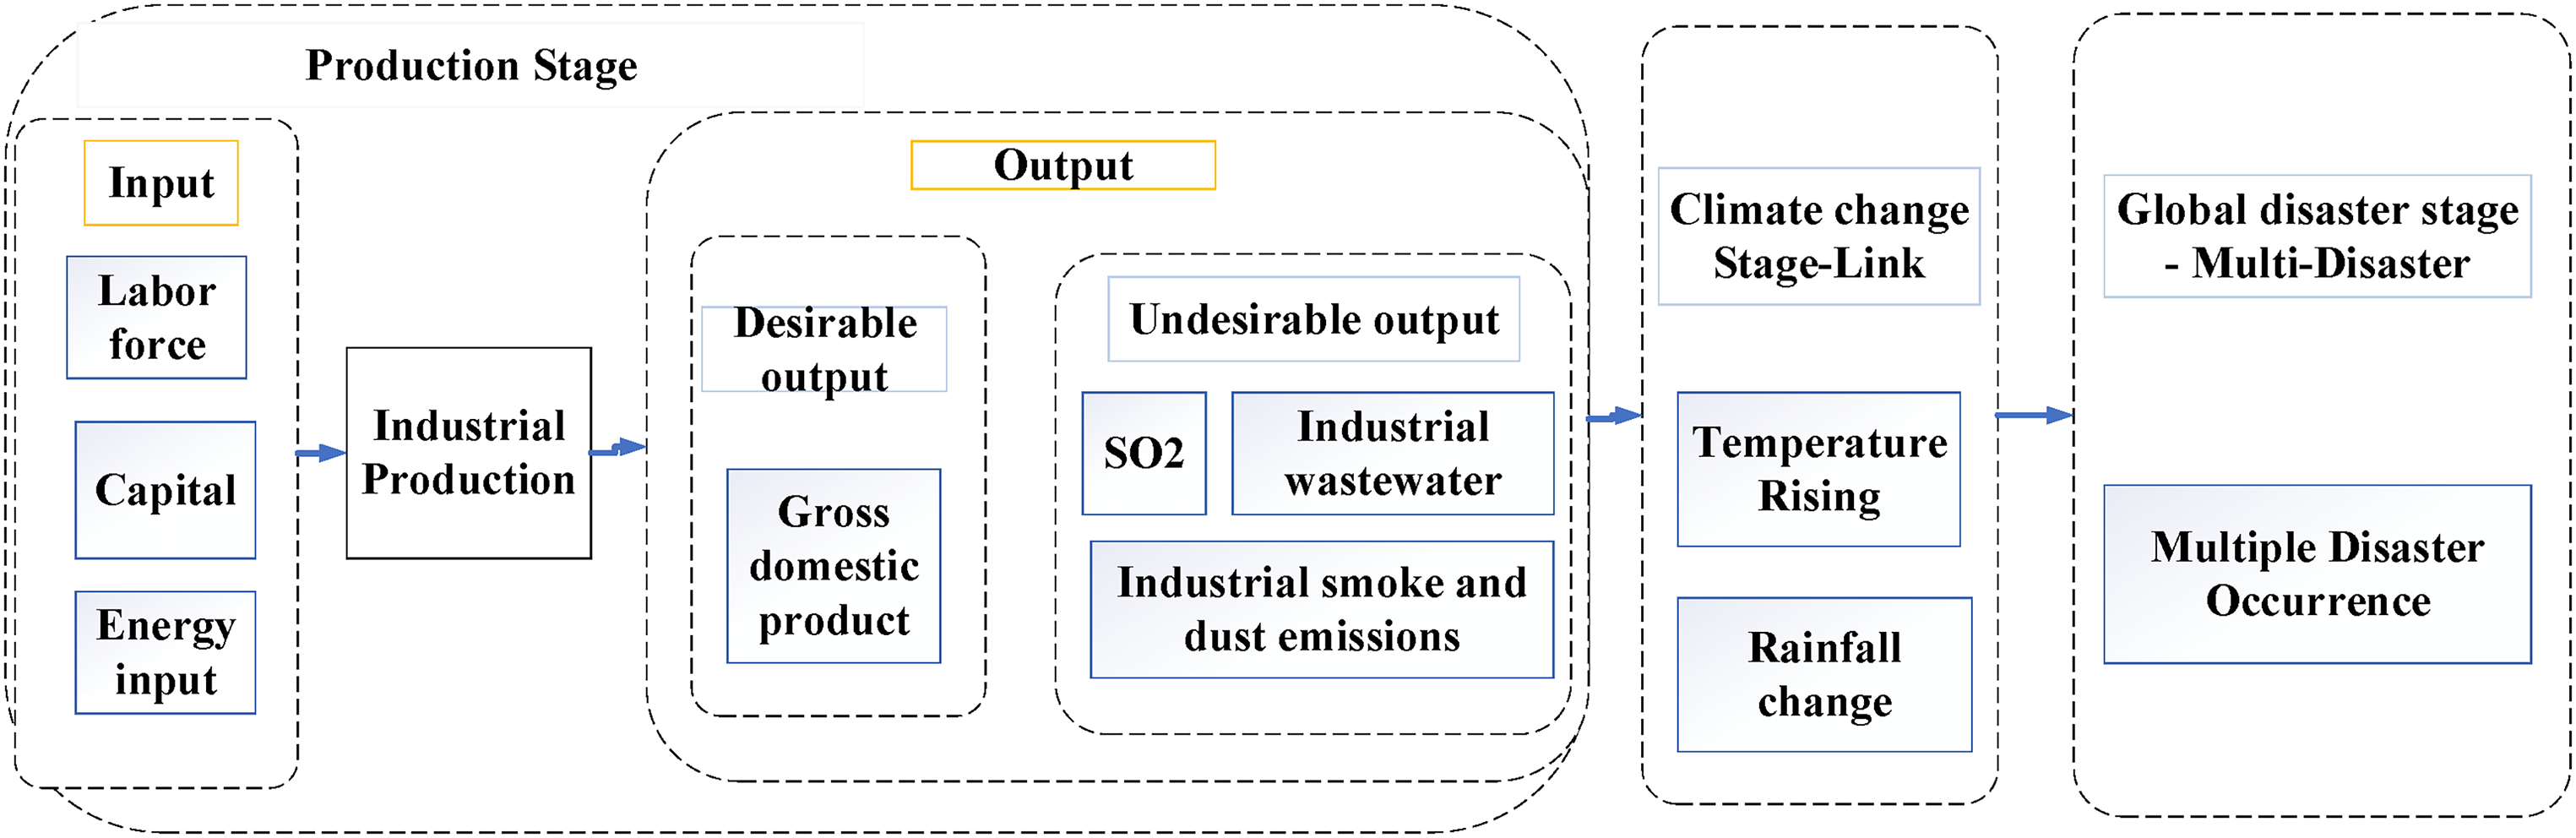
Framework of the parallel three-stage super efficiency SBM model.
The phase after that is the literature review, the factors, methods, and data sources utilized are all described in the third section of the study. The fourth and fifth sections, serving as the concluding part of the paper, present the empirical findings along with corresponding recommendations and implications.
Literature review
Numerous academic studies have investigated the subject of energy efficiency, producing a wealth of information. The primary areas of energy efficiency research include energy efficiency measurement, model improvement, and influencing variables.
Energy efficiency study
Although energy efficiency is frequently mentioned by researchers and policymakers, it is challenging to define or even conceptualize it. 3 The increase in energy efficiency reflects the positive correlation between productivity optimization and environmental protection. 4 For many nations and areas, improving energy efficiency has become a crucial energy policy goal, particularly in the context of limited energy resources and the need to address climate change and achieve sustainable economic growth. 5 This focus on energy efficiency aligns with the long-term needs of developing nations and reflects the recognition of the importance of optimizing energy use and reducing environmental impacts. 6 Energy efficiency research is thus given top attention in environmental economics. Green energy efficiency metrics play a crucial role in assessing the relationship between input factors, environmental performance, and social welfare, by comparing the environmental and economic performance to determine efficiency levels that align with societal objectives.
Single-factor energy efficiency and total-factor energy efficiency (TFEE) are two ways to evaluate energy efficiency. 7 While the single-factor approach commonly uses carbon intensity and energy intensity indicators to evaluate energy efficiency and emission performance, 8 it may oversimplify the evaluation by considering only one input element and ignoring other important inputs such as capital and labor. 9 To overcome these limitations, Chen et al. 10 introduced the concept of TFEE, which integrates multiple inputs and outputs for a more comprehensive assessment of energy efficiency. This approach, focusing on total-factor manufacturing, has gained acceptance in academic research. 11
Total-factor analyses of energy efficiency take into account the price of energy efficiency as well as how the environment and social development interact. Yu et al. 12 defined energy efficiency as the disparity between actual emissions on the production frontier and the theoretical ideal value. Recent environmental and ecological degradation brought on by fast economic expansion has prompted some academics to take environmental pollutants into account when calculating total-factor energy efficiency. According to Ref., 13 green total-factor energy efficiency (GTFEE) is a significant metric in input–output analysis that accounts for both energy consumption and pollutant emissions. By taking into account the restrictions placed by environmental circumstances on economic growth, it differs from conventional total-factor energy efficiency (TFEE), serving as a complete way to evaluate input variables and environmental advantages. 14 Current research output is often assessed by gross domestic product (GDP) and focuses on the total energy efficiency of regions or industries. Mohd A et al. 15 discovered that the average environmental energy efficiency of industrialized nations was better than that of developing countries. Instead of an upward trend, Ming Meng et al. 16 discovered a steady decline in China's green energy efficiency. Provinces with less efficient use of green energy tended to be concentrated in areas with an abundance of energy resources. Given the variations in resource availability and economic growth among Chinese cities, further study is needed to better understand the factors underlying green total-factor energy efficiency throughout the country's cities.
Energy efficiency measurement model
Energy efficiency analysis employs diverse methods and indicators that are tailored to the specific conditions of different regions and sectors. 17 Patterson 6 highlighted the importance of accurately defining outputs and energy consumption when evaluating and measuring energy efficiency. Several relevant studies have established multi-level evaluation indicator systems for measuring energy efficiency, such as comprehensive evaluation methods, entropy methods, or the TOPSIS method (which uses a number of representative indicators), and for ordering preferences according to how closely they resemble the ideal solution. The selection of indicators, however, may impact the outcomes of the review due to the subjectivity involved in the process. Thus, SFA and DEA are now the methods that are used the most often. 18
The DEA technique is a reliable way to gauge how successful individual decision-making units (DMUs) are in comparison to one another. DEA offers benefits such as scale invariance, objective determination of weights, and compatibility with numerous inputs and outputs. 19 The benefit of the DEA methodology over the SFA methodology is that it considers a range of inputs and outputs simultaneously without needing any specification of a basic functional form. 20
Since all outputs are presumed to be good, the traditional DEA technique does not immediately take into consideration undesired outputs like pollution emissions. Chung et al. 21 added the directional distance function (DDF) as an expansion to the DEA analysis to solve this drawback. The DDF enables the evaluation of efficiency to take into account both desired and unwanted results. It is now feasible to evaluate both the production of desired outputs and the reduction of undesirable outputs by including the DDF as a component in the productivity index. However, they overlook the influence of slack variables on the actual efficiency results, leading to inflated energy efficiency values. Tone 22 suggested the slack-based measure (SBM) as a remedy for the shortcomings of conventional efficiency analysis methods. This model takes into account both radial and angular views, which helps to minimize computational biases and produce more accurate results. SBM does have a restriction, though, in that it is unable to distinguish and rank DMUs with efficiency values greater than 1. Tone 23 presented an innovation termed Super-SBM to get around this restriction. Super-SBM provides a supplementary assessment of effective DMUs using DEA and adds unexpected outputs into efficiency measurement. This enhancement allows for a more comprehensive and refined evaluation of efficiency. By incorporating unexpected outputs and conducting a secondary evaluation, Super-SBM enables the differentiation of efficiency values and assessment of true efficiency levels. The efficiency of DMUs with complex input–output indicators has been successfully evaluated in a number of areas in recent years using the Super-SBM technique. 24
The Malmquist productivity index is commonly used in spatiotemporal analysis to assess dynamic changes in productivity. The Malmquist–Luenberger (ML) index, which takes into account changes in both desired and unwanted outputs, was presented by Chung et al.. 21 This index is commonly used to assess improvements in total-factor energy efficiency when there are restrictions on carbon emissions. However, the ML index has some drawbacks, such as its non-transitive character, limited ability to provide solutions to linear programming equations, potential hindrance to technological advancement, and tendency to distort findings. To overcome these limitations, Oh 25 combined the ML index with the global DDF to create the Global Malmquist Luenberger (GML) index. The GML index provides better consistency in tracking the evolution of total-factor efficiency and makes it possible to compare total-factor efficiency across time, leading to calculations with more trustworthy outcomes. This work undertakes spatiotemporal analysis of green total-factor energy efficiency indicators across time and space using the GML index model. This approach allows for a comprehensive assessment of efficiency and facilitates meaningful comparisons over time and across geographical areas.
Factors affecting energy efficiency
Some studies mainly analyze various influencing factors related to energy efficiency. Numerous studies have examined how economic variables, such as urbanization, 26 technical advancement, 27 and economic expansion, affect energy efficiency and openness to foreign investment, 28 as well as industrial structural adjustments. 29 Alsaleh et al. 30 revealed significant impacts of capital input, labor input, GDP, inflation, and interest rates on the technological efficiency of the bioenergy industry in both developing and developed countries within the EU28. Huang and Chen 31 conducted a study at the provincial level and found a significant impact of domestic research and development (R&D) activities on energy efficiency. In their study of the driving forces underlying increases in energy efficiency, Cao et al. 32 discovered a U-shaped association between the factors influencing improvements in energy efficiency, although only high-efficiency cities, the Wuhan city cluster, and the Poyang Lake city cluster showed this trend. Ren et al. 33 outward foreign direct investment (OFDI) can boost China's inter-provincial green total-factor energy efficiency by enhancing industrial structure, lowering capital misallocation, and promoting technical innovation. Cui et al. 34 found that both the statutory environmental law and the market-based environmental law have threshold effects on the energy eco-efficiency of China's mining cities and energy cities. Xue et al. 35 argued that due to the impact of digital economy on industrial structure, economic development and energy efficiency, the emergence of digital economy has a significant impact on energy consumption. According to the research of Liu et al., 36 industrial agglomeration in eastern, central and western China has improved energy efficiency to a certain level. These studies analyze the impact of certain socioeconomic and environmental factors on green energy performance in different geographic locations, but do not assess the extent of green energy efficiency, identify barriers to efficiency gains, or make specific policy recommendations.
Additionally, regional heterogeneity and spatial correlation significantly influence regional environmental quality. Zhao et al. 37 claim that the link between environmental legislation focusing on energy efficiency and green economic growth has a U-shaped nonlinear pattern and is impacted by both regional spillover effects and spatial feedback effects. Xie et al. 38 highlighted the complexity of the interplay between technological advancement, energy intensity, and their influence on carbon emission efficiency. These studies underscore the importance of considering various factors and their spatial dynamics when assessing the effectiveness of environmental regulations and energy-related policies in achieving sustainable and efficient energy systems. Second, there have been studies on the relationship between urban development and energy efficiency, that focus on how green energy is used in certain Chinese industrial sectors. 39 Zhang et al. 40 examined how well the electricity and transportation sectors utilize green energy. However, China is presently pursuing a green growth strategy across a number of industries. Meanwhile, the increase in population size and the consequent consumption effects make cities a major source of unexpectedly high carbon emissions, even surpassing the industrial sector. 41 Shao et al. 42 discovered that resource-dependent cities experience energy rebound effects due to technological progress. Spatial econometric modeling is a common approach in analyzing the influencing factors of CO 2 emissions and energy efficiency. By incorporating spatial aspects into the study, it provides a more comprehensive understanding of the interdependence and spatial interactions of different locations, helping to improve the assessment of variables affecting CO 2 emissions and energy efficiency. 43
The current body of literature highlights substantial deficiencies in comprehension. First, existing studies predominantly concentrate on measuring energy efficiency alone. Whether improving the efficiency of total factor green energy can promote economic and ecological growth at the same time is an important factor of sustainable development, but it is often neglected in the literature. To support sustainable growth, there is a need for further investigation into urban green total-factor energy efficiency and its evolving trends. Second, previous studies have mostly concentrated on the effects of certain elements on energy efficiency without doing a comprehensive examination of the urban Economy-Environment-Society system. The impact of government policies, economic expansion, energy sector transformation, and technological progress on green urban green total-factor energy efficiency requires further discussion.
Third, in recent years, the exploration of green total-factor energy efficiency in urban development has become a focal point of academic discourse, reflecting the sustainable urbanization trend. The energy efficiency of one city can have significant geographical spillover effects on neighboring cities, altering factor flows and influencing nearby cities’ growth patterns. Economic and environmental spillovers are considered key factors in understanding a city's green total-factor energy efficiency.44,45 Smith et al.'s 46 study highlights the intricate link between a city's energy efficiency measures and their impact on surrounding areas’ development patterns. It emphasizes that improving urban green total-factor energy efficiency can enhance a city's economic and environmental performance while also providing it with a competitive edge. Therefore, studying the promoting factors of green total-factor energy efficiency in urban environmental development and its impact on surrounding cities is worthwhile.
This study addresses critical gaps in the current literature on renewable energy efficiency in urban contexts. Firstly, it introduces a novel three-stage super-efficiency SBM model, setting a new standard for evaluating green total-factor energy efficiency across 283 Chinese cities from 2010 to 2020.The spatial econometric model was combined to compare the regional differences and deeply analyze the different green total-factor energy efficiency of different regions. Secondly, the incorporation of unexpected outputs in the computation of the ML productivity index enables an investigation into temporal variations in green total-factor energy efficiency. This temporal dimension is crucial for understanding how efficiency measures evolve over the decade under consideration, providing valuable insights into the dynamic nature of energy efficiency in urban settings. Lastly, by bridging the gap between academic research and actionable policy insights, the study not only identifies areas for improvement but also provides tangible steps towards achieving a more energy-efficient urban environment, with important implications for increasing awareness of urban renewable energy efficiency.
Methods, variables, and data sources
Three-stage SBM model
To precisely quantify efficiency, the DEA method, first presented by Charnes et al. in 1978, has been extensively used. Different from other efficiency analysis methodologies, DEA is especially helpful when examining DMUs with numerous similar units. The original DEA model, created in 1984 by Charnes and Cooper, has been used extensively to evaluate the effectiveness of various DMUs. The accuracy of efficiency calculations when there is changing slackness is impacted by the traditional DEA model's restriction to proportionate changes in inputs and outputs. Tone suggested the SBM-DEA model, which can accommodate fluctuating slackness, as a solution to this problem.
Tone initially introduced the super efficiency SBM (Super-SBM) model to evaluate multiple efficient DMUs. However, this model does not account for unpredictable elements that influence DMU effectiveness, such as the outside environment and arbitrary disruptions. To get around this drawback, Fried et al. 47 created the Three-Stage DEA model, which successfully takes out the effects of random mistakes and outside factors and gives a more realistic representation of actual efficiency. Traditional DEA methodologies are no longer suitable for accurate assessment due to the special characteristics of evaluating GTFEE, which include a dynamic market context, imperfect value information, and large random errors. To solve this problem, this study improves the Three-Stage DEA model by including the super-efficiency SBM model for a more thorough examination of efficiency. By successfully eliminating the impact of random and environmental elements, this method can generate more precise measurement results.
First stage: input-oriented super efficiency SBM
Tone introduced the SBM model, which considers both input and output slack variables simultaneously, improving the comprehensive assessment of efficiency. 22 The SBM model, however, is unable to deal with unwanted results. Dyckhoff and Allen 48 used unwanted outputs as inputs to evaluate ecological efficiency, but this method may lead to lower efficiency results. To address this issue, Tone created the unwanted SBM (USBM) model, which incorporates undesirable outputs into the traditional SBM model. 49 The super-efficiency SBM model is capable of efficiently distinguishing DMUs situated on the same data envelopment production frontier by building on Tone's USBM model, which enhances the SBM model by including unsatisfactory outputs. It establishes the initial efficiency values and input slack values of each DMU based on input and output data.
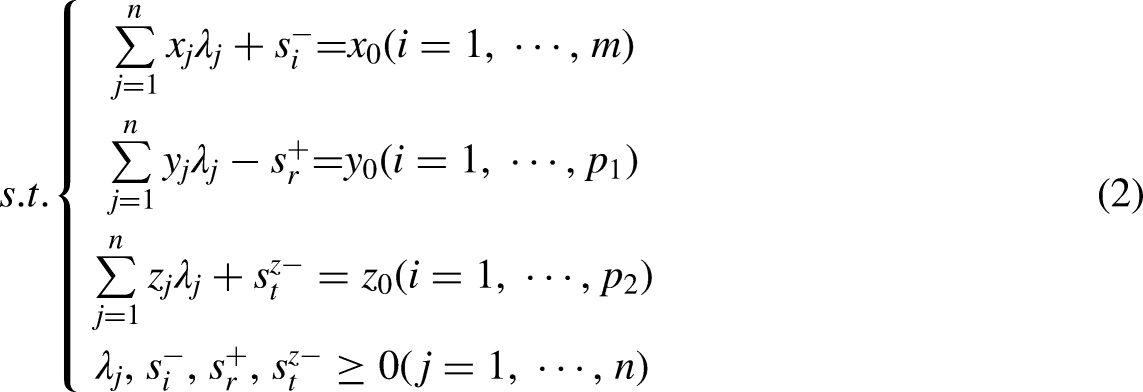
The SBM-DEA model is built in the first step to include unwanted outcomes. Identifying the initial efficiency values, input slack variables, anticipated output slack variables, and undesirable output slack variables are the objectives of this step. By considering undesirable outputs, the model provides a more comprehensive assessment of efficiency. The specific formulation of the model includes mathematical equations and constraints that are solved to obtain these values. The model is formulated as follows:

The following criteria are used to assess the model's efficacy. The assessed DMU is ineffective if
Second stage: adjust the input SFA model
Ecological efficiency values initial stage cannot distinguish between the effects of external causes, arbitrary mistakes, and internal management issues. The SFA (stochastic Frontier analysis) regression model, which is applied in the second stage, was developed by Fried et al. in 2002. It is employed to remove disturbances caused by external environment and random errors, thereby obtaining input slack variables solely attributed to management inefficiency. In order to reduce the impact of outside influences and random noise, the SFA model, represented by the equation, is built, isolating the input slack variables that are entirely linked to management inefficiencies. This allows for a more accurate assessment of management performance and the identification of areas for improvement.

Based on the optimal DMU and its input, each DMU is adjusted according to:


Third stage: input-oriented super efficiency SBM model
The adjusted input values are separated from the random environmental and environmental factors in the third stage, which also removes the influence of external sources. The efficiency figures for each DMU are computed using the real output data and the highly efficient SBM-DEA model. As a result, a more accurate depiction of the internal management and input levels of each DMU may be obtained by determining the genuine efficiency values. By leveraging updated inputs and original output data, the super-efficiency SBM model assesses efficiency values that closely match the real management level of the DMUs. With the help of this model, efficiency levels may be evaluated more precisely.
Variables and data sources
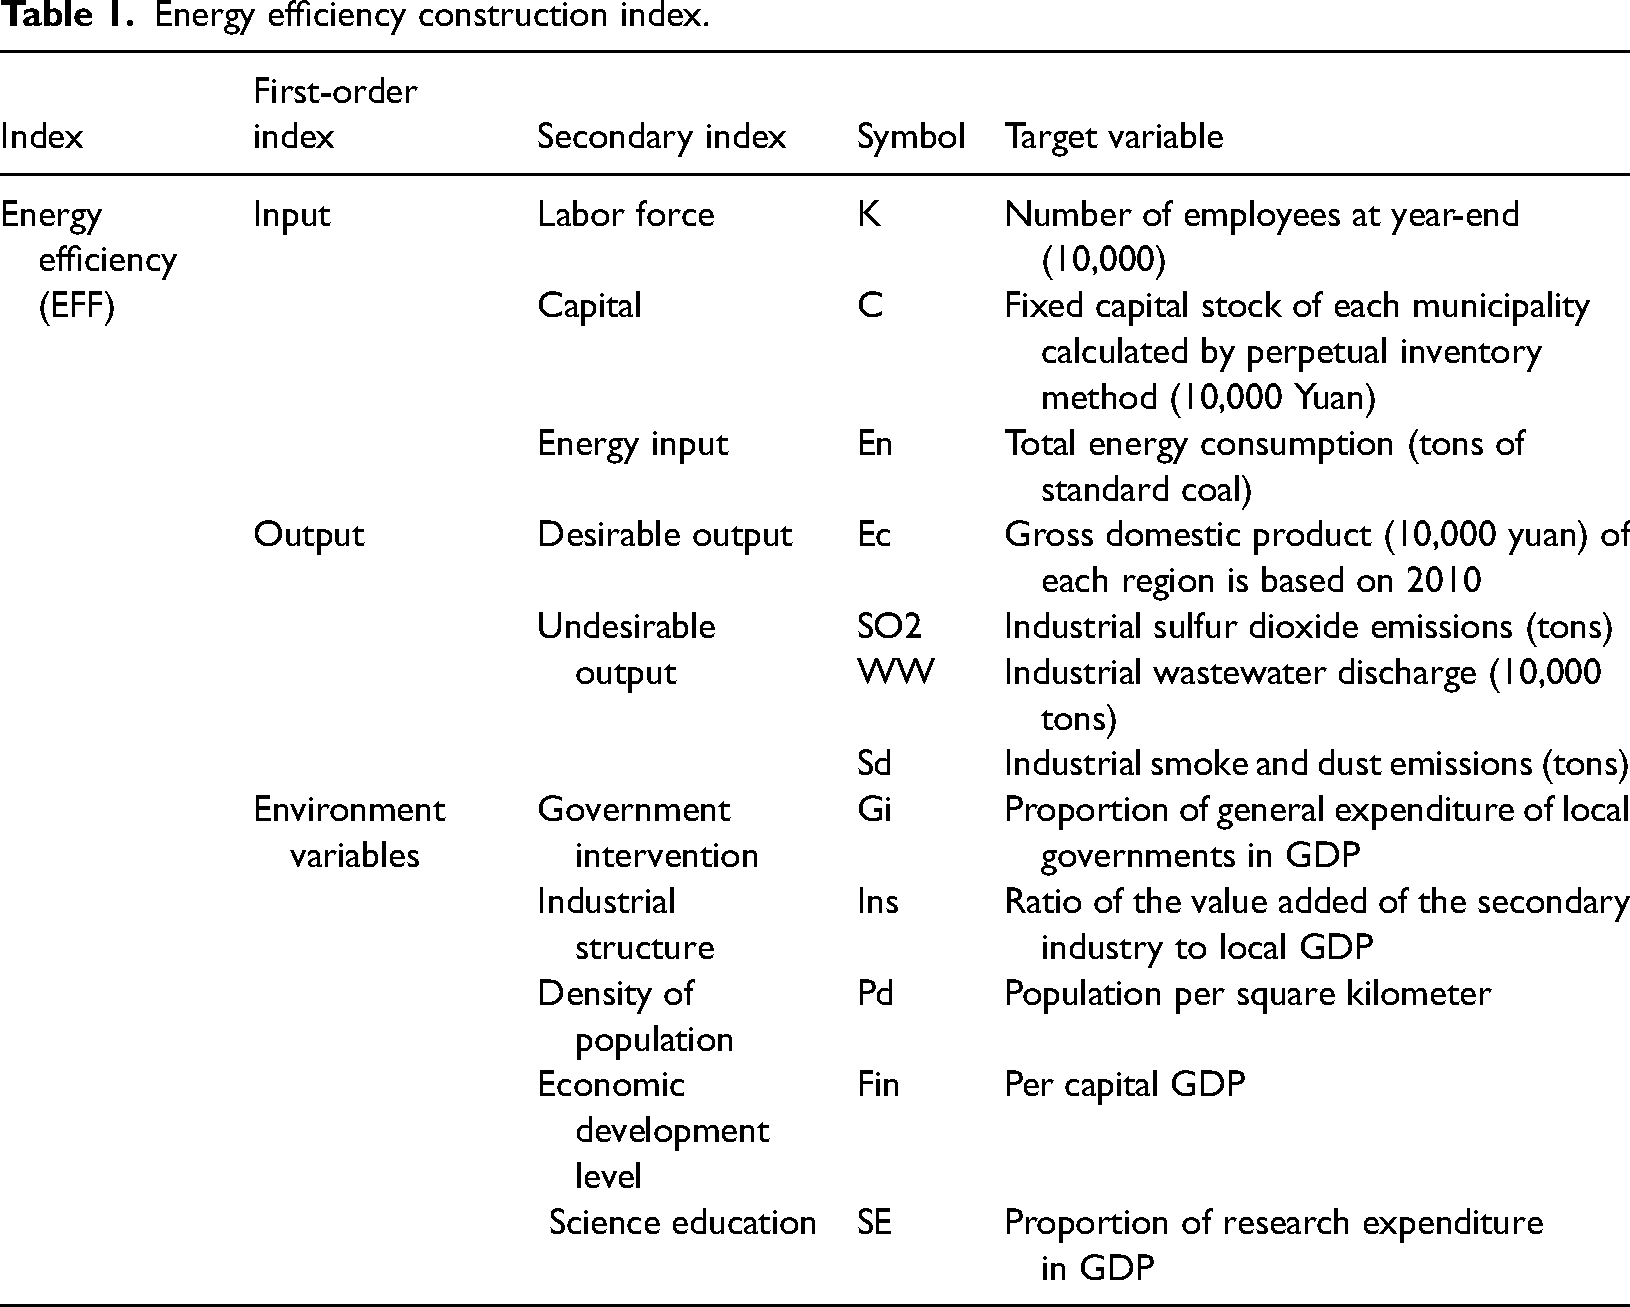
The research's scope is limited since there are not enough data observations on Tibet, Hong Kong, Macau, and a number of prefecture-level cities. The green total-factor energy efficiency of each city from 2010 to 2020 is tested and evaluated using panel data from 270 prefectures. Important prefecture-level cities’ green total-factor energy efficiency is assessed using input, output, and environmental variable indicators. Expected output indicators and unexpected output indicators are further separated into the output indicators. Table 1 lists the precise indicators and data sources.
Energy efficiency construction index.
Input–output index
The expansion of bioenergy should not interfere with food production and must therefore be monitored so that food supply or the natural resources needed for food supply, essentially land, biodiversity, aquatic resources and human capital, are not threatened. 50 Although the research objectives of various academics vary, the choice of input factors in the extant literature often comprises money, labor, energy, natural resources, and technology inputs.
(1) The number and quality of employees have a significant influence on the growth and competitiveness of metropolitan areas due to the high labor demand in these regions. With the successful allocation of input costs (labor costs) and proper planning and unexpected macroeconomic changes), the cost efficiency of the bioenergy industry can be significantly improved. 51 In this study, the labor input variable chosen is the total employment at the end of each year in different locations, which represents the actual workforce utilized in the production process. 37
(2) Extensive reproduction, characterized by significant capital input, serves as the primary growth mode of Chinese cities, as highlighted by Honma et al.. 52 Adopted fixed total investment as a comprehensive measure of investment, and the physical capital stock as an indicator of capital investment. The perpetual inventory approach is employed to estimate the capital stock for each community, allowing for a comprehensive assessment of capital investment dynamics. We currently are unable to collect consumption information for the different sources of energy at the province level, including coal use, since prefecture-level cities do not reveal their energy balance sheets. For the four components of total electricity consumption, urban heating (steam heating, thermal power plant heating), and energy input, The China City Statistical Yearbook is utilized to access public statistics on natural gas and liquefied petroleum gas, enabling the derivation of energy input through standard coal conversion coefficients and its representation in 10,000 metric tons of standard coal. 53
When selecting output variables for industrial processes, both predicted and unforeseen impacts are frequently taken into account. The study anticipates three main categories of outcomes: economic, social, and environmental implications. GDP is widely recognized as a key indicator of economic development in a region, as emphasized by Xie et al., 54 while social variables are reflected by average worker pay (in Yuan) and the percentage of household trash that is harmlessly disposed. The measurements of unexpected outputs encompass industrial emissions of sulfur dioxide, wastewater discharge, smoke and dust, and nitrogen oxides. 55 They are all measured in metric tons. The entropy approach is used to determine the pollution index.
Environmental index
Data sources
The aforementioned indicators were created using information gathered from a number of sources, including the National Bureau of Statistics’ yearly publications. China City Statistical Yearbook (2011–2021), China Energy Statistical Yearbook (2011–2021), and China Statistical Yearbook (2011–2021) are a few of these publications.
Results
First stage
The results of the first stage are presented in Figure 2.
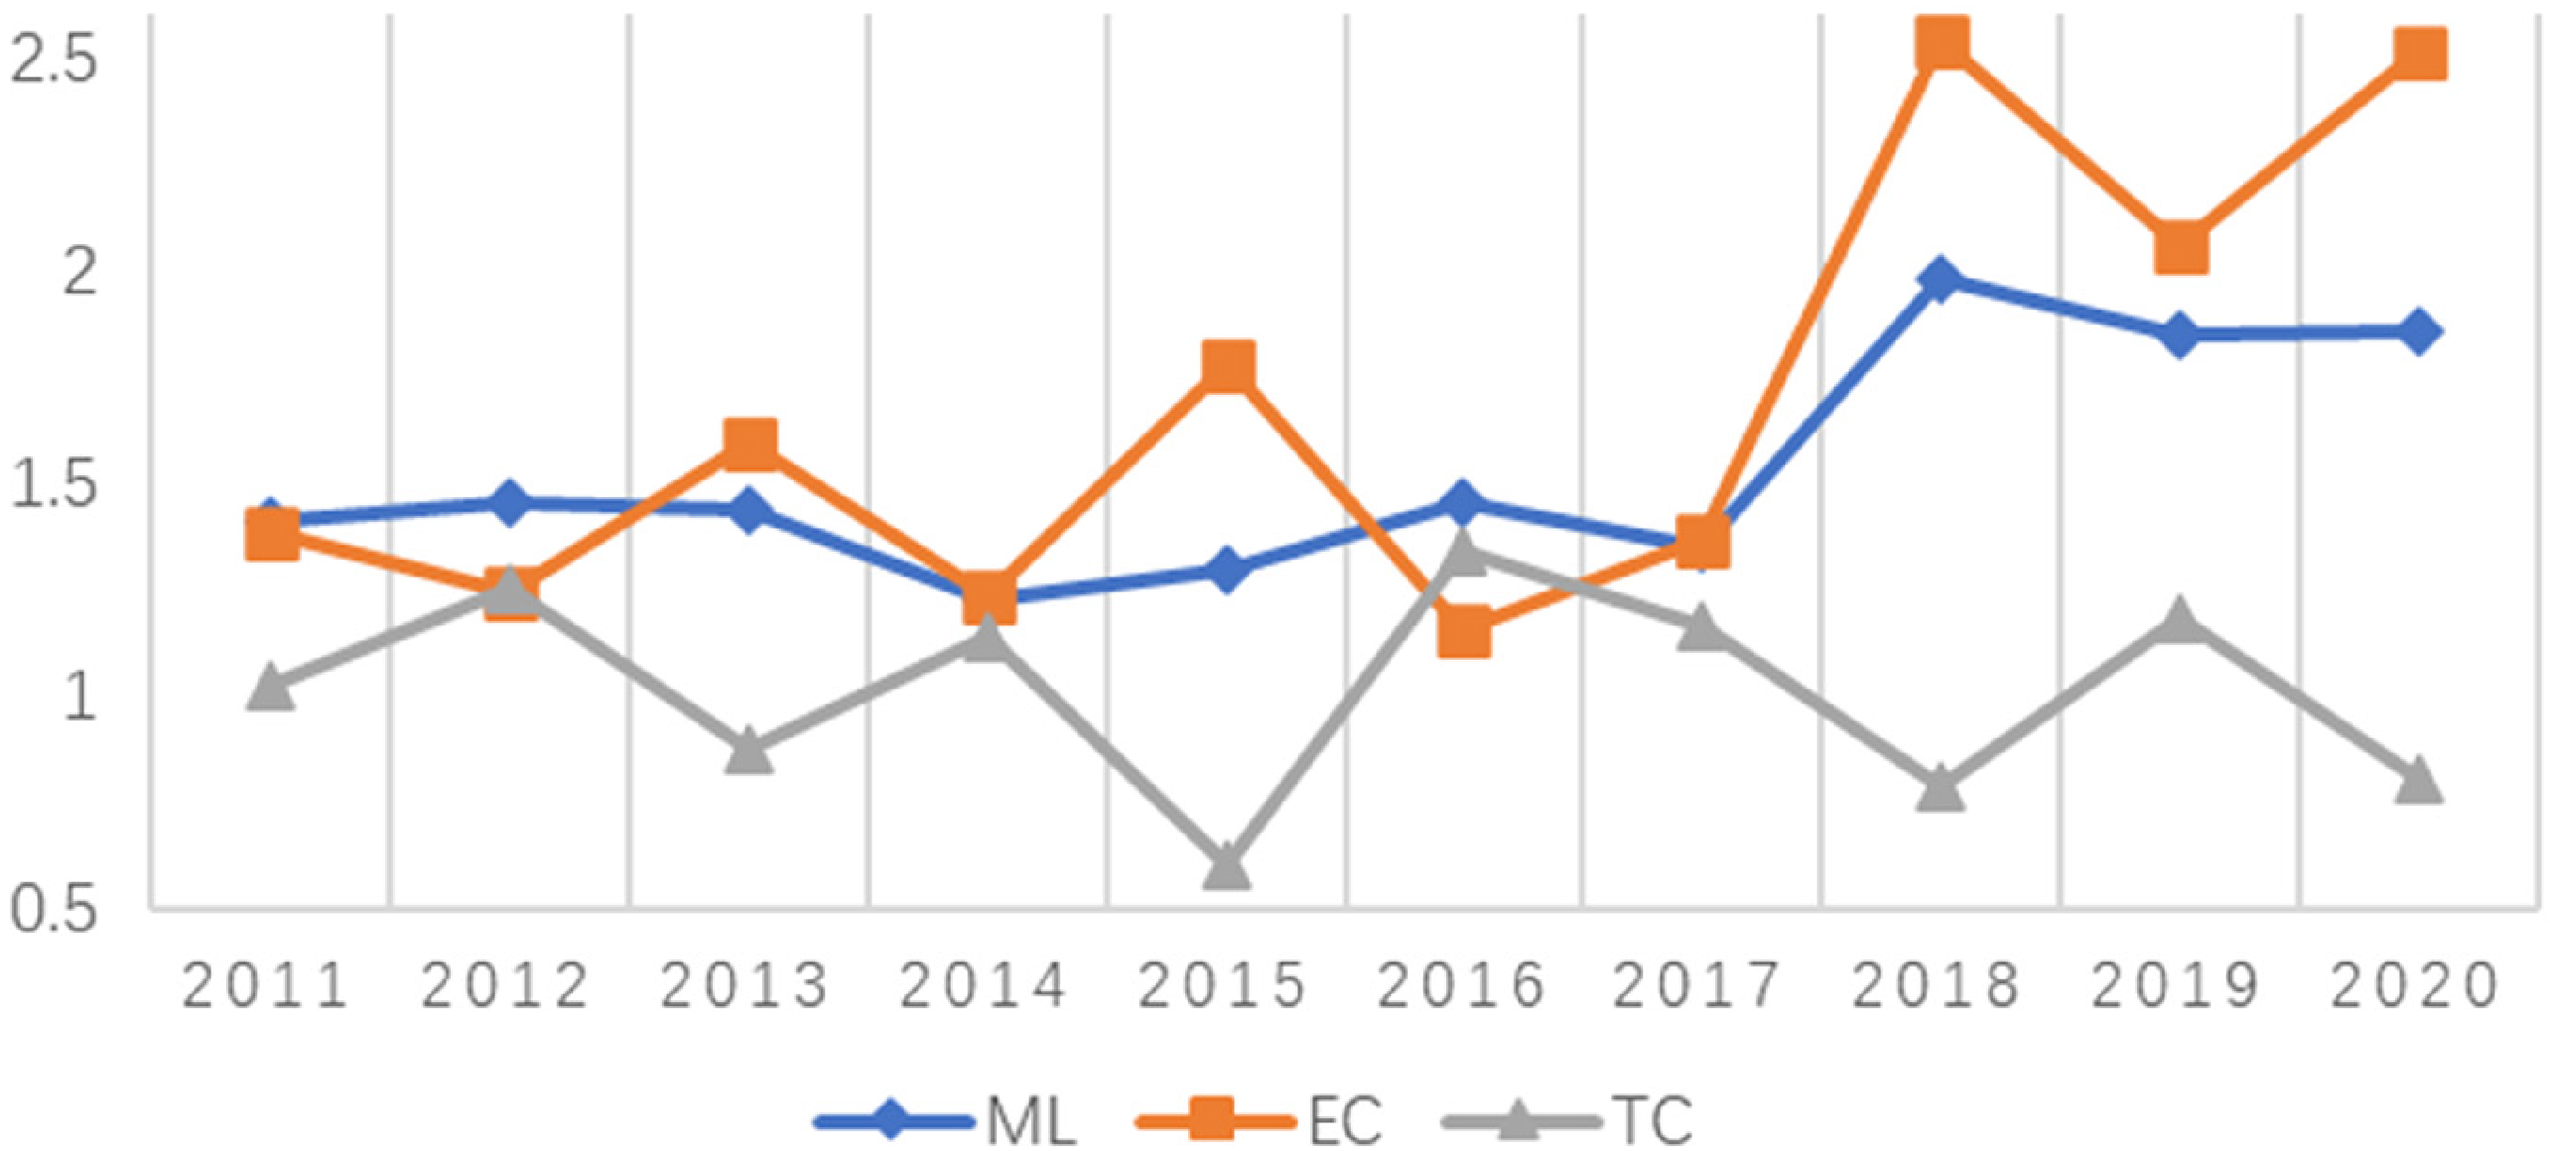
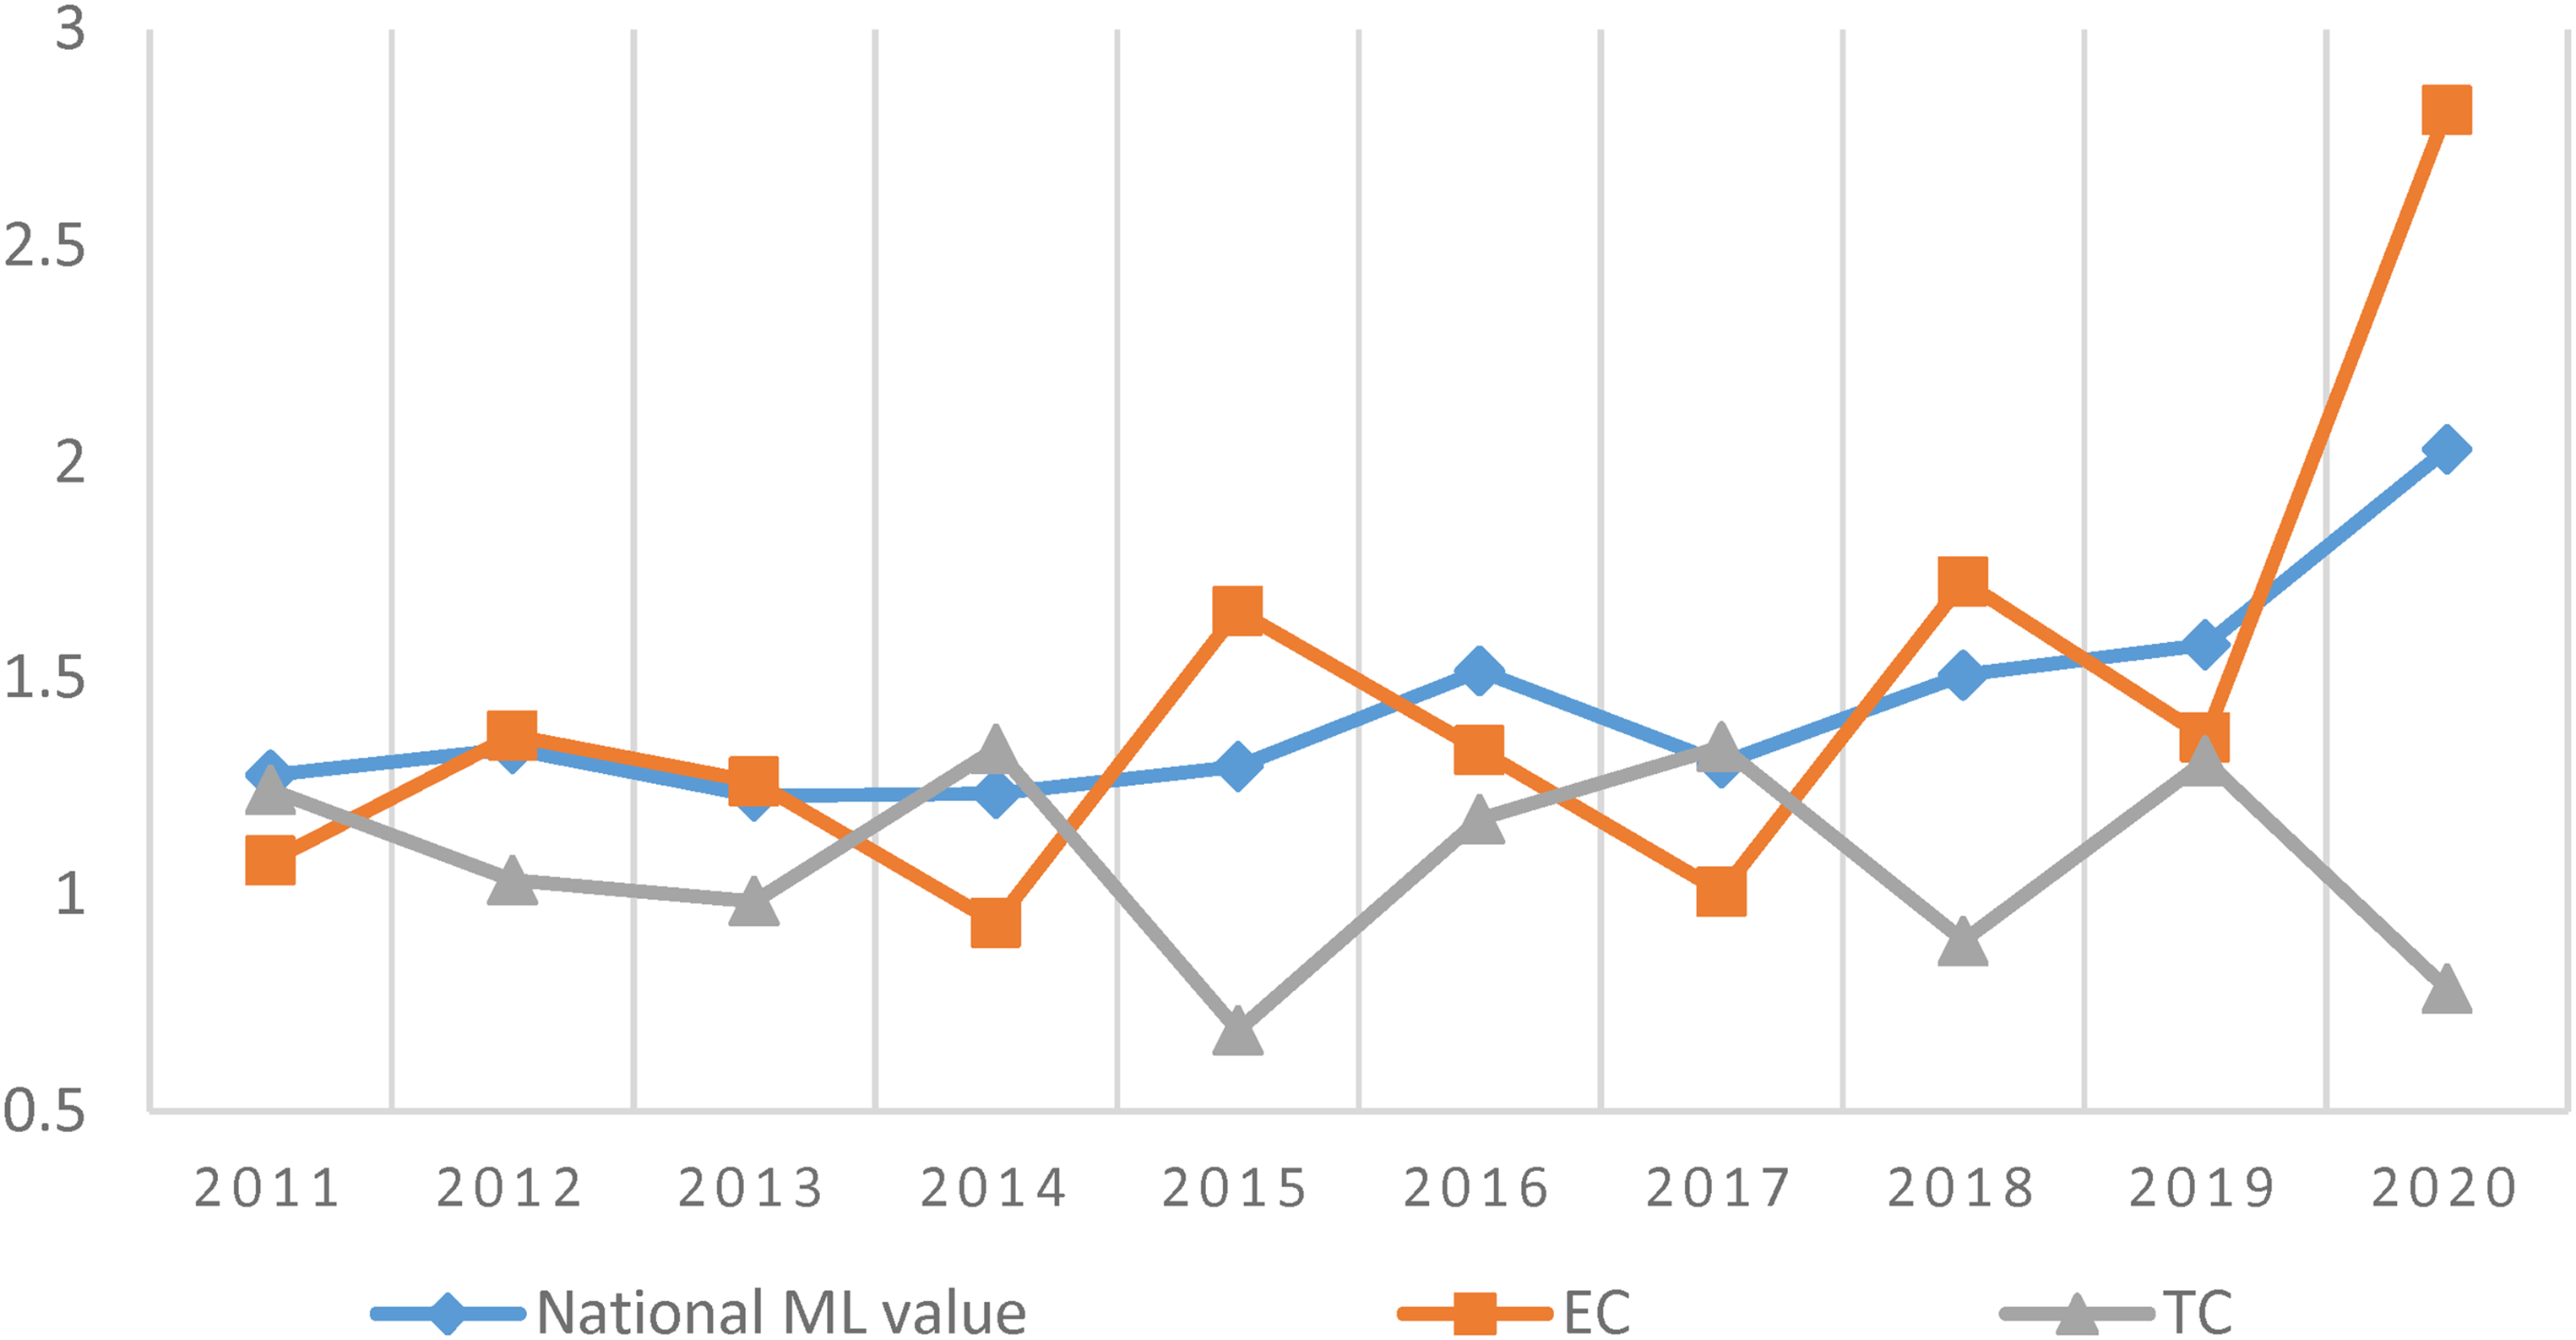
Ml, EC, and TC values of total factor energy efficiency in China.
From a nationwide perspective, China's total factor energy efficiency (ML) exhibited fluctuations ranging from 1.2259 to 1.9777 between 2011 and 2020, demonstrating an overall increasing trend. This suggests that throughout the 12th Five-Year Plan and 13th Five-Year Plan periods, there was an improvement in overall energy efficiency, attributed to the government's efforts in shutting down high-energy-consuming and high-polluting enterprises. However, it is noteworthy that in 2017, China's total factor energy efficiency experienced a significant decline. This might be linked to a decrease in the availability of fossil fuels brought on by the complete stoppage of coal imports from North Korea and the suspension of coal output in Shanxi. Another regular occurrence was the “waiting in line for coal” phenomena, which reduced the availability of fossil fuels.
Technical efficiency (EC) and technological advancement efficiency (TC), two subcategories of total factor energy efficiency, may be examined. The technical efficiency values show a similar pattern to the differences in total factor energy efficiency shown in Figure 3 and vary from 1.1559 to 2.5398. This shows that these gains in energy efficiency are mostly driven by the advancement in technical efficiency. On the other side, technological advancement efficiency ranged between 0.6062 and 1.3432, indicating a general declining tendency. In 2020, it fell to its lowest point. This can be mainly attributed to distorted energy factor prices that led to extensive and inefficient economic development. The National Development and Reform Commission of China's major support of “Internet Plus” smart energy development during the same year may be responsible for the comparatively high technical improvement efficiency. The integration of energy and modern information technology, known as the “Internet Plus” concept, has greatly transformed smart energy management and marketing models. This integration has led to technological advancements and improved energy efficiency in various sectors.
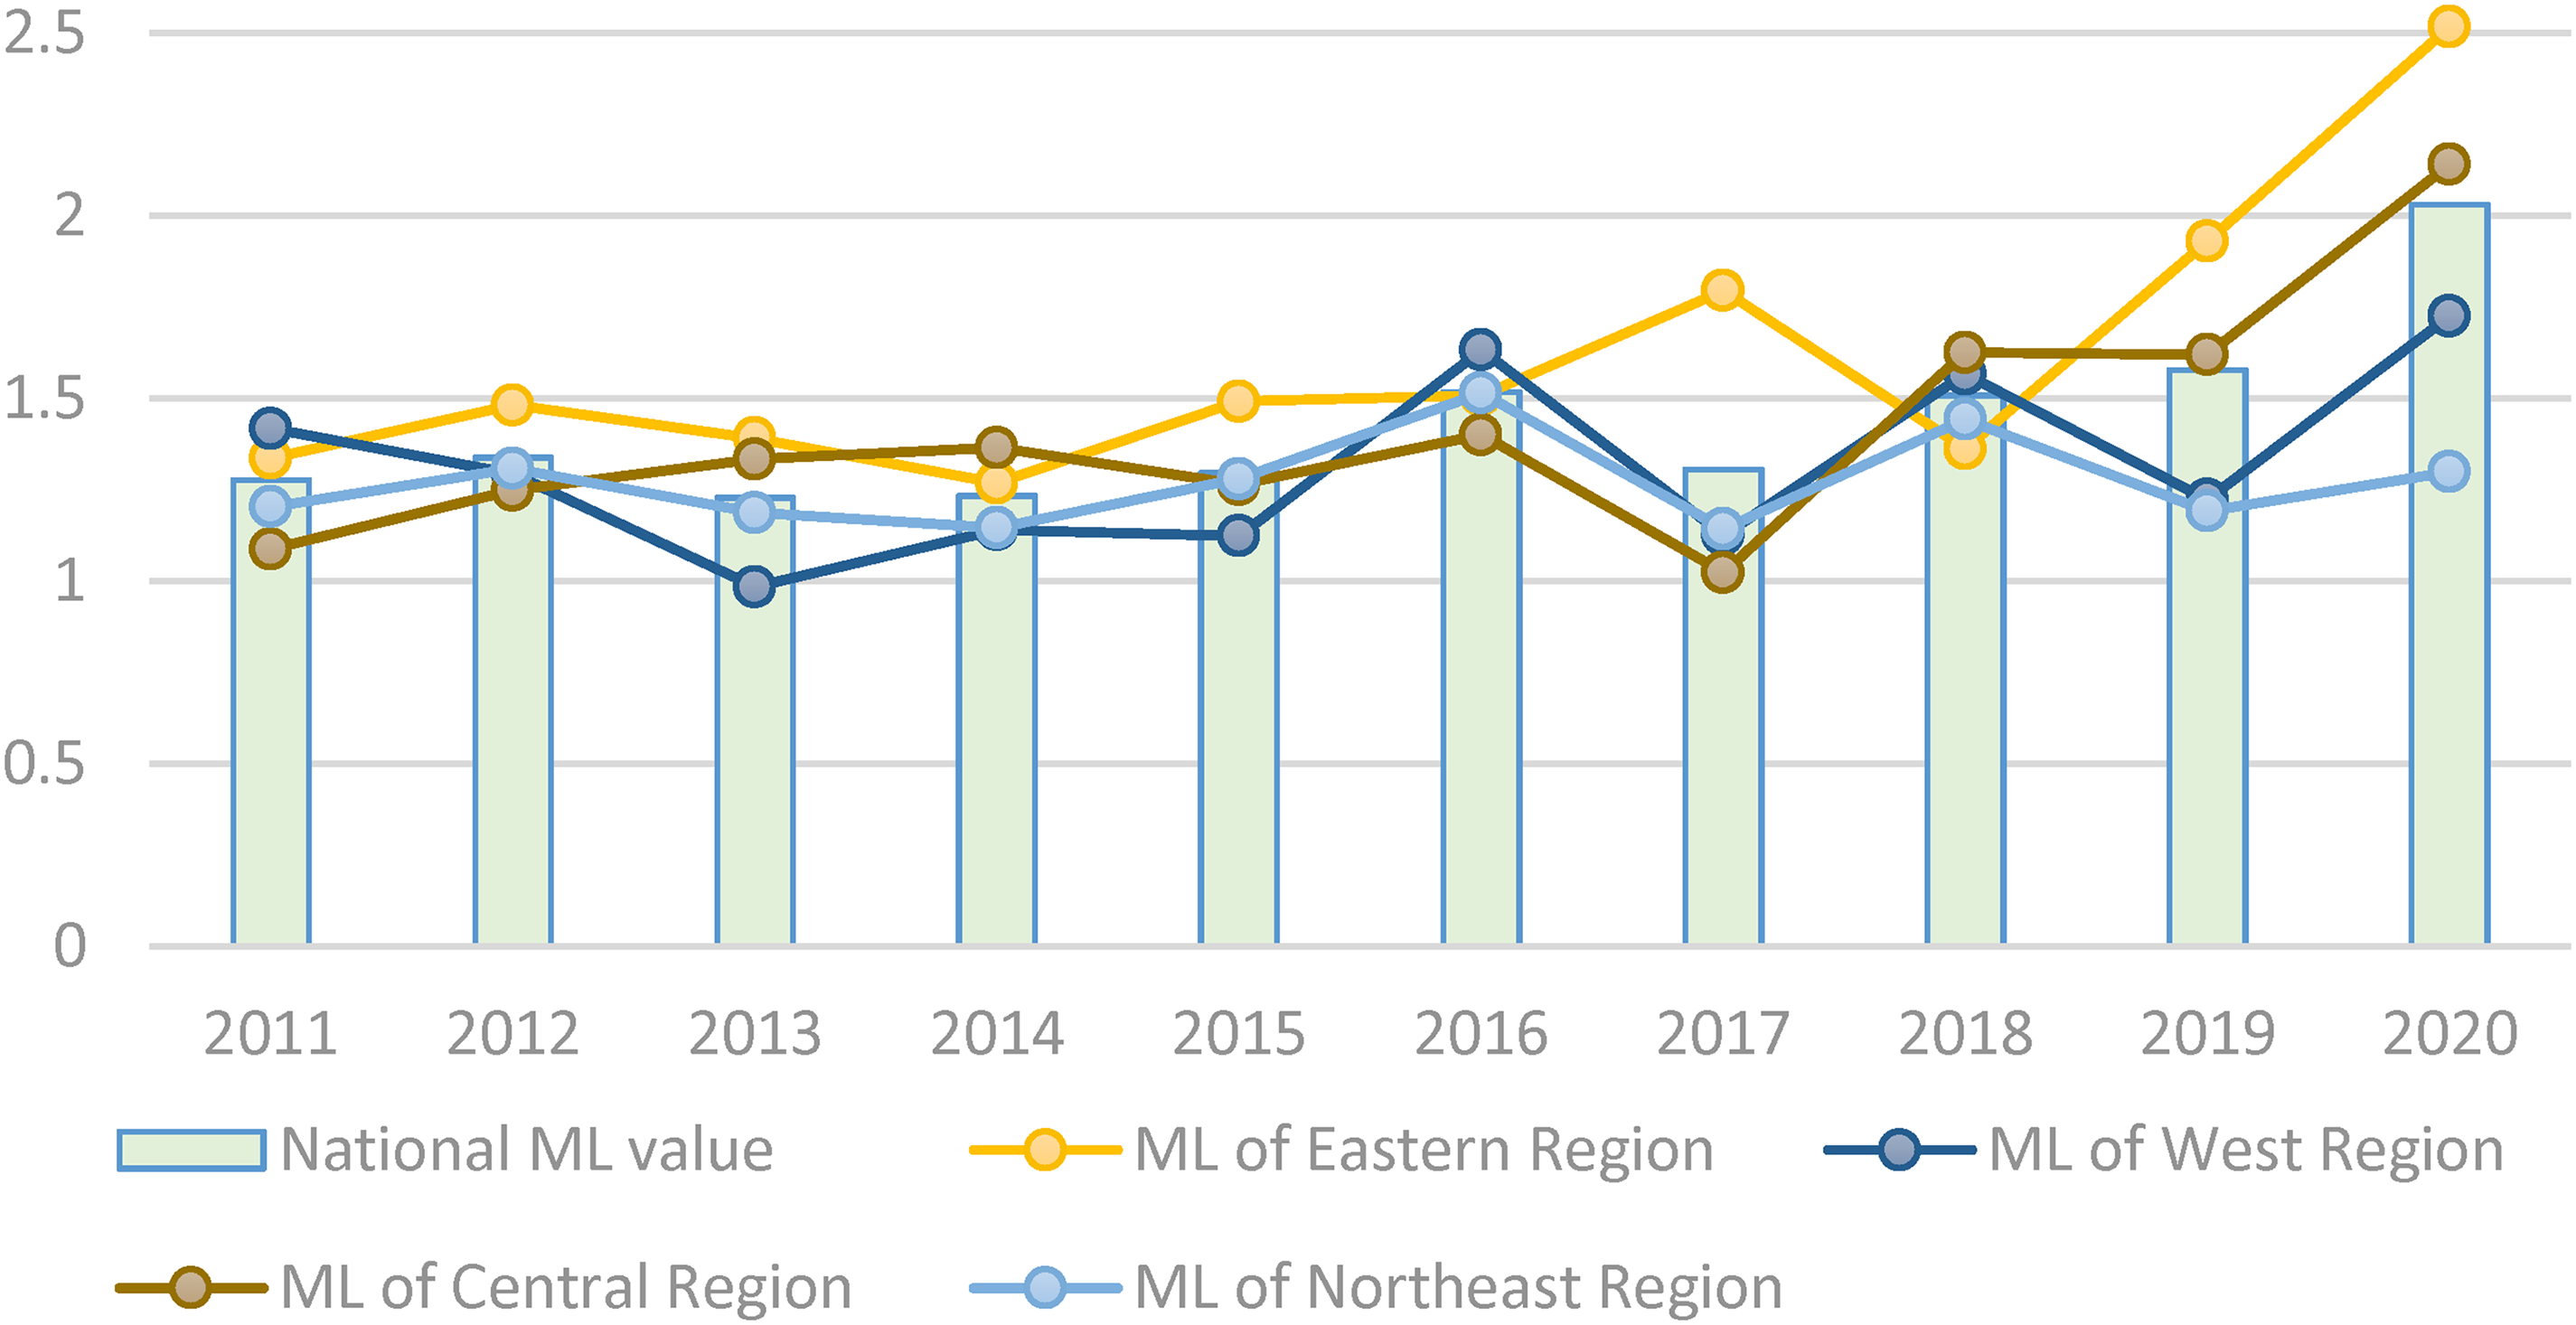
Ml index values of major regions in China.
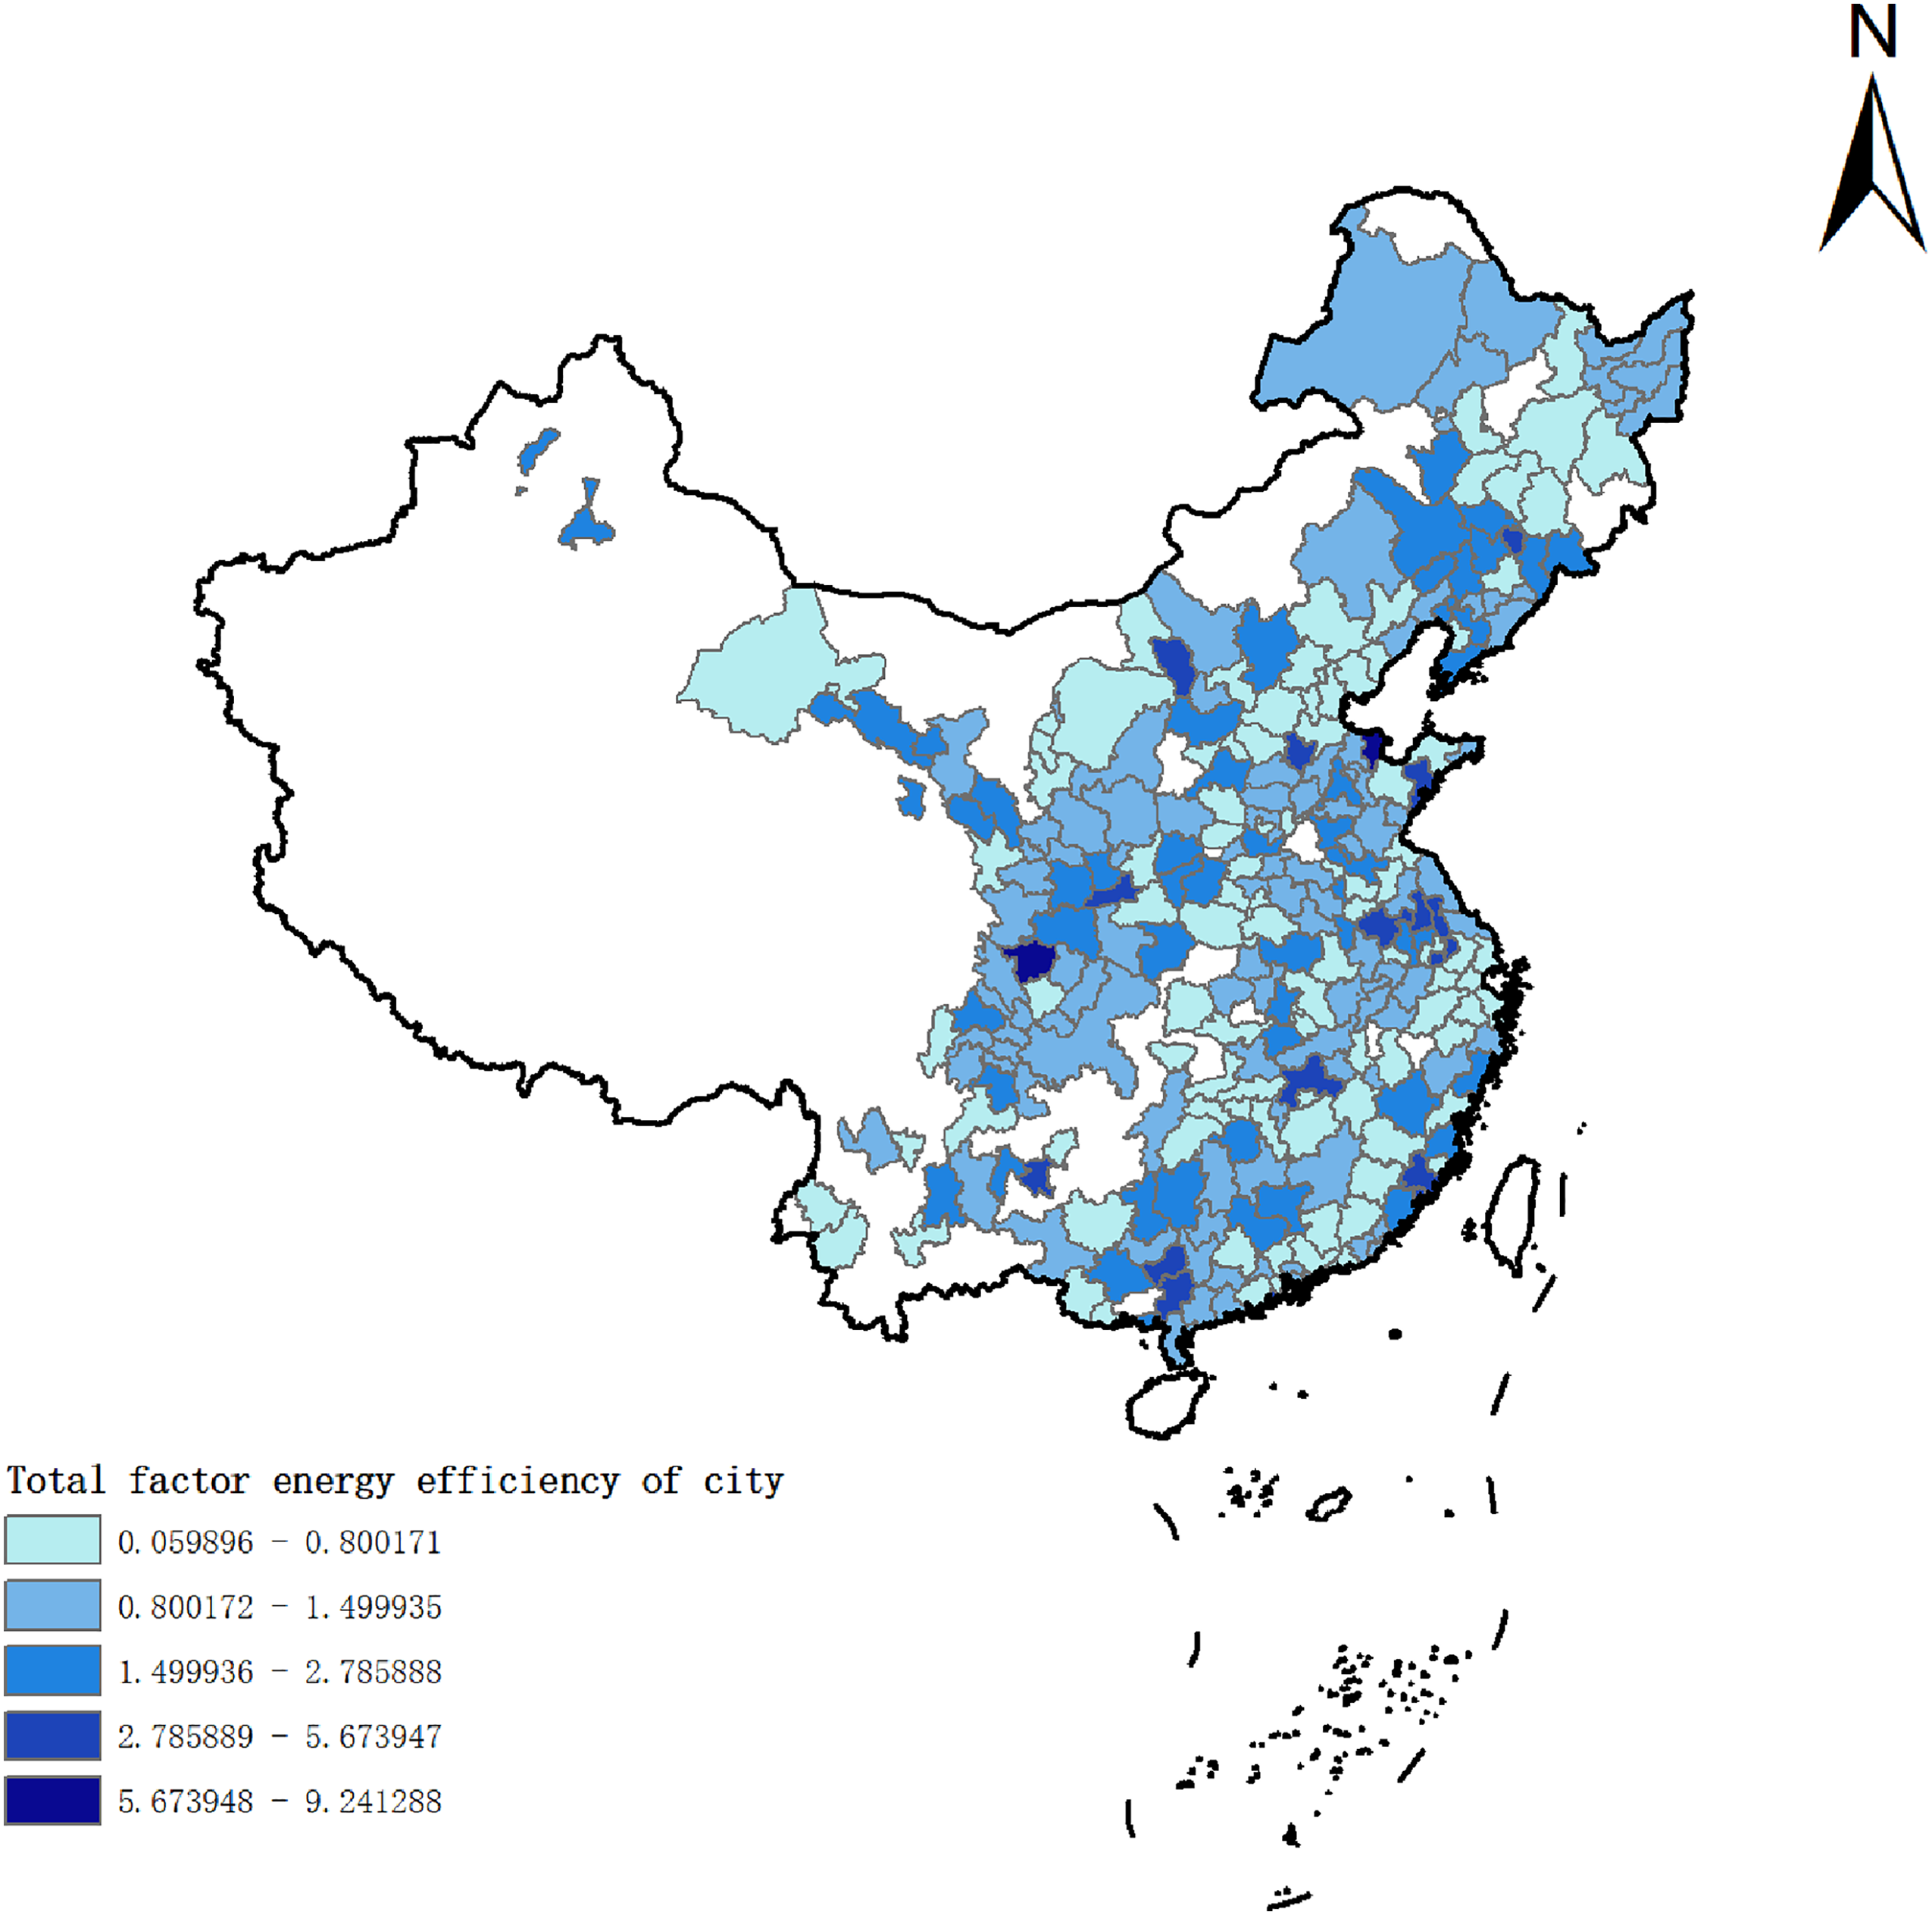
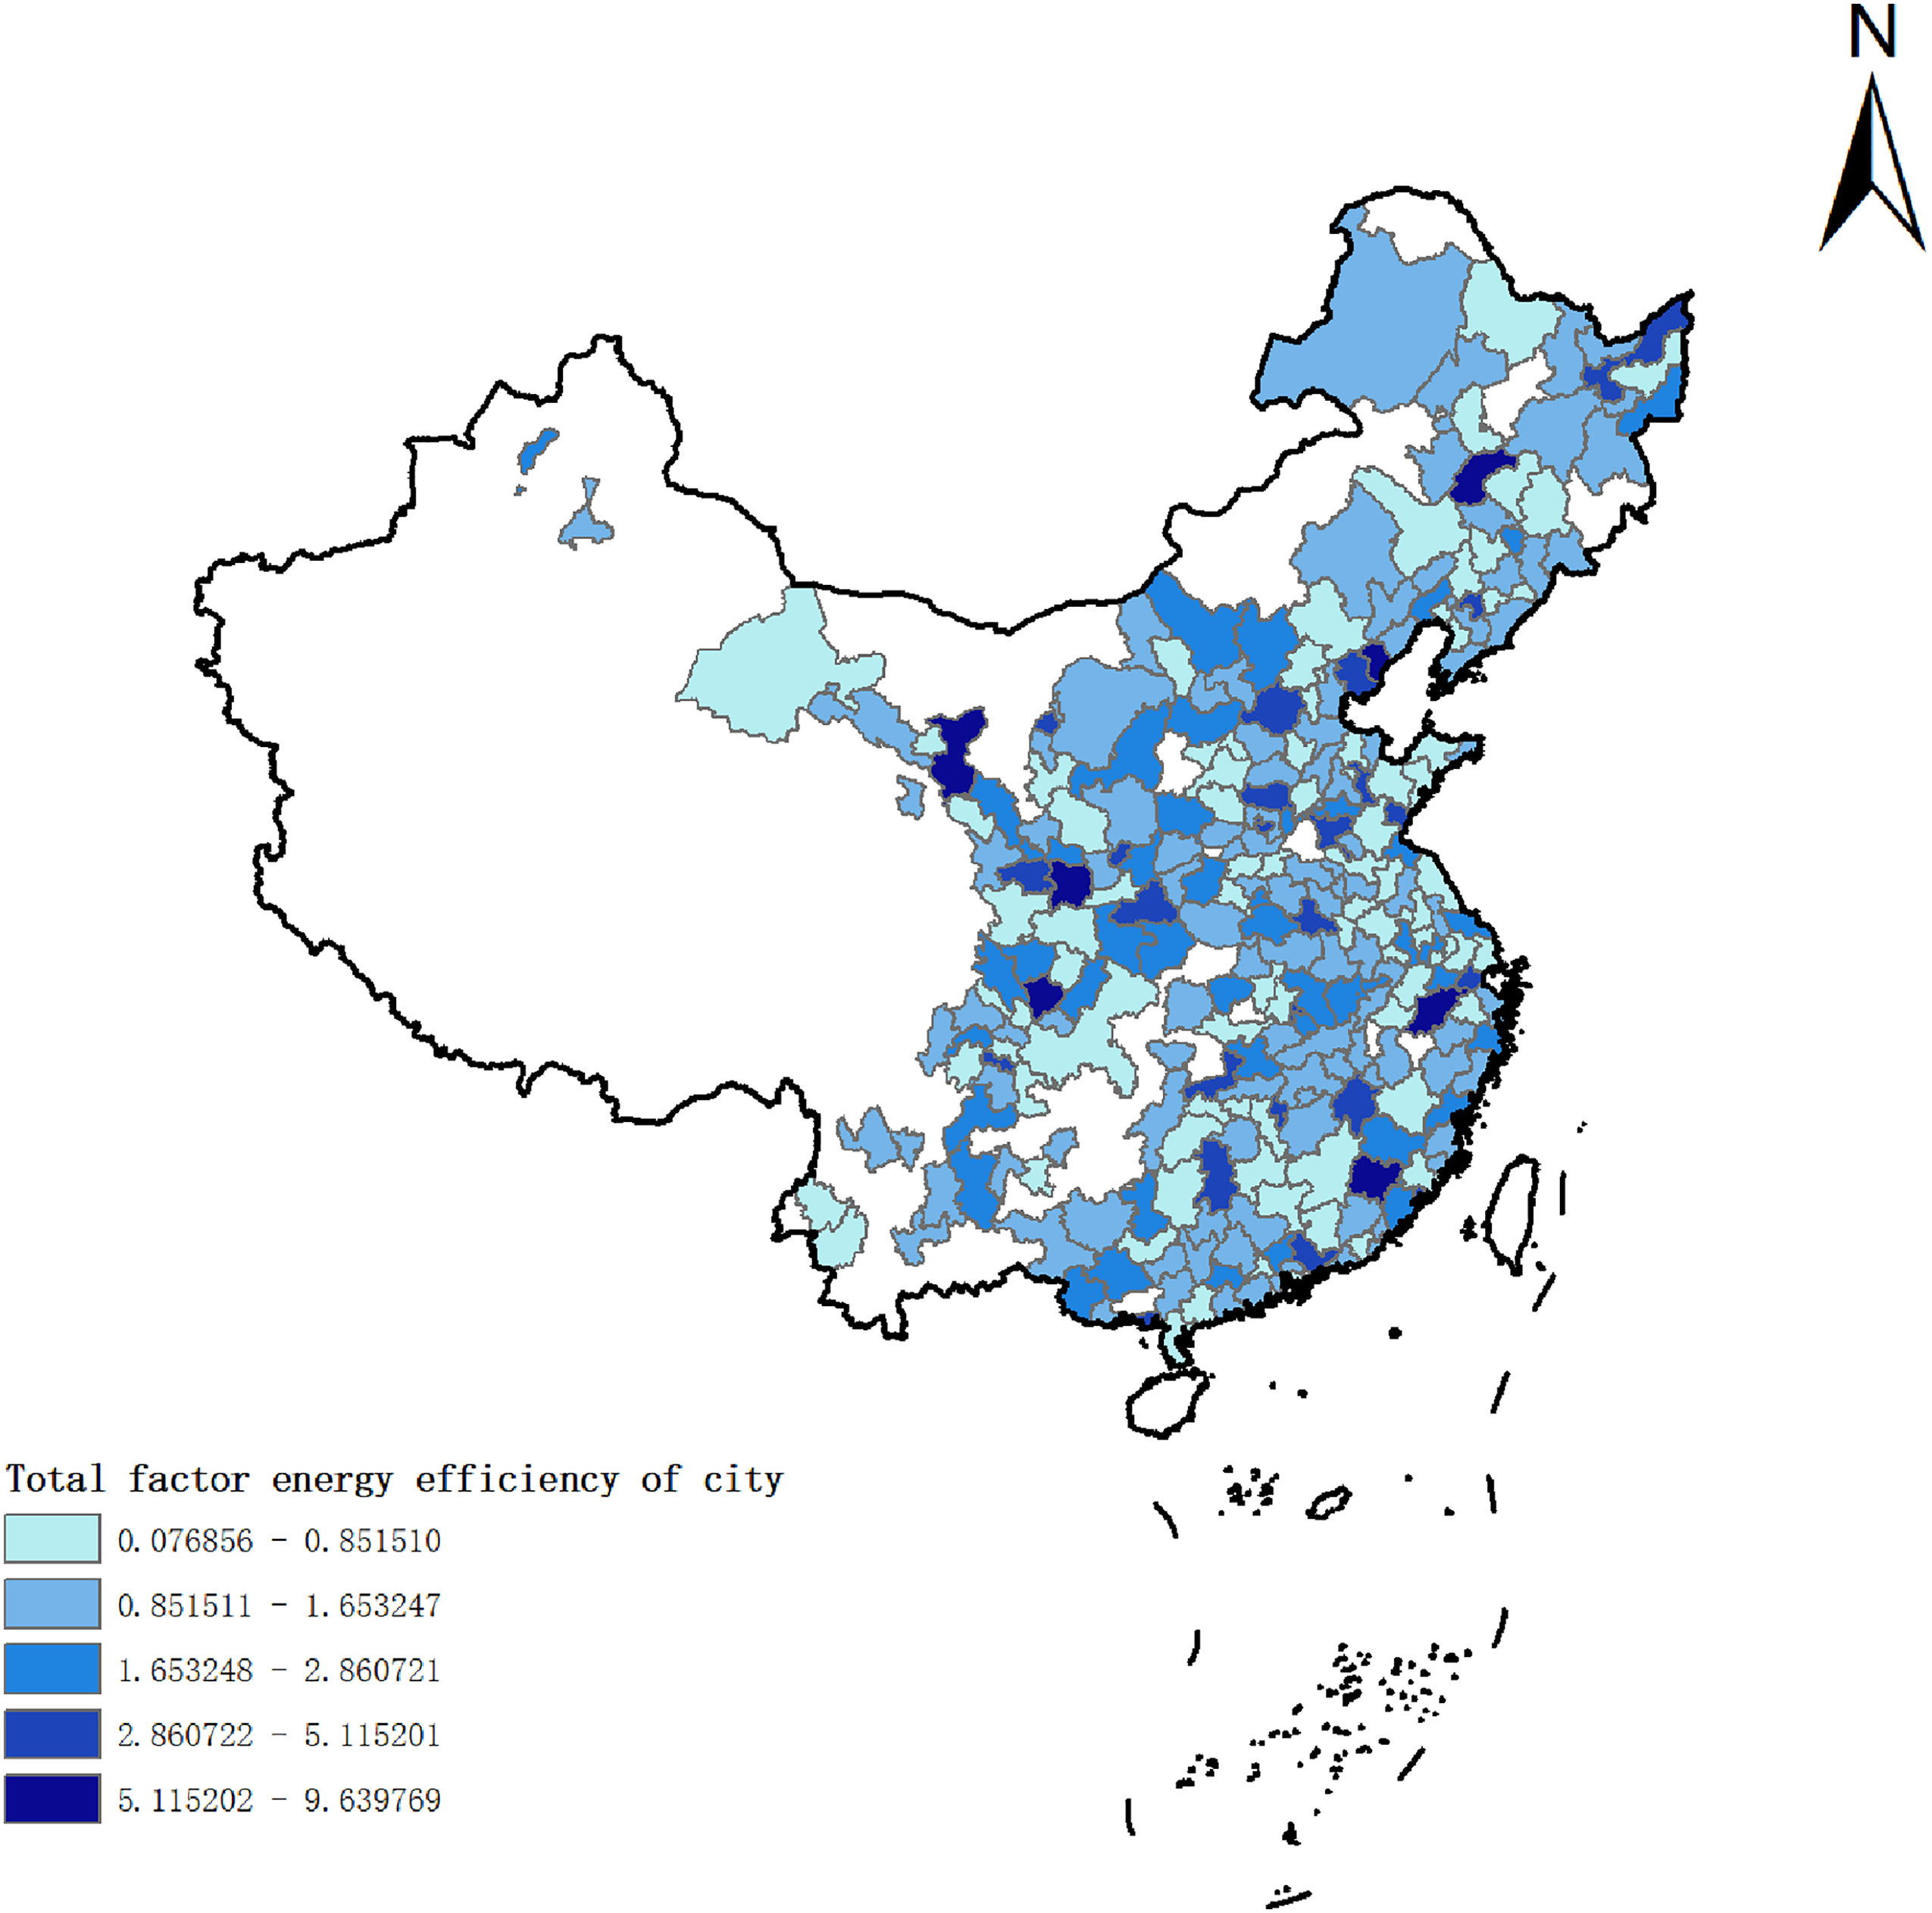
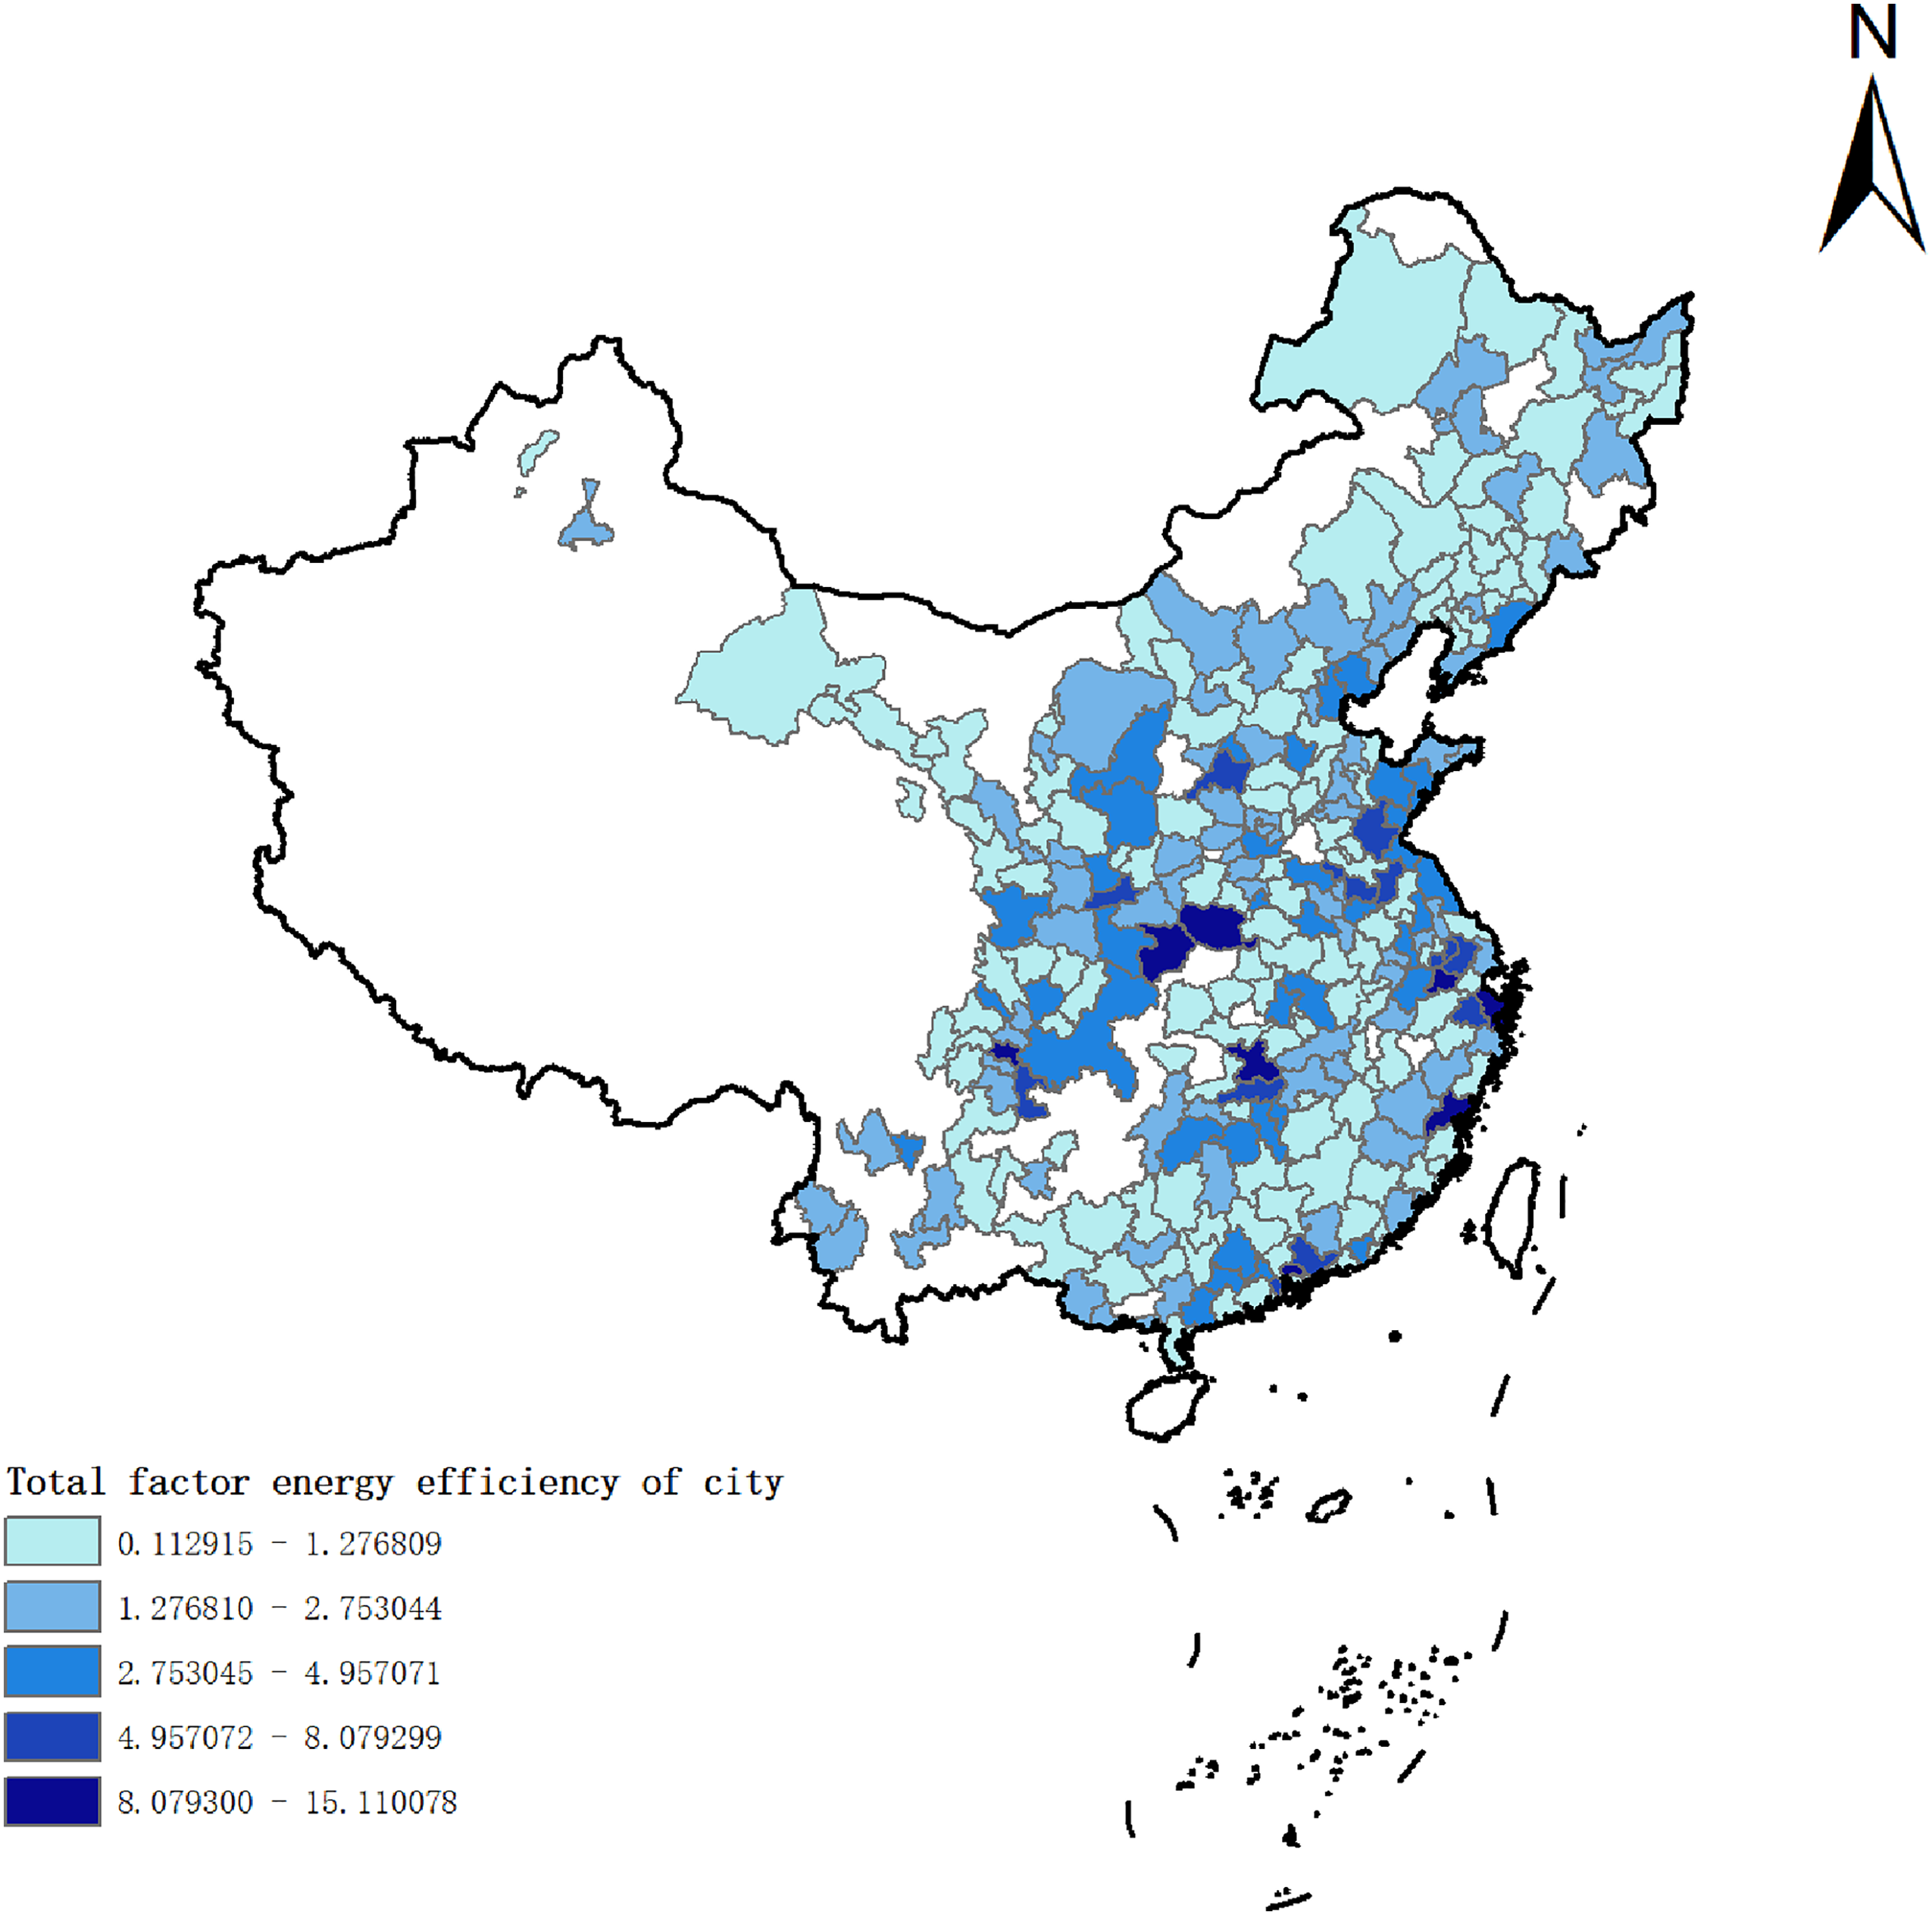
The analytical findings of the total factor energy efficiency of Chinese cities in 2011, 2016, and 2020 are shown in Figures 4 to 6. From 2011 to 2020, a consistent trend in total factor energy efficiency is shown throughout the four areas depicted in Figures 3 to 6. Energy efficiency ratings in the eastern area range from 1.14 to 2.53, while those in the central region range from 1.18 to 1.95, both of which show an increased trend. The northeastern region shows values ranging from 1.11 to 1.53, whereas the western region displays fluctuating values from 1.03 to 1.92. In terms of comparing energy efficiency among regions, the eastern region consistently maintains higher total factor energy efficiency, surpassing the national average. Conversely, the western, northeastern, and central regions exhibit lower energy efficiency levels, with relatively small differences among them. This indicates that cities in China with higher population and economic activity concentrations tend to have higher energy efficiency, while many regions in the country experience lower levels of energy efficiency. Furthermore, in 2011, 2015, and 2019, cities with the lowest energy efficiency are primarily situated in the central and western regions, mainly comprising resource-based cities.
Total factor energy efficiency of cities of China in 2011.
Total factor energy efficiency of cities of China in 2016.
Total factor energy efficiency of cities of China in 2020.
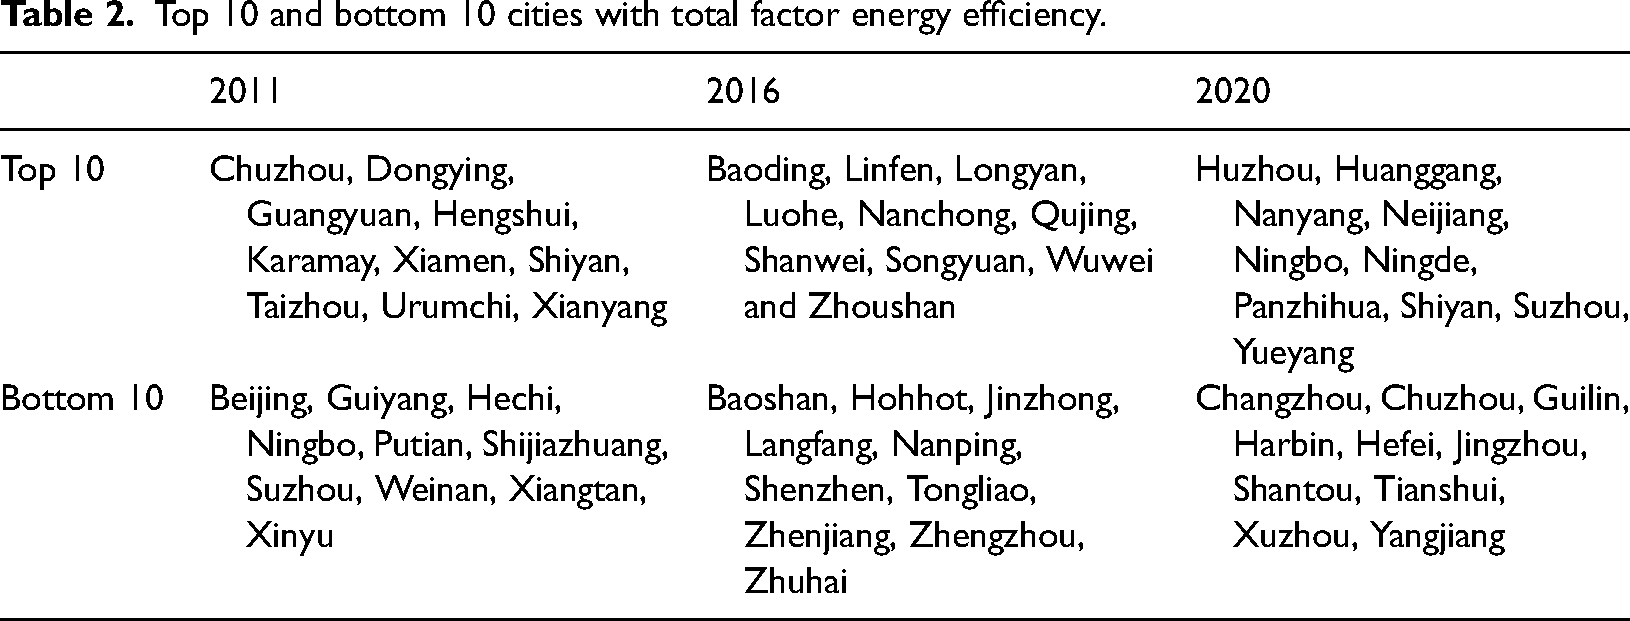
According to Table 2, China's eastern region is home to the majority of the top 10 cities for energy efficiency. Cities in the Yangtze River Delta and Pearl River Delta areas, as well as province capitals, are among these cities. This demonstrates the concentration of highly energy efficient performance in these prosperous and established economic regions of the nation. Some cities in the central, western, and northeastern regions, such as Songyuan, Baoding, and Yueyang, also exhibited relatively high energy efficiency.
Top 10 and bottom 10 cities with total factor energy efficiency.
Second stage
In the second step of study, researchers frequently use the Stochastic Frontier study (SFA) regression model to analyze the impact of random disturbances and environmental variables. The input values are modified in the initial stage in accordance with the coefficients shown in Table 3. Additionally, by including the super-efficiency SBM model, estimates of total factor energy efficiency may be made that are more precise and realistic.
Capital slack factors and government intervention are expected to be negatively correlated with labor slack variables, while government intervention and energy input slack variables are expected to have positive associations. The significance of the labor slack variable suggests that the government has a tendency to prioritize local economic growth over energy-saving and emission-reduction activities. This indicates a propensity to compromise environmental quality in support of economic development. As a result, predicting the impact of industry agglomeration on energy efficiency becomes more challenging due to government involvement and potential “free-riding” behavior in environmental management. Industrial structure and labor slack variables show a substantial positive link, showing that a larger percentage of investment in the secondary sector is not helpful for maintaining electricity investment. At a significance level of 1%, a strong association is found between industrial structure, capital slack variables, and energy input slack factors. This suggests that increasing investment in secondary industries may accelerate technological advancements and aid in the recovery of capital investments. However, the anticipated correlation between industrial structure and the energy input slack variable does not reach statistical significance. It is discovered that population density and total factor energy efficiency are positively correlated, whereas capital investment and population density are negatively correlated. The strong positive association between population density and measures of labor, capital, and energy input slack serves to support this. The degree of economic development is strongly positively correlated with the metrics of labor, capital, and energy input slack. This means that increasing economic growth would undermine attempts to improve the effectiveness of the use of natural resources. It shows that efforts to raise total factor energy efficiency have not been successful. It has been found that the variables representing energy input, labor, and capital slack exhibit positive estimated coefficients with educational attainment. The labor slack variable among them passes the 10% significance level test, suggesting that an increase in educational attainment has some inhibitory effects on labor input.
SFA model parameters and evaluation results in the second stage.
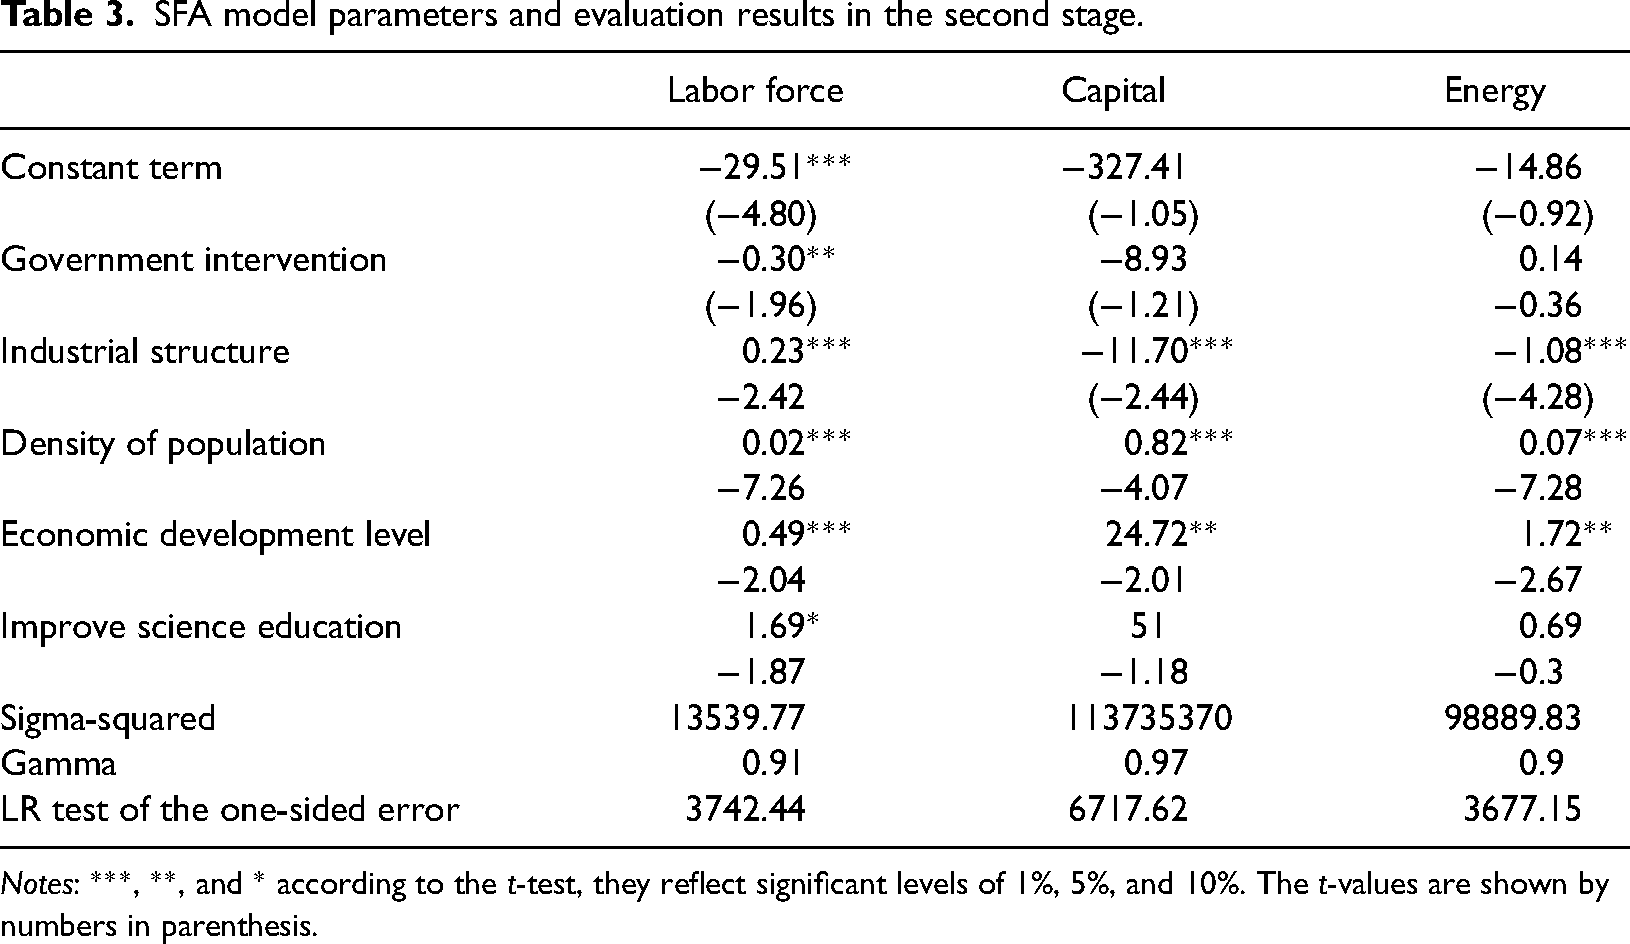
Notes: ***, **, and * according to the t-test, they reflect significant levels of 1%, 5%, and 10%. The t-values are shown by numbers in parenthesis.
Third stage
Using the modified input variables in the second stage, significant variations in total factor energy efficiency are observed among different regions. Therefore, it is crucial to reduce appraisal biases brought on by differences in the external environment.
In Figure 7 from a national perspective, the total factor energy efficiency (ML) in China exhibited fluctuations between 1.2288 and 2.0301 from 2011 to 2020, showing an overall increasing trend. The technical advancement efficiency ranged from 0.9347 to 2.8142, indicating a generally increasing tendency that is significantly higher than the declining trend of technological efficiency. These results imply that technological inefficiencies are the primary cause of China's comparatively poor total factor energy efficiency. However, China's total factor energy efficiency shows an average improvement of 0.1 when the impacts of external environmental variables are taken into consideration. It indicates the importance of taking adverse environmental factors into account when evaluating total factor energy efficiency in China. Overall, from 2011 to 2020, China's total factor energy efficiency showed mainly upward variations. Total factor energy efficiency increased relatively little from 2011 and 2017, with a minor dip in that year and a strong acceleration of growth from 2018 to 2020. There was a significant and fluctuating gap between technical progress efficiency (TC) and energy efficiency, but the value of technological efficiency (EC) matched the overall advances in energy efficiency. According to these results, strengthening the external environment and encouraging technology advancement are important ways to increase China's total factor energy efficiency. China may improve its overall performance in terms of energy efficiency by fostering technology developments and providing a favorable external environment. These initiatives may include putting supporting laws in place, encouraging innovation, funding R&D, and encouraging the use of eco-friendly technology (Figure 8).
Ml, EC, and TC values of total factor energy efficiency in China.
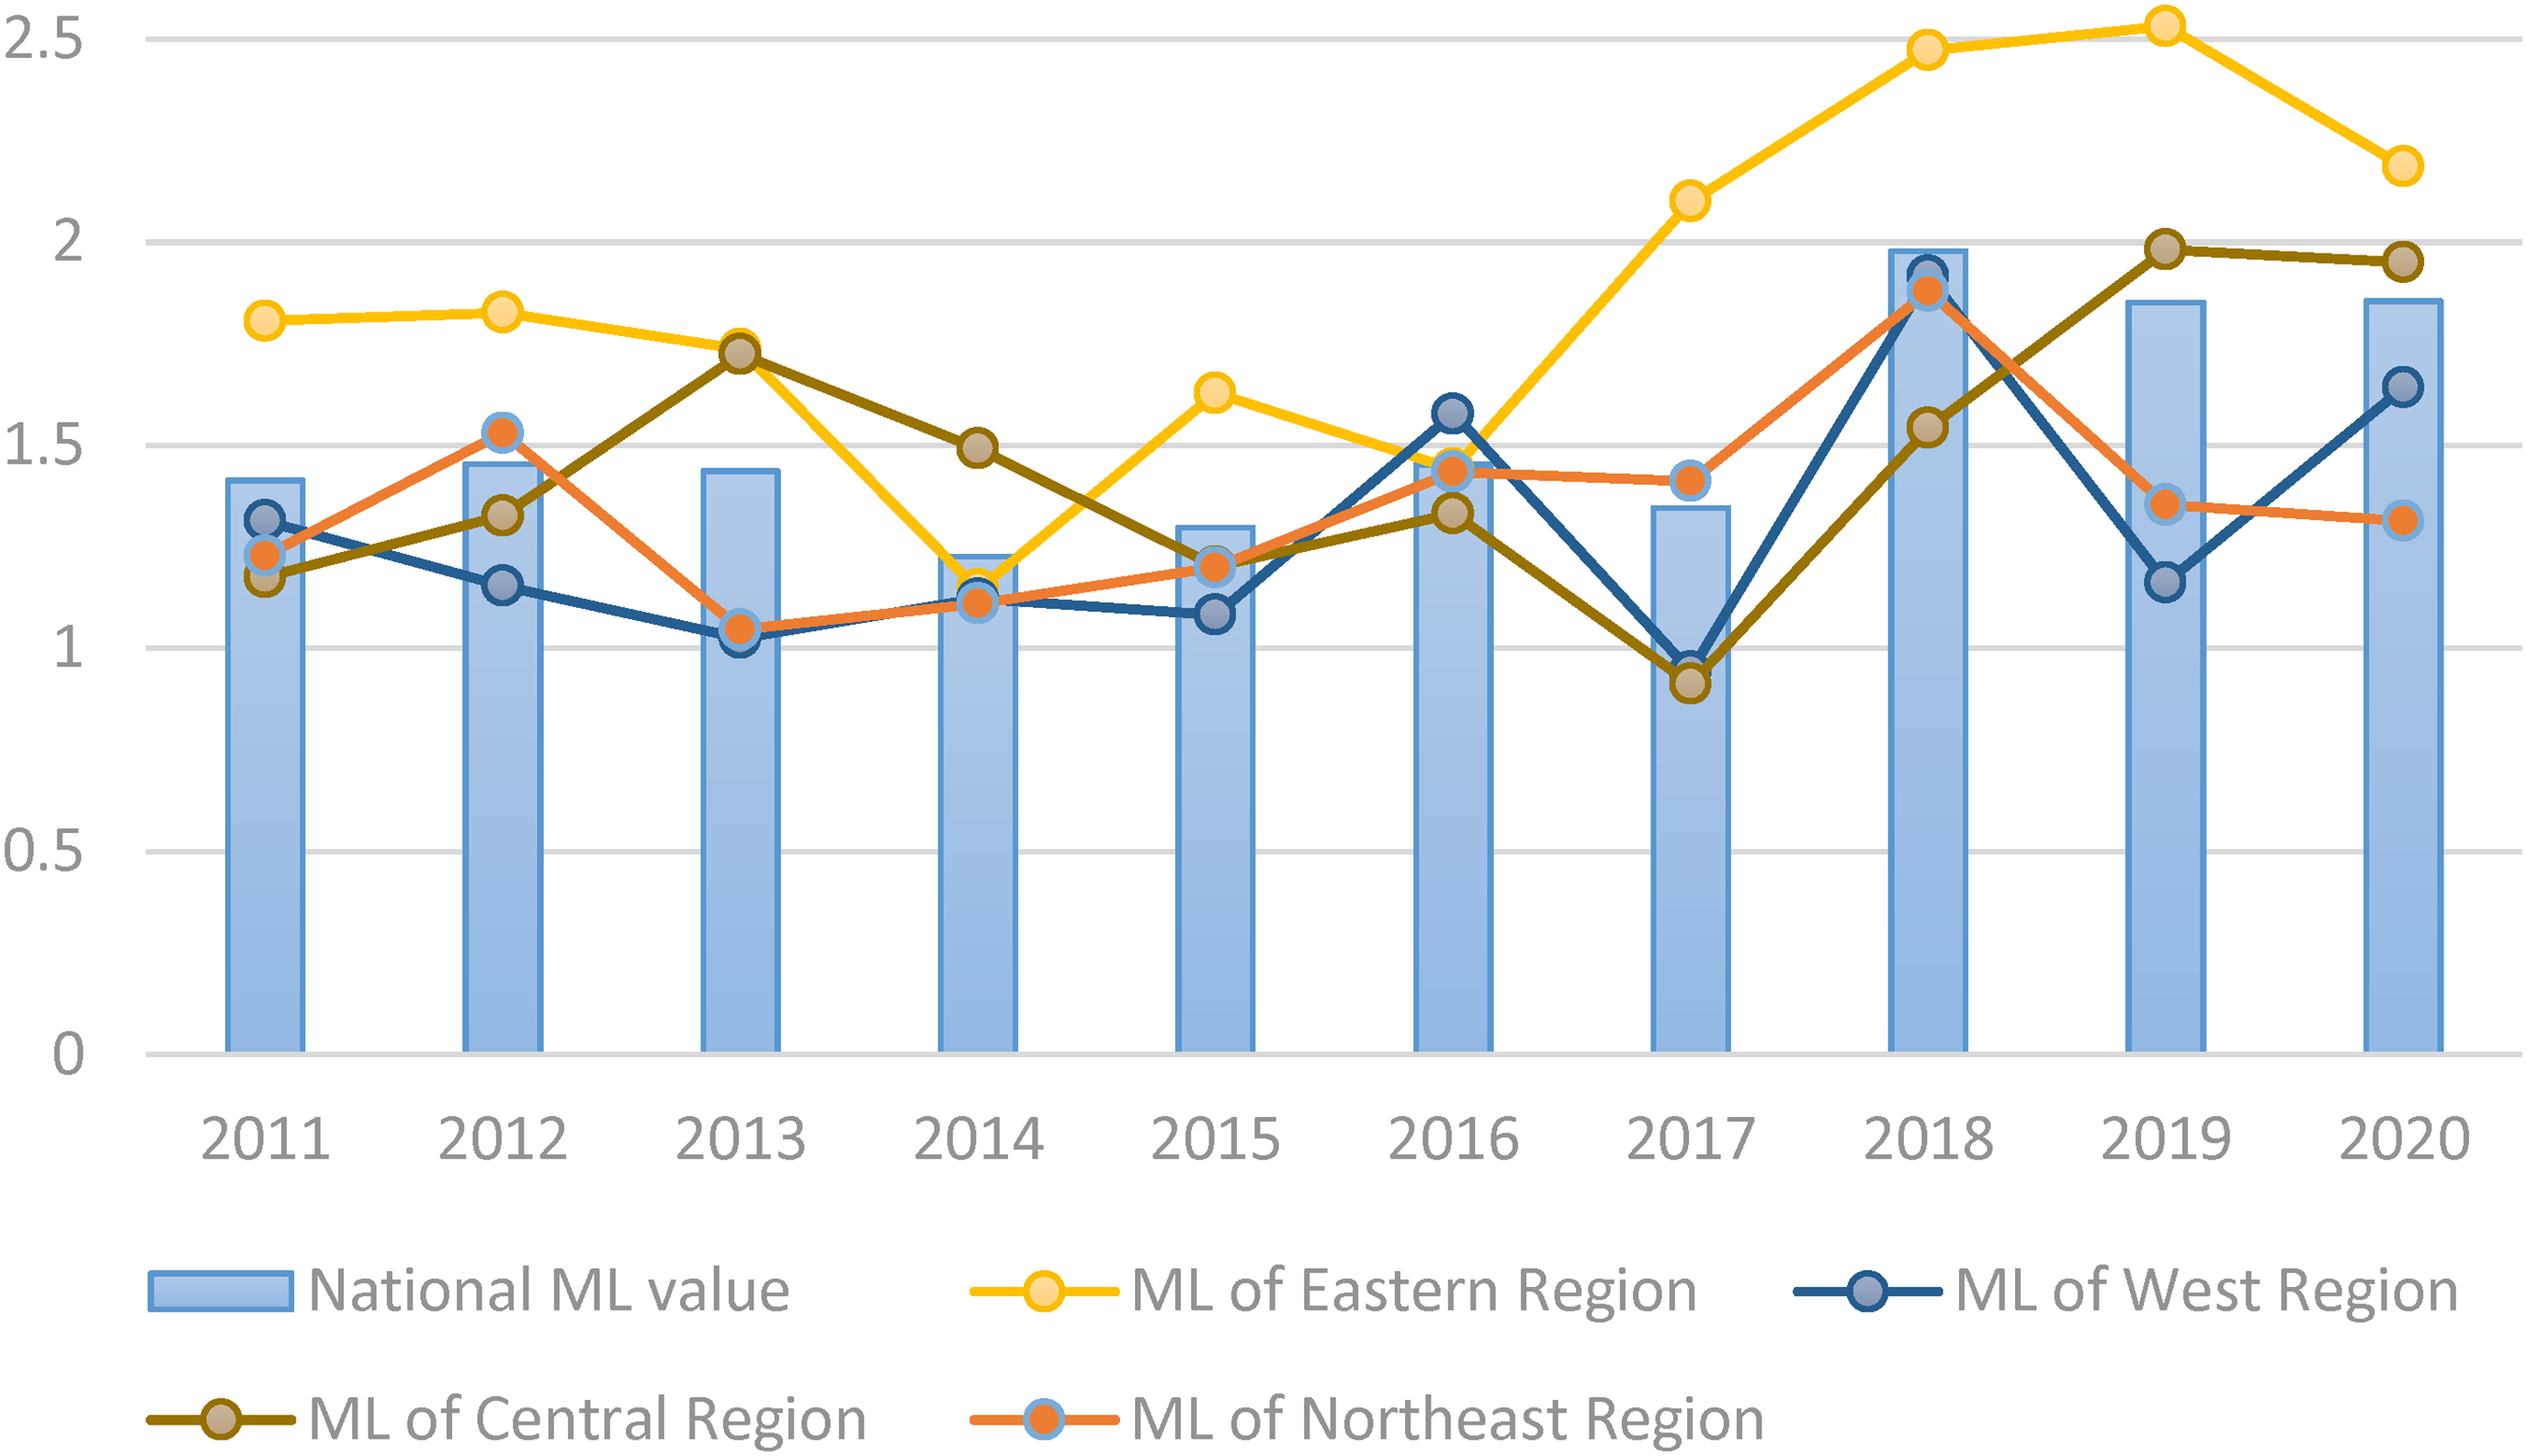
ML index values of major regions in China.
From a regional standpoint, several observations can be made. Firstly, in the eastern region, energy efficiency experienced a consistent upward trend, rising from 1.34 in 2011 to 2.52 in 2020. Secondly, the northeastern region demonstrated higher energy efficiency levels compared to the national average. Lastly, the western region exhibited slower growth in energy efficiency, increasing from 1.42 in 2011 to 1.73 in 2020, remaining below the national average. The central region experienced significant improvement from 1.09 in 2011 to 2.14 in 2020. The northeastern region had a relatively small change from 1.20 in 2011 to 1.30 in 2020, following the national trend. Second, there was a constant increasing trend in technical efficiency (EC) values in the eastern, western, and central areas in most years, indicating that technology developments were a major factor in improving energy use efficiency. The northeastern region, on the other hand, showed constant technical efficiency values (EC) without a clear yearly development pattern. Third, technical progress efficiency (TC) values showed an upward trend in the eastern and central areas in most years, demonstrating the favorable impact of technology advancement on energy efficiency. Conversely, the western region exhibited notable fluctuations in TC values without a clear annual growth trend. The northeastern region had stable TC values overall, but without a clear annual growth trend.
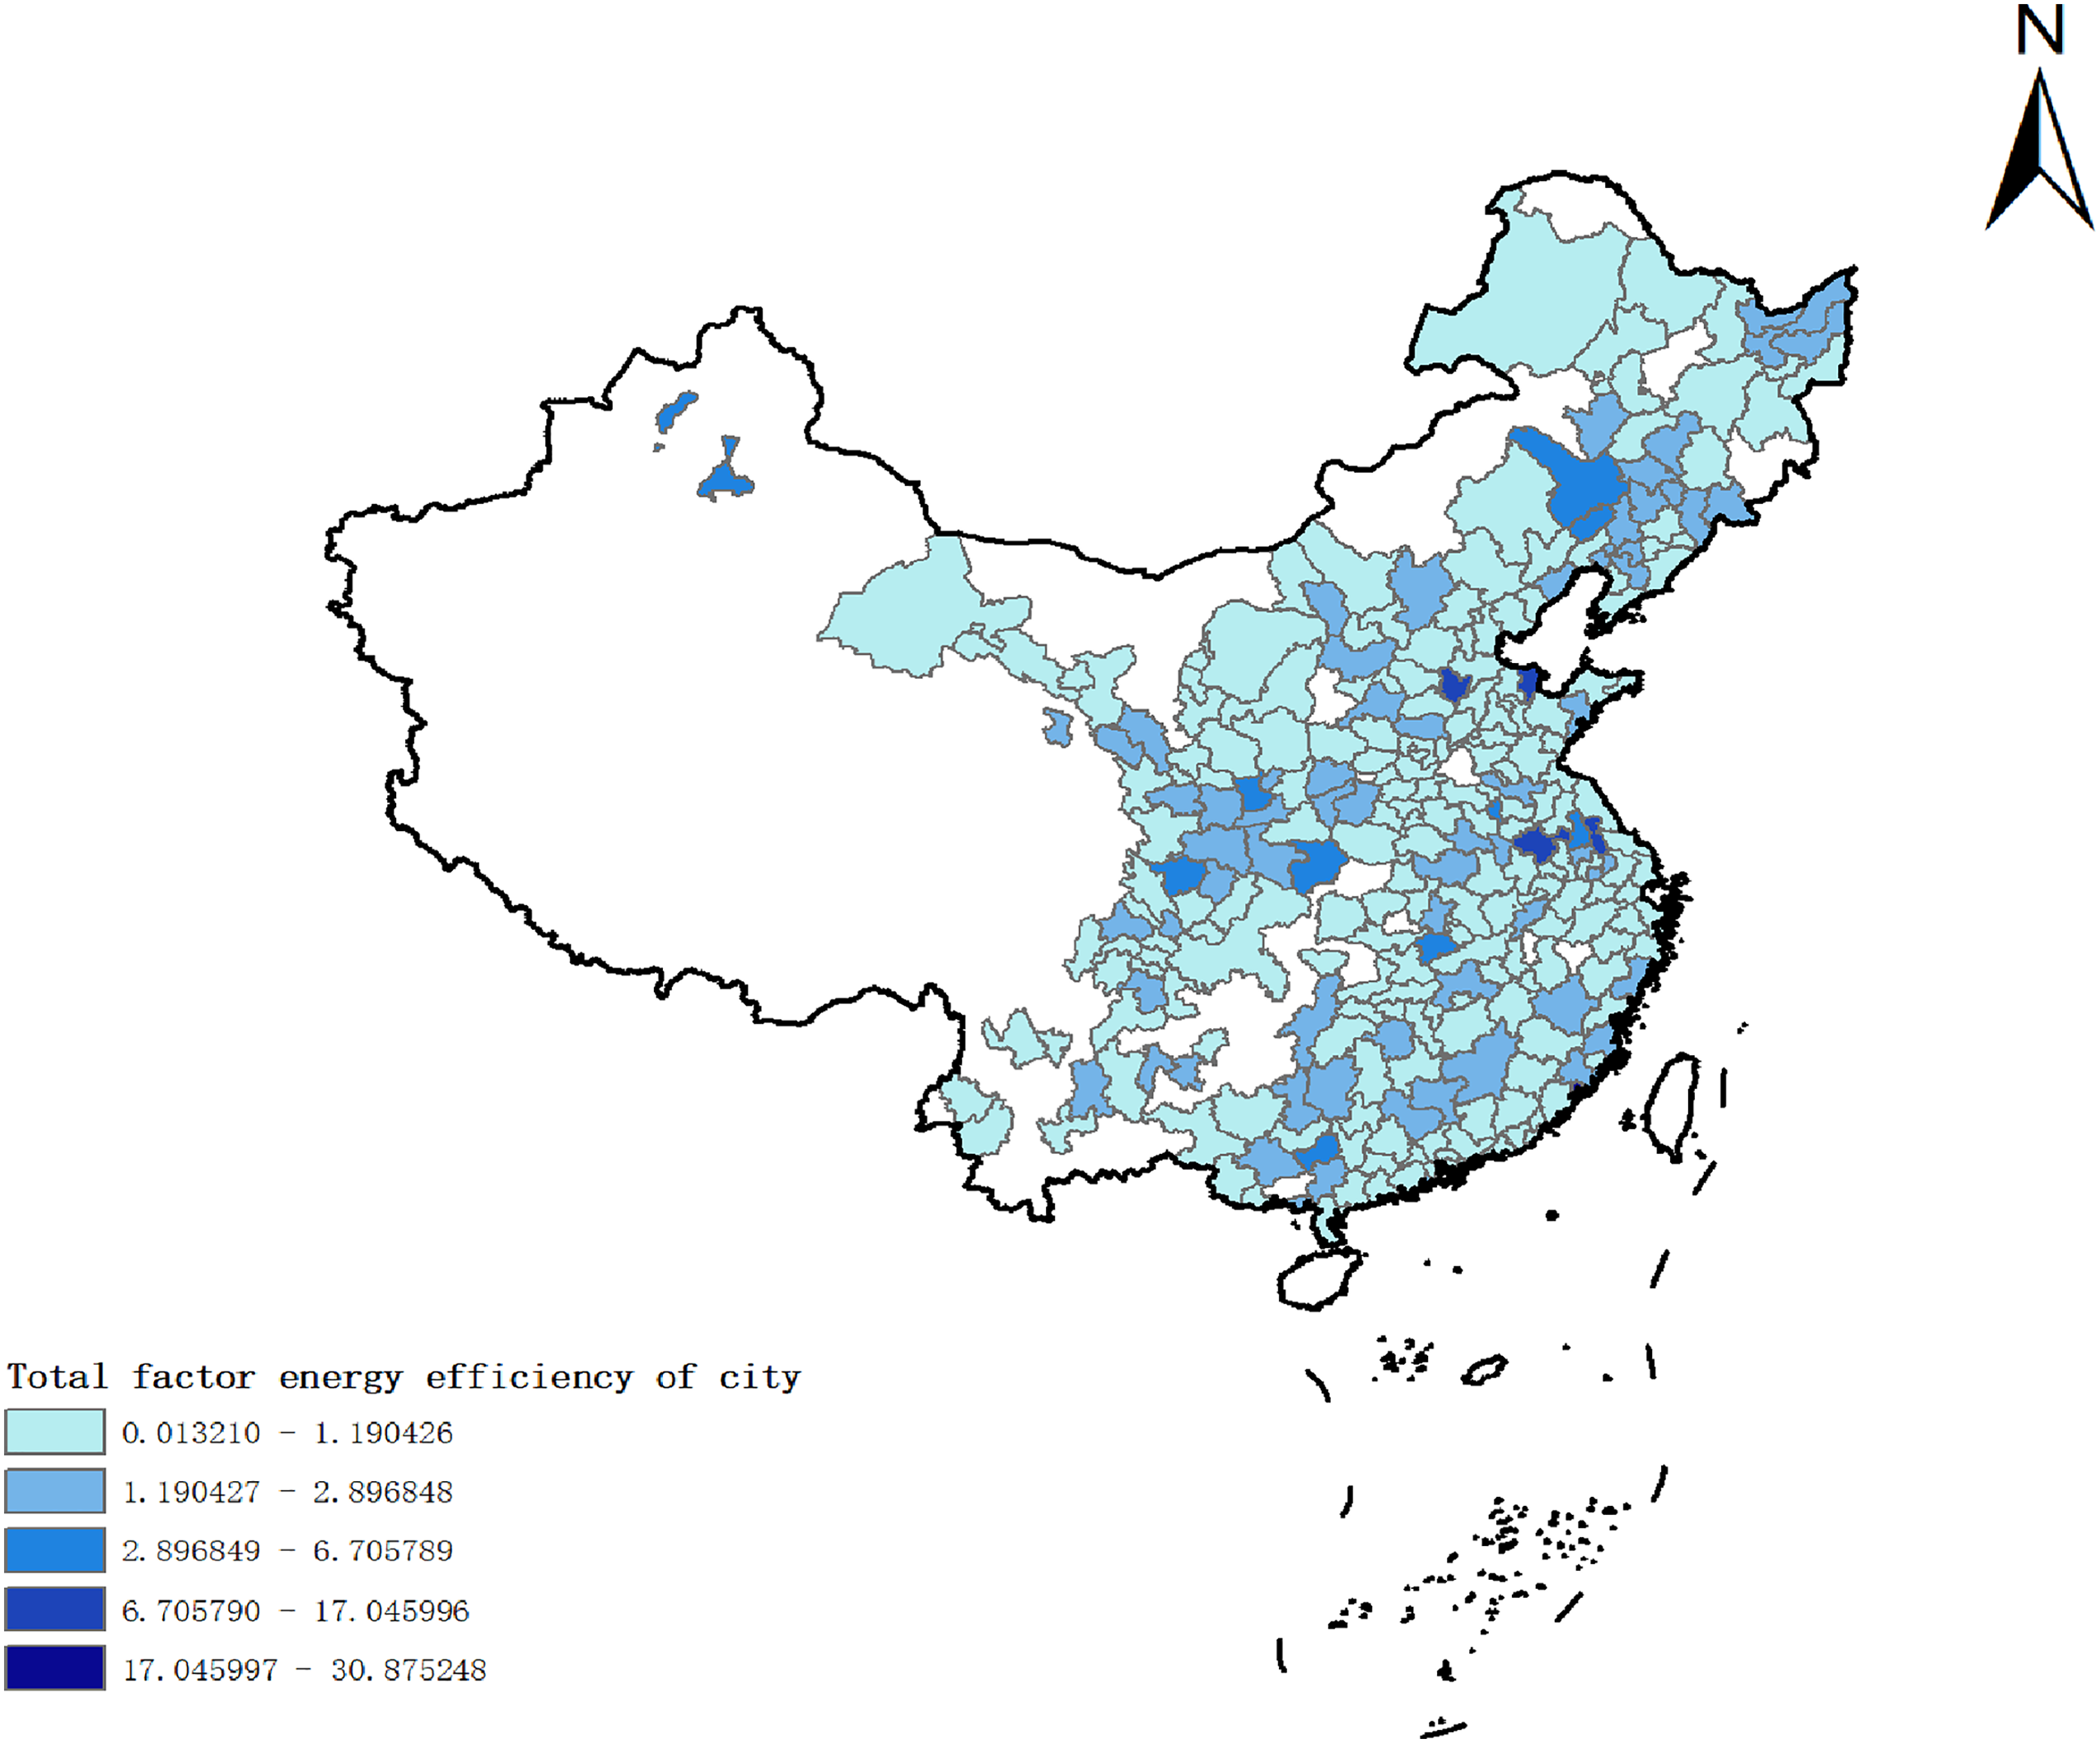
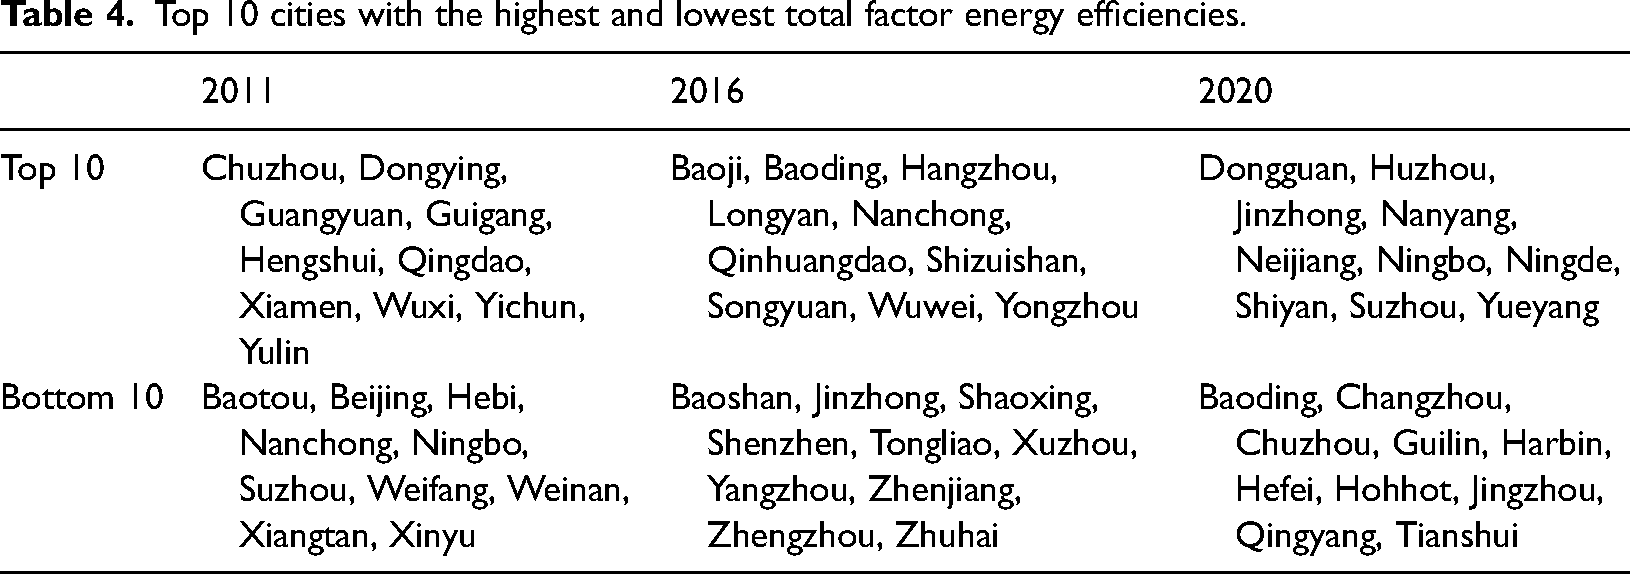
Figures 9 and 10 show the total factor energy efficiency study findings for Chinese cities in 2011, 2016, and 2020. Table 4 lists the top 10 cities in terms of energy efficiency from the perspective of major cities for the years 2011, 2016, and 2020 as Chuzhou, Dongying, Guangyuan, Guigang, Hengshui, Qingdao, Xiamen, Wuxi, Yichun, and Yulin. These cities have shown outstanding performance in energy utilization efficiency, serving as examples for other cities to learn from and emulate. However, Baotou is in the worst 10 cities in terms of energy efficiency in 2011, 2016, and 2020, Beijing, Hebi, Nanchong, Ningbo, Suzhou, Weifang, Weinan, Xiangtan, Xinyu, Baoshan, Jinzhong, Shaoxing, Shenzhen, Tongliao, Xuzhou, Yangzhou, Zhenjiang, Zhengzhou, Zhuhai, Baoding, Changzhou, Guilin, Harbin, Hefei, Hohhot, Jingzhou, Qingyang, and Tianshui. It is noteworthy that the total factor energy efficiency estimates of several cities exhibited significant variations after excluding external environmental factors. Cities like Ningde, Siping, and Yunfu have witnessed improvements in their total factor energy efficiency due to favorable external conditions. Similar to this, the central and western cities of Huainan, Jieyang, Zunyi, Zigong, and Xianning have also shown notable improvements in total factor energy efficiency. Certain instances show the existence of major energy-efficient cities in certain areas, demonstrating beneficial advancements in local energy efficiency (Figure 11).
Total factor energy efficiency of cities of China in 2011.
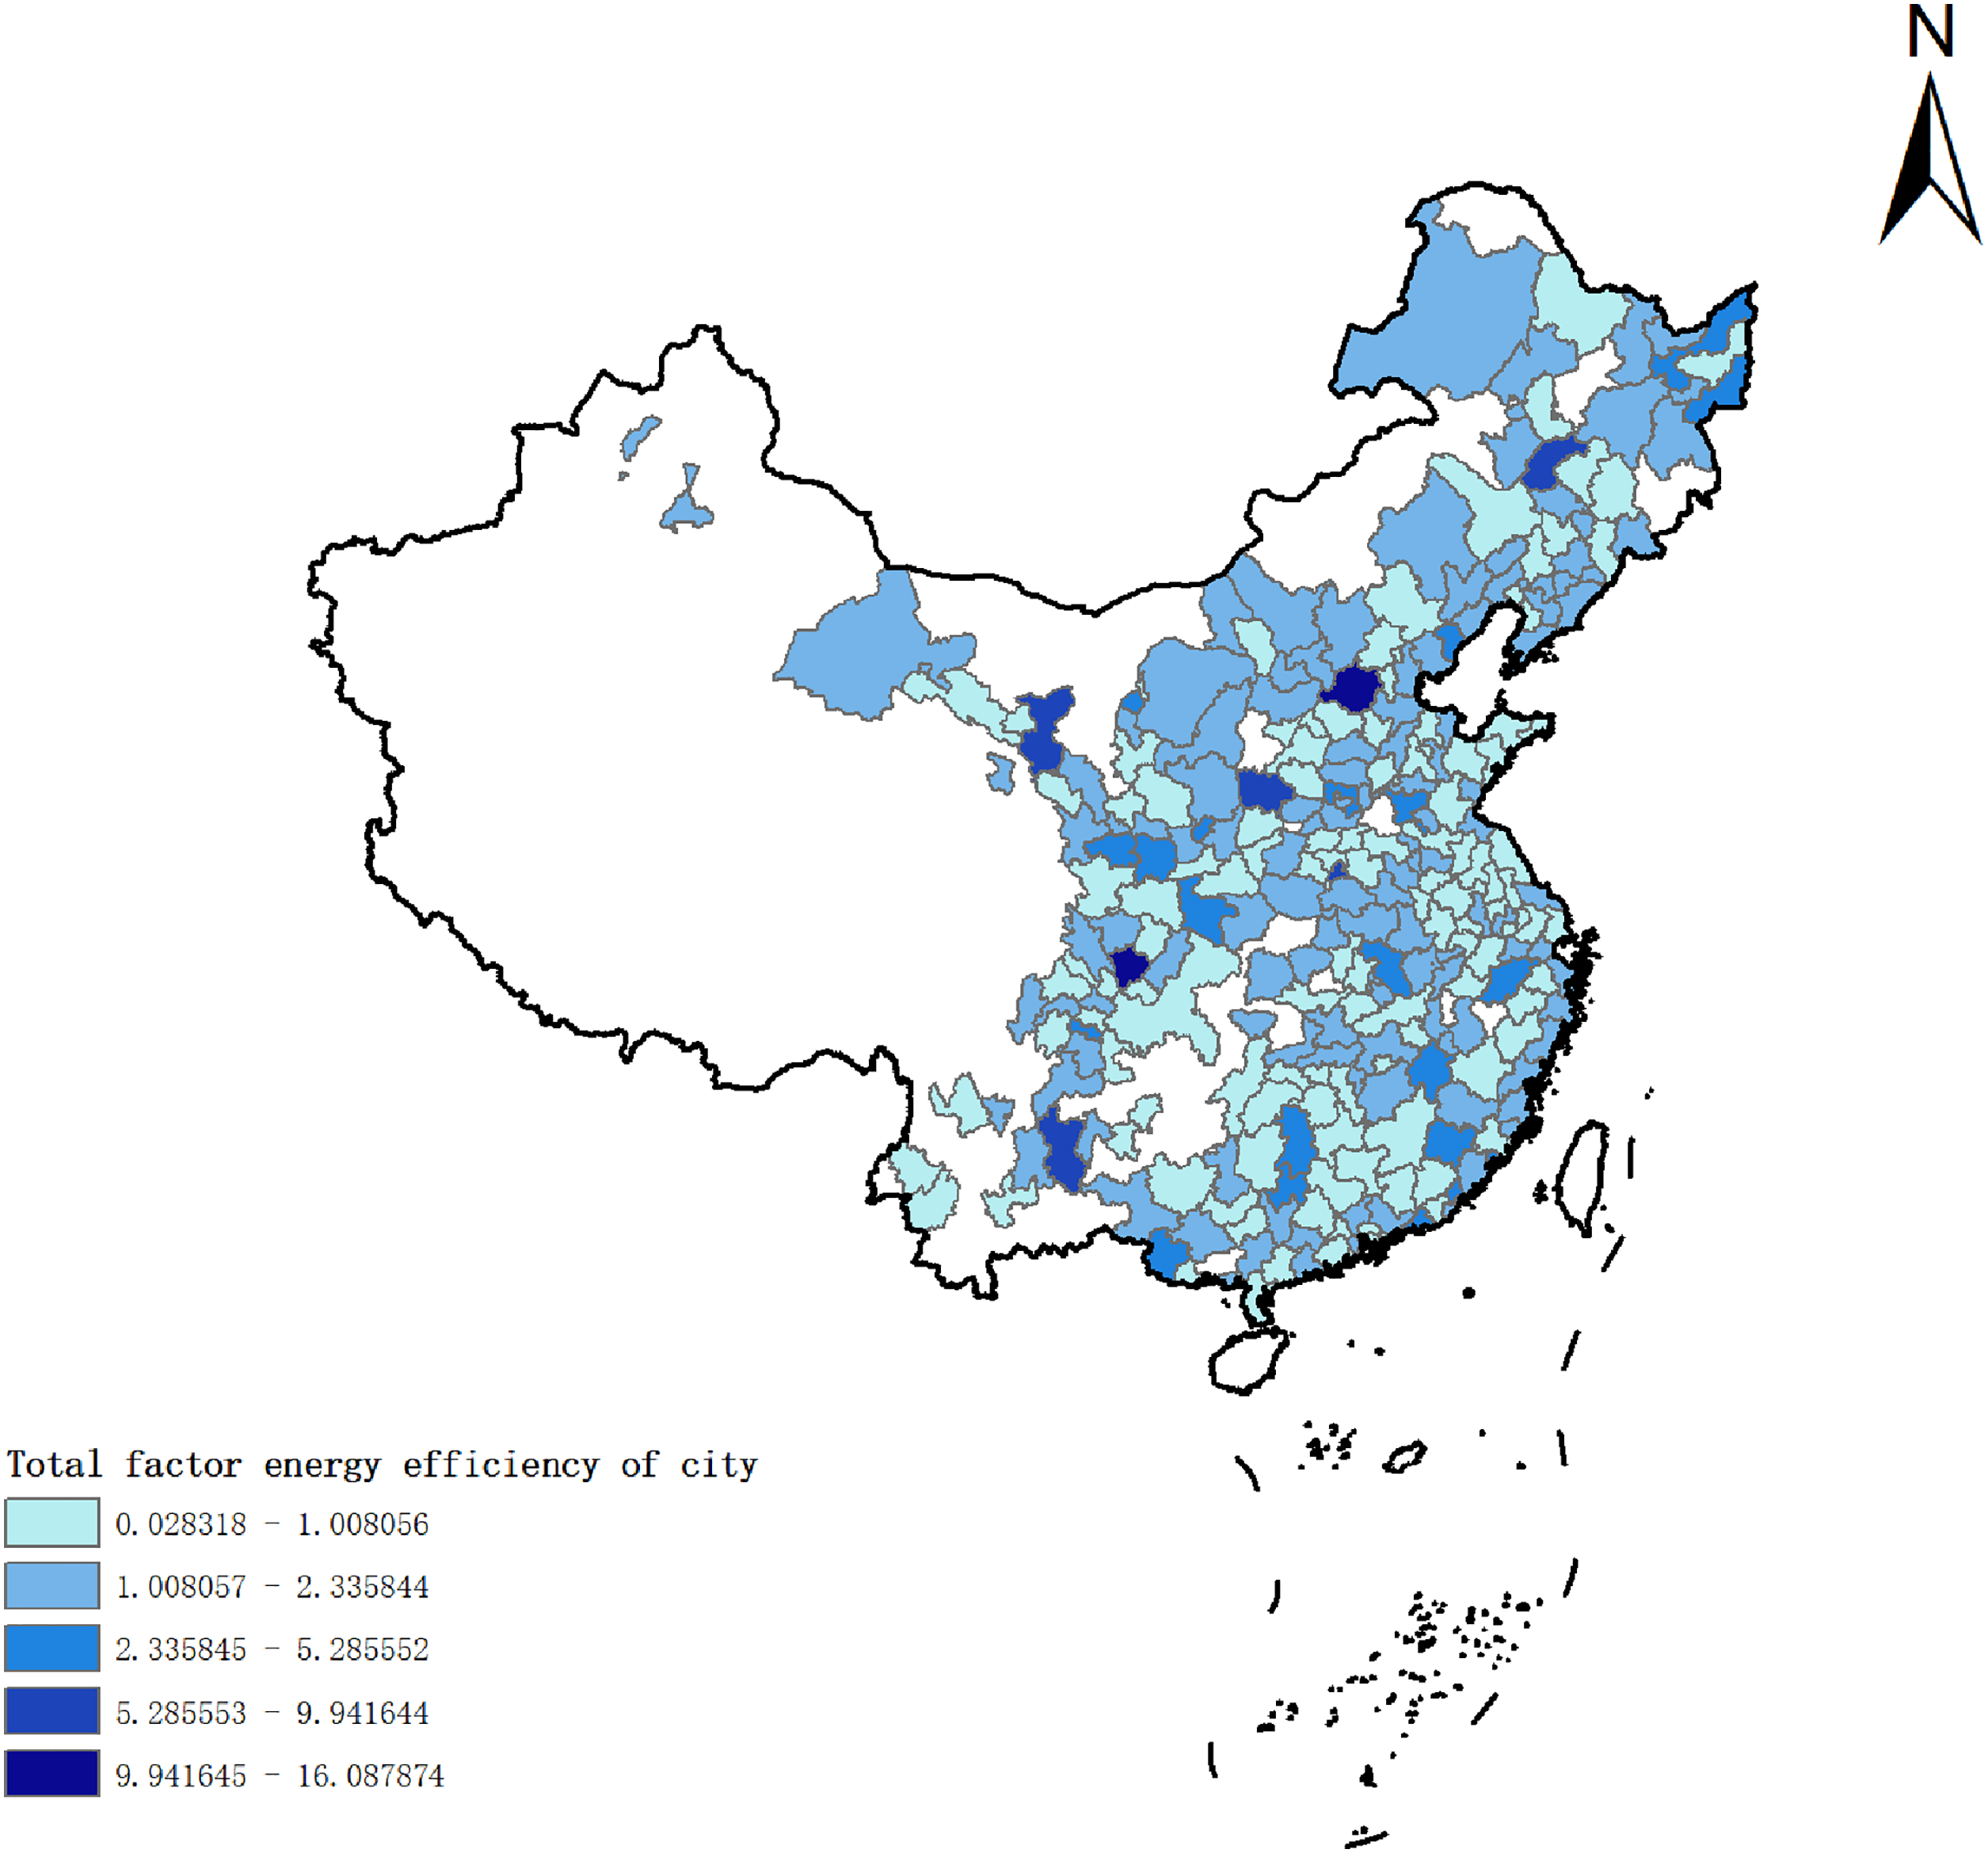
Total factor energy efficiency of cities of China in 2016.
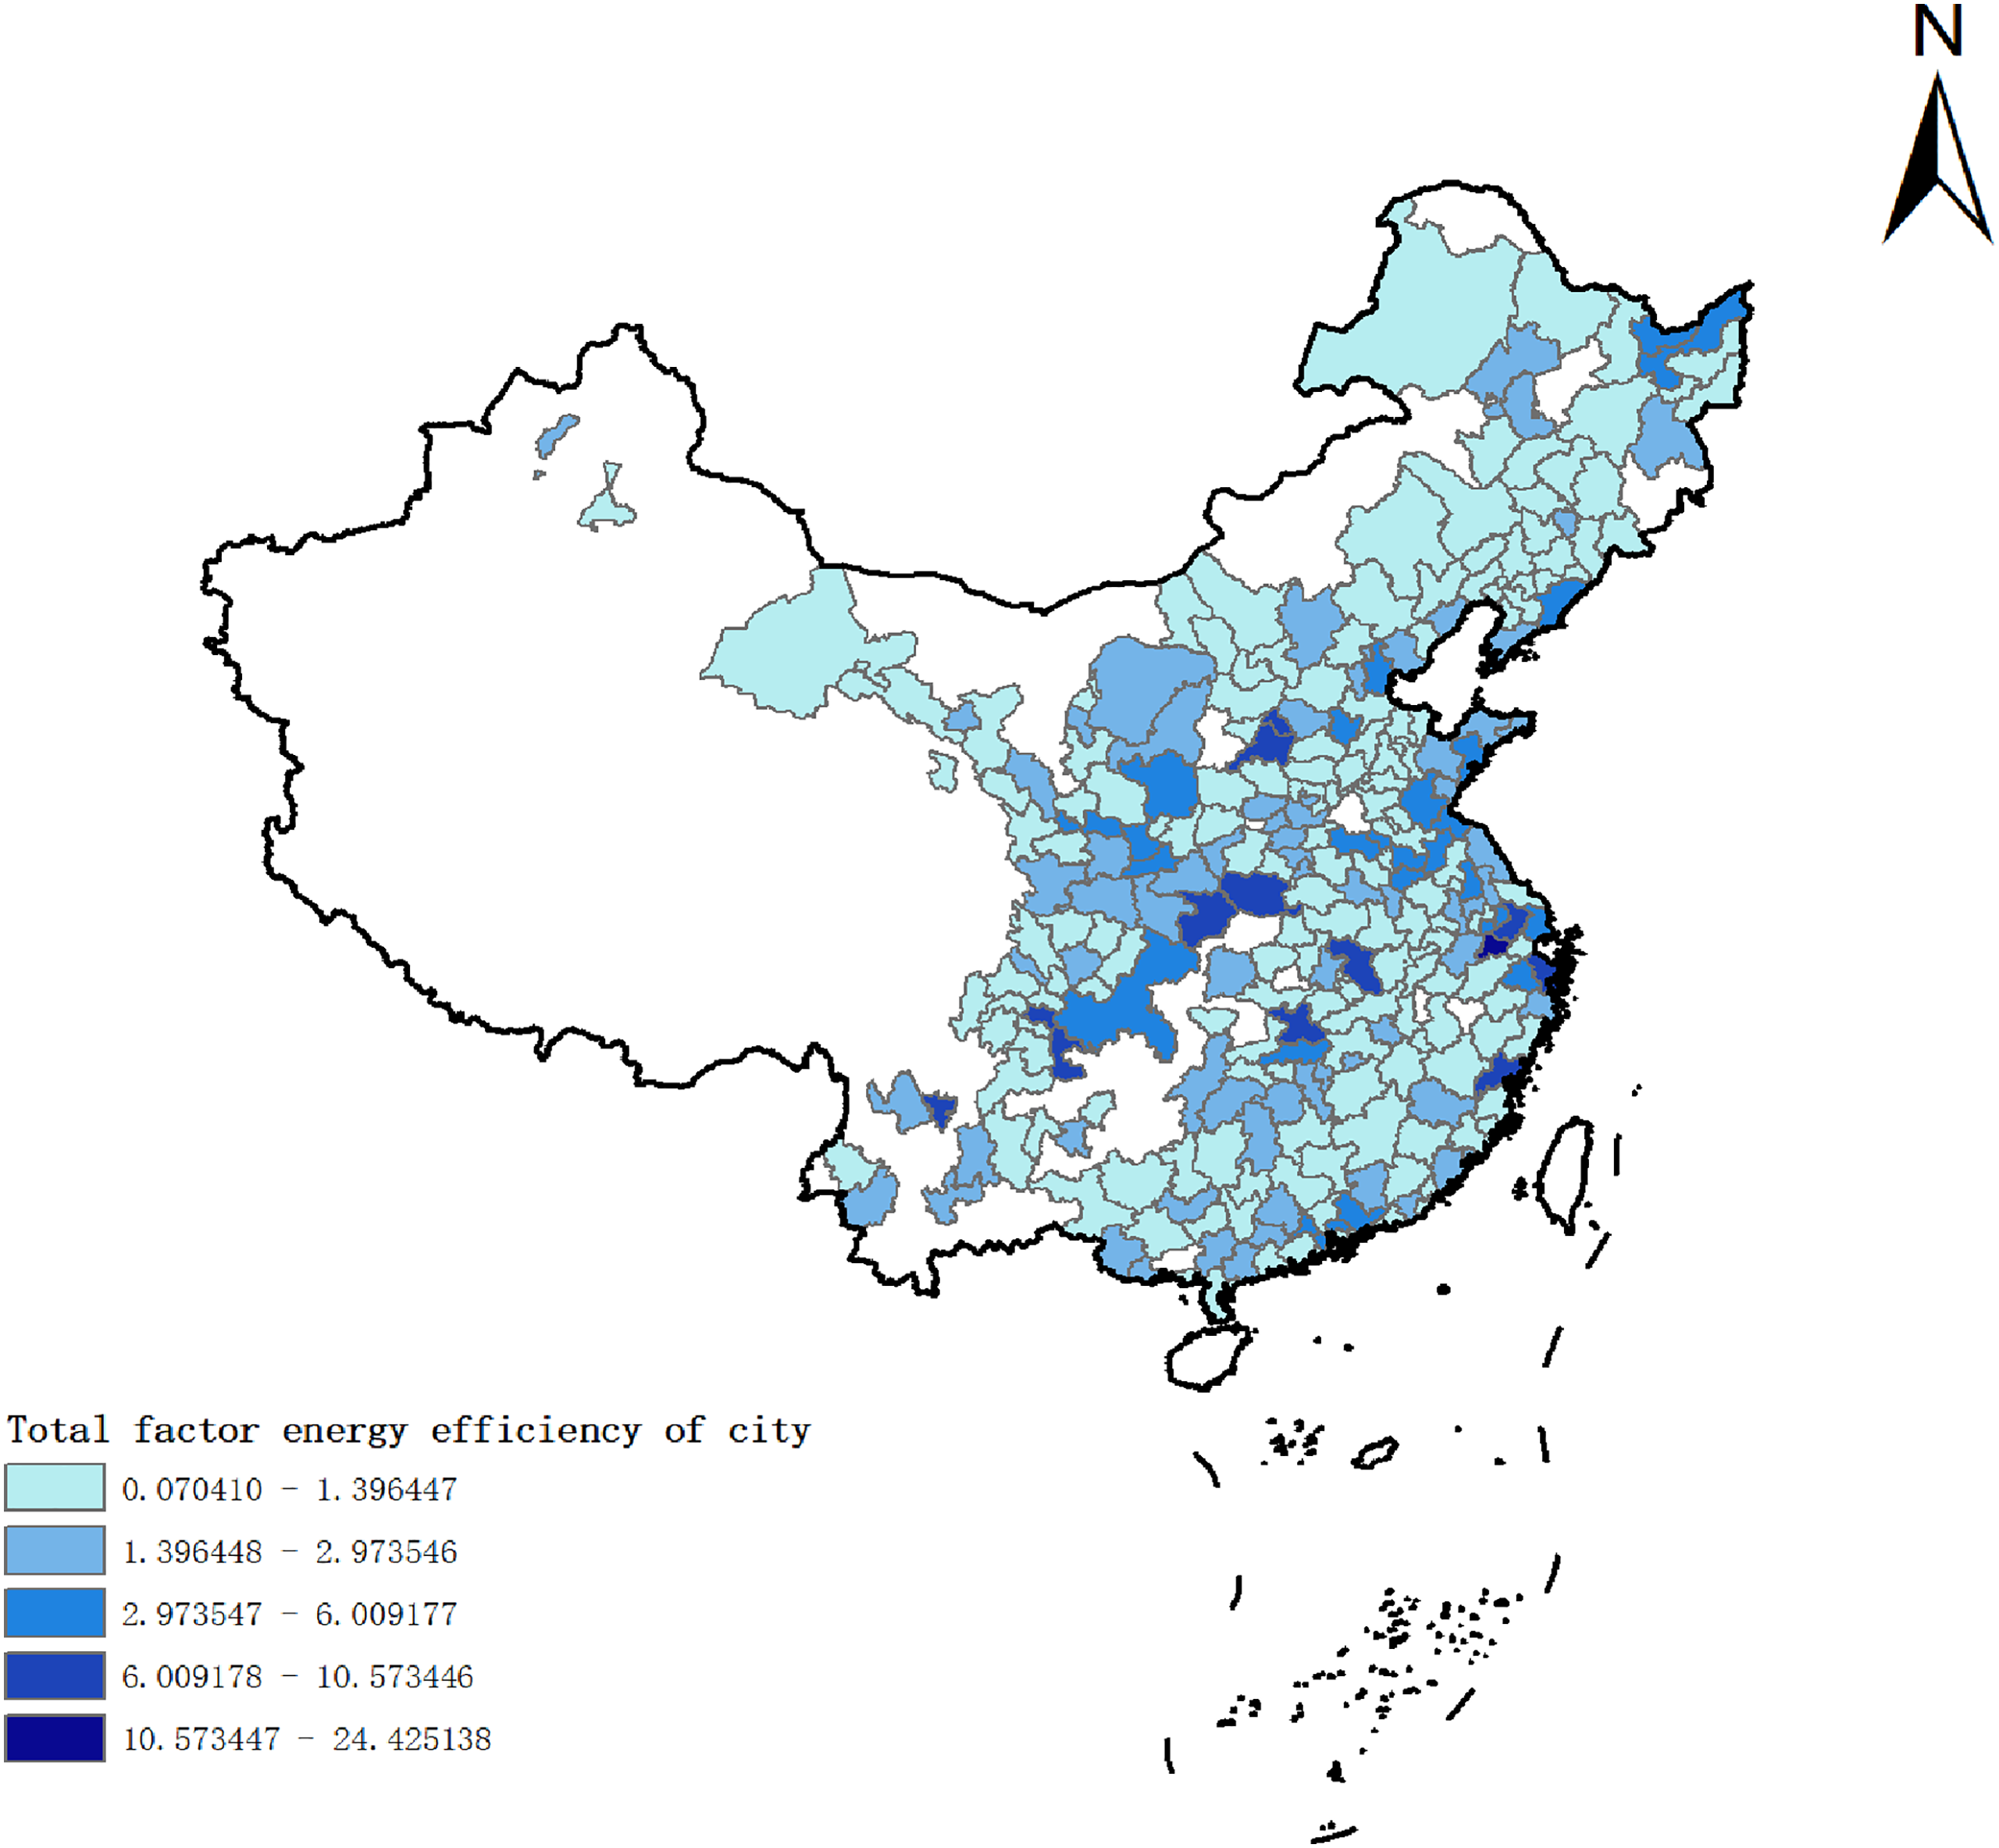
Total factor energy efficiency of cities of China in 2020.
Top 10 cities with the highest and lowest total factor energy efficiencies.
Conclusions
Measuring the energy savings from energy efficiency is crucial for tracking a country's development and progress towards climate change mitigation goals. This study conducted a comprehensive assessment of total-factor energy efficiency spanning the period 2011 to 2020 across 270 cities in China. Considered both managerial and environmental factors, aiming to provide a thorough understanding of energy efficiency performance in these urban centers. Additionally, identified exogenous environmental factors and formulated recommendations for enhancing energy efficiency. Upon comparing this study outcomes with those of existing literature, several conclusions emerged that resonate with prior research. Taking inspiration from the work of Zhang et al., 64 which focused on eight economic zones in China, observed a decline in energy efficiency from the southeast to the northwest between 1998 and 2005. But in contrast, this paper underscored a significant correlation between governmental interventions and various factors such as industrial structure, population density, economic growth, and levels of scientific and educational achievement. Similar observations were reported by Zhang 65 and Huang et al. 66 While this study aligns with these established trends, it distinguishes itself by concentrating specifically on city-level evaluations, in contrast to the predominant focus on provincial units in other research. 67 Beyond reaffirming the southeast-to-northwest decline in energy efficiency, this study introduces novel and noteworthy insights relevant to cities. The primary findings are as follows.
First, there is a direct correlation between government interference, industrial structure, population density, economic development level, and degrees of scientific and educational advancement. Government intervention positively correlates with energy input, but negatively correlates with labor and capital input. The results suggest that the government may prioritize economic growth over environmental quality by lowering emission reduction and energy conservation requirements. The observed positive correlation between government interference and energy input aligns with studies highlighting the role of policy decisions in influencing energy consumption. 68 The negative correlation with labor and capital inputs is in line with research emphasizing the trade-off between government intervention and factors contributing to economic production. 69 The study provides a nuanced understanding by suggesting that government prioritization of economic growth over environmental quality, as evidenced by lower emission reduction and energy conservation requirements, may contribute to the observed correlations. Higher investment in the secondary sector is not favorable for conserving electricity investment. Population density does not enhance capital input or total-factor energy efficiency. Economic growth correlates well with input variables, but does not improve natural resource use efficiency. Although levels of science and education are positively correlated with energy, labor, and capital inputs, in some circumstances rising levels of science and education may make it more challenging to increase labor inputs.
Second, the overall rising trajectory in China's total-factor energy efficiency from 2011 to 2020 is consistent with studies emphasizing improvements in energy efficiency over time. 70 The identification of regional variances echoes previous research acknowledging disparities in energy efficiency levels across different parts of China. 71 The study offers a more nuanced perspective by highlighting that poor total-factor energy efficiency in China is primarily driven by technical efficiency, emphasizing the volatile nature of technological advancements’ impact on overall efficiency.
Third, the findings regarding substantial improvements in energy efficiency in the east align with studies emphasizing the economic and technological advancements in this region. 72 The slower increase in energy efficiency in the central and western regions corresponds with literature acknowledging the challenges faced by less developed regions in catching up. 73 The study uniquely contributes by emphasizing the role of technological advancements in driving continuous improvements in energy efficiency in the east and central regions. The fluctuating technological progress efficiency in the west region, without a discernible yearly pattern, adds a novel dimension to the understanding of regional dynamics.
In summary, the study's findings help to clarify the existing state of affairs and regional variations in energy efficiency cities in China. The following suggestions are offered in response to these findings.
Promote technological innovation and research and development: In order to expedite the progress of novel energy technologies, energy-efficient technologies, and clean energy technologies, it is crucial for regions to amplify their investments in scientific and technological innovation, as well as research and development (R&D). By increasing their financial commitment to these areas, regions can actively foster the development and deployment of innovative solutions that contribute to the advancement of sustainable energy. This involves providing support to research institutions and companies in conducting innovative research, as well as fostering and promoting technologies and products with high energy efficiency capabilities. Technical progress can significantly enhance energy efficiency, laying the foundation for sustainable growth. Increase energy management and planning: By creating and putting into effect energy efficiency norms and policies, regions should increase energy management and planning. Authorities can create a reliable system for monitoring energy usage, analyzing energy use, and identifying and resolving issues with energy waste and inefficient use. To expedite the shift towards a more sustainable energy framework, foster the generation and utilization of environmentally friendly energy, and diminish dependence on traditional fossil fuels, it is imperative to enforce efficient energy strategizing. This necessitates the formulation of all-encompassing and meticulously crafted energy blueprints that take into account elements such as renewable energy alternatives, measures to enhance energy efficiency, and the assimilation of eco-friendly technologies. Enhance cross-regional experience sharing: There should be increased experience sharing among different regions by exchanging successful practices and policy measures for improving energy efficiency. Through establishing cooperation mechanisms and promoting communication and collaboration among different regions, successful experiences from other areas can be learned from and the pace of energy efficiency improvement can be accelerated. Enhancing knowledge exchange and technology transfer includes setting up workshops, team-based research initiatives, and forums for experience sharing.
China may advance energy efficiency, encourage sustainable development, and promote resource conservation by putting the aforementioned suggestions into practice. By tackling climate change issues, cutting greenhouse gas emissions, safeguarding the environment, and encouraging economic growth, long-term sustainable development can be more easily achieved.
While this study provides valuable insights into the dynamics of total-factor energy efficiency in Chinese cities, it is essential to acknowledge several limitations that might impact the interpretation of results and the generalizability of findings. The study employs a three-stage super-efficiency SBM model, which, while sophisticated, involves certain simplifications. The model assumes linearity and static relationships, overlooking potential nonlinear and dynamic interactions that might exist in the real-world context. The simplifications in the model may limit its ability to capture complex, nonlinear relationships among variables. Future research could explore more advanced modeling techniques to provide a more accurate representation of the intricate dynamics involved. The study's findings may be limited by the inability to establish causation definitively. Future research could employ experimental designs or advanced statistical methods to strengthen causal inference. The study primarily focuses on energy efficiency, with limited consideration of broader environmental impacts. Ignoring externalities or unintended consequences may provide an incomplete picture of the sustainability implications of energy-related policies. The study's emphasis on energy efficiency may overlook potential environmental trade-offs or synergies. Future research could integrate a more comprehensive sustainability framework to account for broader environmental considerations.
Footnotes
List of Abbreviations
Authors contributions
ZT: formal analysis, software and conceptualization. H-qZ: writing—original draft preparation, methodology and data curation. F-rR: writing—review, editing and project administration. X-wX: investigation. X-yL: visualization. All authors read and contributed to the manuscript.
Declaration of conflicting interests
The authors declared no potential conflicts of interest with respect to the research, authorship, and/or publication of this article.
Funding
This study was supported by Jiangsu Province Social Science Foundation Project (22GLD019), Major Project of Philosophy and Social Science Research in Universities of Jiangsu Province (2022SJZD053).