



Abstract
The deepening understanding of the environment has heightened our perception of the causes of environmental damage, promoting a shift from combating pollution to preventing it with a core emphasis on environmental protection. Academicians and governance authorities have shifted their focus from traditional production practices to green production practices (GPP). The current body of literature has explored the impact of GPP on environmental quality. Whereas, the implications of geopolitical risk (GPR) and environmental policy stringency (EPS) on GPP are still unexplored. Keeping in view these gaps in existing research, this research is the earliest endeavor to examine the impact of GPR and EPS on GPP for the group of seven (G-7) countries from 1990 to 2020. In this regard, we have applied panel quantile regression (PQR) which allows for a more flexible treatment of heterogeneity and is robust to deal with outliers and skewed distributions compared to traditional panel data techniques. The empirical findings reveal that GPR has a significant destructive impact on GPP whereas, the EPS upsurge the GPP in G-7 countries. Founded on the factual outcomes, we recommend policy recommendations to achieve the objectives of SDG 07 (affordable and clean energy), SDG 08 (exports for decent economic growth), SDG 09 (industry innovation and infrastructure), SDG 11 (sustainable cities and societies), SDG 12 (responsible consumption and production), SDG 13 (environmental policies for climate action), and SDG 16 (conflict, peace, and justice strong institutions).
This is a visual representation of the abstract.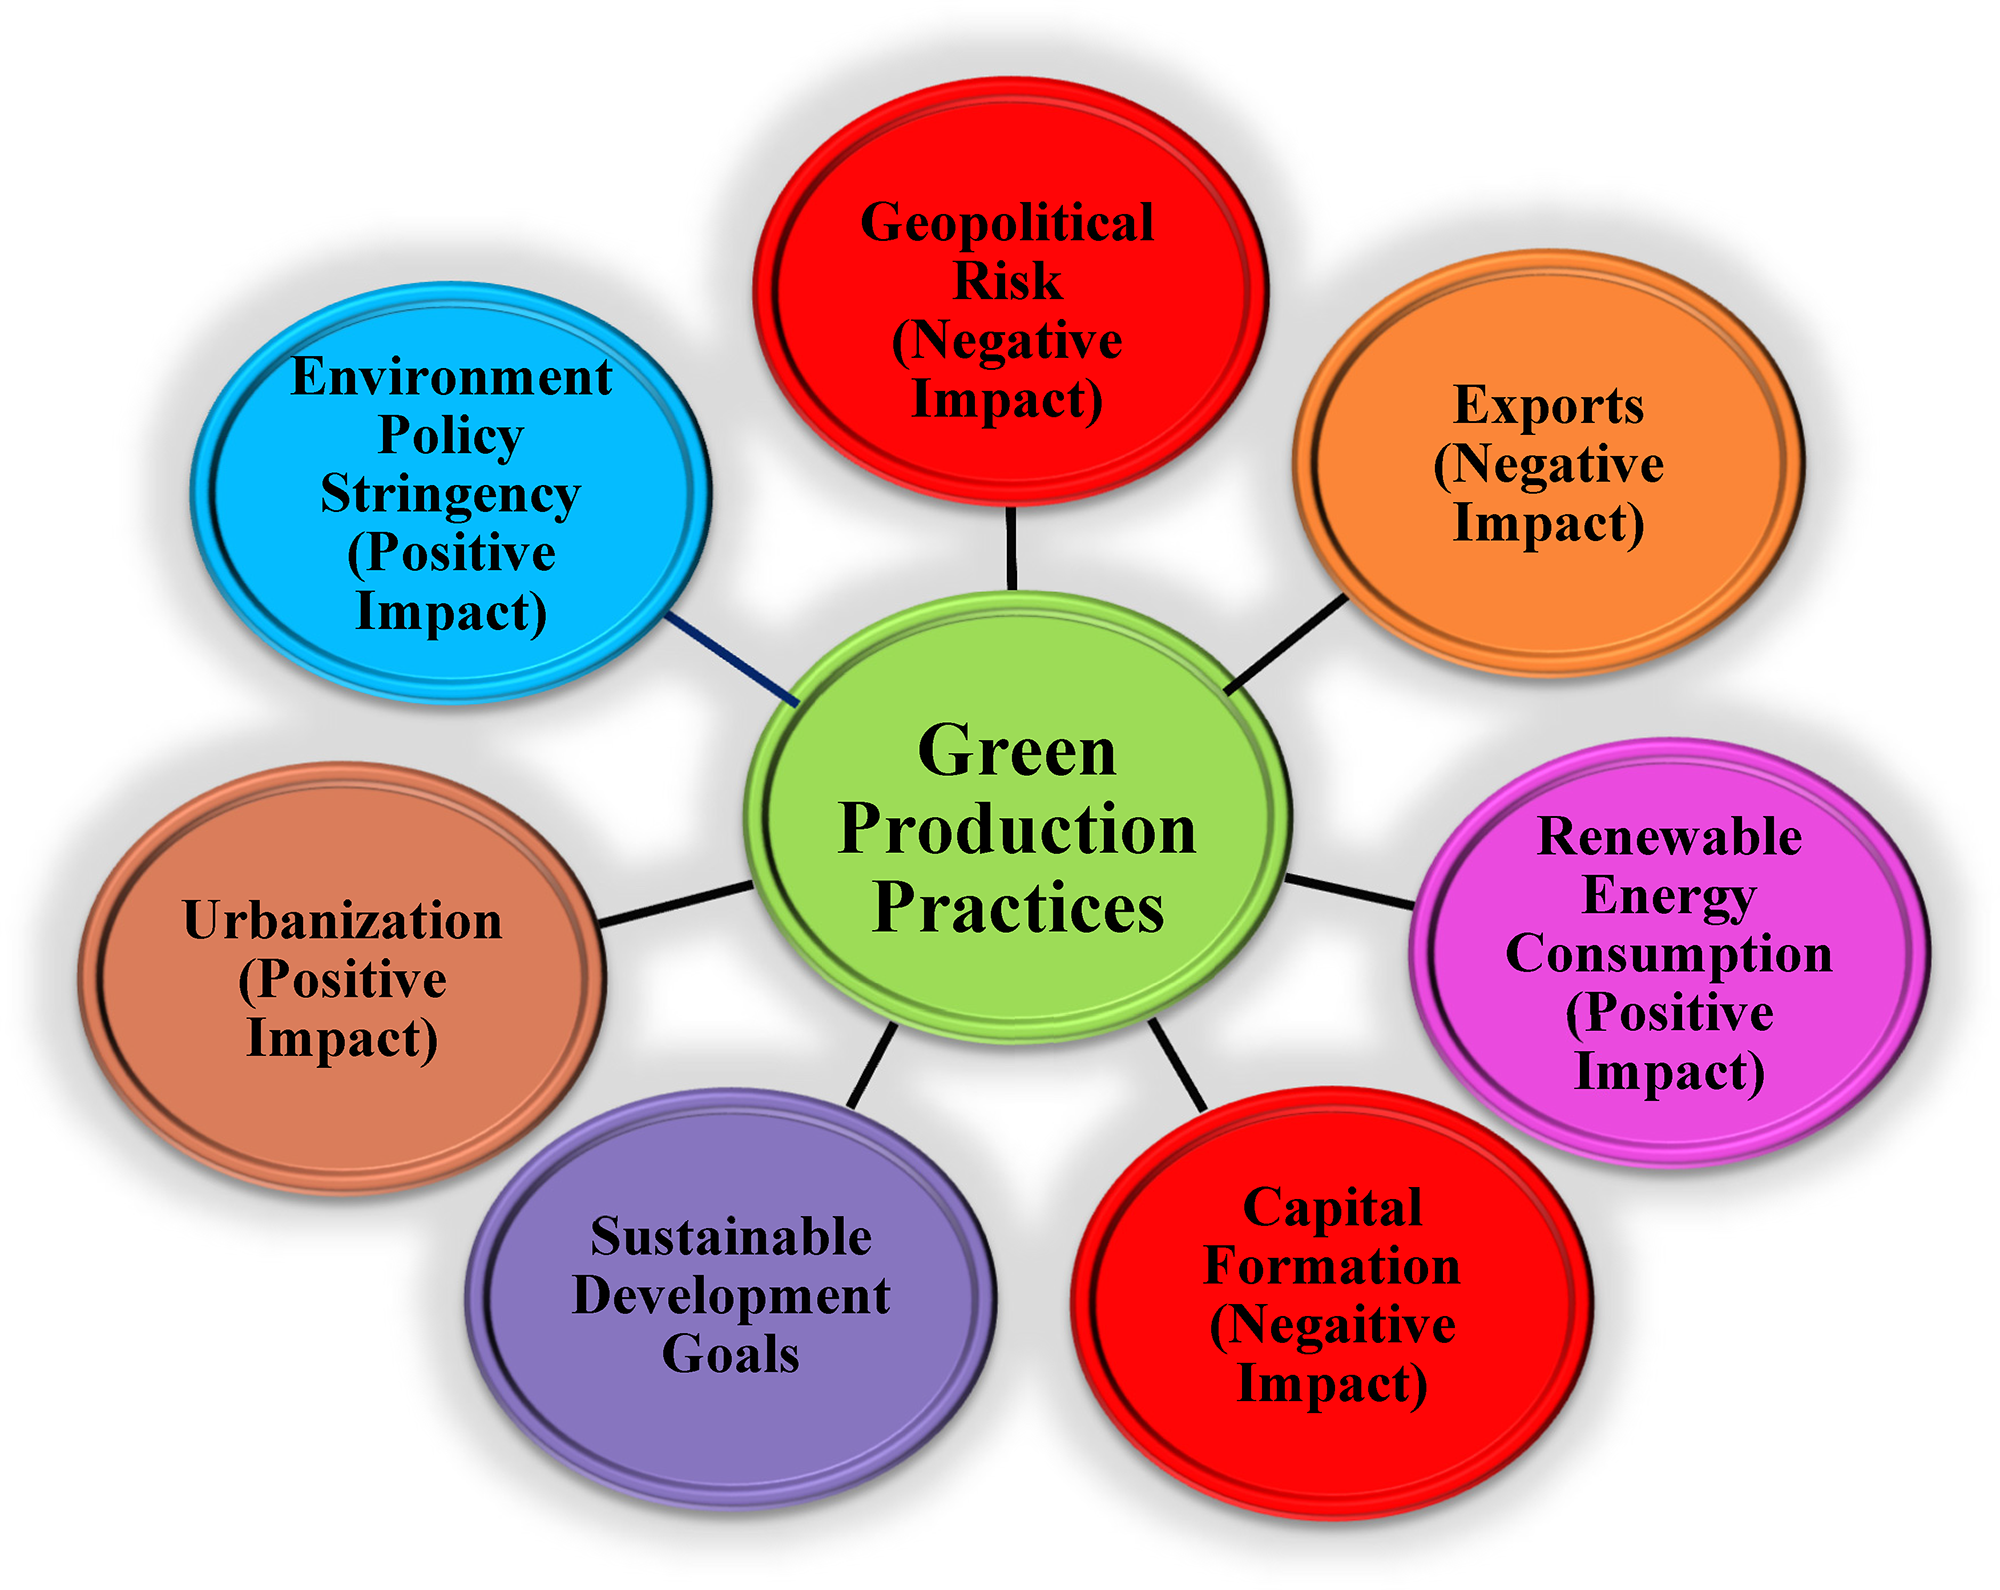
Keywords
Introduction
The deepening understanding of the as heightened our awareness of the causes of environmental damage, prompting a shift from combating pollution to preventing it as the central focus of environmental protection. 1 Though pollution control aims to curtail pollutant emissions at the end of the process of manufacturing, it frequently overlooks the sources of pollutants, failing to address the issue at its root. 2 The fast depletion of natural resources and rising awareness about environmental damages have put stress on the role of sustainable production practices; that are based on green technologies. 3 Since the nineteenth century, the continuous advancement of globalization and industrialization has underscored the necessity to adopt environmentally sound practices that ensure the preservation of the environment. 4 Industries significantly are contributing a developmental role in the economies. 5 Despite this growth, concerns about the environment and pollution are increasing, encompassing issues such as environmental pollution, industrial waste, and high levels of carbon emissions. 6 On the same grounds, this severity of the problem has also been highlighted by Hashim et al., 7 industrial sector is one of the major contributors to the global warming by producing higher levels of CO2 emissions. This adverse role industry impacts the environment in dual ways; first directly through fuel combustion in manufacturing process of the industries, second, in an indirect way through adding pollutants to the environment. Strategical production actions have been taken globally to resist environmentally related issues. 8 To upgrade the business competitiveness and be more legitimate by showing environmentally responsible behavior, the firms might be given incentives to implement green production practices (GPP).9,10 Adopting GPP is all about shifting from conventional modes of production to resource-efficient and more resilient techniques of production. The more a business uses renewable energy sources, the less it generates waste. All this happened as a result of a transitional change impelled by investing in innovative technologies which are sustainable. 11 All these innovative initiatives build green infrastructure in a country which is crucial for sustainable development through incorporation of socioeconomic as well as environmental development. 12 Over the past couple of years, the significance of green development has instigated augmented to implement environmentally friendly production techniques. The debate on GPP usually takes place in the context of controlling environmental damages arising from the production sector. Business organizations adopt systematized approach toward GPP to mitigate impurities in the environment and to raise performance metrics. The whole process implies production units in a country adopt environmentally friendly techniques of production to control environmental threats.13,14 Executing green growth practices not only minimizes efficaciously the detrimental impact of businesses on the environment but also raises environmental responsibility.15,16
Following the earlier mention, there has been a conspicuous rise in geopolitical risk (GPR) around the world in the last several decades. This entails threats related to warfare, terrorist activities, disasters, militarism, and political turbulence. The world has observed a rise in warfare, terrorism, and political disagreements among nations, initiating unreliable policies. These threats have serious environmental consequences as well as covering social, political, and economic facets. 17 GPRs implicating wars, terrorism, and disputes within the regions are notably connected with the environment as they affect the affordability of renewable energy projects. 18 Destructive geopolitical incidents affect the direction of investment expenditures, transitioning money to less profitable such as restructuring the infrastructure and rehabilitating services. 19 GPR also increases organizational and public spending, thereby crowding out investment from the private sector. 20 Geopolitical threats diminish the administrative effectiveness of government resources.21,22 GPRs influence countries’ progress, R&D spending, technological advancements, and investment in renewable energy, leading to a rise in emissions. 23 Geopolitical issues can significantly hinder the usage of clean energy, with the main concern being the supply-side effects of geopolitical uncertainties. 24 Considering the demand side negative effects of GPR, people will need to hold more money heading for other daily expenses, leading to reduced spending on renewable energy sources amid escalating costs of living. 19 This hinders the defensive savings effect and may lead consumers to delay current purchases, causing businesses to postpone current investments. 25 The green growth spectrum is adversely affected by GPR as investment decisions and international collaboration in green technologies and infrastructure experience a shortfall. The geopolitical tensions and conflicts disrupt the supply chain as well, which further deteriorates energy prices. All these negatively affect the green growth strategic plans of firms. 26
In the globally interconnected world, industrial countries historically produced a large amount of carbon emissions, leading to a lack of effective governance in environmental quality by environmental-related policies. Environmental policy stringency (EPS) has always played a crucial role in fostering green innovation. 27 The stringency of environmental policies (EPS) is generally considered the most practical approach to addressing the threat of environmental damage. 28 The EPS aims to increase the price of environmental and pollution services to a level where they are prohibitively expensive. This goal is intended to steer the nation's behavior, utilization, and manufacturing patterns toward a more environmentally friendly future. 29 There are multiple ways by which the government intervenes to create a people-friendly environment through its environmental policies. To stimulate investment in innovative techniques by lowering material costs to keep green goods competitive in pricing. 30 Due to the shift in opportunity cost, this strategy ensures that corporations choose to invest in environmentally friendly technology. It emphasizes the need for complete governmental regulations to operate markets designed with the latest technology relating to the environment. 31 Johnstone et al. 32 accentuate the government regulations to raise the demand for environmentally friendly technologies to promote economic growth.
The present study looks into the data series to check the ramifications of environmental standards and GPRs on the adoption of green production policies for several reasons. These G-7 countries including Canada, France, Germany, Italy, Japan, the United Kingdom, and the United States are not only modern economies producing about 30% of the world's gross domestic product (GDP), but also among the major contributing countries of CO2 emissions of about 23% around the globe as shown by Figures 1 and 2. The environmental standing of the G7 economies has conveyed reservations and triggered interrogations, specifically relating to environmental deterioration and greenhouse gas emissions. 33

Proportion of G-7 countries in total CO2 emissions. Source: BP-Statistics. 35

Countries’ share in the world's GDP. Source: World Bank. 36
The G7 countries have committed to lower carbon emissions in half by 2030 compared to 2010. This is an obvious cognizance of the vital need to shift from carbon-intensive energy sources to more economically effective, environmentally friendly substitutes. 34 Hence, these countries are raising investments in the area of research and development. 37 Apart from all these efforts to move toward practicing green growth production, the G-7 countries still have to deal with the problems relating to the degradation of the environment. 38 In this way, the environment's quality has become a substantial issue in G-7 nations, evoking extensive initiatives to amplify it through the execution of various policies and actions. Focusing on energy conservation and controlling the emission of greenhouse gases are the main concerns. 38
Keeping the above-mentioned facts in context, this piece of research evaluates the repercussions of GPR, EPS, renewable energy consumption (REC), exports (EXP), capital (CAP), and urbanization (URB) on GPP in G-7 countries based on the period from 1990 to 2020. The analysis adds to the existing published material in numerous ways. Firstly, as the GPR in G7 countries has been addressed in a peace-keeping mission dealing with developmental aid, and provision of military equipment. 39 Numerous studies have investigated G-7 nations to evaluate environmental problems consisting of renewable energy usage, technological progress, sustainable growth, and ecological footprints.33,38,40 This study is an initial endeavor that evaluates the impact of GPR and the strictness of environmental policies on GPP in the G-7 nations. Secondly, this study employs panel quantile regression (PQR) technique, offering several benefits compared to traditional regression technique. These merits include (i) generating a series of coefficients throughout the conditional distribution, (ii) potentially providing more thorough statistical results than traditional mean regression, (iii) being better suited for handling outliers, and (iv) proving more reliable when the accurate determination of error distribution is challenging. 41 Thirdly, this study is constructive for governing body of G-7 countries to design and implement climate-conscious measures to achieve the targets of SDG 07 (affordable and clean energy), SDG 08 (exports for decent economic growth), SDG 09 (industry innovation and infrastructure), SDG 11 (sustainable cities and societies), SDG 12 (responsible consumption and production), SDG 13 (environmental policies for climate action), and SDG 16 (conflict, peace, and justice strong institutions).
The next two parts of our research work, second and third sections, deal with review of literature and data, research modeling, and methodology. Finally, fourth section shows the results and discussion, and the last section covers concluding remarks and policy recommendations.
Literature review
The literature has been reviewed to build the theoretical links among GPP, GPR, and EPS.
Green production practices
With degradation of the environment and the rapid utilization of natural resources, there is a burgeoning necessity to focus on clean power-generating sources and environmentally conscious behaviors. 42 Business firms build and stick to GPP to lessen environmental damage. 43 These actions make provision for eco-friendly innovations with a plausible influence on the natural environment (Guo et al., 2020). The significant influence of green production techniques is also highlighted by Zhang et al. 14 for their crucial role in escalating the competitive position of firms and adding stability. Wang et al. 44 laid stress on the promotion of economic growth by not raising the amount of carbon emissions in the environment and named it, carbon neutrality. By employing the Tapio decoupling model on the data of 114 countries between the period 2002 and 2015, the study concluded that FDI accelerates both economic growth and pollution in the environment whereas, trade enhances economic growth but curbs CO2 emissions. These positive initiatives in the production sector imply direct and indirect influence on green development dimensions in the economy, which are prerequisites for environmental changes. These techniques by bridging the approach of business with environmentally inventive prowess create a balance between economic profits and environmental safety. These production techniques enhance innovations in the production sector to deal with environmental degradation to encourage business firms for efficient utilization of resources and competence. These practices strengthen the production units and raise their standards by reducing environmental damage. They are vital for manufacturing businesses as they accelerate green transformation, enhance performance, and boost green dynamism. Baah et al. 45 considering the developing countries emphasize that green initiatives are considered essential for the organizational growth of small- and medium-sized businesses. Zameer et al. 46 investigate the major sustaining drivers of green competitiveness among Chinese equipment manufacturing firms. The study relied on primary data collected through a survey method from administrators and clients of industrial tools manufacturing units. Consumer behavior is found crucial as it significantly enhances a company's green competitiveness and compels firms to adopt green manufacturing.
H1: GPR and environmental quality
The academic writings related to the implications of GPR on the environment do not directly emphasize green growth practices. It highlights the indirect effects of increasing the degree of CO2 emissions in the environment, which makes the adoption of green growth practices expensive due to a decrease in green growth investment and political disruptions in the countries. Such as Anser et al. 47 stated that GPR is associated with environmental impacts, particularly CO2 emissions. Research indicates that GPR leads to increased CO2 emissions in BRICS nations while using renewable energy decreases CO2 emissions in these countries. GDP, nonrenewable energy, and population growth all promote an upward trend in CO2 emissions. Husnain et al. 48 highlighted that environmental degradation in E7 countries is influenced by GPRs, as the use of non-renewable energy aggravates environmental harm while the adoption of green energy contributes to environmental restoration, but 49 when GPR rises, the significance of green energy consumption in abating emissions, decreases. It shows that GPR works as an obstacle in the way to obtaining net-zero emissions and dealing with climate change. Owjimehr et al. 50 elucidate how geopolitical incidents like supply interventions, armed conflicts, and political disruptions could harm energy markets and all these leading to price fluctuations and energy crises. It negatively affects the environment due to an increase in the use of petroleum and coal, or other cheap sources of energy promoting more carbon emissions.
Sweidan 51 clears up the influence of GPR on environmental density through the years due to perpetual changes in the determination approach due to ongoing geopolitical threats accompanying the unidentified factors. Syed et al. 52 highlight the negativity of GPR, especially in the form of CO2 emissions. This is more vehement in the lower quantiles of the variable. GPR also adversely affects the availability of green finance and ultimately the green growth practices due to unpredictable economic situations. Zhang et al. 53 explain that geopolitical threats in a country badly affect GPP, particularly green financing. All of this affects the stability of the money market and affording renewable energy sources. Nygaard 54 accentuates that a deceptive political environment also gives rise to GPR. It further affects the supply chain management of natural resources. To utilize resources efficiently, political soundness is necessary as it will reduce the dependence on GPR-sensitive sources of energy and replace them with renewable energy sources. Our study, keeping in view the characteristics of G-7 countries and related literature, hypothesizes an adverse and significant impact of GPRs on GPP. The theoretical linkage between GPR and GPP is presented in Figure 3.

Theoretical link between GPR and GPP.
H2: EPS and GPP
A stringent environmental regulatory system in a country plays a pivotal role in promoting GPP, as the increasing number of green patents in China and increasing patent requirements in OECD countries are linked with greater factor productivity. Uncertain policies discourage investments in innovative fields. The sound environmental set of policies promotes green innovations and helps to combat rising levels of CO2 emissions. 55 Li et al.56,57 investigated the nexus between economic development and the environment by applying a panel threshold regression model of 158 countries of different income brackets. The significant role of stringent environmental policy to protect the environment has been observed using natural resource rents. It is stated that the environment relating strictly policies of the government holds a central role in controlling the incompatibility between economic development and environmental protection. Wang et al. 58 explained how countries making speedy economic growth are confronted with the problem of increasing ecological footprint whereas, trade openness plays a significant role in this aspect. To test the environmental Kuznet Curve hypothesis the study used an extensive panel of 147 countries from 1995 to 2018 and employed panel regressions. The results concluded that trade protection policies in high-income countries were found highly significant in controlling environmental degradation. In simple words, rigorous environmental policy plays a significant role in promoting GPP. Strict regulations make production units forced to adopt green practices in their production units. It fosters innovations in production technologies along with controlling environmental damage. A level playing field, promoting eco-friendly technologies, and making the green technology sector attractive for investors is made possible by strict environmental policies. Countries with stringent environmental policies also cooperate to deal with global environmental crises. They become able to share and adopt advanced technologies to foster sustainable environmental development. 31
Wolde-Rufael and Weldemeskel 59 appreciated the sound environmental policies in BRICS countries. This rigorous regulatory mechanism enables the renewable energy sector more attractive for investments in it. The improved the level of environmental regulations, the lower the production of greenhouse gasses is to be observed. The shift to renewable energy and reducing CO2 emissions is galvanized by stringent environmental policies in BRICS countries. It has elevated the capacity of production units for green growth and controlling environmental degradation. Lin et al. 60 stated that stringent environmental policies work for inclusive environment feasibility to promote sustainable growth. It enhances the financing in green technologies and renewable power sources, which further promote innovations and manufacturing of sustainable goods and services. The proficient utilization of power resources and implemention of GPP lead to minimize costs and rise levels of competitiveness. It would be more challenging for the firms relying on fossil fuels. Looking for a parity between environmental conservation and economic expansion is crucial for a smooth progression to a green economy. Our study, keeping in view the characteristics of G-7 countries and related literature, hypothesizes a positive and significant impact of GPRs on GPP. The theoretical linkage between EPS and GPP is presented in Figure 4.

Theoretical link between EPS and GPP.
Methods
The detailed description of the analysis helps other researchers to replicate the study or to check the accuracy and consistency of our findings.
Model
The article aimed at exploring the influence of GPRs and EPS on GPP in G-7 countries. Within this setting, the study employs the Cobb-Douglas production function, in widespread use, and shows the technical relation between inputs and output. The standard production function could be written as:

Equation (1) stated above indicates Y as the production. This study replaces it with the notion of GPP; which means the output relies on green practices. On the right side of Equation (2), we have taken GPR, EPS, REC, CAP, EXP, and URB.
Hence, the new functional form of Equation (1) is transformed into Equation (2) given here under

Panel estimation techniques
To formulate econometric methodology, our study has applied advanced econometric techniques. This methodology encompasses five core steps: Firstly, common shock implications have been detected through Pesaran, 65 a test for cross-sectional dependency. Secondly, testing stationarity features of the variables used in the study by applying the Pesaran unit root test, CADF. Thirdly, to check, whether the variables of our study move side by side in long run and show a stable relationship or not, we have applied 66 panel cointegration test. Fourthly, to examine the relationships among the variables of our study over time and across different counties, we have applied the PQR technique that has been developed to tackle the limitations relating to simple regression analysis to capture heterogeneous effects across different quantiles of the dependent variable. Fifthly, to check the robustness of the outcomes generated through PQR, we further have applied fully modified ordinary least squares (FMOLS) and dynamic ordinary least squares (DOLS) which have abilities deal with endogeneity and serial correlation in data. We have chosen these panel data analysis techniques because again these techniques have several advantages over the simple ordinary least squares (OLS) regression.
Cross-sectional dependence test
At first, following our estimation strategy, we applied cross-sectional dependence (CD) test to ensure the presence of cross-sectional dependency in our data. In panel data analysis, the CD inception is the basic step. Therefore, we have employed Pesaran's CD test, which provides robust outcomes. It excludes the mean values while estimating the correlation values. The null hypothesis works for no CD in the data series whereas, the alternative hypothesis confirms the existence of CD in the data series. The CD test can be presented as:


Unit root tests
Second, we have conducted second-generation panel unit analysis as we observe cross-sectional dependence in our data. Hence, in the presence of cross-sectional dependence, the first-generation unit root may provide misleading outcomes.
69
The literature, therefore suggests parametric and non-parametric tests to avoid biased outcomes.
70
Hence, we have employed the second generation unit root test; the cross-sectionally augmented Dickey–Fuller (CADF) presented by Reference.
71
The null hypothesis of CADF deals with homogenous non-stationary, the statistics under the null hypothesis can be mentioned as:

Second-generation panel cointegration test
Before evaluating the long-run parameters, we employed the panel cointegration test by Westerlund
66
as it generates robust results in the existence of cross-sectional dependence.
72
The null hypothesis of this cointegration test works for the confirmation that there exists no cointegration for at least one cross-section for Gt, and all over the cross-sections for Pt. The equation of Westerlund cointegration can be shown as:





FMOLS and DOLS estimations
For empirical estimation, we have employed FMOLS and DOLS. The FMOLS technique was proposed by Phillips and Hansen
73
and dynamic ordinary least squares (DOLS) was proposed by Saikkonen
74
and Stock and Watson.
75
This FMOLS technique deals with the heterogeneous serial correlation of the error terms for the whole panel. Kao and Chiang
76
put into effect the DOLS technique for panel data. The DOLS possesses several advantages as compared to FMOLS and the OLS techniques of estimations while coping with a limited size of sample.
77
FMOLS and DOLS techniques estimate the long-run relationship among the heterogeneous groups and work for bias in the problem of endogeneity and serial correlation in multiple ways.
78
FMOLS and DOLS, both techniques are applied to confirm the robustness of the results.
79




Panel quantile regression
The mean-based estimation approaches might generate spurious results.80–82 Researchers have pointed out that techniques based on calculating mean show lower power to take into account the unobserved heterogeneity. Conversely, quantile-based models present advantageous support by making them capable of tackling unobserved heterogeneity and the impact of heterogeneous covariates. 83
The present study employs PQR. This technique of panel data modeling possesses many advantages over the simple panel data models based on mean values. It yields a group of descriptive-type coefficients explaining the structure of the data.
84
PQR can address the problem relating to outliers and provides dynamic results with slow decaying distribution contrasted with the traditional penal model.
85
PQR does not deal with the assumption of distribution.
86
The distinction between linear regression and quantile regression is given here under the following Equations (12) and (13).

In Equation (12), the number of cross-sections and periods are mentioned by i and t, respectively. The coefficients in Equation (12) are transformed into quantile coefficients in Equation (13) mentioned below:

In Equation (13), the coefficients depend on the
Data
The ongoing exploration analyzes the effect of GPR, EPS, REC, CAP, and EXP on GPP by employing the data of G-7 countries (Canada, France, Germany, Italy, Japan, the United Kingdom, and the United States) consisting of the period from 1991 to 2020. The selection of the time frame is determined by the data availability. We attained the data of GPP and EPS from OECD. 88 The data of GPR is taken from the website of policyuncertainty.com. Furthermore, the data relating to REC, CAP, EXP, and URB from world development indicators. 89 The variables have been used in their natural log form. The complete specifications of the dataset are listed in Table 1. Figure 5(a)–(g) shows the country-wise data trend after taking a natural log of the entire dataset.

Country-wise data representation: (a) Canada, (b) France, (c) Italy, (d) Germany, (e) Japan, (f) United Kingdom, (g) United States.
Sources information and measuring units of the variables implied in the study.

Note: The study has used all the variables after taking natural logarithmics.
Empirical findings and analysis
The empirical analysis and findings show the results of the data analysis used in this study.
Descriptive statistics
Prior to applying econometric techniques, the study investigates the features of data (Table 2). Explain the descriptive statistics. The mean values of GPP, GPR, EPS, REC, CAP, EXP, and URB are 0.542, 1.590, 0.747, 1.937, 3.071, 3.108, and 4.353, respectively. The maximum values of GPP, GPR, EPS, REC, CAP, EXP, and URB are 1.098, 3.955, 1.586, 3.171, 3.584, and 4.519, respectively. The minimum values of GPP, GPR, EPS, REC, CAP, EXP, and URB are 3.586, −0.010, −0.298, −0.693, −0.494, 2.767, 2.176, and 4.200, respectively.
Summary statistics.

The series of GPP, EPS, REC, EXP, and URB are negatively skewed whereas, the series of GPR and CAP are positively skewed. The values of Kurtosis show the convexity of the curves. CAP has the highest tail as it possesses the high value of Kurtosis whereas, GPP shows the smallest Kurtosis value, hence the smallest tail. The Jarque–Bera (J–B) test's results show the normality features of data. We observe that the p-values of the J–B test for six out of seven variables are less than 0.05, which opposes the null hypothesis of data normality and verifies the existence of outliers in the dataset. Under this set of conditions, the application of linear regression techniques is inoperative to tackle the problems of outliers. We apply PQR, which is capable enough to deal with the challenges like non-normality of data. Figure 6 illustrates the frequency distribution of data, which approves the results of the J–B test. The non-normality of data and the presence of outliers are shown by the higher and lower values.

Frequency distribution of the data.
Cross-sectional dependence test
The cross-sectional dependence test has been conducted to start the empirical investigations. In this regard, the Pesaran, Frees, and Friedman tests have been applied. The null hypothesis of these tests deals with the non-existence of cross-sectional dependence. The results of all three cross-sectional dependence tests validate the existence of cross-sectional dependence (Table 3).
Cross-sectional dependence test.

Source: Author's estimation.
*** represents significant level at 1%.
Panel unit root test
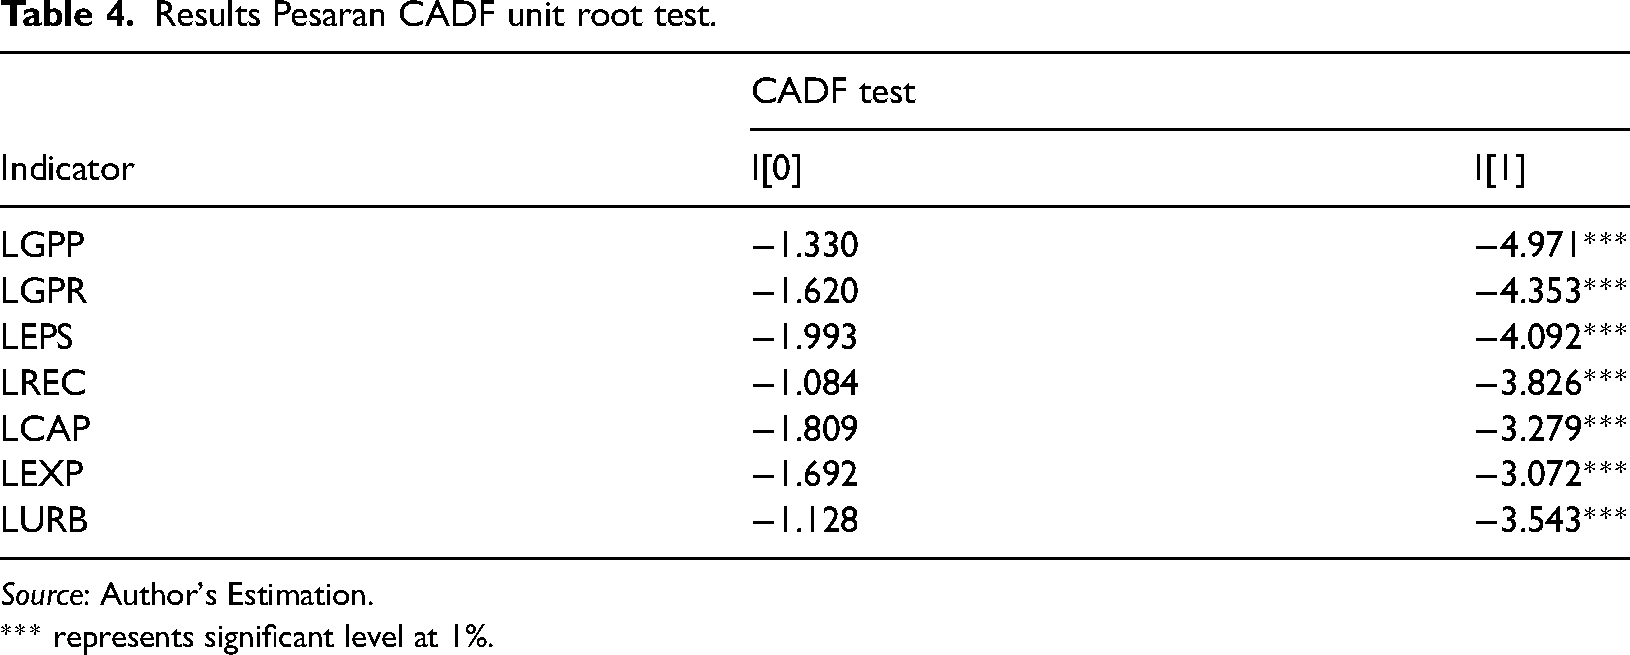
The study has implied the CADF unit root test, the second generation panel unit root test to cope with the problem of cross-sectional dependence at I(0) and I(1) presented in Table 4. It is obvious from the CADF outcomes that the data series at I(0) is insignificant whereas, the null hypothesis of homogenous nonstationary variables is rejected at a 1% level of significance in I(1). The results conclude that the variables of our study are stationary with homogenous variance at the first difference of the series.
Results Pesaran CADF unit root test.
Source: Author's Estimation.
*** represents significant level at 1%.
Panel cointegration test
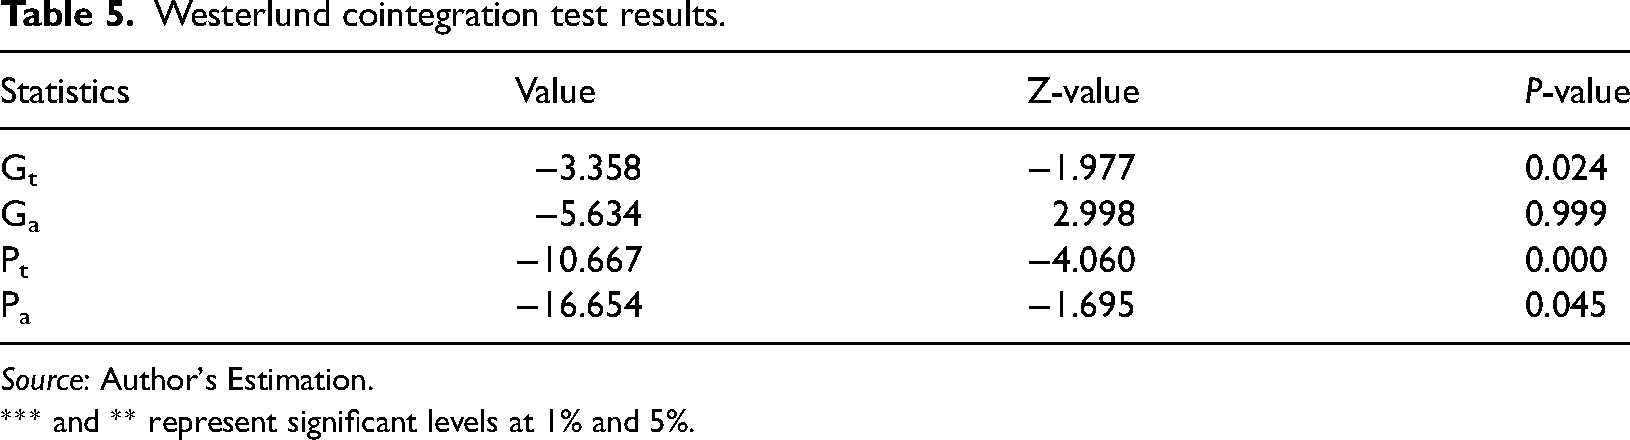
After analyzing the panel unit root analysis of our data, it has been confirmed that all the data series are stationary at first difference. This allows us to move further to check the long-run association among the variables. We are following the Westerlund, second-generation panel cointegration technique and outcomes are displayed in Table 5. We reject Ho of no cointegration between the variables at 1 and 5% levels of significance as shown with p-values of Gt, Pt, and Pa.
Westerlund cointegration test results.
Source: Author's Estimation.
*** and ** represent significant levels at 1% and 5%.
Outcomes of PQR
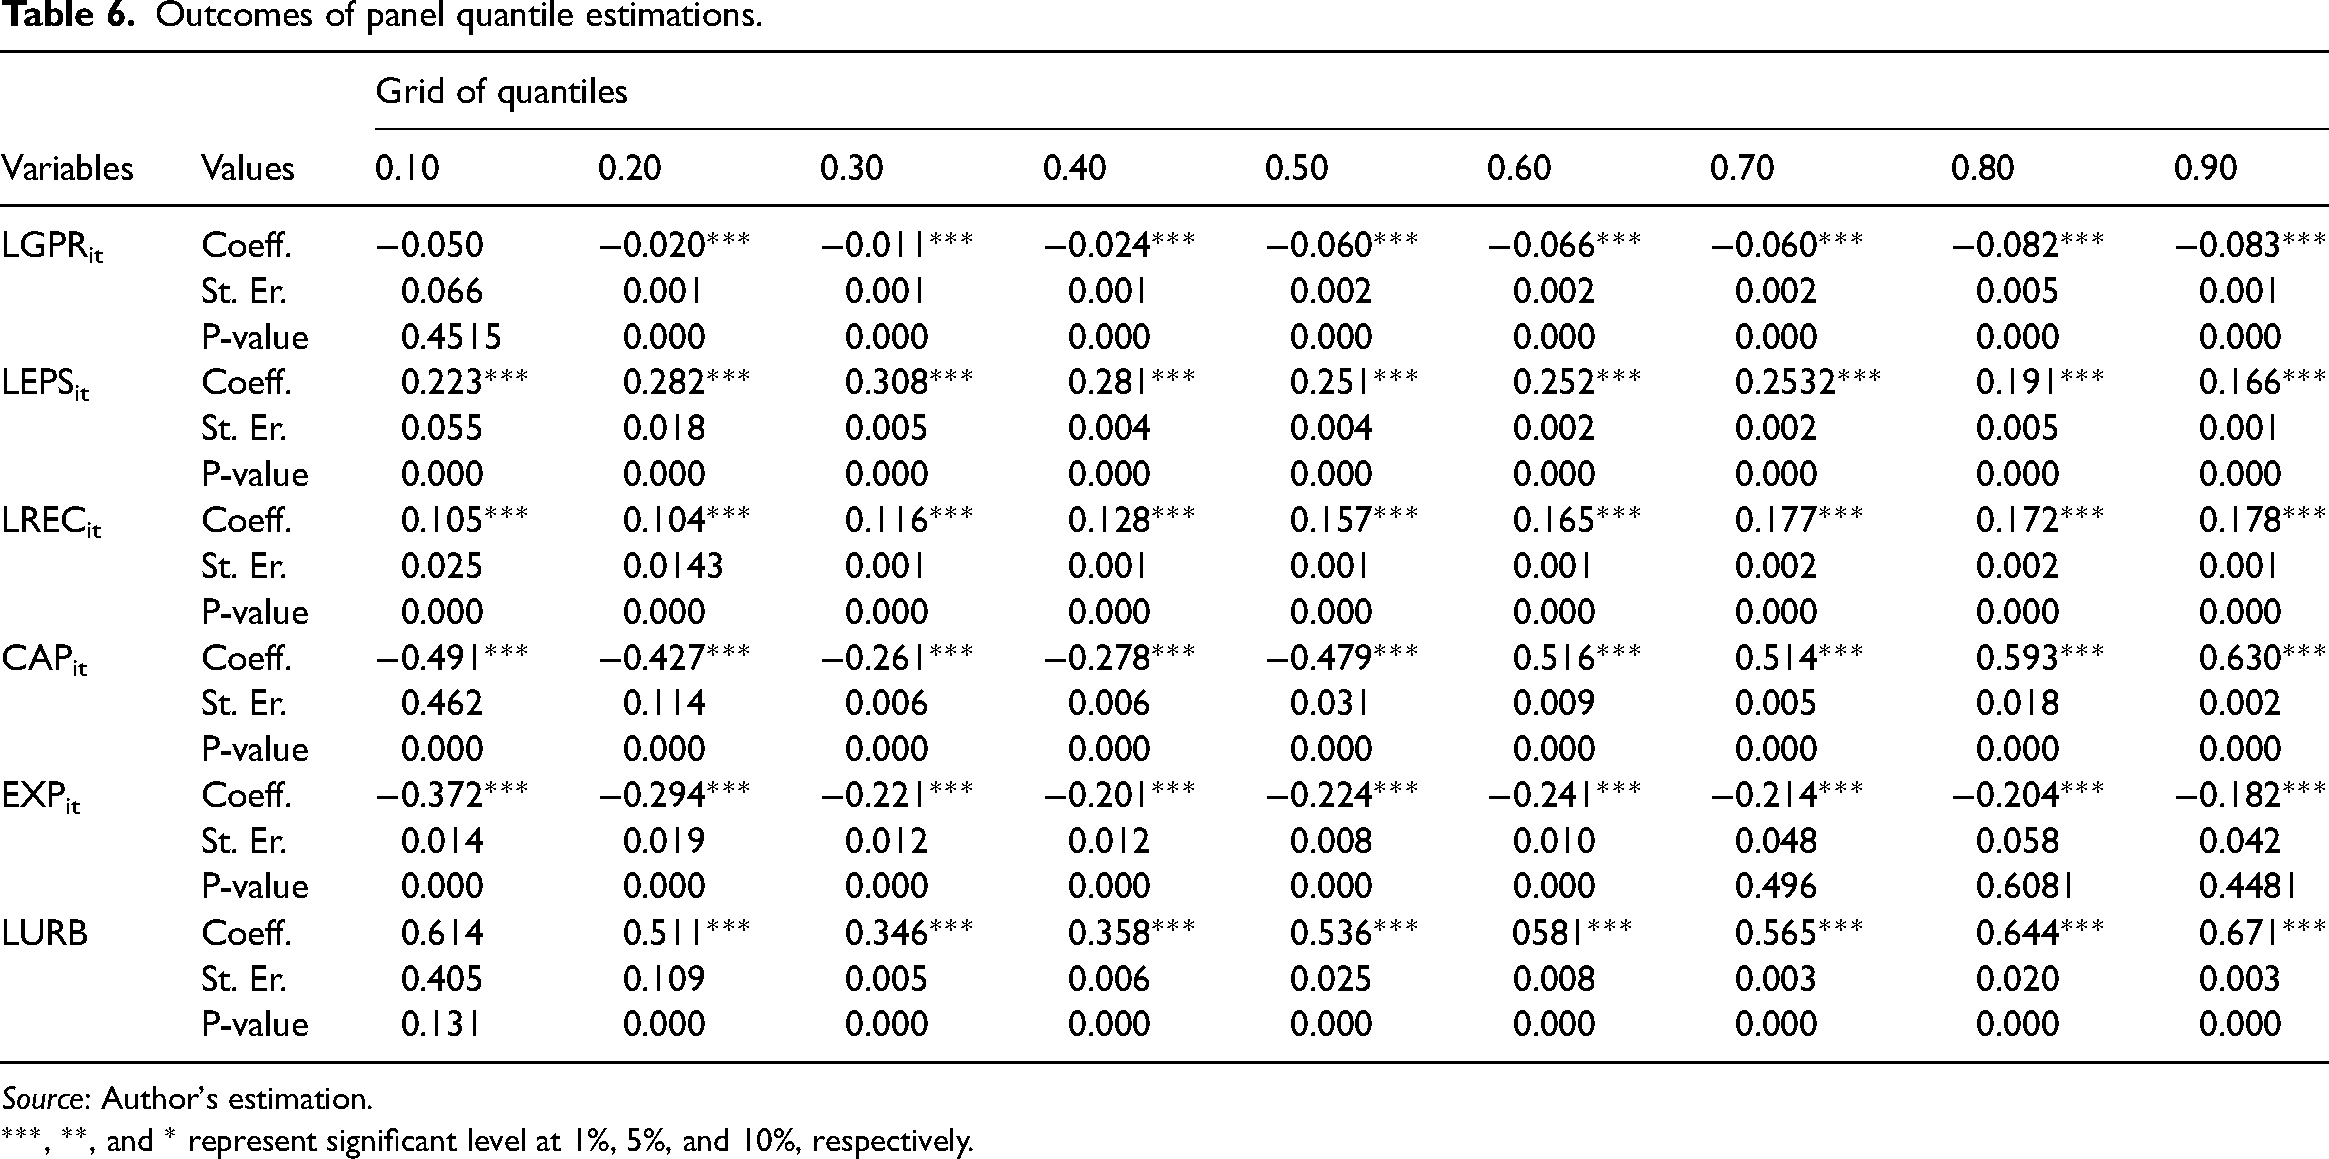
The empirical estimations of the J–B test show that six out of seven variables are less than 0.05, which opposes the null hypothesis of data normality and verifies the existence of outliers in the dataset. Keeping in view this problem, we implement the PQR approach. The PQR approach produces robust results in contrast with the mean-based methodologies. Table 6 represents the outcome generated from PQR. We have used nine quantiles as lower (10th to 30th), middle (40th to 60th), and the higher (70th to 90th) quantiles. According to empirical results, GPR has a considerable negative implication on GPP across all the quantiles. We observe a noteworthy negative influence of GPR on GPP. The lowest value of negative impact is in the 9th quantile whereas, the highest adverse impact of GPR is to be observed in the 3rd quantile. It shows that These outcomes are aligned with the results of Reference 87 that GPR when increased in a country adversely impacts environmental sustainability. GPRs affect the economy and ultimately the climate in many ways. It has been observed that in the presence of geopolitical threats, the demand for renewable energy decreases which hinders the green growth and environmentally friendly measures which were to be adopted. The GPR shakes the investors’ confidence and the market for renewable energy. It negatively hits the innovative measures in the energy sector. 90 Countries with higher quantiles, better adopt risk management strategies and with supportive environmental regulatory policies minimize the negative impact of GPR on environmental sustainability. 56
EPS has a plausible influence on GPP across all the quantiles. We observe that EPS positively and significantly affects the GPP in G-7 countries. This positive impact of EPS on green production has also been highlighted by Chang et al. 62 using cross-country panel data, applying OECD's EPS index on 21 OECD countries between 1990 to 2014, examining 18 OECD countries between period of 1998 to 2015, investigating BRICS countries for 1960 to 2020, have concluded that a skillfully executed environmental policy works positively to tackle environmental degradation dually; it promotes environment-friendly growth practices and raises the economic growth with social welfare. Though in the short run, it may adversely affect economic growth in the long run it reduces CO2 emissions. Olasehinde-Williams and Folorunsho 91 explain how EPS promotes GPP by raising green trade.
The outcomes of consuming renewable sources of energy of GPP are very interesting as the approbative impact of REC increases with the increase in quantiles. We observe that REC remarkably benefits GPP. Hao et al. 92 studied the G-7 countries from 1991 to 2017, in an intensive literature review study relating to the consumption of renewable sources of energy, and concluded that REC directly enhances GPP which as a result helps to reduce CO2 emissions in the long run. The use of renewable energy practices has multifaceted benefits both for the economy and the society by controlling environmental degradation and adopting environment-friendly production techniques. REC raises investment in the renewable energy sector. Renewable energy inputs replace the use of fossil fuels which helps to control global warming and promote green growth practices. 93
Capital shows substantial detrimental effect on GPP in lower quantiles and to a greater extent in middle quantiles up to the 5th quantile, afterwards, CAP shows a significant positive impact on GPP. The possible reason behind this shift is as explained by Södersten et al. 94 that as countries become rich, the fixed-asset investments become less carbon-intensive. The results show that the richer countries with higher investments in gross fixed capital formation in the G-7 group are moving toward environmentally viable infrastructure. The investment in fixed assets exploits the environment in several ways. The fixed-asset investment in the secondary industry not merely directly increases the consumption of energy but also stimulates the use of energy by value addition. 95 In rich countries, the increasing gross fixed capital formation is aligned with high carbon footprints, such as building energy-intensive industries and dependence on fossil fuels. 96 The fast-growing economic progress damages the ecosystem, as the increasing capital formation is leading to the loss of valuable services obtained by natural resources. 97 The fast-growing gross fixed capital formation in the age of development also contributes to environmental damage by raising pollution of all types and threatening biodiversity as well. 98 This adversely affects green growth, which underscores low-carbon emissions.
Exports in G-7 countries influence the GPP significantly negatively through all the quantiles. It is to be noted that this adverse impact of EXP on GPP is minimal in lower quantiles and adverse in higher quantiles. These results of our study are also endorsed by Can et al. 99 who studied the impact of exports in 10 recently industrialized nations from 1970 to 2014 and the study made by Yang and Li 100 based on 30 provinces of China measuring the impact of exports along with other variable on the industrial environmental performance, concluded that the rising level of exports promotes energy demand and hence increases the level of CO2 emissions in the environment. Exports negatively impact the industrial environmental performance. There prevails a U-shaped relationship between exports and industrial environment efficiency. The industrial environmental performance improves with exports increasing, but over time it turns negative at higher levels of exports.
Urbanization's affirmative impact remains significant across all the quantiles to a small or greater extent. As Wei and Zhang 101 explain that urbanization is embellished with agglomeration, large-scale growth, knowledge diffusion, and industrialization. The early stage of urbanization hurts the environment, but at an advanced level of urbanization, resource utilization becomes effective and more focused on environmentally friendly patterns of consumption and production. Ochoa et al. 102 explain that sustainable urbanization has strong links with community involvement, mutual interests, and educational and skill development which help to prevent the environment from degradation. And these positive environmental impacts are witnessed around the globe.
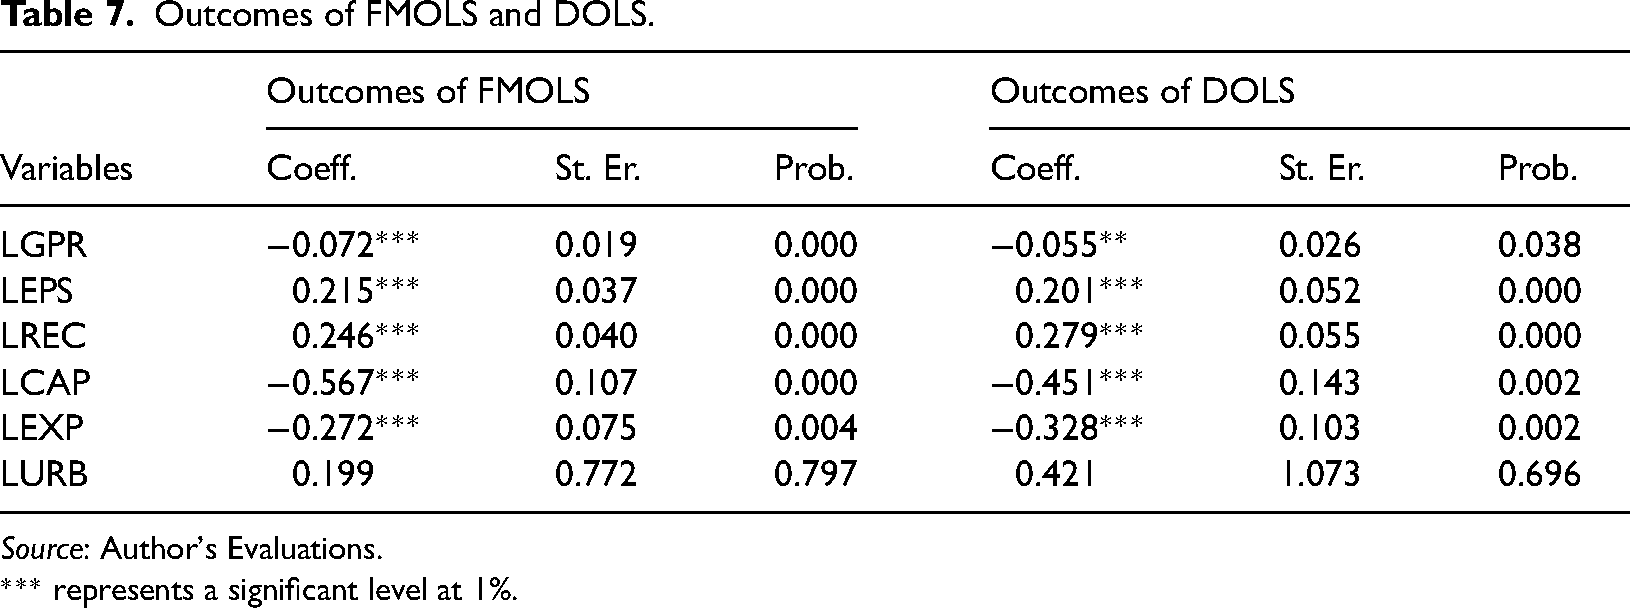
The study also employed a mean-based model to check the robustness of the results of PQR. In this regard, we used FMOLS and DOLS, and the outcomes of these techniques are presented in Table 7. We observe a significant negative impact of GPR on GPP as with a 1% increase in GPR can immerse the GPP by −0.072% and −0.055%, respectively, in both the estimation techniques. On the other hand, EPS considerably enhance the GPP in G-7 countries as a 1% rise in EPS raises the GPP by 0.215% and 0.201%, respectively, in both the estimation techniques. Similarly, REC impacts positively and significantly the GPP. The outcomes reveal that with a 1% upsurge in REC, the GPP enhanced by 0.246% and 0.279%, respectively, in both the techniques; the FMOLS and DOLS. The CAP also shows a negative impact on GPP in G7 countries. The results of econometrics show that in G-7 countries when CAP grows by 1%, it can plunge the GPP by −0.567% and −0.451%, respectively, mentioned in Table 6.
Outcomes of panel quantile estimations.
Source: Author's estimation.
***, **, and * represent significant level at 1%, 5%, and 10%, respectively.
Outcomes of FMOLS and DOLS.
Source: Author's Evaluations.
*** represents a significant level at 1%.
While taking into account the role of exports in GPP in G-7 countries, the picture is a bit different than sketching the impact of another variable on GPP in our study. The results of FMOLS and DOLS show that EXP when increased by 1%, has the potential to cause GPP by −0.272% and −0.328%, respectively. The impact of urbanization on green growth practices is found positive but with weak significance. The econometric estimations; the FMOLS and DOLS show that a 1% rise in urbanization augments GPP elevates by 0.199% and 0.421% in the stated order in the G-7 countries.
The study is more focused on the outcomes of PQR, as PQR possesses several advantages over mean-based estimations like FMOLS and DOLS. We see that FMOLS and DOLS produce just a single coefficient for all variables present in the model. The PQR provide a range of coefficients. In FMOLS and DOLS, the coefficients of GPR, EPS, REC, CAP, EXP, and URB are −0.072% and −0.055%, respectively, 0.215% and 0.201%, respectively, 0.246% and 0.279%, respectively, −0.567% and −0.451%, respectively, −0.272% and −0.328%, respectively, and 0.199% and 0.421%. These results in PQR are in specific ranges according to different quantiles. The range of coefficients for GPR lies between −0.083 and −0.011. The range of coefficients for EPS lies between 0.166 and 0.308. The range of coefficients for REC lies between 0.104 and 0.178. The range of coefficients for CAP lies between −0.491 and 0.630. The range of coefficients for EXP lies between −0.372 and −0.182 and the range of coefficients for URB lies between 0.346 and 0.671. We observe in simple mean-based techniques, whether the variables are overvalued, undervalued, or show an insignificant result, as in the case of URB. Similarly, in the case of CAP, the effect of CAP on GPP is adverse in both the techniques; FMOLS and DOLS whereas, PQR shows that CAP harms GPP up to the 5th quantile and becomes positive in the higher quantiles.
Conclusion and policy implications
The closure of the article shows the contribution to the scholarly literature and real-world application.
Conclusion
In this study, we examine the influence of GPR and EPS beside other control variables on GPP in the group of seven (G-7) countries from 1990 to 2020. In this regard, we use preliminary diagnostic test to verify the features of the dataset. The results of J–B test show that the dataset is not normally distributed. Based on the outcomes of J–B, we use PQR technique to get robust results in case of outliers in the dataset. The empirical results reveal that GPR, CAP, and EXP hinder the GPP whereas; EPS, REC, and urbanization enhance GPP in G-7 countries. According to the results of PQR, the range of coefficients for GPR, CAP, and EXP lies between −0.083 and −0.011, −0.491 and 0.630, and −0.372 and −0.182, respectively. Similarly, the range of coefficients of EPS, REC, and URB lies between 0.166 and 0.308, 0.104 and 0.178, and 0.346 and 0.671. The core insights highlight the complex relationship between GPR and the application of GPP focusing on the imperative of strategic measures to counteract the harmful effects of risks associated with geopolitical conditions on environmental sustainability.
Policy implications
In light of empirical outcomes, we recommend the following policy measures to enhance GPP in G-7 to formulate and implement sustainable economic policies to obtain a higher level of GGP and meet the targets of SDG 07 (affordable and clean energy), SDG 09 (industry innovation and infrastructure), and SDG 12 (responsible consumption and production). The significant magnitudes of coefficients of GPR in FMOLS, and DOLS, through all quantile segments, confirm that GPR is a curse for GGP.
Businesses should invest in renewable energy sources so that any disruptions in geopolitical conditions cannot hinder the supply chain. More focus should be put on research and development relating to sustainable energy technologies like energy-efficient production techniques, the availability of renewable energy sources, and promoting green infrastructure. Further to ensure SDG 09, there should be diversified suppliers and transportation routes to minimize the risk associated with the geopolitical conditions of the land. The production strategies to be adopted by businesses relating to mitigating GPR will also enhance the implementation of SDG 12 by advocating responsible consumption and production.
The policymakers could also play a significant role in promoting SDG 07 through stringent environmental policies which support the implementation of renewable power technologies. All this could be done through feed-in tariffs, incentives to investors, and renewable energy targets. The promotion of technology transfer and initiatives relating to capacity building will further facilitate the adoption of GPP through sustainable technologies and it will enhance SDG 09. The strict government policies which enhance sustainable public procurement practices, like to prioritizing eco-friendly goods and services will serve SDG 12. Environmental policies implemented at national and international levels could promote environmental sustainability by addressing geopolitical tensions and global cooperation to promote GPP through the exchange of modern technologies. This policy framework world encircles the SGD 17; strengthening international cooperation and diplomacy.
For practical implementation of a sound regulatory system aerodynamics the approval of renewable power projects. Tax credits and subsidies should be provided as financial incentives to businesses to adopt GPP. It assures the implementation of SGD 07. Countries with cooperation can arrange for technology transfer programs to share knowledge and build friendly terms, particularly among developed and developing countries. It would not only help the countries to achieve SDG 09 but also minimize the GPRs. Developing green procurement regulations that assure environmental standards in public procurement planning. The whole procurement system should be well-trained and capable enough to ensure compliance with sustainable procurement policies. It will enhance GPP along with assuring the SDG 12. To monitor the indicators relating to renewable energy implementation, green growth practices, responsible production and consumption; robust data should be gathered. It would be possible with the collaboration of international organizations and research institutions for data sharing.
To cope with the negative impact of exports on the GPP, governments should implement a carbon-pricing mechanism. It will internalize the environmental costs relating to exporting goods. By ensuring certain environmentally friendly criteria for exported goods, the G-7 countries will not only minimize the adverse effects of exports on the GPP but these countries when will also contribute to preserving the environment globally. On the other hand, these policy measures will transmit innovative techniques of production in the economies and help to build infrastructure on eco-friendly grounds. By following the above-mentioned recommendations for businesses, policymakers, and practical implementation, the governments of G-7 countries should foster collaboration and mutual agreements globally. Strong diplomatic initiatives would preserve the environment globally. The minimal threat of geopolitical situations will enhance the eco-friendly environment by adopting GPP.
Study limitations
The specific study relies on the cross-sectional time series data of G-7 countries and extracts interesting results from it. This study is purely based on the data of developed countries; therefore, this study has the limitation of generalization, as we are unable to implement the policies of this study on developing countries. Thus, the future studies could be used the data of developing or emerging countries for investigate the impact of GPR and EPS on GPP. Moreover, future studies could be made by observing these countries individually and making a multinational analysis of the countries belonging to the same group focusing on the world's advanced economies.
Footnotes
Nomenclature
Author's note
Ahsan Anwar, Centre for Business Informatics and Industrial Management (CBIIM), UCSI Graduate Business School, UCSI University, Kuala Lumpur, Malaysia.
Data availability
The data sources are provided in this study.
Declaration of conflicting interests
The authors declared no potential conflicts of interest with respect to the research, authorship, and/or publication of this article.
Funding
The authors disclosed receipt of the following financial support for the research, authorship, and/or publication of this article: This research has been supported by research grant UBT, Saudi Arabia.

Dr
Assoc Prof Dr