



Abstract
The goal of this article is the comparison of global warming potential, estimated according to IPCC 2013 methodology, between bottled water and a drinking water dispenser made of pine wood. The functional unit is 1 L of water. Two cases are considered: in the first case is considered 1 L of refrigerated water supplied by a water dispenser, in the second case, it is also considered how users come back home with their water. The global warming potential for bottled water packed in polyethylene terephthalate is taken by literature, its average value is equal to 0.16 kg CO2 eq./L. In the first case, the water dispenser has a global warming potential value equal to 6.89 × 10⁻² kg CO2 eq./L, the percentage difference between bottled water and water dispenser is about 43% in 100 years. In the end, a comparison of vehicles used by users to come back home is performed. The comparison shows that the use of bikes has a lower impact than cars.
Introduction
The most important world's resource is water. It is essential to sustain life, and a satisfactory supply must be available to all. Every effort should be made to achieve drinking water that is as safe as practicable. 1 Since 2007, more than half the world's population has been living in cities, and that share is projected to rise to 60% by 2030. Rapid urbanization is resulting in a growing number of slum dwellers, inadequate and overburdened infrastructure and services, worsening air pollution, and unplanned urban sprawl. For this reason, it is important to improve the management of water systems and to reduce wastes related to plastic bottles for water in agreement with Goal 11 of the Sustainable Development Goals of United Nations (SDGs). 2 In this article, two ways of supplying water are considered: water supplied by either a water dispenser (WD) or bottled water. An important problem related to bottled water is the environmental impact of its packaging.
If Italy is considered, the country is in first place in Europe and second place in the world for bottled water consumption (206 L/person per year). Bottled water is packed in plastics (90%–95%) and in glass (5%–10%). Every year a quantity ranging from 7.2 to 8.4 billion plastic bottles is used in Italy. 3 The production and disposal of bottled water cause the emission of greenhouse gases (GHGs).
According to ISTAT, 4 28.4% of Italian families did not trust drinking water from the tap. For such a reason, Italian cities are installing kiosks to provide free or very low-cost drinking water at ‘km 0’. There were about 2021 kiosks in 2016, 60% of them were installed in the North of Italy. The kiosks provided treated water: refrigerated, still, and carbonated water. 5
In the recent past, particular attention was reserved for the evaluation of the environmental impact of cities’ services, including the urban water systems and at their optimisation. Lately, these kinds of studies have been focused on an entire city or neighbourhood as illustrated by Raoufi and Gorji 6 and Nematchoua et al. 7 A lot of papers were developed with the aim of evaluating and improving the urban water systems of cities, examples can be the evaluation and optimisation of piping for the drinking water network,8–10 or the evaluation of the environmental impact of kiosks that provide public drinking water in neighbourhoods. Ciuta et al. 11 focused their study on an experience developed for an Italian kiosk. Later, Torretta 12 made a comparison of environmental and economic impacts between the use of bottled water and a kiosk in Italy. The aim of his study was to consider the opportunity to promote the change in people's habits, following the concept of sustainability, reducing the environmental charge related to the manufacturing, transport and consumption of plastic water bottles without significant reduction of the quality of the service and with convenient and interesting economic implications.
As described by Lagioia et al., 13 the most common supply systems of water for human consumption are tap water and bottled water. The first constitutes drinking water distributed by aqueduct, managed publicly or privately, and available to consumers from a tap whereas the second constitutes drinking water distributed by polyethylene terephthalate (PET) and glass bottles and potentially available everywhere to all consumers. According to European and Italian regulations, bottled water is considered natural mineral water if it originates from an aquifer or underground reservoir, and it comes from one or more springs or wells. In this paper, the expression bottled water it is referred to as natural mineral water and spring water, which is packaged in glass or PET. For PET packaging the scientific literature is rich as described by Gomes et al. 14 Recently, Zhang et al. 15 have studied PET bottle recycling in China.
In recent years, many authors studied the impacts of bottled water packaging. Jungbluth 16 made a comparison between bottled mineral water and drinking water from the tap. Similarly, Botto and Botto 17 applied a footprint-integrated approach to compare the impact of tap water and PET-bottled natural mineral water. Later, Botto et al. 18 compared two types of drinking water: tap and PET-bottled water. Tap water was supplied to the municipality of Siena (Italy). The functional unit of their study was 1.5 L of drinking water, and they concluded that the carbon footprint of tap water is about 250 times lower than PET bottled water.
Differently, Fantin et al. 19 focused on development of a method for harmonising life-cycle assessment (LCA) literature studies on the same product or on different products fulfilling the same function for a reliable and meaningful comparison of their life-cycle environmental impacts. This approach was then applied to the comparative analysis of the published LCA studies on tap and bottled water production, focusing on global warming potential (GWP) results. The comparison of the mean GWP results of tap and bottled water (0.09 kg CO2 eq./100 L and 16.20 kg CO2 eq./100 L, respectively) shows that tap water has the best environmental performance.
Many scholars engaged with the topic of LCA applied to drinking water. For example, Garfí et al. 20 evaluated the environmental impacts caused by drinking water consumption in Barcelona (Spain) using the LCA methodology. In this case, the functional unit was 1 m3 of water, their results showed how tap water consumption was the most favourable alternative, while bottled water presented the worst results due to the higher raw materials and energy inputs required for bottle manufacturing, especially in the case of glass bottles. Likewise, Cimini and Moresi 21 studied the estimated carbon footprint of 1 hL of lager beer packaged with different materials such as glass, aluminium cans and steel kegs. Furthermore, Simon et al. 22 examined five different packaging materials during their whole life cycle. Finally, Makov et al. 23 evaluated the potential cumulative energy demand and climate change impacts of water delivered from a filtered water refill station under various consumption scenarios and provided a comparison to published results for bottled water.
LCA is often used to measure the environmental impact of a product or a system. There are examples of its application in different areas, that is, buildings, renewable energy systems, heating systems, in the development of exergy and exergo-economic analyses24–31 and more.
In recent years, investigations on water systems attracted the interest of many scholars. The studies are comparisons of different solutions for water packaging32–34 or impact analyses of water and wastewater systems.35–38
Due to the rising interest in water systems and their corresponding environmental impact, the present article aims to compare different drinking water alternatives namely 1 L of PET bottled water and 1 L of water supplied by WD, based on the LCA method.
A WD made in pine wood is considered in this article. This choice is driven by different reasons: the wood is natural, renewable, and biodegradable. Furthermore, its transformation has lower costs than other raw materials. Pine wood is compatible with environmental protection standards if its production is pursued in agreement with sustainable forestry management practices. The sustainable production of pine wood can be warranted by specific certification schemes. Other aspects of the kiosk's composition are discussed below.
In Table 1, a comparison scheme is performed to summarize the differences between this article and others that studied the environmental impact of kiosks, tap, or bottled water.
Comparison among reviewed works.

To the knowledge of the authors, as reported in Table 1, only a few studies evaluated the environmental and economic impacts of water kiosk supply with respect to tap and bottled water. Only five works considered the water kiosks' usage to deliver water in a certain area. The water kiosks are all different and none is made of a biodegradable material. It is also important to underline that there are no works considering how the mobility within the city can impact water delivery. From the economic point of view, as described by Torretta, 12 there is a very significant saving for the consumers: he estimated that an average family who takes still water from a water kiosk can save up to 339 € each year.
The novelty of this work with respect to the literature reviewed in Table 1 is to consider a WD made in biodegradable material and to perform a comparison between the impact of various scenarios of vehicles used by customers by considering not only the delivery of 1 L of water, but also how the neighbourhoods mobility impacts on the water supply type.
Materials and methods
The LCA tool consists of a four-step evaluation: goal and scope definition, inventory analysis, impact assessment, and results interpretation as described by ISO 14040 framework 40 and ISO 14044 guidelines and requirements 41 (Figure 1).

Life-cycle assessment (LCA) general framework (ISO 14044:2006).
Goal, scope definition and system boundaries
The first step of an LCA is the definition of the scope, goal, system boundaries and functional unit. Defining the goal and scope of products or services is the preliminary and fundamental phase of the LCA. The goal of this article is to make a comparison between unrefrigerated bottled water and potable WD. The product system is an ideal WD. Two cases are studied: in the first case 1 L of water supplied by WD is taken into account without considering how customers transport their water, and in the second case how the customers transport their water is considered. For the second case, eight hypotheses are made: the first hypothesis consists of that all users take water by WD and use cars to back home; in the second hypothesis all users use bicycles to transport their water at home. In the other hypotheses, there is a perceptual variation between cars and bicycles used by users. For all cases, the product system is divided into process units, each of which includes all the activities related to one operation or a group of operations. The life cycle stages and boundaries covered the raw material production, transport, how consumers transport the water, consumer use, and disposal of the dispenser. In the system of the first study case, transport by users is not considered, because it is made a comparison with the classical way of potable water use. In this work, different internal components of WD are not considered, for example, card reader, LED lights, coin acceptor, and control unit. The functional unit is 1 L of water. For unrefrigerated bottled water, the results from the literature are taken.
Inventory analysis
The second step is the life cycle inventory (LCI). It includes data collection and calculation procedures, which allow to quantification of the input and output flows of a product system. The software used in this evaluation is openLCA 1.10, with Ecoinvent database version 3.7.
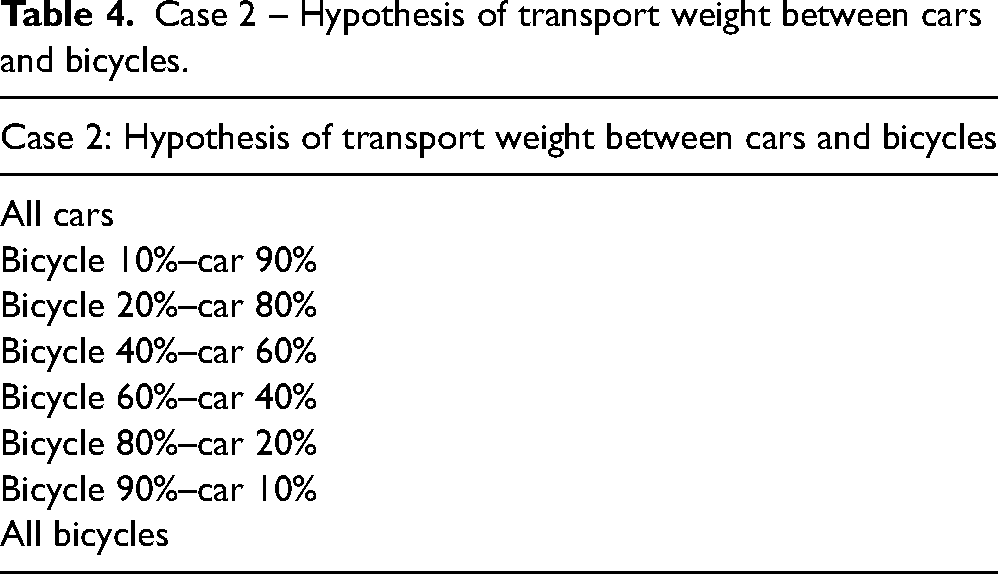
Data are collected and processes, that define the product system, are established. Two cases are considered: the first one is a WD without considering the transport of water by users that come back home; the second is the same WD, but in this case, transport is considered. In the first case (see Figure 2(a) and Table 2), the WD is modelled in pine wood by biological cultivation. So, the first step, modelled by using the first two inputs process (Table 2), is the raw materials extraction. For this step, 437 kg of pine wood is considered. The second step modelled the transport from the production site to the installation site, in this case, the distance between the sites is considered equal to 500 km. In this step, WD installation in the site is modelled by using a concrete process. In the third step, tap water is linked to WD. In this step, water purification is modelled by using ultraviolet lamps and an ultrafiltration module. Maintenance of these components is also considered. Refrigeration is modelled by using an air–water heat pump of 10 kW, which is a less efficient system than a water–water heat pump of 5 kW that can be installed in this kind of application. Finally, it is assumed that users withdraw water with a glass bottle. The needed weight of glass bottles is estimated considering that every bottle is reused 10 times. In the fourth process, wood disposal is modelled. In this case, the transport used by customers is not considered. In the second case, the WD is modelled as in the first case, but also the transportation mean used by users is considered (Figure 2(b) and Table 3). Several hypotheses are made. At first, an upper and a lower bound are set. The upper bound is the case where all users use cars for transporting their water at home, whereas the lower bound is the case where all users use bicycles to transport their water. Other intermediate cases are considered, as described in Table 4. In all the hypotheses, the distances covered by cars or bicycles are distributed as it is distributed in the Italian vehicle fleet. For cars, the vehicle fleet is made of petrol, diesel, and natural gas, for bicycles the vehicle fleet is made by electric bicycle and traditional bicycle.

Product system of water dispenser: (a) without user's transport; and (b) with user's transport.
Case 1 – Water dispenser without costumers’ transport.

Case 2 – Water dispenser with customers’ transport.

Case 2 – Hypothesis of transport weight between cars and bicycles.
The life cycle of the dispenser is 10 years and it is assumed to deliver 3 × 10⁶ L of water, namely 3 × 10⁵ L/year (821.9 L/day). According to this hypothesis, it could dispense about 400 users, who drink 2 L per person. The energy consumption was estimated by using data collected in a report made by Società Acqua Lodigiana s.r.l. 39 In this report, they estimated the carbon footprint of two water kiosks. During their LCA, they measured the electrical consumption of their kiosks: one of them supplied 247 m3 of water and had an electrical consumption of 17.5 kWh/m3. By considering this data and the similarity between their ‘water's home’ and WD in terms of water supplied, it is assumed that 1.75 × 10⁻² kWh/L is a good approximation of electrical consumption for this article. The maintenance consists of the substitution of 24 ultraviolet lamps, that is, two lamps per year, and in cleaning and control activities of the plant which requires a 50 km journey by car twice per year. It is considered that one user takes five bottles of water every time, that is, 5 L, and the average distance between WD and the user's house is estimated at 0.665 km, this data is referred to the middle radius of an average Italian municipality. 42 The vehicle distribution is made according to the Italian bicycle market 43 and the Italian vehicle fleet. 44 Waste processes, except for wood, are not considered (Table 5).
Input quantity for the LCA study.

All the data are secondary. They are from the Ecoinvent database, scientific literature, and reports. Due to this reason, an uncertainty analysis is not performed.
Life cycle impact assessment
The third step is the life cycle impact assessment (LCIA). The aim of this phase is to identify and quantify the most relevant environmental issues and to commute every input of the LCI table in a contribution to environmental issues. GWP is chosen as the impact category and its calculation is performed as described by IPCC, 45 where 100 years are considered as time horizon.46,47 Furthermore, GWP with 20 20-year time horizon is also estimated.
It is important to cite the definition of GWP by IPCC 45 : ‘The Global Warming Potential (GWP) is defined as the time-integrated [Radiative Forcing] RF due to a pulse emission of a given component, relative to a pulse emission of an equal mass of CO2’. Another interpretation is that the GWP is an index of the total energy added to the climate system by a component in question relative to that added by CO2.
Further in the IPCC's text, it is reported that GWP is the default metric for transferring emissions of different gases to the scale called ‘CO2 equivalent emissions’. 48 GWP is usually integrated over 20, 100 or 500 years consistent with Houghton et al. 49 GWP integrated over 100 years was adopted as a metric to implement the multi-gas approach embedded in the United Nations Framework Convention on Climate Change (UNFCCC) and made operational in the Kyoto Protocol (1997).
The supplementary material of chapter 8 of IPCC
45
indicates how to calculate GWP: The absolute global warming potential (AGWP) is the time-integrated radiative forcing due to a 1 kg pulse emission of gas i (usually in W m–2 yr kg–1). The GWP for the gas i is obtained by dividing the AGWP
i
by the AGWP of a reference gas, normally CO2:

The fourth step is the analysis of results and their interpretation. The goal of this step is the explanation of the meaning of results and their limitation. The assumptions made in the first phase must be recalled in this step: only based on these assumptions, in fact, it is possible to draw conclusions and provide some recommendations.
Results and discussion
In this study, unrefrigerated water is not considered because there are many studies in the literature on this and also because data on electrical consumption in the stand-by-state of this hypothetical WD are not available. This choice is not in contrast with the goal of this study, because a comparison will be made with bottled water in the hypothesis of the higher operating status of the kiosk.
It is chosen 1 L of water as a functional unit. The following results are given by the GWP estimated using the Ecoinvent database in openLCA and its IPCC 2013 method: in the first case the GWP100 is equal to 6.89 × 10⁻² kg CO2 eq. The impact of glass bottles contributes to 87% of the environmental impact of the WD (Figure 3). So, thinking about water packaging that has a lower environmental impact is an important issue not only for bottled water but also for kiosks in the future. Figure 3 shows that the impact of the heat pump and its electrical consumption is 12% of the total share and the contribution of tap water production and all other processes account only for 1% of the total for the first case.

Process global warming potential (GWP's) weight for the water dispenser.
A comparison between the GWP estimated for bottled water of 1 L and the same quantity of supplied water by WD is carried out. It is chosen to consider the average GWP results obtained by Fantin et al. 19 for a water bottle in PET that is estimated on a time horizon of 100 years. So, the GWP's value considered for the environmental impact of bottled water is 0.16 kg CO2 eq./L. For WD, the value of GWP100 mentioned above is considered, and it is also considered the GWP20 calculated using the IPCC 2013 methodology. Its value is about 7.84 × 10⁻² kg CO2 eq. In Figure 4, this comparison is shown. The GWP20 of refrigerated water supplied by WD, in terms of kg of CO2 eq., is about the middle of the environmental impact of PET bottles. So, this result shows that the impact of supplied water in 20 years is about the middle of the impact of bottled water in a century. Moreover, the impact of WD in 100 years is about 43% of PET bottles, these results can be amplified if the refrigeration for the bottled water is considered. So, if it is compared to the total impact of WD in its life cycle with the impact of PET bottles for all litres delivered by WD, it may be possible to reduce the emissions of 273.3 t of CO2 eq. in 100 years. In this comparison, refrigerated bottle in PET is not considered, because it is obvious that its CF is higher than bottled water in PET without refrigeration, so, in such a case it is useless to make this comparison.

(a) Comparison between GWP 100 and GWP 20 of the water kiosk and the GWP 100 of a PET bottle of 1 L; (b) percent variation for the same comparison.
The second case considers how the users come back home after they withdraw water by WD. Nine hypotheses are defined for this study:
All users use cars. 10% use bicycles and 90% use cars. 20% use bicycles and 80% use cars. 40% use bicycles and 60% use cars. 60% use bicycles and 40% use cars. 80% use bicycles and 20% use cars. 90% use bicycles and 10% use cars. All use bicycles. All go on foot.
Electrical and traditional bikes are considered in shares based on their average travelled distance according to 2019 of the Italian market. Similarly, petrol, diesel, and natural gas Euro 4 cars are considered based on the share of the distance travelled for 2019 as given by Automobile Club d’Italia. Distribuzione Parco Veicoli.
44
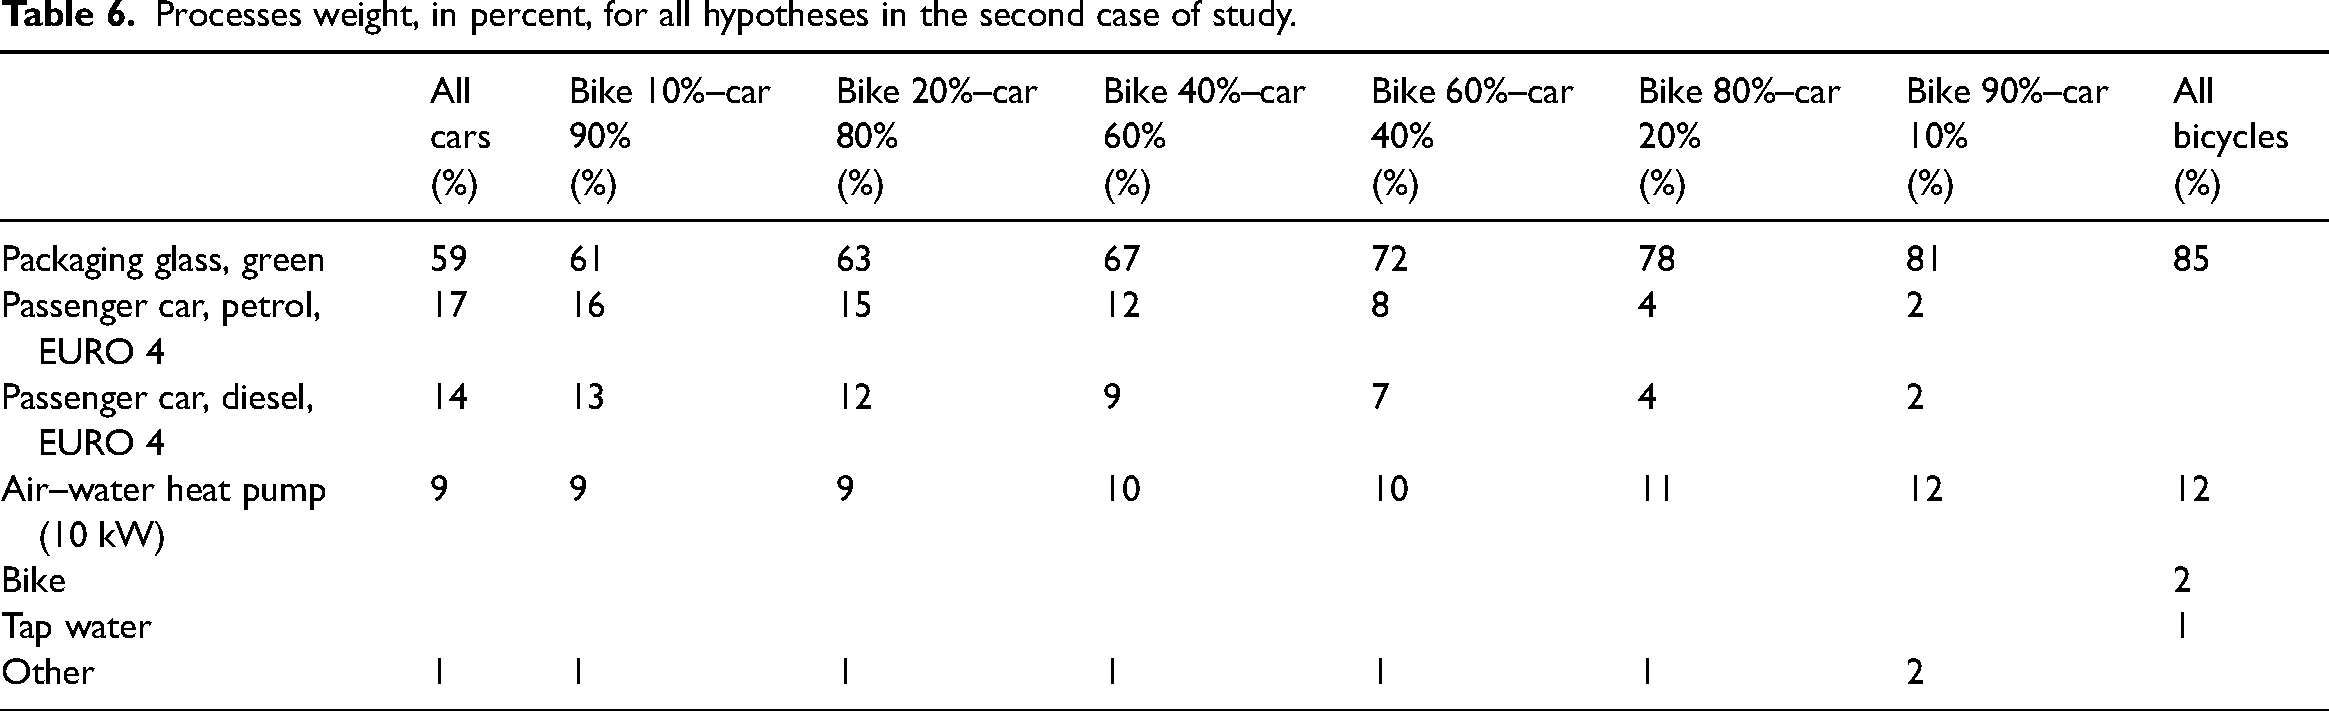
Table 6 shows how the environmental impact, in absolute and relative terms, of the processes considered in the modelling of the WD is distributed. For the last case, the results of the WD alone are considered. In Table 6, it is shown the case where all users use a car to come back home. The impact of the cars in the total CF (GWP100) is about 31%, the share of petrol cars is 17% and 14% for diesel cars, thus they have about the same impact as they also have the same share in the Italian vehicle fleet. In the study of the impact of drinking water or bottled water, it is important to consider how users transport their water because the impact of transport processes is not negligible. In this case, the impact of transportation processes reduces the weight of packaging, but this reduction does not result in a reduction of GWP100, in fact, the impact of the packaging is the same and the GWP100 becomes higher than the case where transportation processes are not considered. However, the share of packaging remains the highest impact factor. In Table 6, decreasing the of impact cars is slower than increasing for the bike use. When bike use is increased to 90% of the total, the impact weight of the cars is about 4% (2% diesel and 2% petrol) of the total GWP100, however, the total GWP100 is decreased. It is not simple to reduce the car’s impact. In the case where all users use bikes to come back home, their impact is about 2% of the total GWP100. The GWP100 of this last case is roughly the same as that of the first case. By decreasing the impact of cars, it is possible to decrease the total impact of the WD (Figure 5(a) and (b)). The most important aspect is that in the case where all users use a car to come back home the environmental impact of the dispenser is lower than bottled water, when refrigeration and user transport are not considered.

(a) Comparison of global warming potential (GWP) 100 for the hypotheses of user's transport; and (b) comparison of GWP 20 for the hypotheses of user's transport.
Processes weight, in percent, for all hypotheses in the second case of study.
An in-depth comparison with studies present in literature cannot be performed, because the case studies are not similar. However, by analysing the results obtained by Torretta et al., 12 Makov et al. 23 and Società Acqua Lodigiana s.r.l. report, 39 it is possible to confirm that our results are in good agreement with them.
Conclusions
To deal with the problem of the world's urbanisation it is important to improve the management of urban water distribution systems and reduce waste. To this aim, this article presents an LCA on an ideal WD made in pine wood. Two cases are evaluated: in the first case, the dispenser supplies refrigerated water considering only the packaging the customers use for withdrawing water; the second one includes the transportation means of users. The WD is made from 437 kg of pine wood; its life cycle is 10 years, and, during its lifetime, it can deliver 3 × 10⁶ L of water (3 × 10⁵ L/year, 821.9 L/day), so it can deliver water for about 400 users if they drink 2 L of water a day; the electrical consumption of refrigeration is 1.75 × 10⁻² kWh/L. A total of 24 ultraviolet lamps and one ultrafiltration module are used for purification purposes. The maintenance operator goes to the kiosk two times per year by covering a distance of 50 km per time, in 10 years he travels 1000 km with a large Euro 4 diesel car. Every litre is withdrawn with a glass bottle of 0.450 kg, but every glass bottle is used 10 times. Every user takes 5 L per time and they come back home or on foot (Case 1) or with a transport vehicle (Case 2). In all cases, they covered an average distance of 0.665 km. The analysis is performed using openLCA software and the database Ecoinvent 3.7 version.
The main result highlighted in the current article is that WD has a lower environmental impact with respect to bottled water per every litre delivered. In fact, in the first case, the difference between bottled water and WD is about 50% when GWP100 of PET bottle and GWP20 of kiosk are considered or 43% when GWP100 of PET bottle and kiosk are considered. Thus, the impact of the WD is lower than half of the impact of a PET bottle. In this perspective, it is important to change population habits advertising the benefits that arise from the use of such a kind of structure. The first benefit is the reduction of water costs. An average family who takes still water from a water kiosk can save up to 339 €/year as suggested by Torretta. 12 The study was performed more than 10 years ago, so it is reasonable that the possible savings are increasing. The second benefit is the reduction of the environmental impact of bottled water usage. An improvement of the communication strategy to stimulate the utilization of WD or kiosks is essential. New policies to encourage WD use are needed from the Italian government not only from an economic point of view, but it is also important to improve communications and water quality checks. In this perspective, some Italian municipalities, such as the municipality of Parma, have provided free water for all citizens.
Another object is the evaluation of the environmental impact of a WD made in wood. The impact of wood structure, considering all processes that modelled the assembly of WD, is about 418 kg CO2 eq., thus it is 1.39 × 10⁻⁴ kg CO2 eq. per L. This value is negligible in the proposed cases, but a comparison with other solutions is not possible since there is no available data.
In the case where each person uses a bike to take water from the dispenser, the impact of 1 L of water is 30% lower with respect to the case of car utilization. Moreover, if 60% of the customers use a bike and 40% use a car, the estimated reduction is only 17%.
The presented approach could be extended to other applications in which city mobility is not considered, but it can affect the impact of a service, for example, in the case of digital document utilization instead of printed documents for public administration.
Moreover, it is important to mention that WD is modelled with a simple approach thus the impact of the pine wood structure could change. The limitation of this study is that the disposal of WD components is not considered, except for the wood.
The next step is to do a more detailed study of a WD by considering not only the disposal of each component but also performing a life cycle costing (LCC) to compare the WD and bottled water overall costs.
Footnotes
Authors’ contribution
Renato Elpidio Plomitallo: life cycle assessment (inventory and impact assessment), results analysis, writing of the original draft. Sergio Nardini: conception of the research idea, checking of the final draft. Vincenzo Bianco: revision of the final draft. Furio Cascetta: revision of the final draft.
Declaration of conflicting interests
The author(s) declared no potential conflicts of interest with respect to the research, authorship, and/or publication of this article.
Funding
The author(s) received no financial support for the research, authorship, and/or publication of this article.
