
Abstract
Carbon emission efficiency (CEE) reflects the interplay between carbon emissions and the economy, which refers to achieving more economic benefits and lower carbon emissions while considering energy, labor, and capital inputs. Assessing regional CEE is crucial for evaluating the level of China's regional low-carbon economic development. Thus, this paper proposes a scenario-based hybrid model with a foresight perspective and game cross-efficiency (GCE) analysis. It measures the future CEE of 41 Yangtze River Delta (YRD) cities from 2023 to 2030. The improved gray forecasting models generate the input and output datasets for GCE analysis, and the assurance region constraint simulates the carbon emission and energy consumption dual-control policy. The results show that: (1) the CEEs of 41 cities are generally low, with an average of 0.2142. Shanghai has the highest CEE, 0.8089, while Tongling has the lowest, 0.0307, under the current policy constraint. (2) Under the four control policy scenarios, the CEE of the YRD urban agglomeration generally follows a U-shaped trend. It indicates that the dual-control policy may lead to a short-term decline in the CEE of YRD, but in the long term, it may gradually increase in 2025 or 2026. (3) Spatial–temporal analysis reveals that the government should flexibly optimize and update the carbon intensity constraint value based on regional development differences and focus more on energy consumption. These results provide forward-looking guidance for China's regional low-carbon and high-quality development.
Keywords
Introduction
The accelerating global warming is seriously hindering the sustainable development of human society. The resulting climate change has become the thorny issue that all humanity needs to face together in the twenty-first century. Experts agree that the practical strategy is controlling carbon emissions to promote economic and environmental development together. 1 As a large energy consumer and the largest developing country, the Chinese government faces the dilemma between strengthening the construction of ecological civilization and keeping the increased rapid economic development speed sustainable. 2 Since the reform and opening up, China's carbon emissions have grown fast and had significant characteristics in different stages. According to China's 13th Five-Year Plan and 14th Five-Year Plan, reaching the carbon peak and achieving carbon neutrality are China's primary goals for sustainable economic and environmental development. Therefore, formulating scientific carbon emission control policies for the dual carbon goals is crucial.
However, China is a vast country with cities in different regions having significant differences in carbon emission levels and development. Cities have substantial spatial differences in carbon emission levels in eastern, southern, northern, and western China. 3 These regional spatial differences lead to the complex situation of carbon emission reduction, which requires comprehensive coordination and mutual support from all regions to form an integrated governance mode. Urban agglomerations are a crucial driving force in China's economic regional integration, significantly influencing regional economic advancement, and they are also the primary source of carbon emissions in China. 4 As the core of China's three major regional development strategies, the Yangtze River Delta (YRD) is one of the regions with the highest opening and the most active economic development. Meanwhile, the YRD is also one of the regions with the highest energy consumption and significant carbon emissions, where fossil energy dominates its energy structure. 5 The YRD is in the eastern coastal region and the Yangtze River's lower reaches. As shown in Figure 1, it includes Shanghai, Jiangsu Province, Zhejiang Province, and Anhui Province, which consists of 41 cities and is China's largest urban agglomeration.
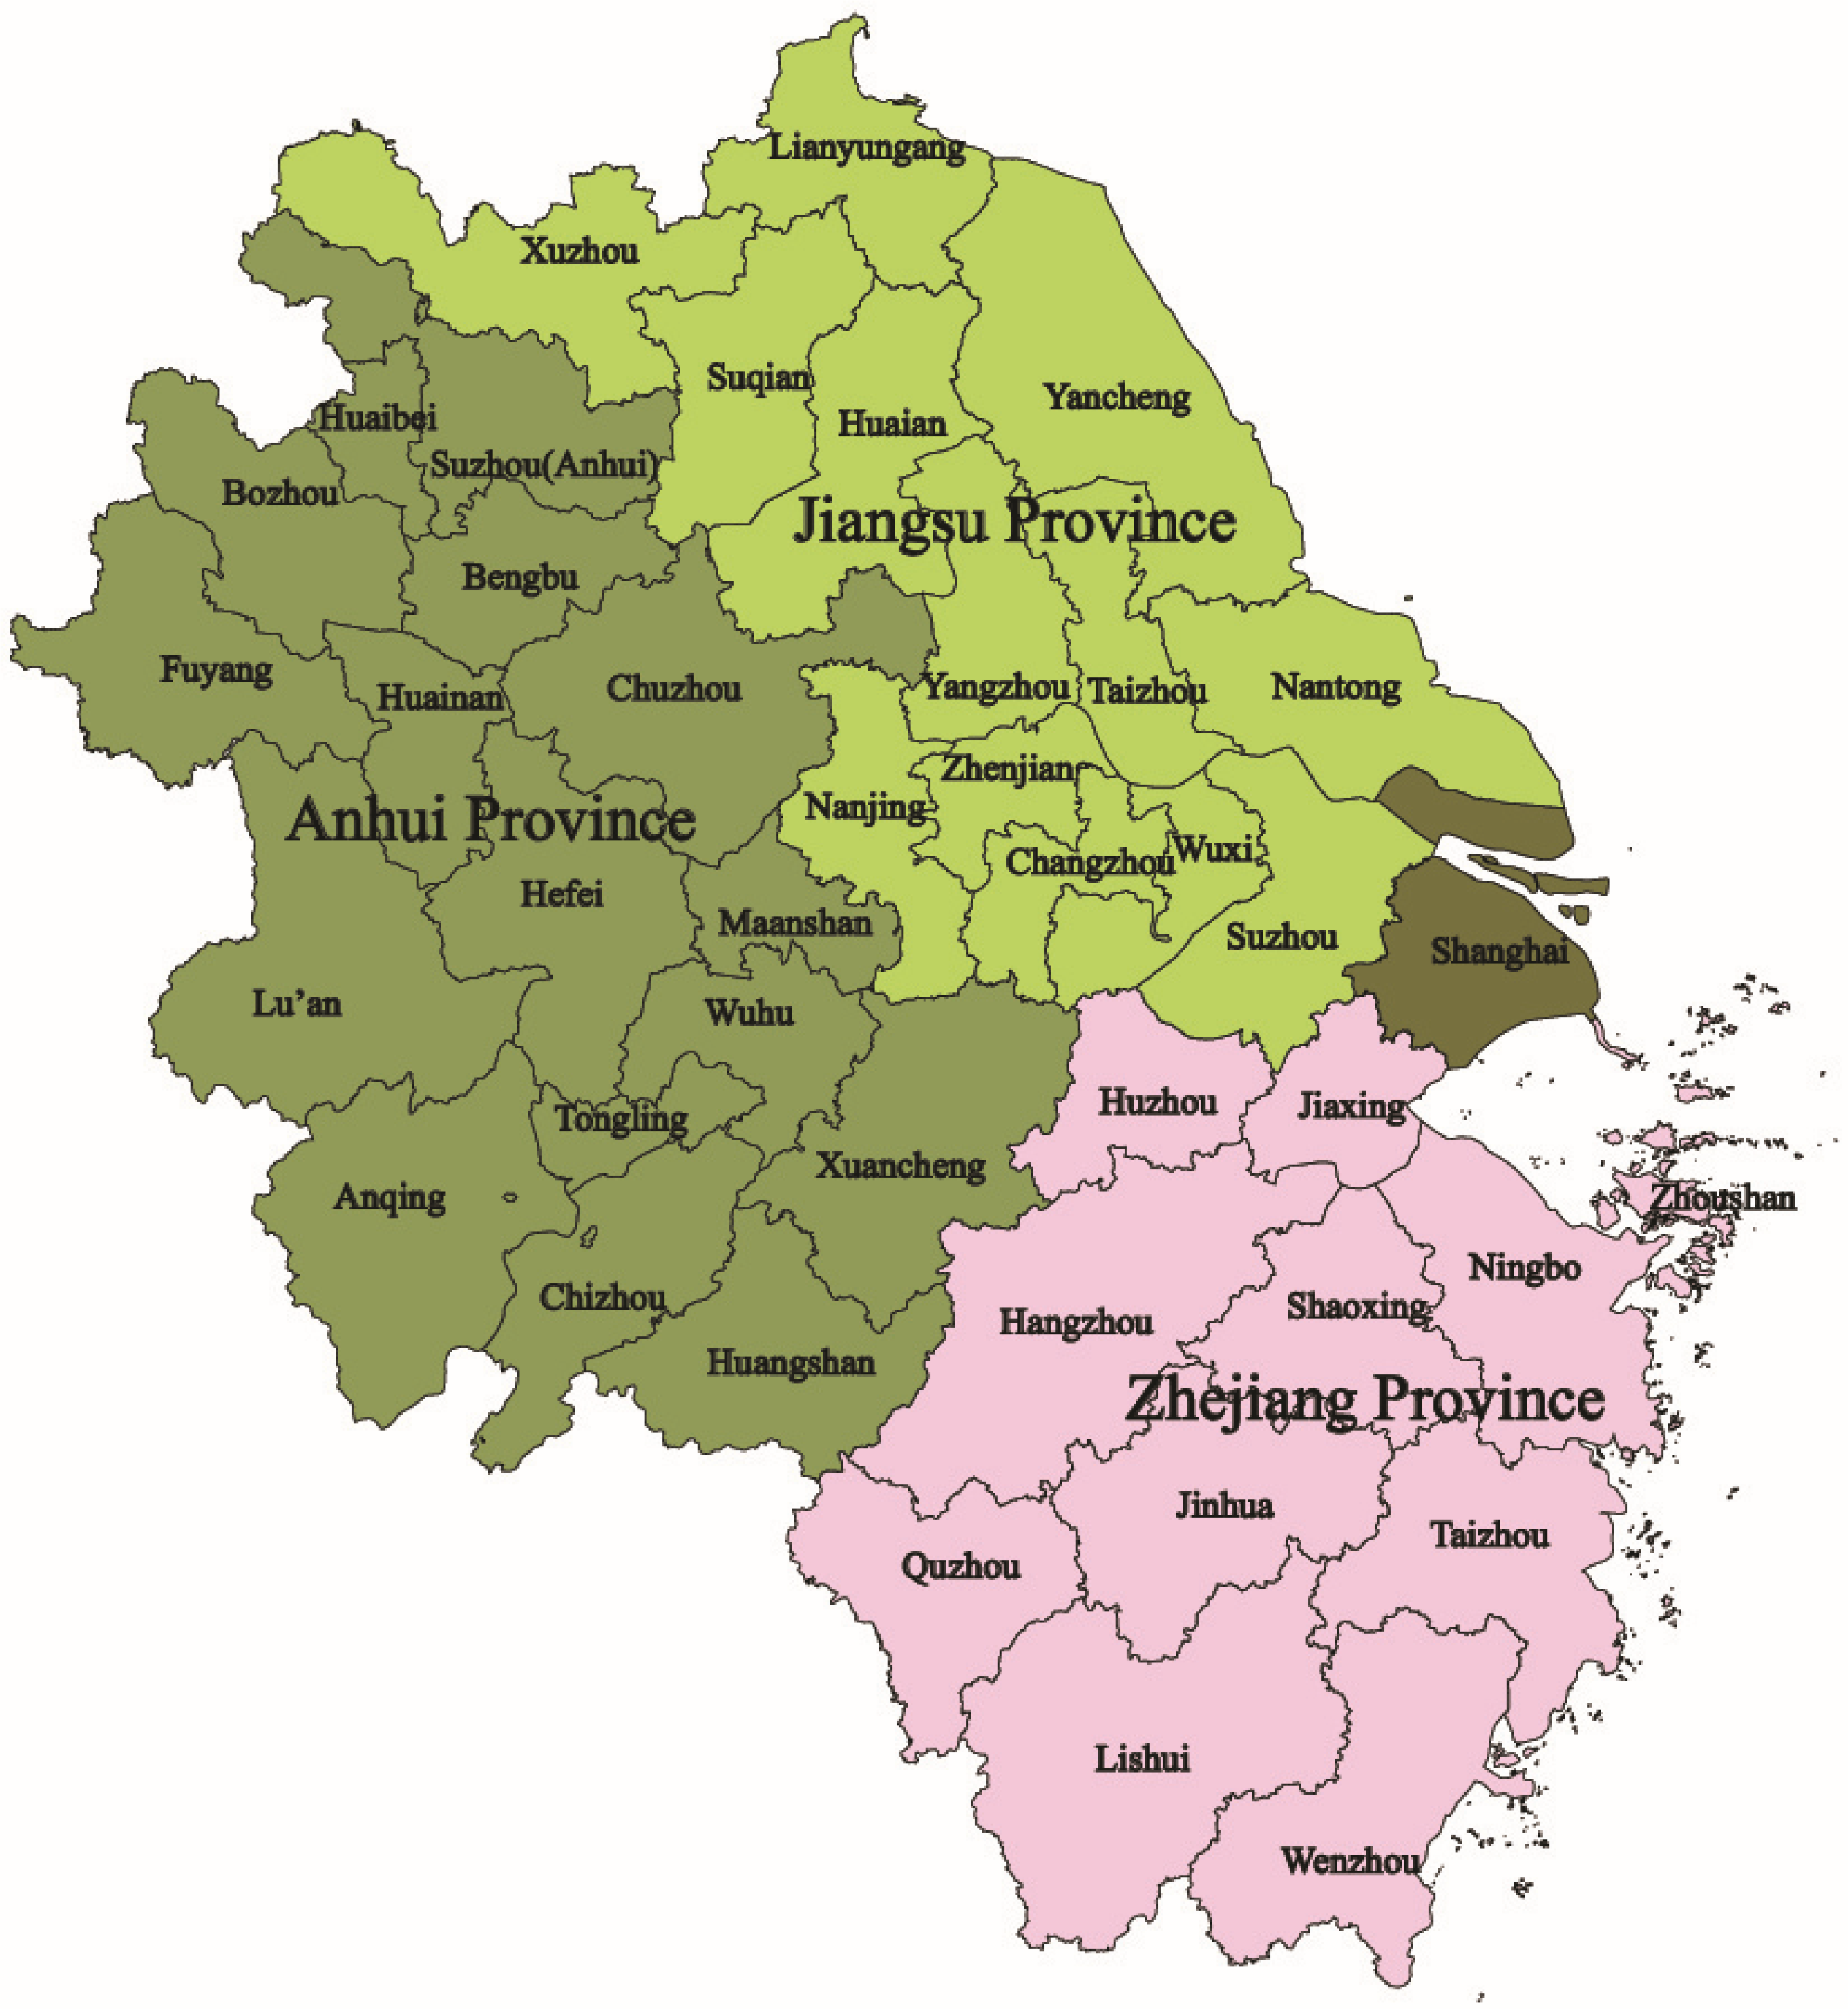
The distribution of 41 cities in the YRD.
The enormous urban agglomerations have also led to differences in economic development, carbon emissions, technological innovation, industrial structure, and population distribution among these cities. In 2019, the Chinese government approved the implementation plan for carbon peaking in the demonstration zone of green and integrated ecological development of the YRD. With the support of low-carbon policies and technologies, the plan is currently updated and proposes to reduce energy consumption intensity by 15% and carbon emission intensity by 20% compared with 2020. The implementation plan strives to achieve the carbon peak in 2030 and steadily decline the overall carbon emissions in the YRD after the following years. Therefore, it is necessary to consider the YRD as a unified system to promote coordinated governance for carbon reduction aimed at maximizing the economic and ecological benefits of the YRD. Additionally, the representativeness of the YRD in urban agglomerations development could provide practical experience for developing carbon reduction policies and paths in other urban agglomerations, which lays a foundation for further carbon reduction coordinated governance in China.
Scholars usually establish the evaluation system of the economy, environment, and social interaction mechanisms based on efficiency evaluation.6,7 They conduct scientific quantitative analysis according to the efficiency scores to reflect the contradiction between environment and economic development. The Data Envelopment Analysis (DEA) is widely applied to measure the system's efficiency and evaluate the level and dynamic trend of regional economic and environmental development. 8 With the increasingly severe global warming, the impact of carbon emissions on the environment and economy has gradually become a crucial influencing factor. Carbon emission efficiency (CEE) is an essential indicator for evaluating the interplay level of carbon emissions and sustainable economic development. Scholars adopt CEE to analyze the rationality of the proportion of economic benefits and carbon emissions.9,10 Although existing studies have modeled carbon emissions as undesirable outputs to measure the CEE, they still lack considerations for carbon emission constraints and simulated policy scenarios. In addition, the existing DEA model research mainly focuses on post-analysis based on historical data and lacks comprehensive evaluation combining policy control and future trends. Therefore, this paper attempts to construct a prospective analysis framework of regional CEE by combining optimized gray forecasting technology and DEA technology.
For innovation contribution, this paper applies gray models with the whale optimization algorithm (WOA) to forecast the future value for input and output variables. It solves corresponding public data scarcity. Moreover, this paper constructs the constraints of regional policies based on the assurance region (AR). The optimized game cross-efficiency (GCE) model realizes the foresight analysis of the development efficiency and potential of the decision-making units (DMUs). It could further adapt to the regional environment change and measure the efficiency difference between different DMUs to provide more comprehensive and robust evaluation results. The proposed gray forecasting and DEA hybrid model breaks through the limitations of theoretical methods from the forecasting perspective and fills the research gap. For practical contribution, this paper measures and evaluates the CEE of 41 cities in YRD prospectively under the dual control mode of energy consumption and carbon emission from 2023 to 2030. Unlike the traditional analysis based on historical panel data, this paper aims to analyze the potential impact of the dual control policy on CEE in YRD cities based on forecasting trends. It provides future references for the subsequent policy adjustment around dual carbon targets by assessing the coordination between carbon emission reduction and economic development.
In the following sections, “Literature review” section presents the literature review. “Methodology” section introduces the proposed models and methodology applied in this paper. “Empirical analysis and results” section calculates CEE scores for the 41 cities in the YRD from 2023 to 2030 and focuses on the analysis and discussion for policy recommendations. “Conclusion and policy recommendations” section summarizes the conclusions.
Literature review
Research on China's carbon emissions
Scholars have researched China's carbon emissions and produced many valuable results. Existing studies focus on the driving and influencing factors of China's carbon emissions, forecasting China's carbon emissions, analyzing regional and temporal-spatial impacts of China's carbon emissions, and measuring CEE.11,12
Regarding driving and influencing factors, Jia et al. 13 analyzed the characteristics of CO2 emissions and applied the Logarithmic Mean Divisia Index to decompose drivers from the multi-sector and multi-stage. They proposed that coal is the most significant proportion of China's CO2 emissions growth from 1980 to 2018. They also found that economic output, population size, energy structure, and industrial structure have various driving effects on China's CO2 emissions growth, and economic output is the dominant driving effect. Peng et al. 14 systematically explored the impact of China's broadband development on carbon emissions from 2008 to 2019 from the perspective of digital infrastructure. They demonstrated that digital technology is one of the fundamental driving forces. Zhao et al. 15 compared the carbon emissions from the tributaries of the Three Gorges Reservoir of the Yangtze River. They found that inorganic carbon in the water contributes to carbon emissions, while organic carbon has little effect. Their research further proposed that eutrophication and algal blooms may be the leading producers of carbon emissions in water, and the carbon input in farming and drawdown areas may be the crucial factor.
In addition, scholars research China's carbon emissions forecasting, focusing on improving forecasting models’ accuracy or exploring regional carbon emissions’ development trends. These studies mainly set targets and strategies for future carbon reduction work for the government.16,17 Regarding analyzing regional and temporal-spatial impacts, Chen 18 analyzed China's spatial impacts of the circular economy on carbon intensity based on 285 cities from 2009 to 2018. Liu et al. 19 evaluated the effect of renewable energy consumption on China's carbon emission intensity from temporal-spatial correlation based on 30 provinces’ panel data. Sun et al. 20 adopted social network analysis and geographically weighted regression to analyze the spatiotemporal evolution characteristics of China's residential CO2 emissions. They proposed that Beijing, Shanghai, and Jiangsu should be the core provinces for energy transition, while Yunnan, Shanxi, Gansu, Qinghai, and Guizhou should focus on developing clean energy. Their study indicates that China's national economic growth should be healthy and sustainable to support the economic environment for China's energy transition. Considering the importance of economic development to China's energy transformation and carbon emission reduction, scholars also focus on the dynamic evolution of economic development and carbon emission reduction from the perspective of CEE.21,22
Research on the GCE model and AR restrictions
Considering the complexity of regional CEE in multidimensional assessment, nonlinear adaptability, and nonparametric systems, more scholars are inclined to select the nonparametric estimation method represented by DEA to measure the efficiency. 23 Scholars have widely adopted it for performance measurements in various economic, green development, and CEE in YRD.24,25 Zhang et al. 26 evaluated the differences in the land use CEE of YRD through a three-stage SBM-DEA model. Wu et al. 27 combined the quasi-fixed energy input and DEA models to analyze further the relationship between the tourism economy efficiency and tourism CEE in YRD. The traditional DEA model is based on self-evaluation and may need better discrimination. 28 The cross-efficiency (CE) approach simulates the peer-evaluation mechanism. It utilizes the weights of the other units to assess each DMU. 29 Thus, the GCE model could generate a complete ranking of DMUs from the game perspective. The GCE model considers the strategic interactions and cooperation among decision-makers, accurately reflecting natural competitive environments.30,31 It enables a comprehensive analysis of multi-party interests, leading to a more precise efficiency assessment.32,33
Existing studies have gradually tried to use the GCE model to measure the development efficiency of the YRD. Li et al. 34 applied the GCE model to measure the inclusive green growth efficiency to explore and compare the YRD's spatial correlation and cross-regional spillover effect with other regions. Zhang and Gong 35 measured manufacturing efficiency in YRD from the GCE model based on the dynamic change. Though those studies consider the impact of negative factors, they ignore the modeling of undesirable outputs into the GCE framework, which may derive a biased result. Moreover, the CE approach can eliminate unrealistic weight schemes, and decision-makers may have an individual preference for the relative importance of different evaluation indicators. The AR approach reflects the reality of the problem situation, which can avoid the possible impact of the value of the non-Archimedean infinitesimal and acquire a reasonable distribution of weights.36,37 It is of potential value to integrate AR into the GCE model to set carbon emissions planning of the YRD as the constraint of the satisfaction and consistency to achieve a more realistic assessment.
Research on the gray forecasting models
Currently, the DEA models still use historical observation data as input and output to achieve post-mortem analysis, which lacks the forward perspective and limits the target DMUs’ sustainable development's effective planning and decision-making ability. Therefore, combining forecasting technology with DEA models is feasible when considering the future development and uncertainty of China's economic and carbon emissions. Scholars usually select time series, artificial intelligence, and gray models for carbon emission forecasting.38,39 Among these models, time series and artificial intelligence modeling require sufficient samples for reasonable forecasting. However, the publicly available historical data on regional carbon emissions from the government is limited. The persistent issues surrounding sensitive data ownership and security have made many economic development datasets inaccessible. Therefore, the gray forecasting model, suitable for scenarios with limited data samples and incomplete information, could effectively address these limitations faced by time series and artificial intelligence models.40,41
The gray forecasting models are classified into traditional univariate gray model (GM(1,1)) and multivariate gray model (GM(1,N)). The minimum sample size for the modeling requirement is four. Researchers have developed various optimized gray forecasting models in carbon emission and energy forecasting. 42 These studies have made improvements from different perspectives, including the accumulation mechanism of modeling sequences, 43 gray driving terms construction, 44 the structure and parameters of the gray model, 45 and time-lag impact, 46 to enhance the accuracy of gray forecasting models and expand their application in carbon reduction planning.
Summary of the literature review
Through the above literature review, this paper summarizes the following contents for further innovation and improvement. The DEA model is a primary method for CEE research because it can consider the presence of undesired outputs. However, most existing research uses the traditional DEA model based on the perspective of self-evaluation, ignoring the mutual evaluation mechanism and the game between DMUs. Meanwhile, the existing DEA model mainly focuses on the post-evaluation of historical data and lacks continuous decision optimization for future CEE development. Many Chinese government public data samples are small and cannot support time series and artificial intelligence forecasting modeling. The existing CEE assessment studies need to focus more on the impact of macro policies. It is necessary to add policy constraints to express the effects of policy intervention. Therefore, this paper combines gray forecasting and GCE models to provide a forward-looking and comprehensive scientific basis for Chinese regional carbon emission management based on a realistic empirical case in 41 cities in YRD.
Methodology
The GM(1,1) modeling process
Determine the initial value


The GM(1,N) modeling process
The system and related factor sequences constitute the GM(1,N) modeling sequence.49,50


The optimization of gray forecasting models
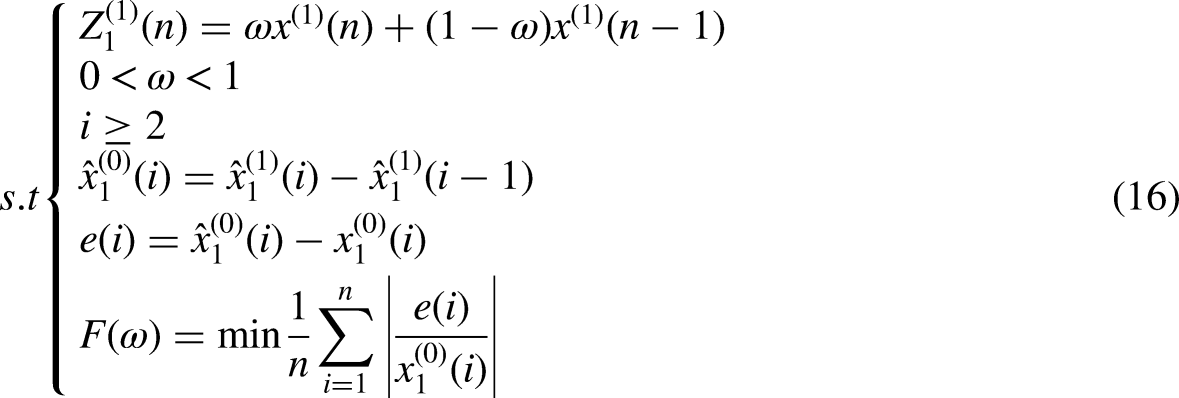
This section optimizes the gray model from the background value and the model structure. This paper applies the parameter ω to represent the weights of adjacent sequence elements of the background value. The optimized background value is as follows.

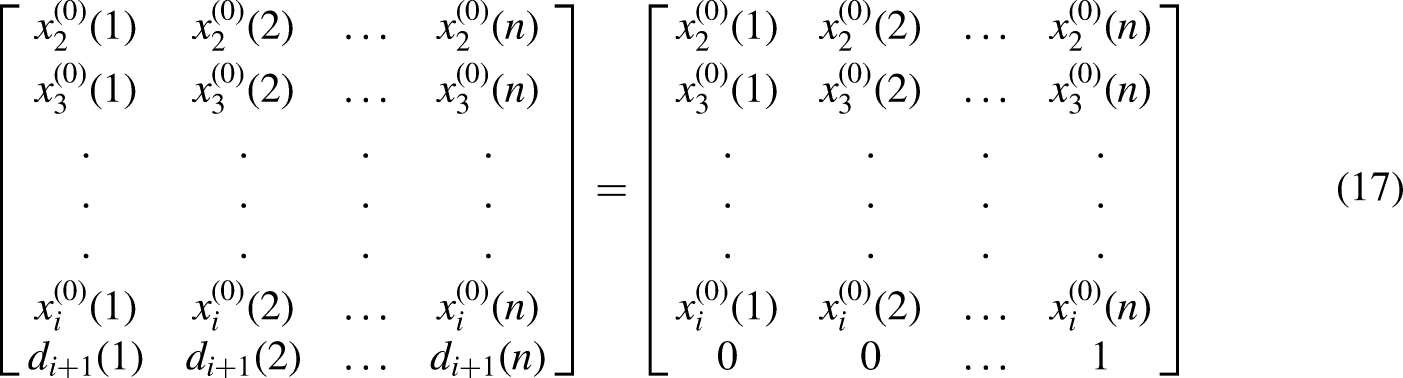
After determining the related sequences associated with the system sequence, the GM(1,N) supplements the initialized uncertain factors sequences behind the known related factors sequences

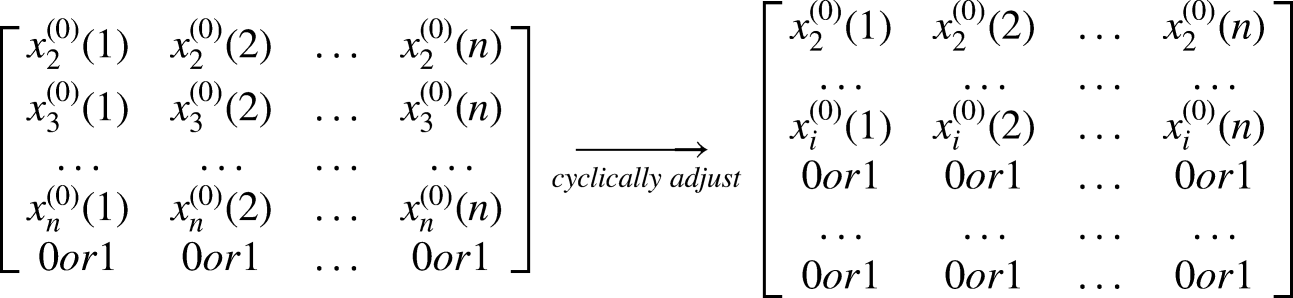
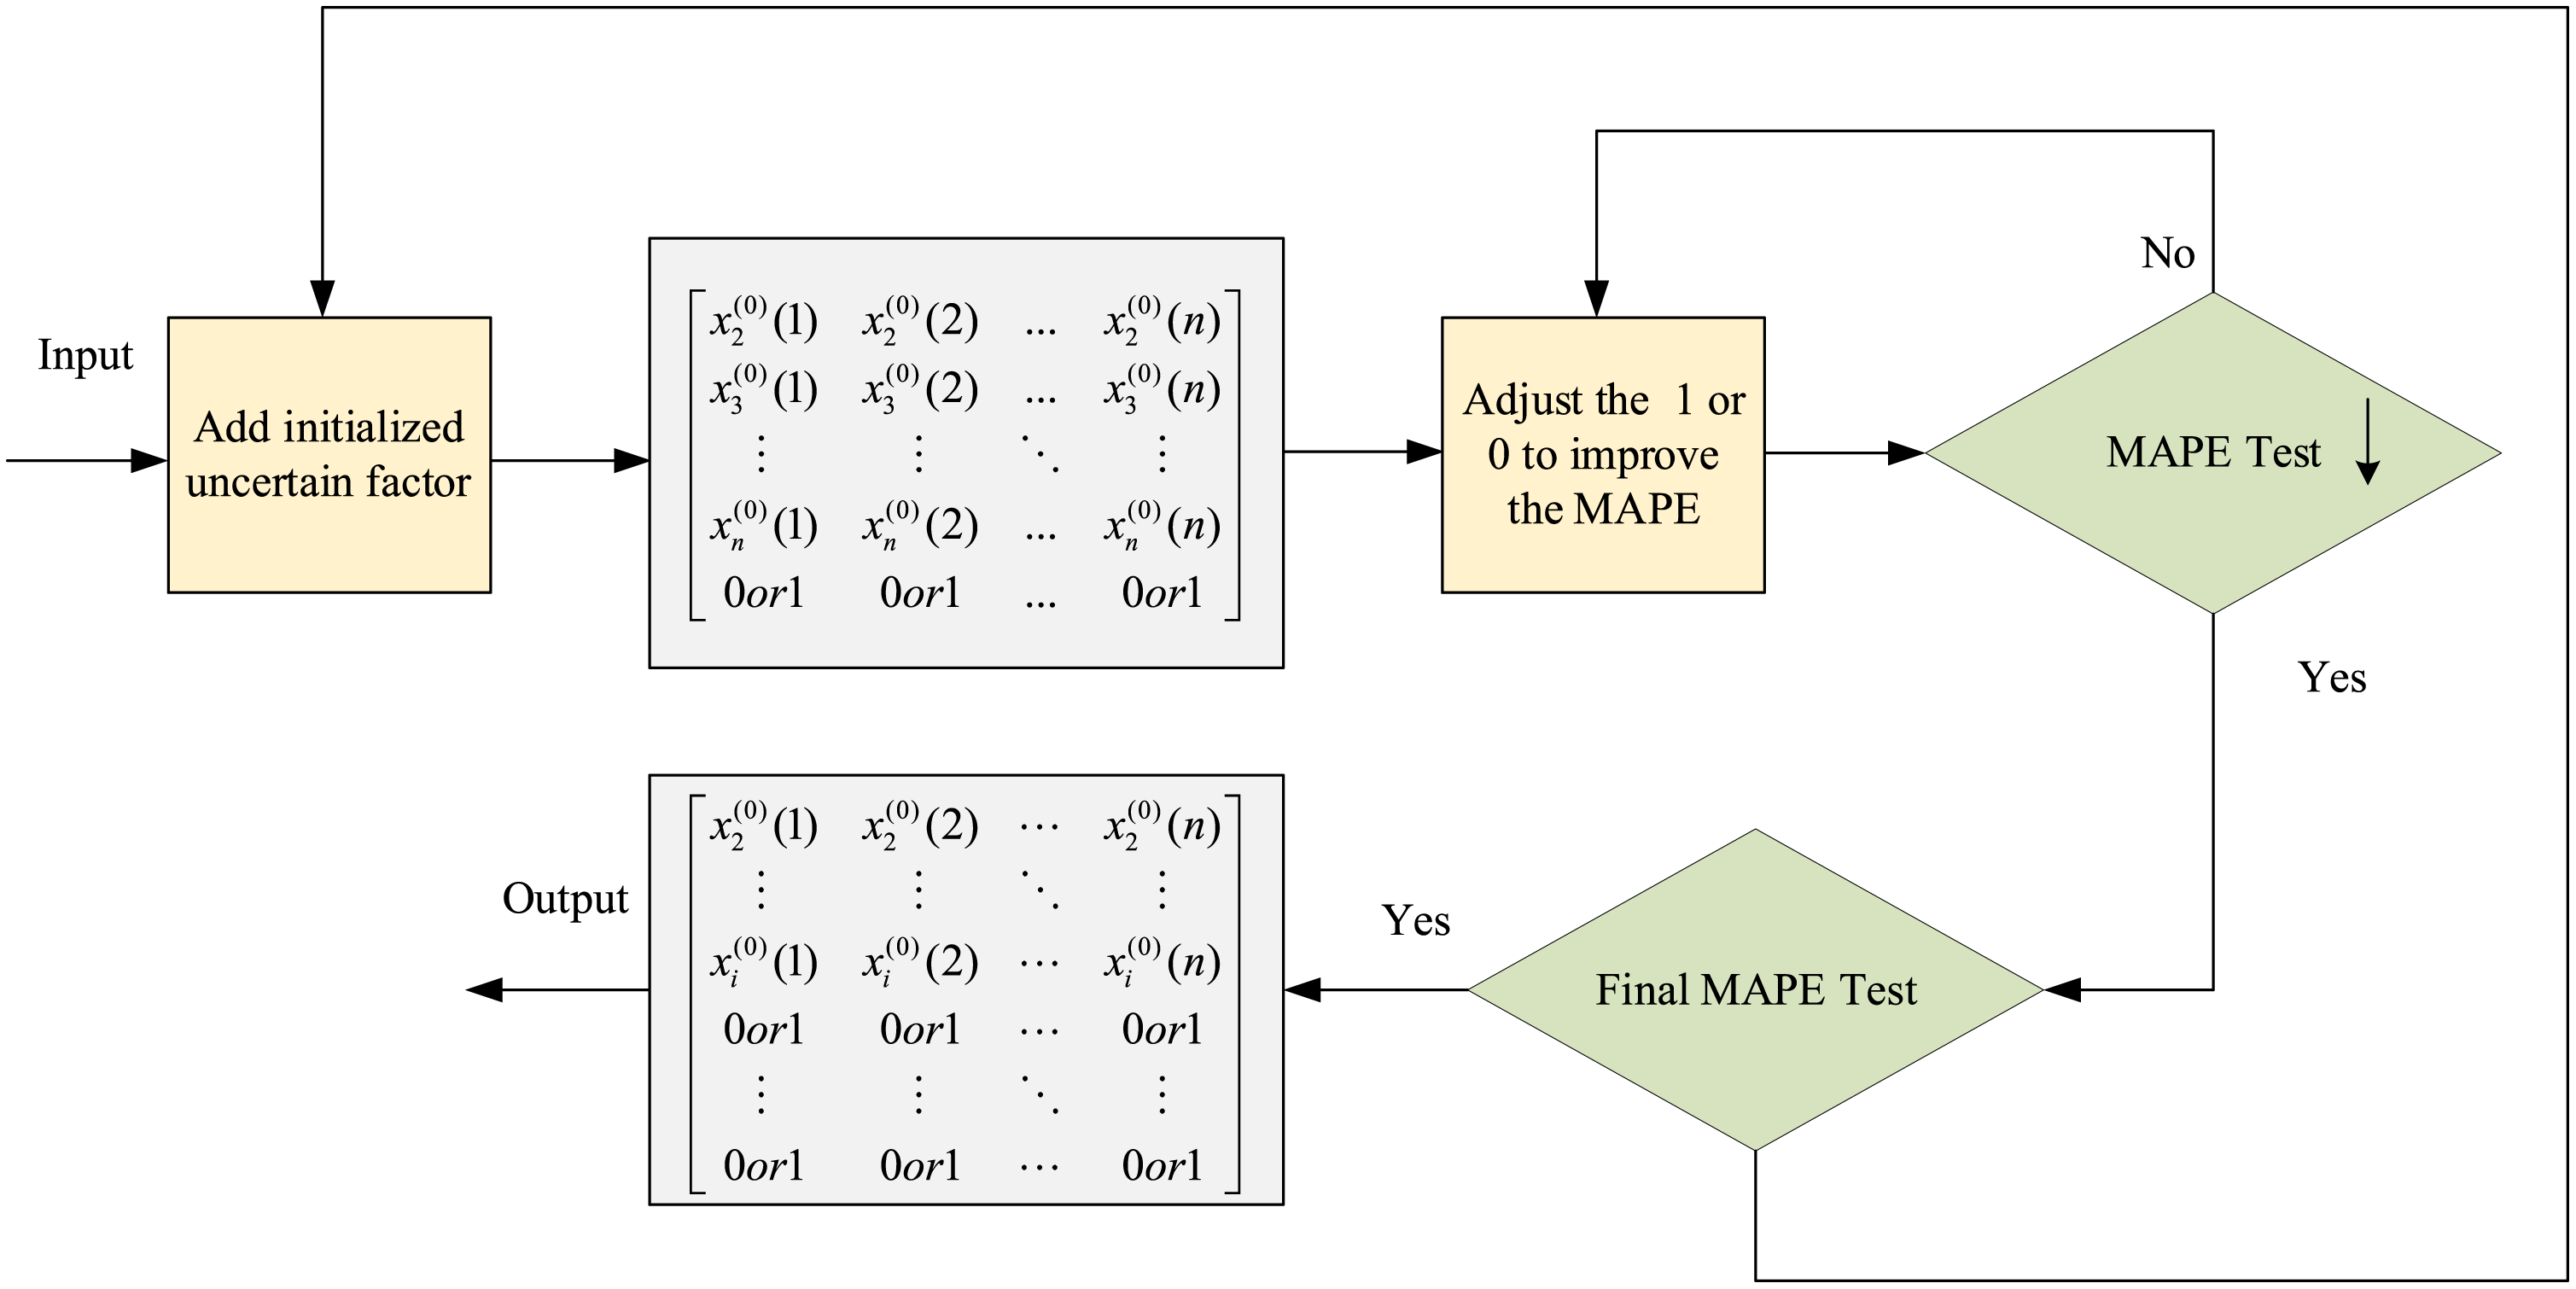
The flow of the cycle-optimized mechanism based on dummy variables.
The background value is also optimized by adopting the optimization algorithm. The new optimized background value is
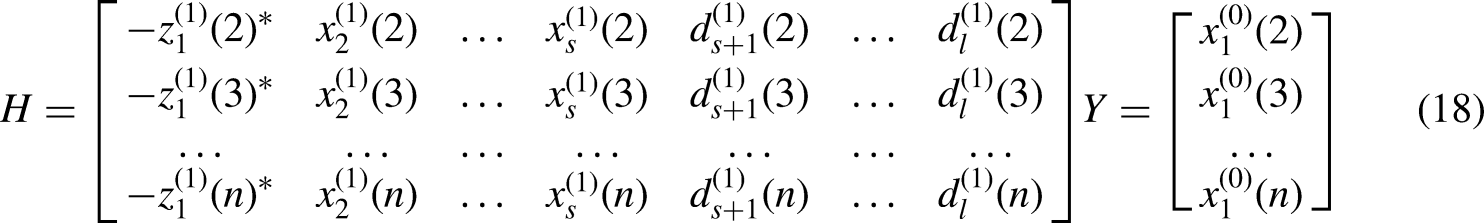
Following the previous calculation using the least squares method


The gray model coefficients are
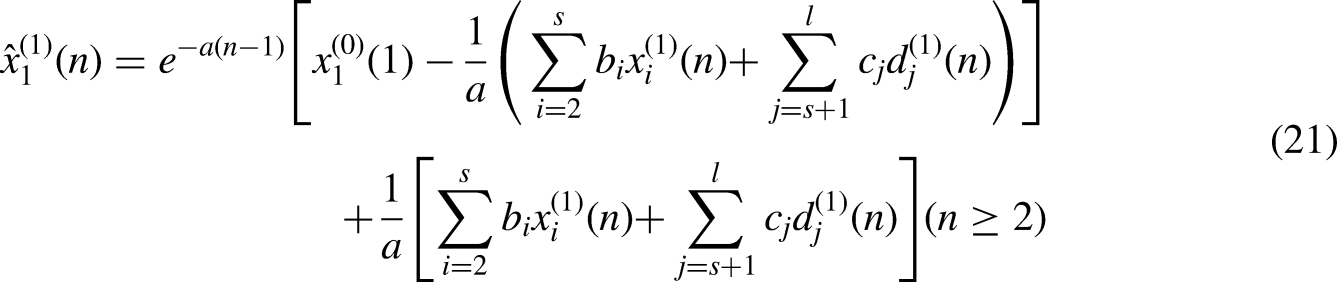
This paper names the improved GM(1,N) as the Optimized GM(1,N) with Dynamic Dummy Variables (DDVOGM(1,N)). The time response function is as follows.
The GCE DEA model
This section treats each city as a producer with m inputs and s outputs. Suppose that each
Consideration of undesirable output and the AR
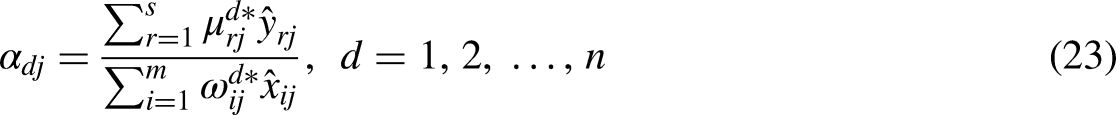
This section deals with the undesirable outputs using the indirect approach, which uses a monotone decreasing function to transform the undesirable outputs into “normal” outputs. The conversion function
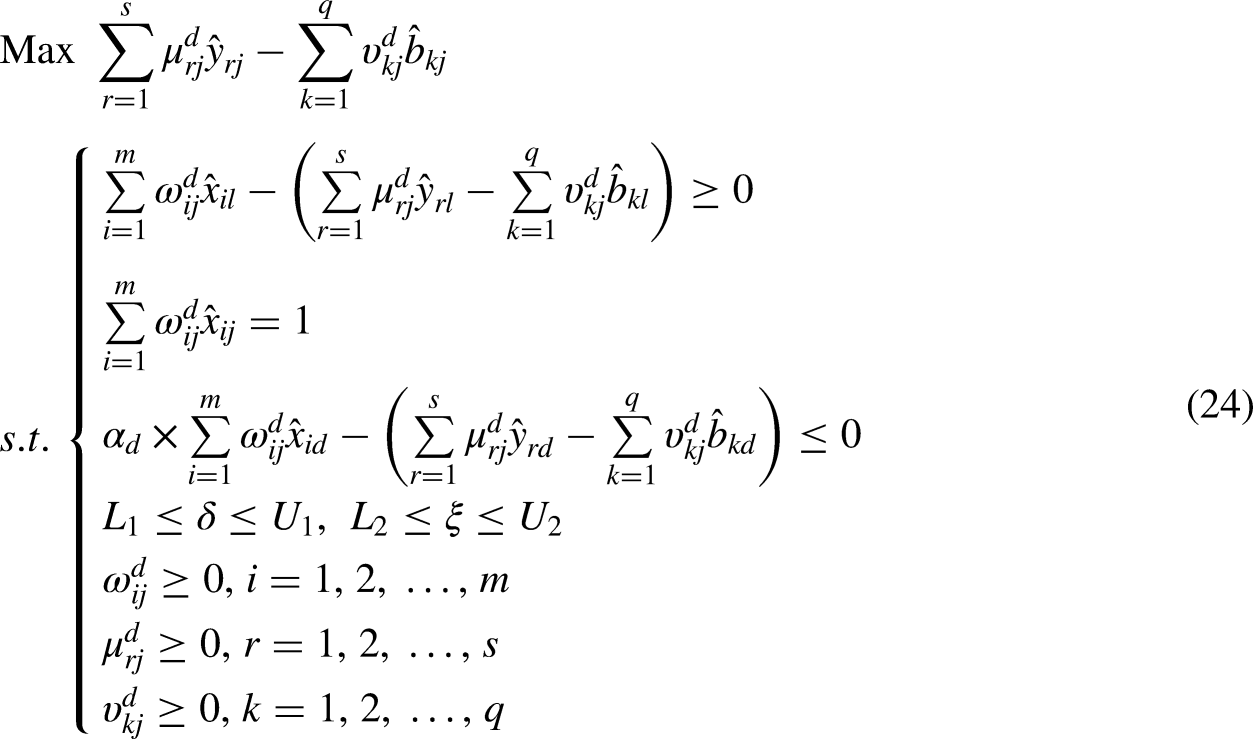
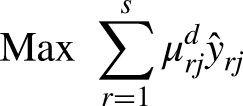
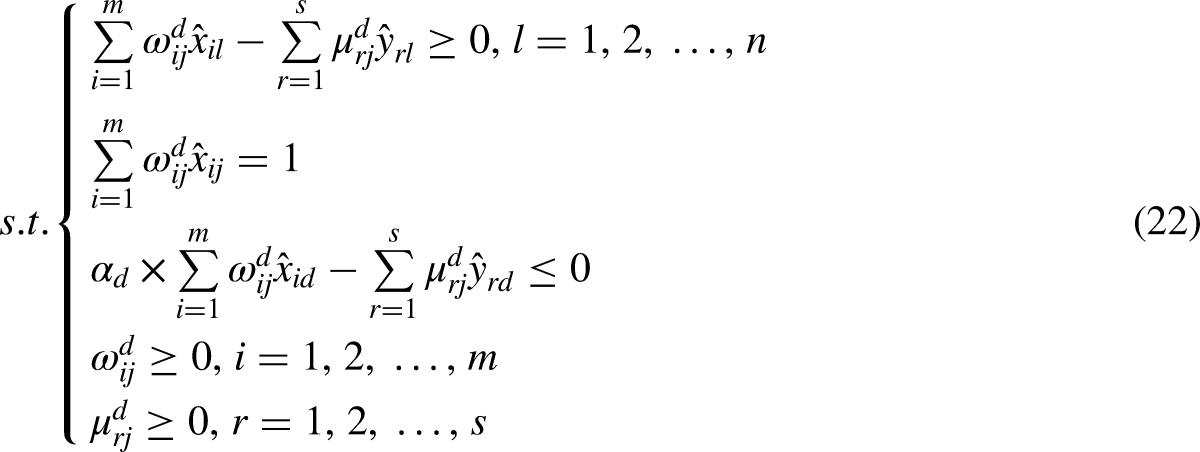
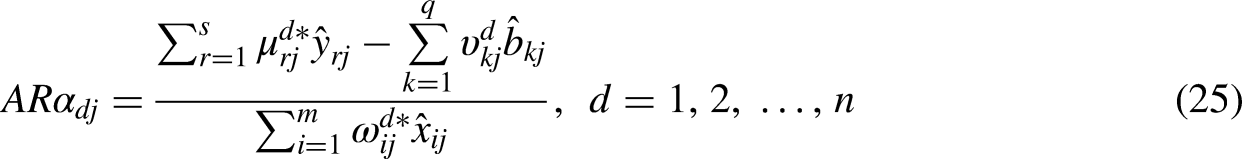
The DEA aims to minimize undesirable outputs when maximizing desirable outputs. Similarly, the CE score of
However, the DEA reference system constructed by only considering the current cross-section data cannot evaluate the changes in efficiency scores in a continuous period manner and is also sensitive to abnormal values. Therefore, this paper borrows the idea of the global DEA and constructs a meta-frontier using the panel data as a standard reference system. The proposed Global AR game cross-efficiency DEA (GAR GCE) can mitigate results that are not robust due to outliers exits in a cross-section.
Suppose that the production possibility set in period t are
The proposed modeling and evaluation steps
Figure 3 shows the framework of the modeling process and evaluation steps. It contains data initialization, input and output data forecasting, and DEA decision-making based on the CEE of the YRD.
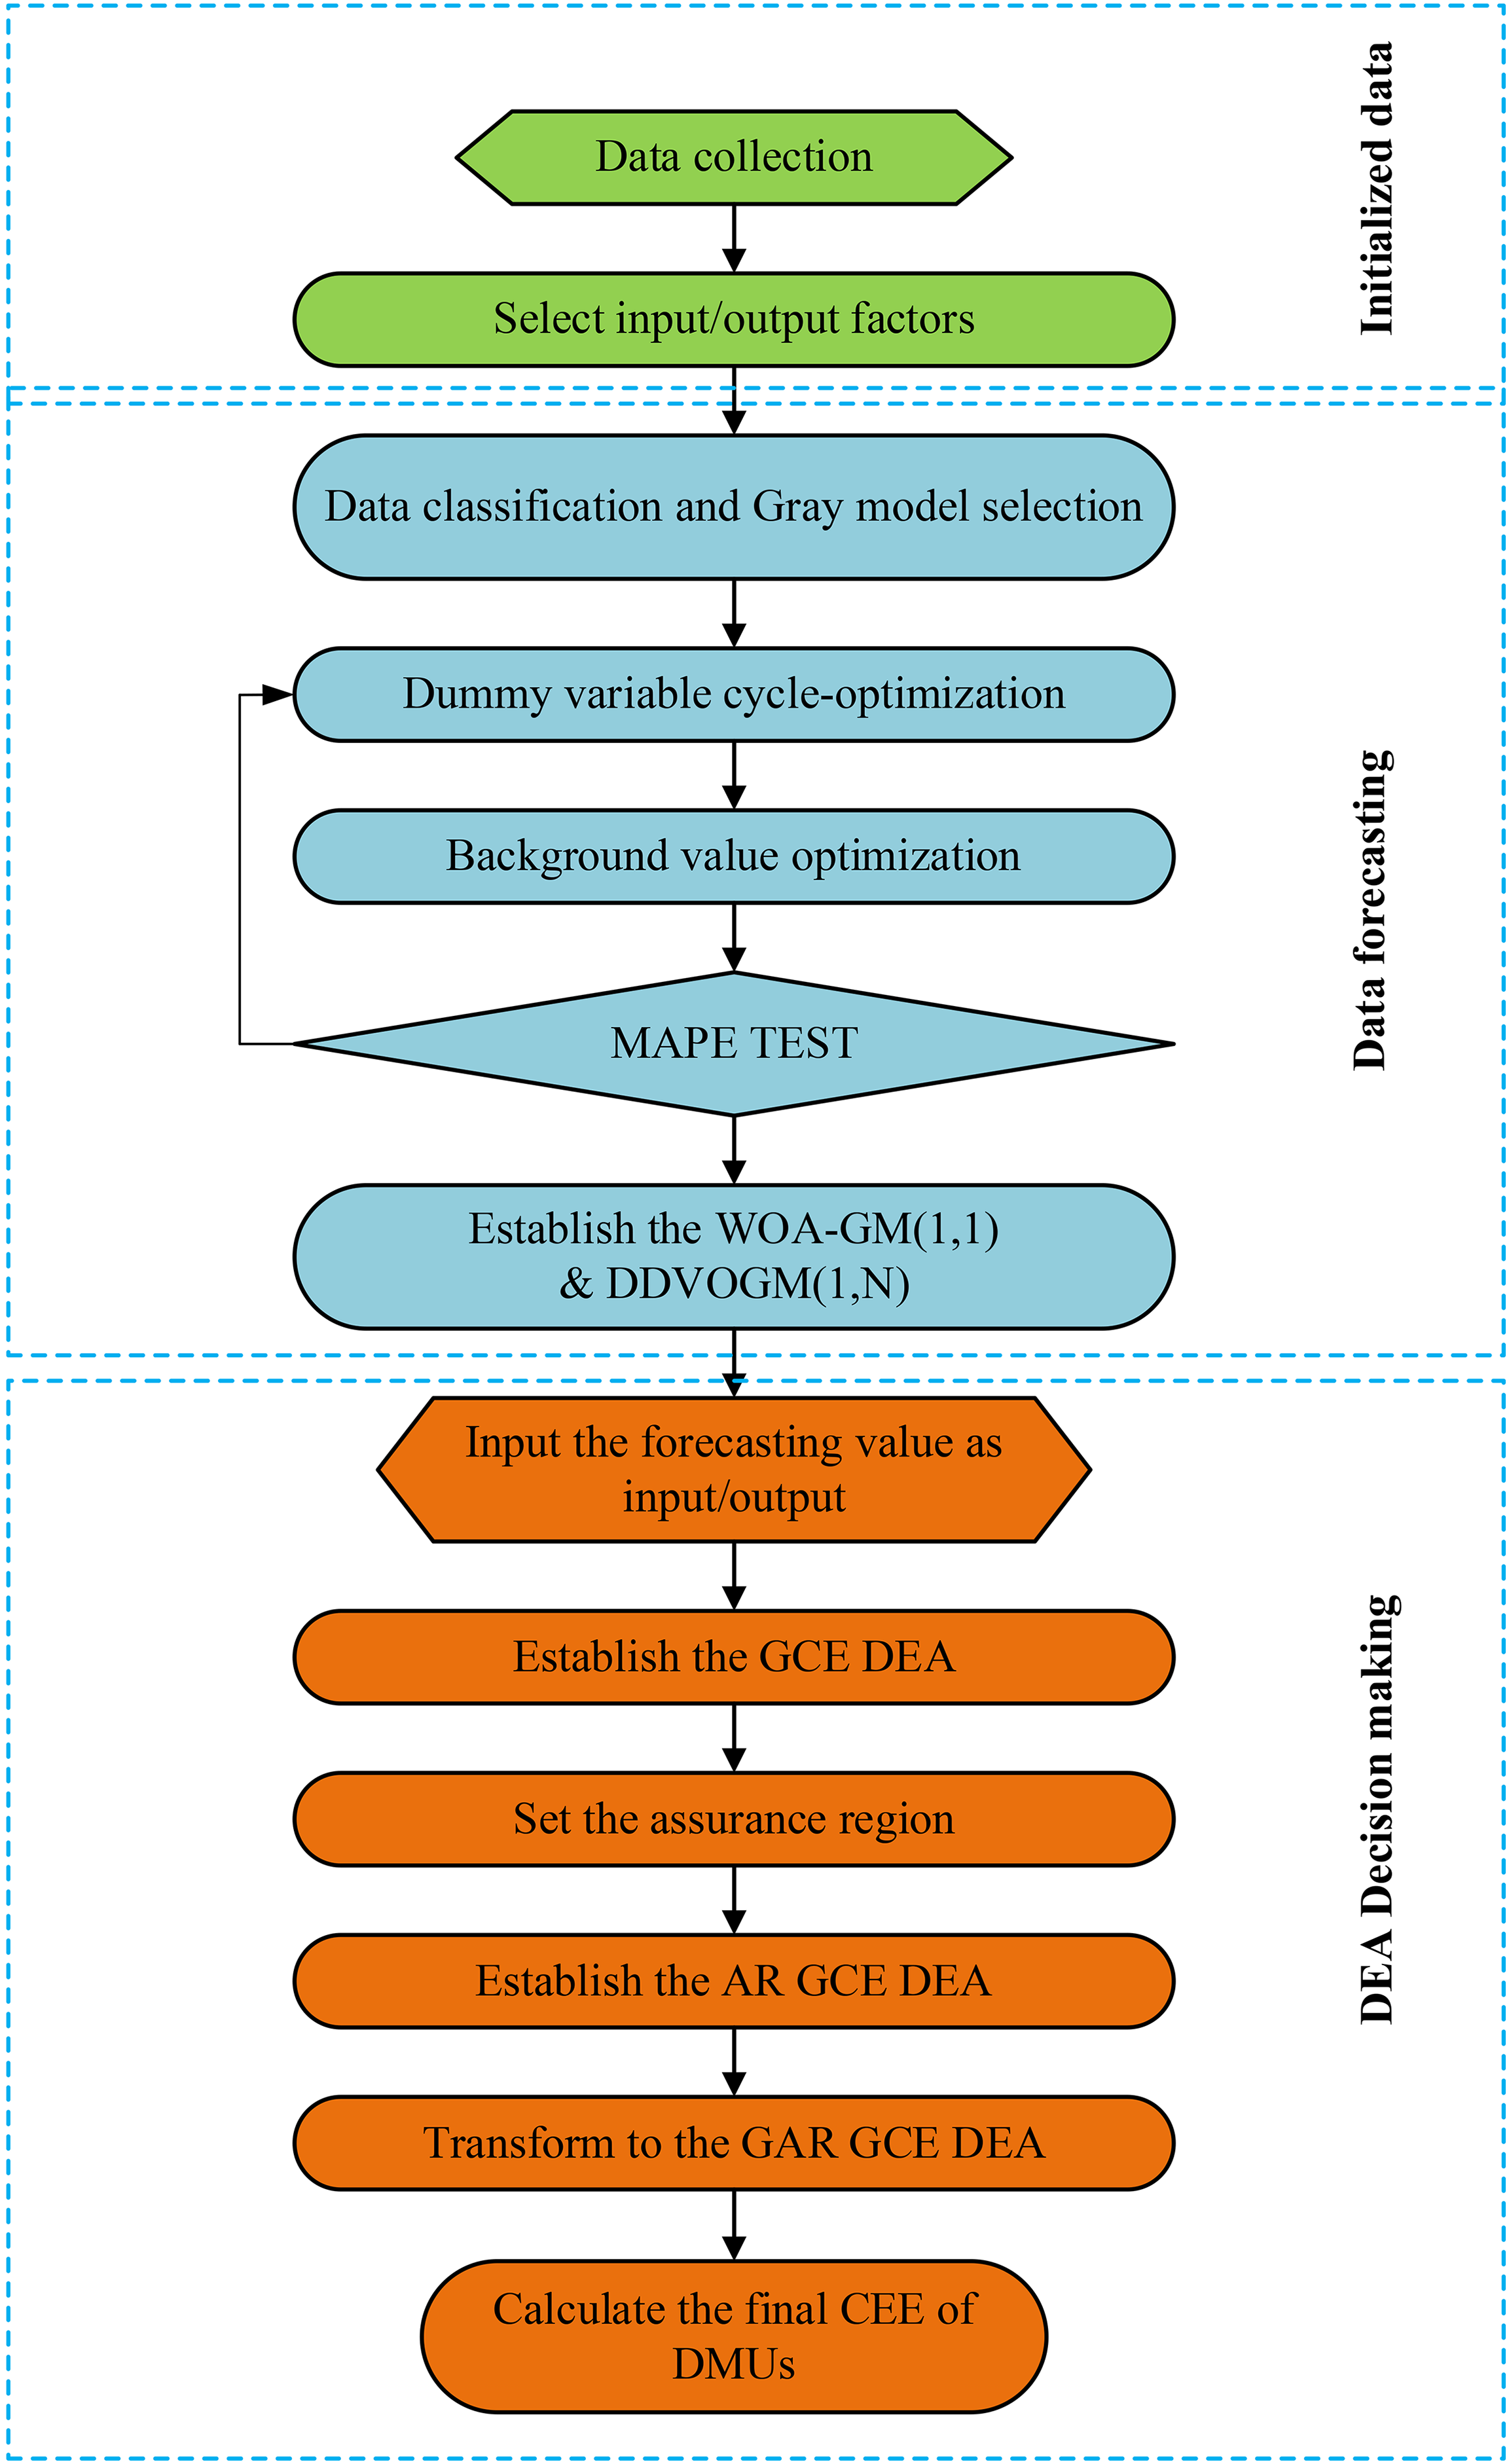
The framework of the modeling process.
The calculation and evaluation steps of the advanced DEA model combined with the gray forecasting perspective are as follows.
Empirical analysis and results
Variable selection
This paper treats each city as a DMU, transforming the forecasting input into the forecasting output variables under given development conditions between carbon emission and economic development.
The forecasting value of the fixed asset investment (Unit: Billion CNY), energy consumption (Unit: 10,000 tons standard coal), and labor force (Unit: 10,000 persons) are input variables. Regional GDP (Unit: Billion CNY) and carbon emissions (Unit: 100,000 tons) forecasting values are desirable and undesirable outputs. Considering the changes and adjustments made by the Chinese government to the statistical management standards, this paper uses the data from the first year after the change of management standards as the sample set for gray forecasting models. As shown in Figure 4, the regional GDP is the desirable output, and carbon emission is the undesirable output.
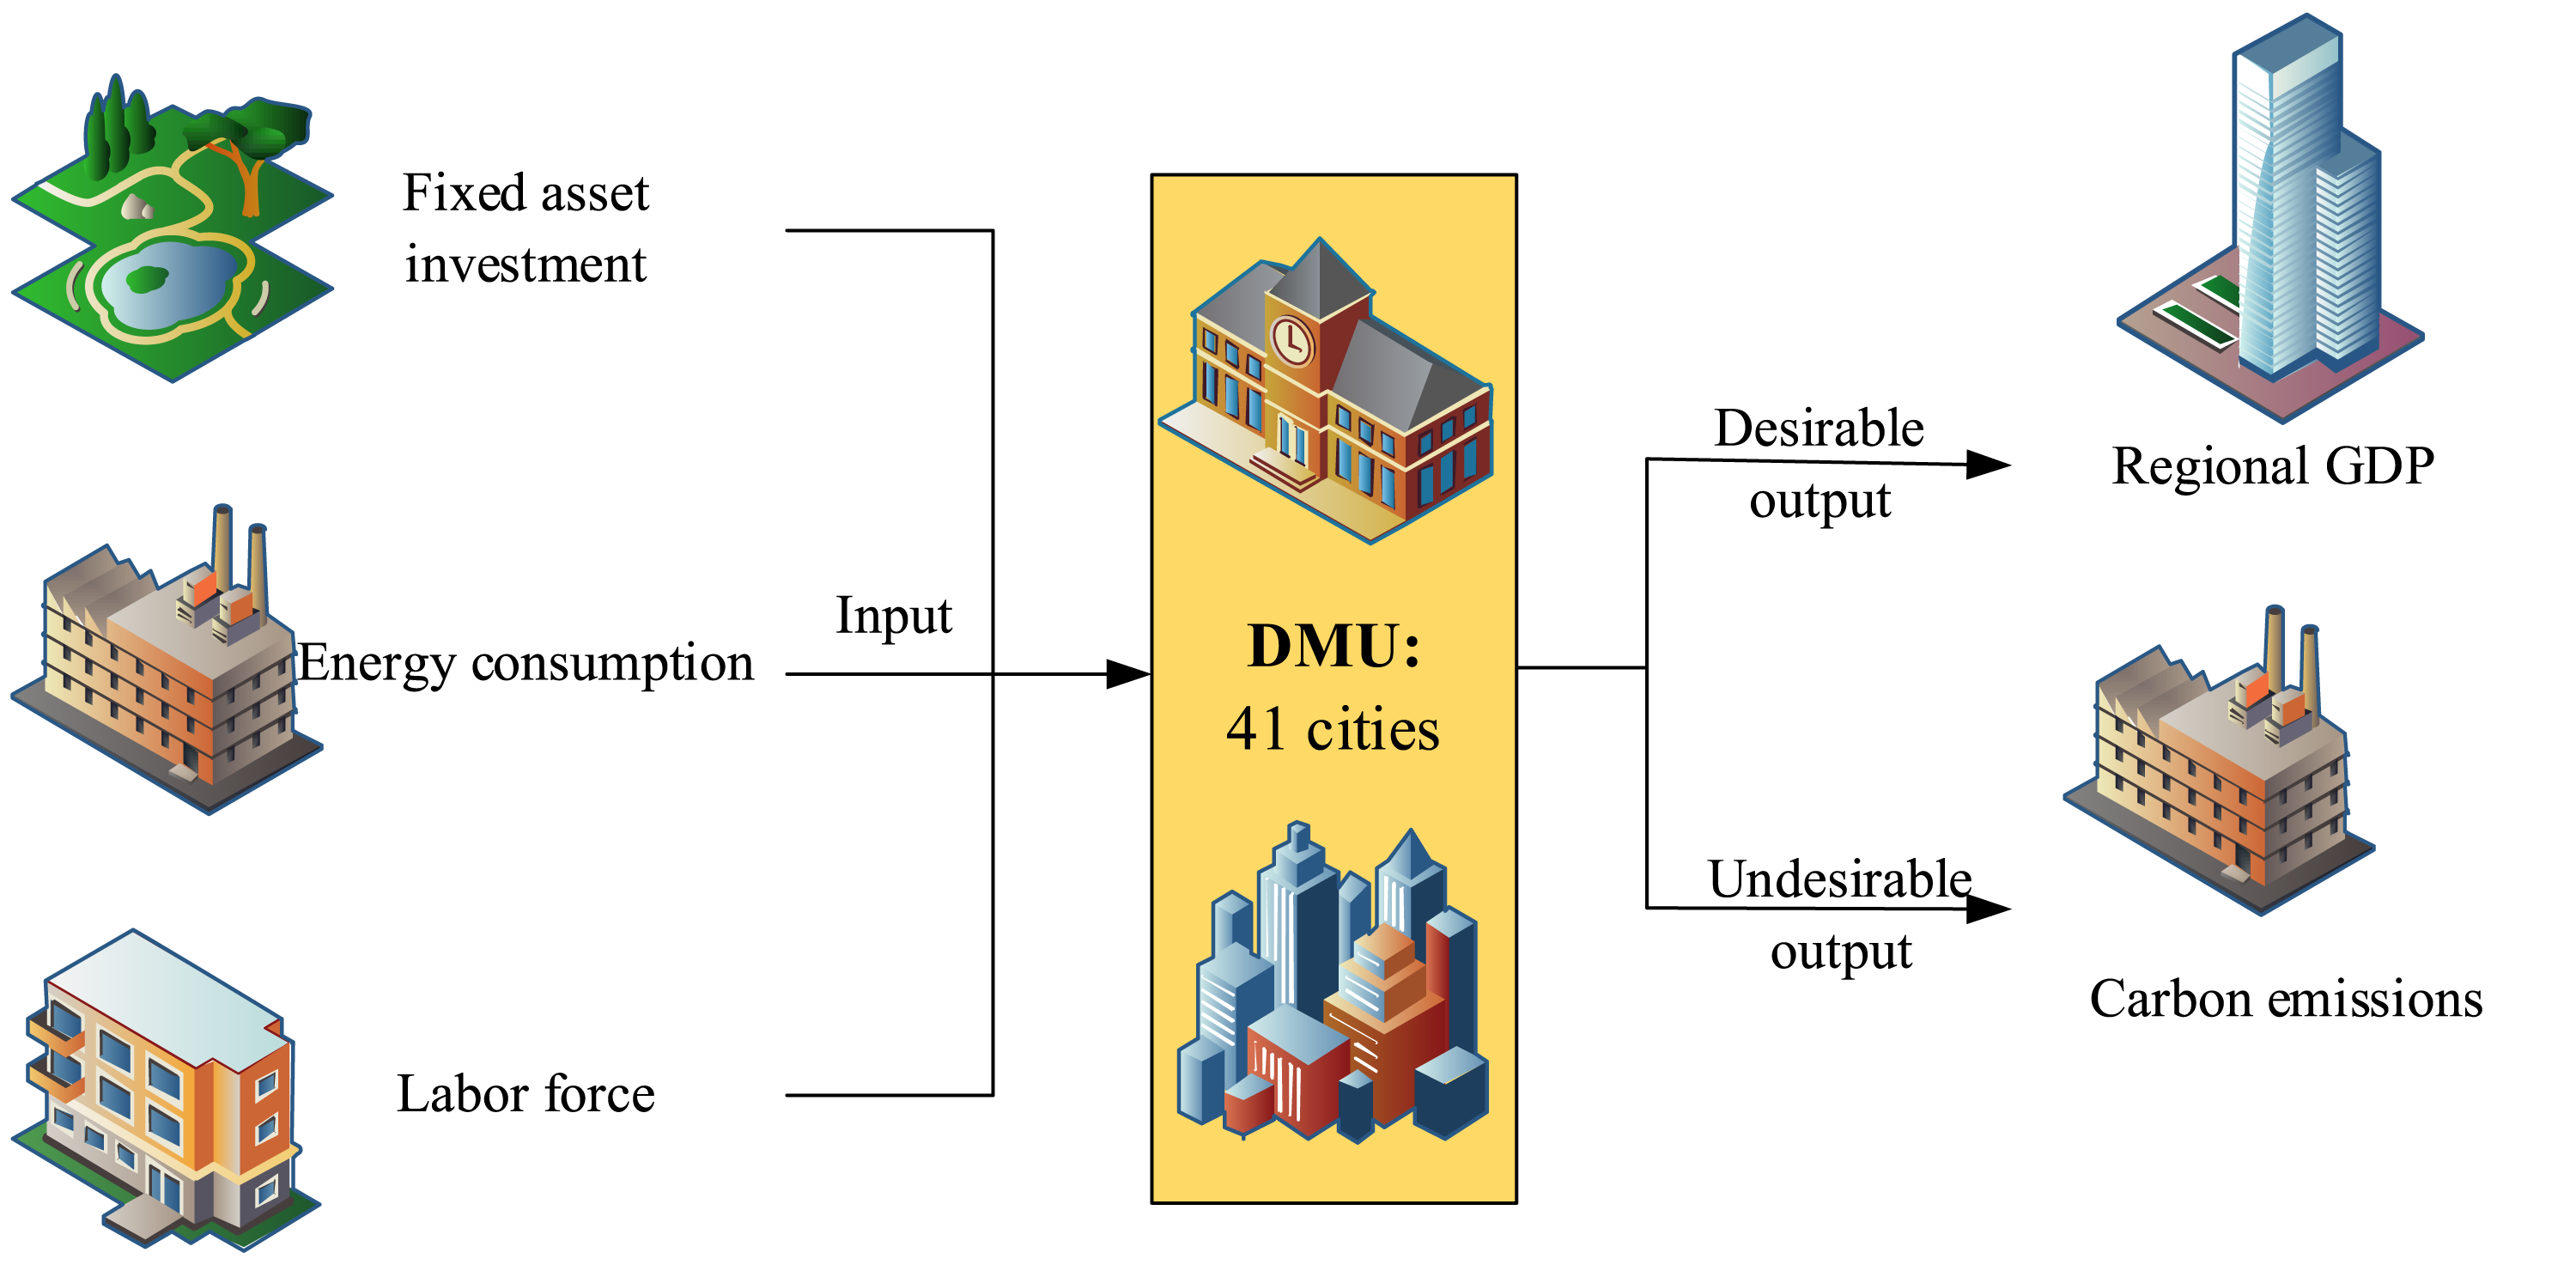
The input-output production system.
The inputs and outputs forecasting
This paper collects official statistics from the China Urban Statistical Yearbook and the China Energy Statistical Yearbook by the National Bureau of Statistics of China as input and output indicators. The carbon emission data set is collected from China's High-Resolution Emission Gridded Data. The supplementary file contains the data sample indicators, gray model modeling parameters, model accuracy, and forecasting results. In this paper, the established gray models whose accuracy constraint error satisfies less than 10% can meet the input and output requirements.
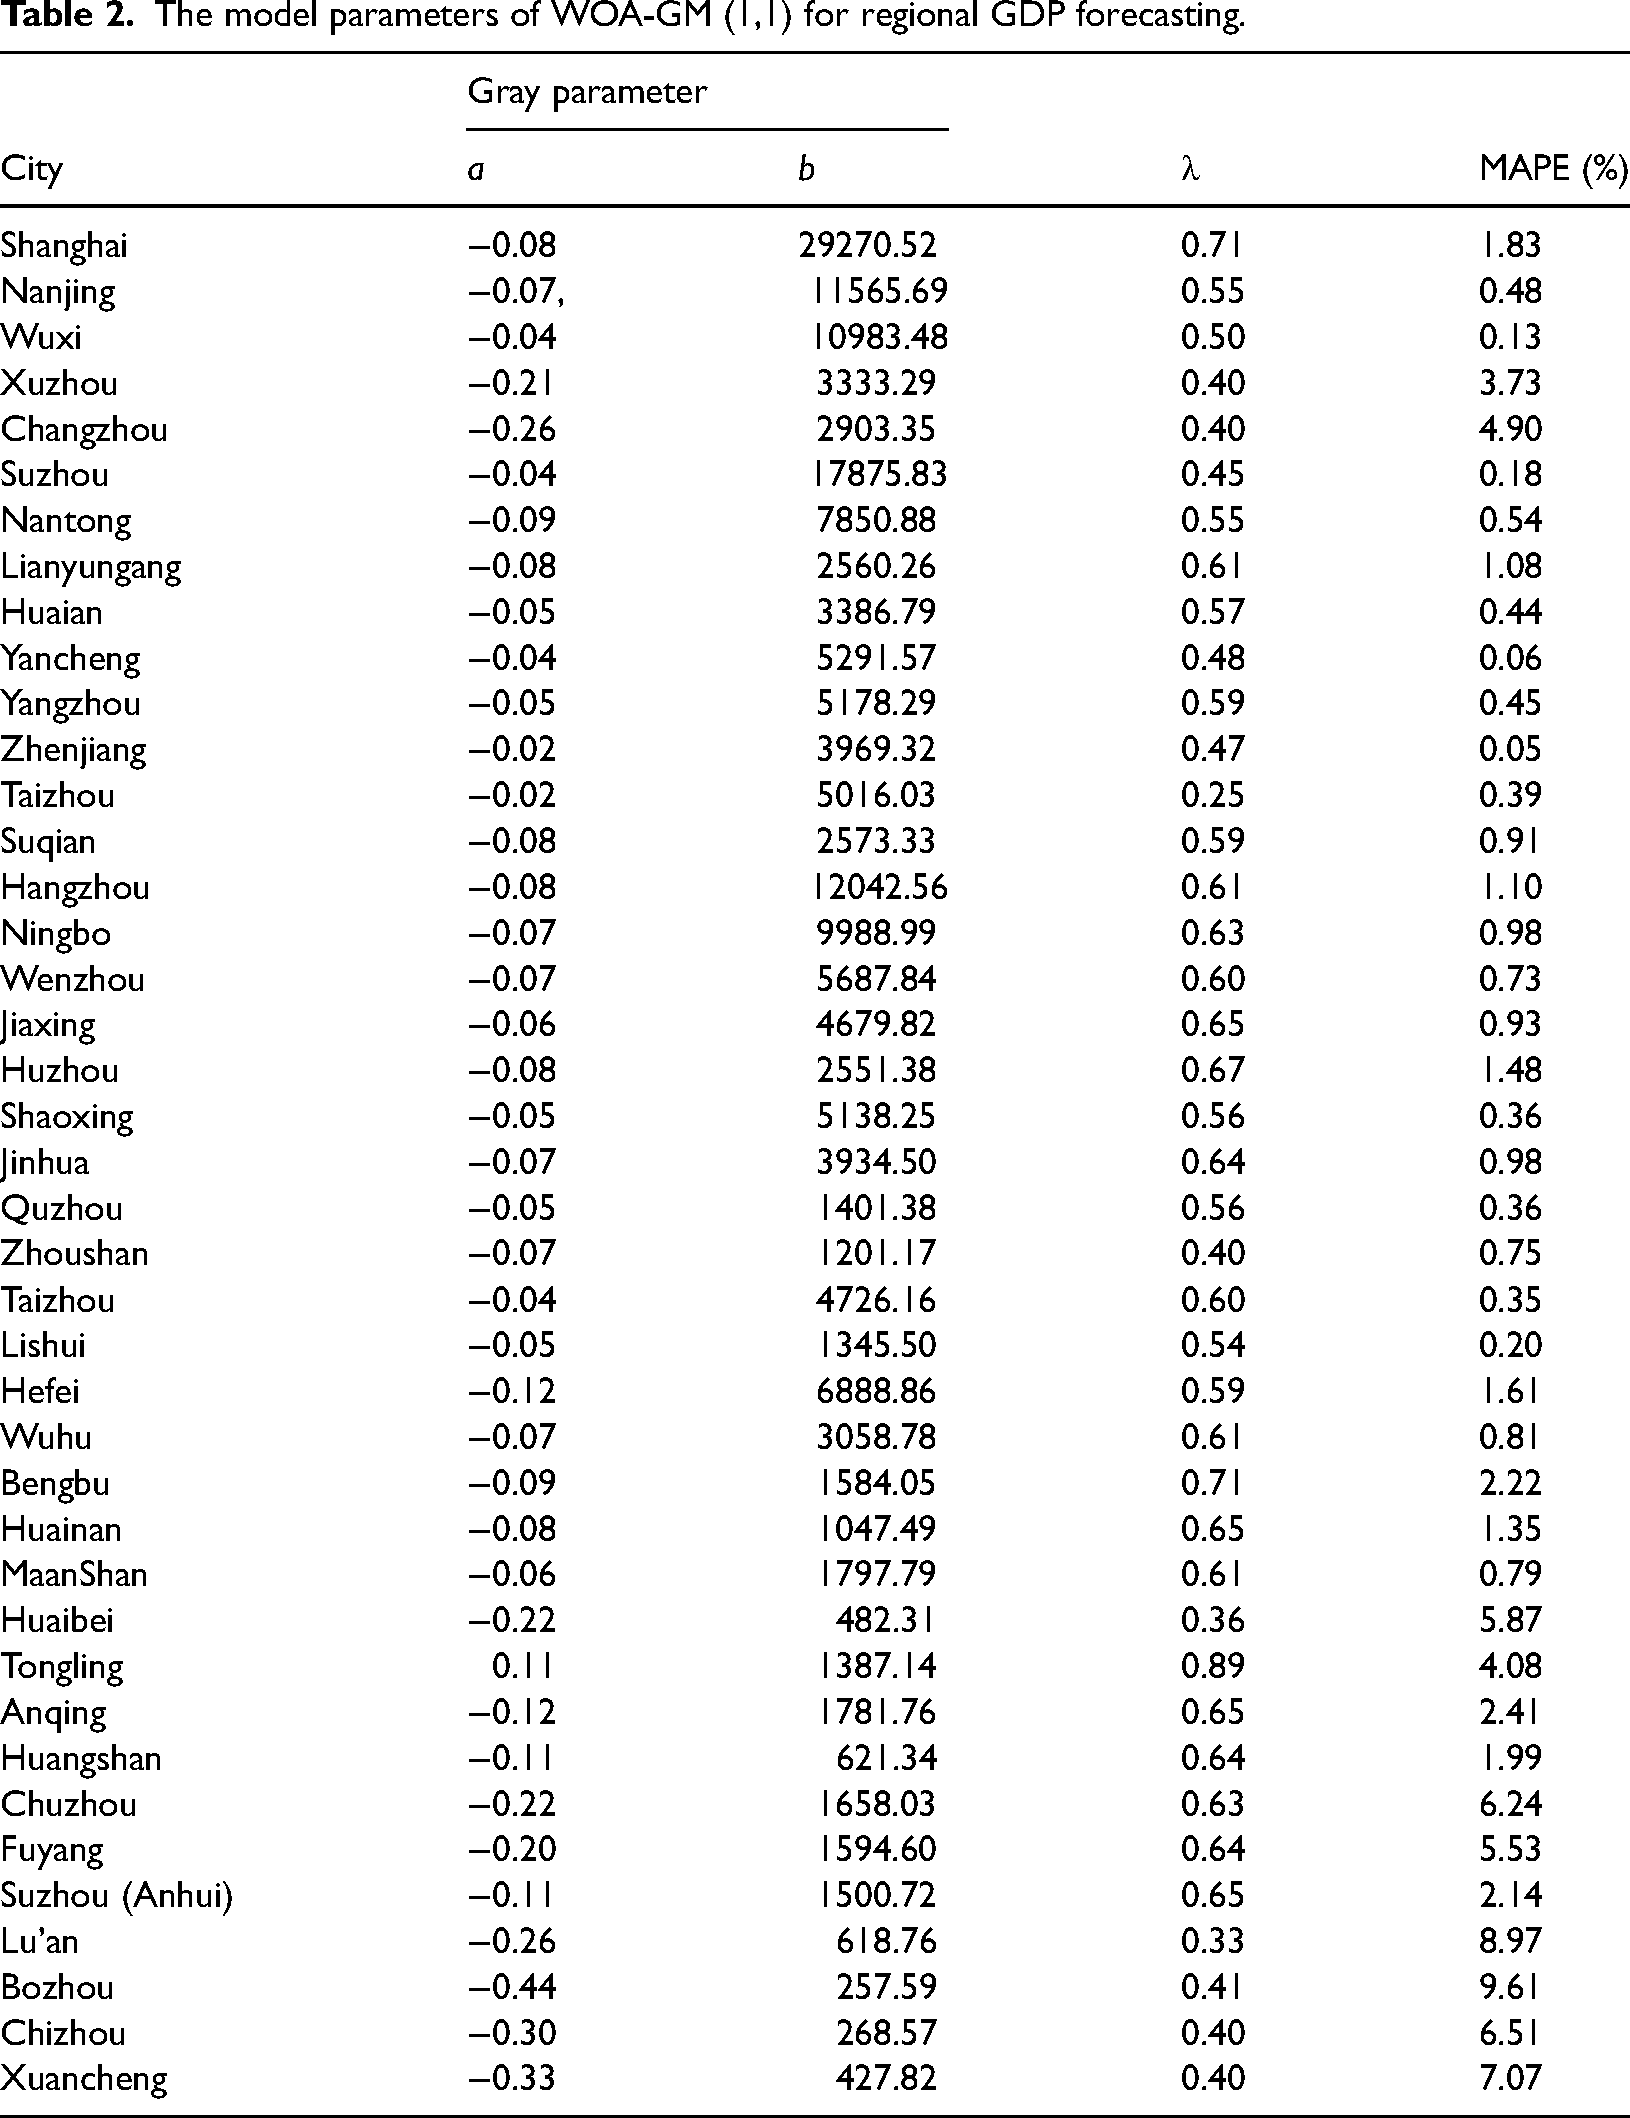
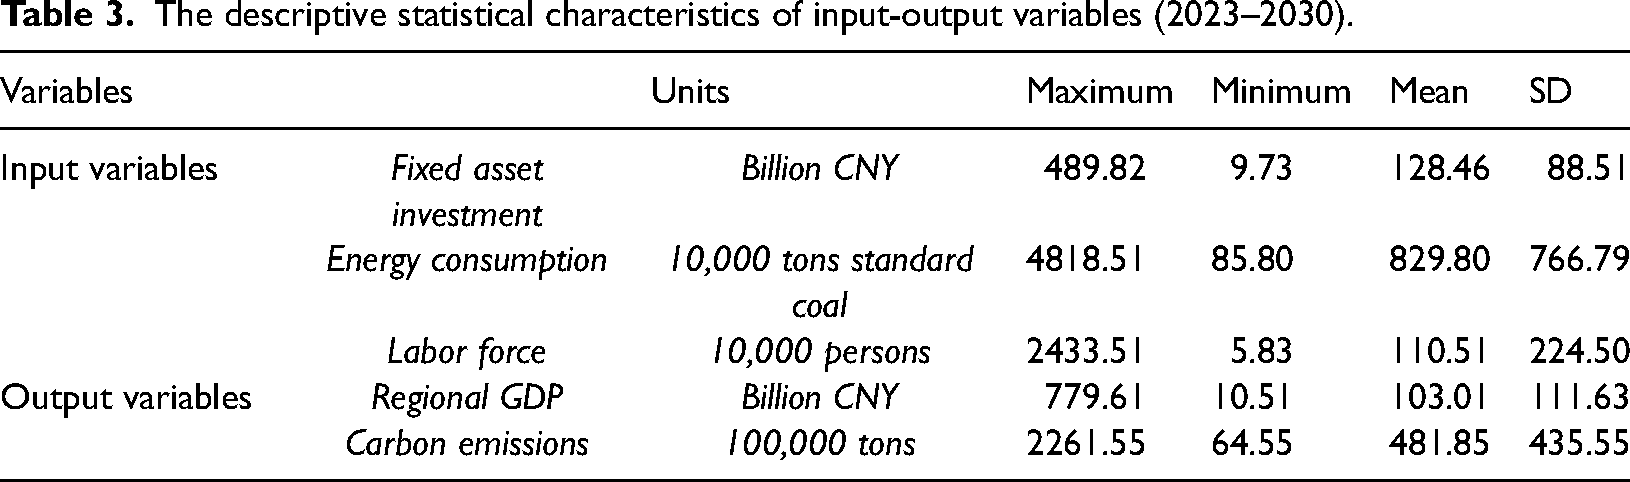
Considering that this paper focuses on carbon emission data, which has large fluctuations and prominent nonlinear characteristics, this paper selects the DDVOGM(1,N) to forecast carbon emission. The related factor sequences consist of each province's virtual variable series of coke production and the uncertainty influencing factors controlled by the dummy variables. The other four inputs and outputs have a monotonically increasing trend, and this paper adopts the WOA-GM(1,1) to forecast them. The period is 2023 to 2030, and the specific model parameters are adjusted according to the model's accuracy to ensure the model's forecasting validity. Table 1 shows the parameters and MAPE of the DDVOGM(1,N) after passing the accuracy test. Table 2 shows the parameters and MAPE results of the WOA-GM(1,1) for the regional GDP data. Table 3 shows the descriptive statistical characteristics of these input and output variables from 2023 to 2030. The supplementary file contains the remaining gray model application data sample and forecasting results.
The modeling parameter and MAPE of the DDVOGM(1,N).
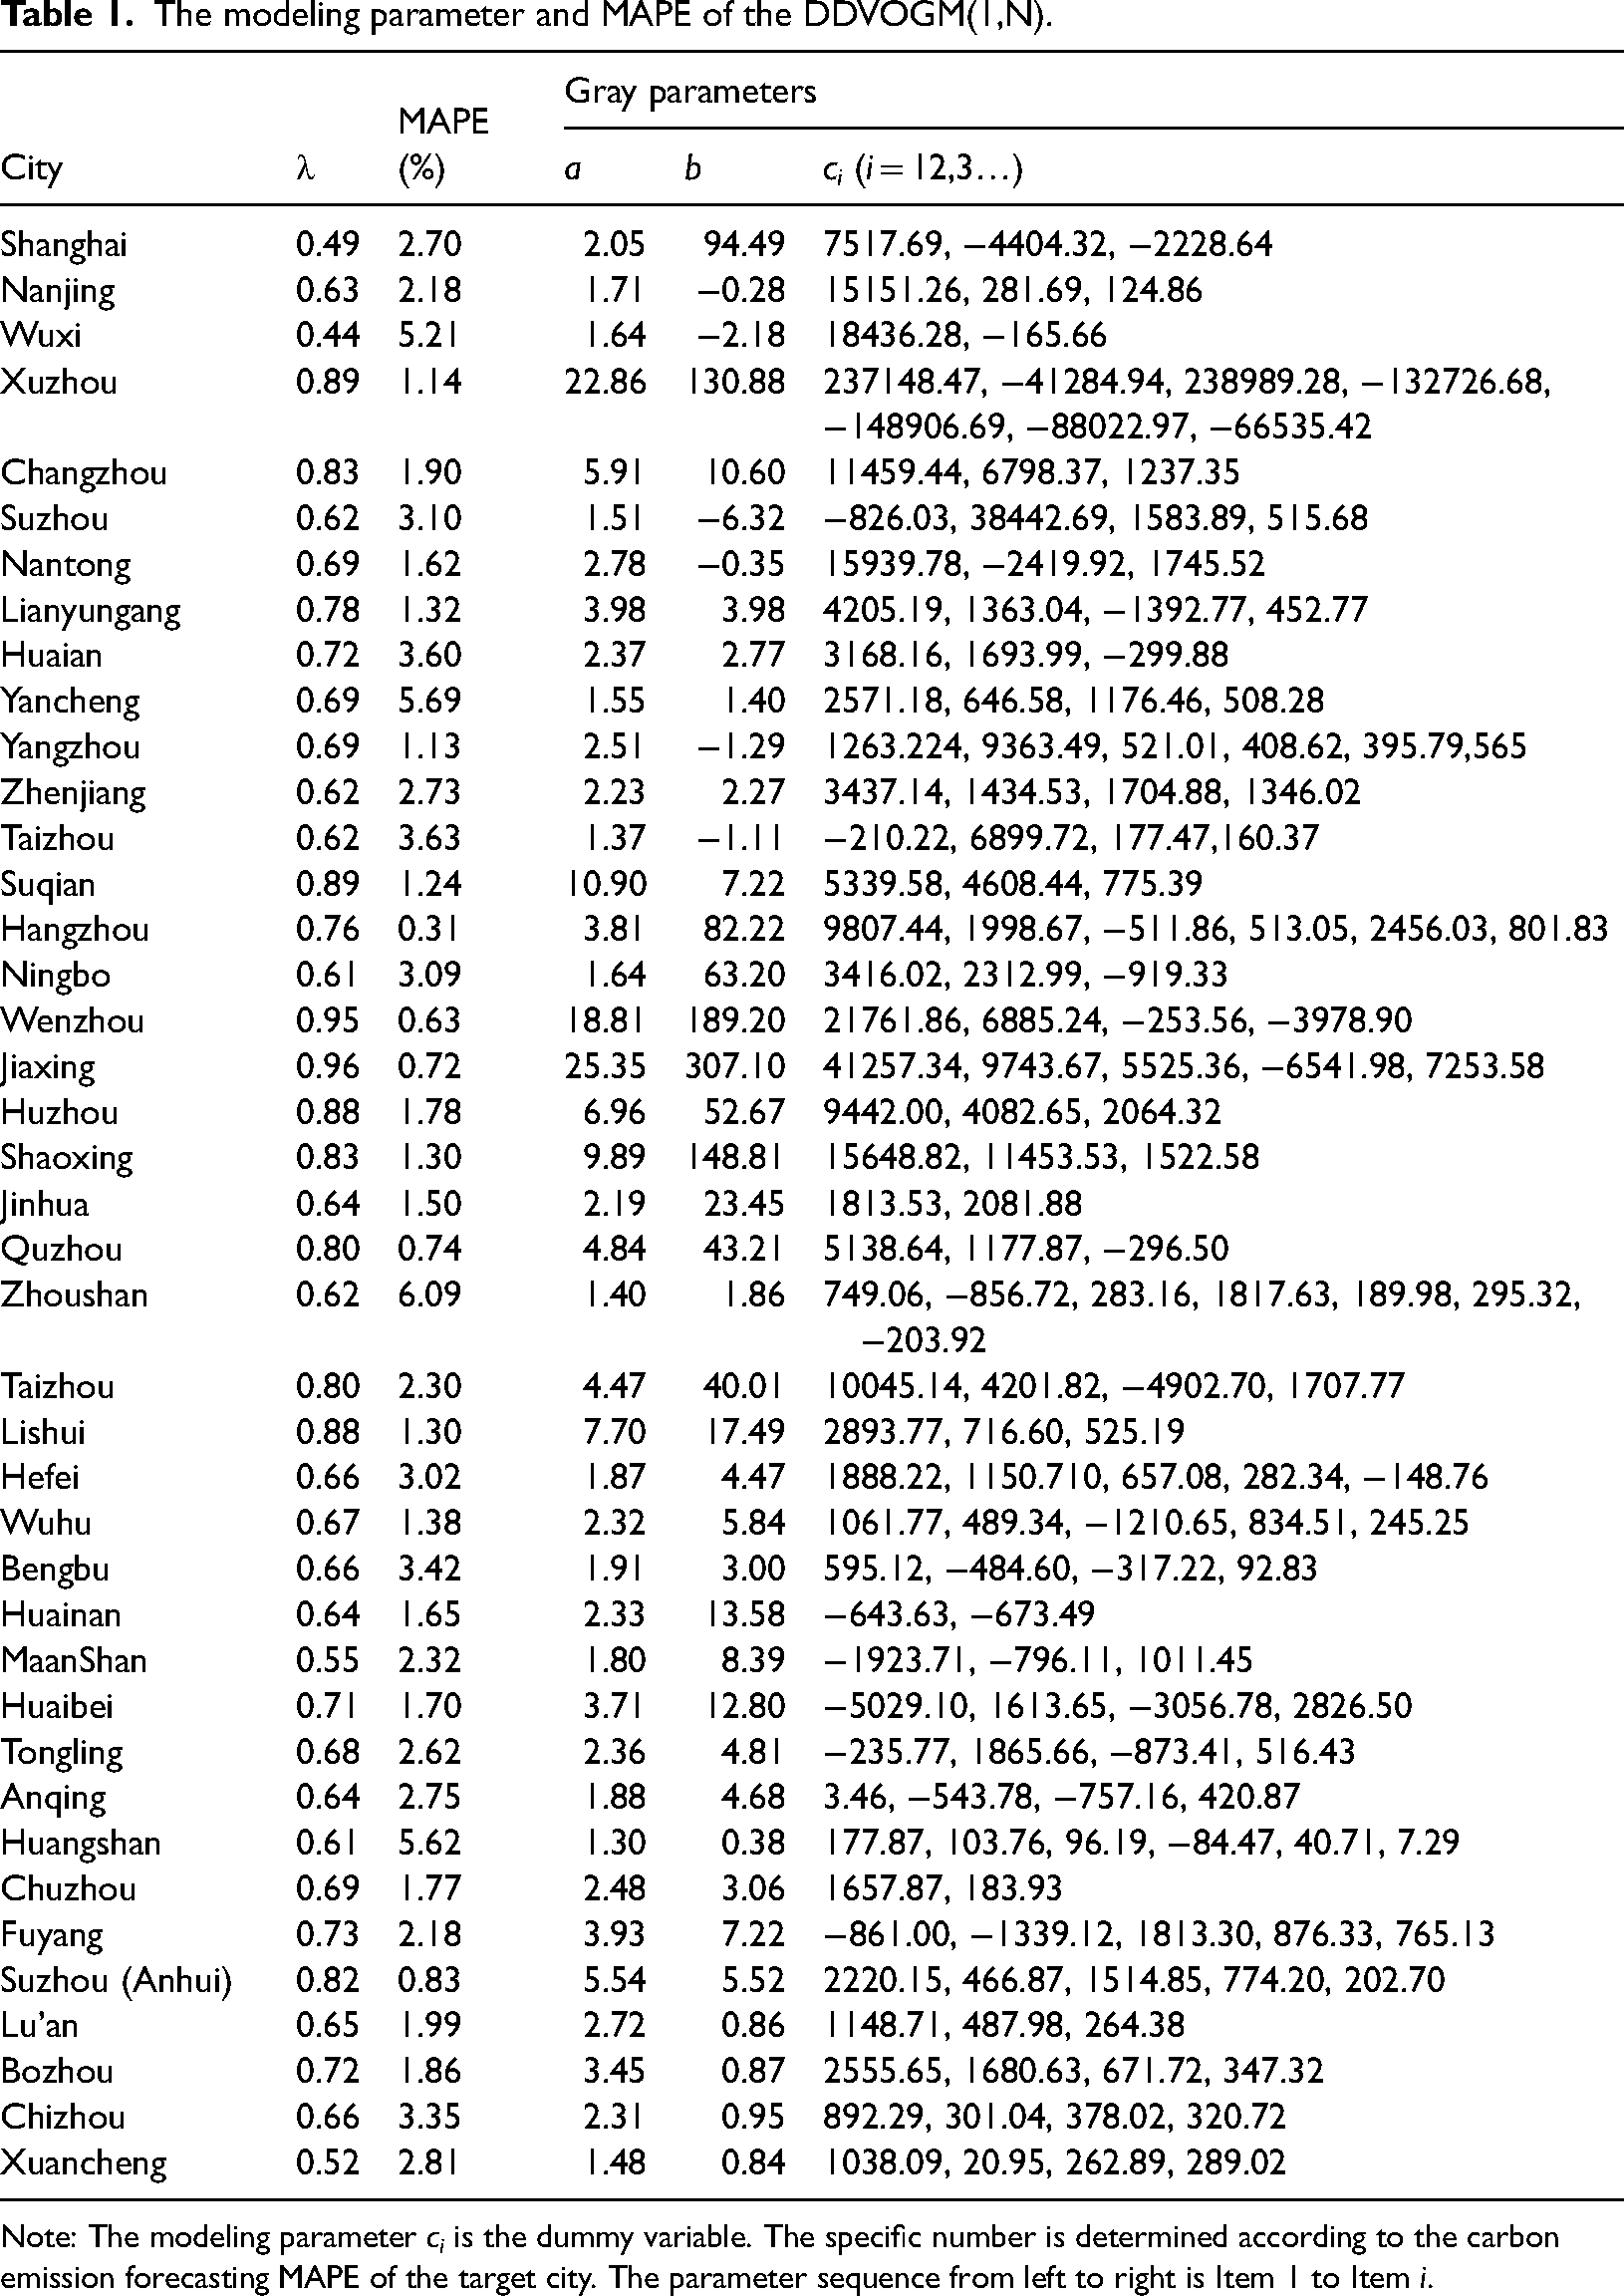
Note: The modeling parameter ci is the dummy variable. The specific number is determined according to the carbon emission forecasting MAPE of the target city. The parameter sequence from left to right is Item 1 to Item i.
The model parameters of WOA-GM (1,1) for regional GDP forecasting.
The descriptive statistical characteristics of input-output variables (2023–2030).
After adjusting the appropriate parameters for the 205 groups of the univariate and multivariate gray models, this paper finally forecasts the input and output variable values. Figure 5 shows the input and output data of the provincial capitals Shanghai, Nanjing, Hangzhou, and Hefei as examples in this section. In contrast, Shanghai's input and output data are more developed, surpassing the other three provincial capitals. In terms of carbon emissions, all four cities showed a downward trend. Regarding fixed asset investment, Shanghai, as a municipality directly under the central government, has developed enormously and invested far more than other cities. Hefei shows an upward trend, reflecting that Anhui Province's current development strategy focuses on its city construction. According to the labor force forecasting data, Shanghai and Hefei have steadily increased yearly. Nanjing and Hangzhou are at risk of declining labor forces.
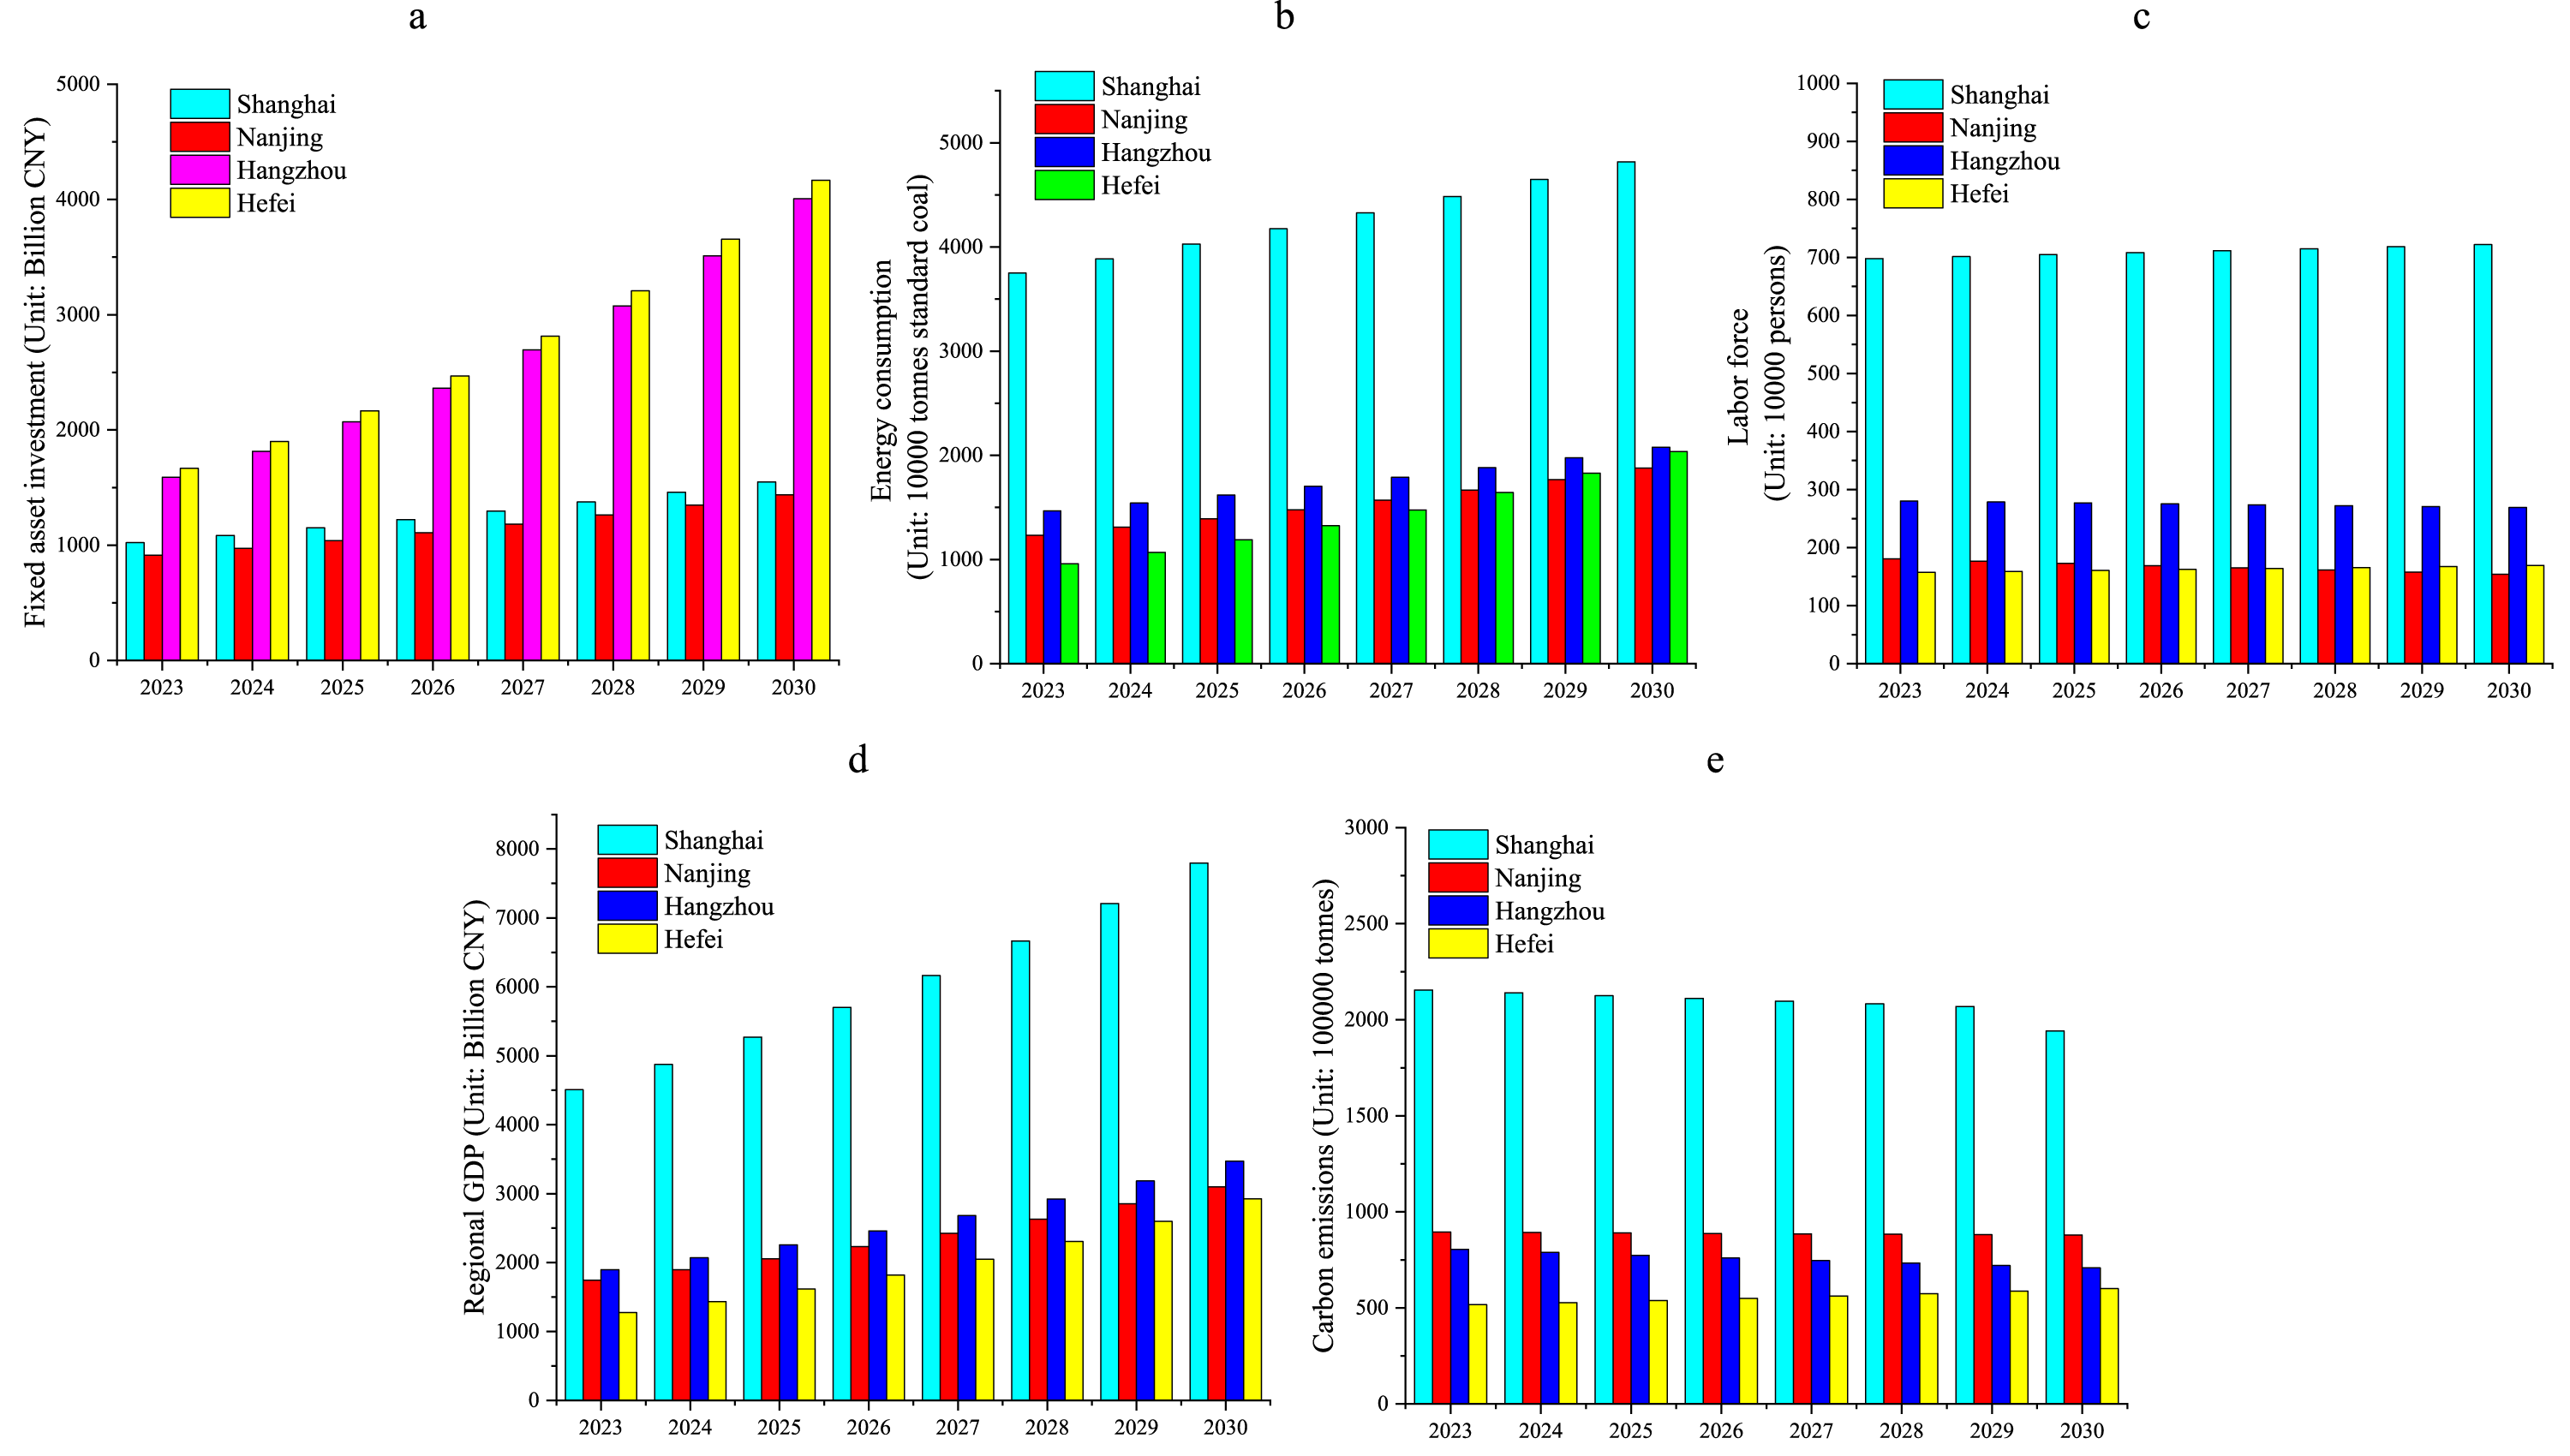
The forecasting trend of input data and output data of the provincial capitals. (a) The forecasting trend of fixed asset investment in the provincial capitals; (b) The forecasting trend of energy consumption of the provincial capitals; (c) The forecasting trend of the labor force of the provincial capitals; (d) The forecasting trend of regional GDP of the provincial capitals; (e) The forecasting trend of carbon emissions of the provincial capitals.
The CEE evaluation
After calculating the above forecasting input and output variables, this paper selects CCR, GCE, AR GCE, and GAR GCE models to calculate the CEE scores of 41 cities. The policy constraint factor is determined by a 15% reduction in energy consumption and a 20% reduction in the intensity of carbon emissions.
Table 4 shows the average CEE scores of different DEA models for the 41 cities from 2023 to 2030. The result shows that the average CEE scores of CCR and GCE are 0.5177 and 0.4266 when the energy consumption and carbon emission limits are not considered. Considering energy consumption and carbon emission constraints, the average CEE scores of AR GCE and GAR GCE are 0.4031 and 0.2142, respectively. It is noted that the traditional DEA models have the highest evaluation of CEE detached from the actual economic development of the YRD and entirely ignore the contradiction and impact of carbon emissions and energy consumption on the economy and industry.
The evaluating results of the selected DEA models.
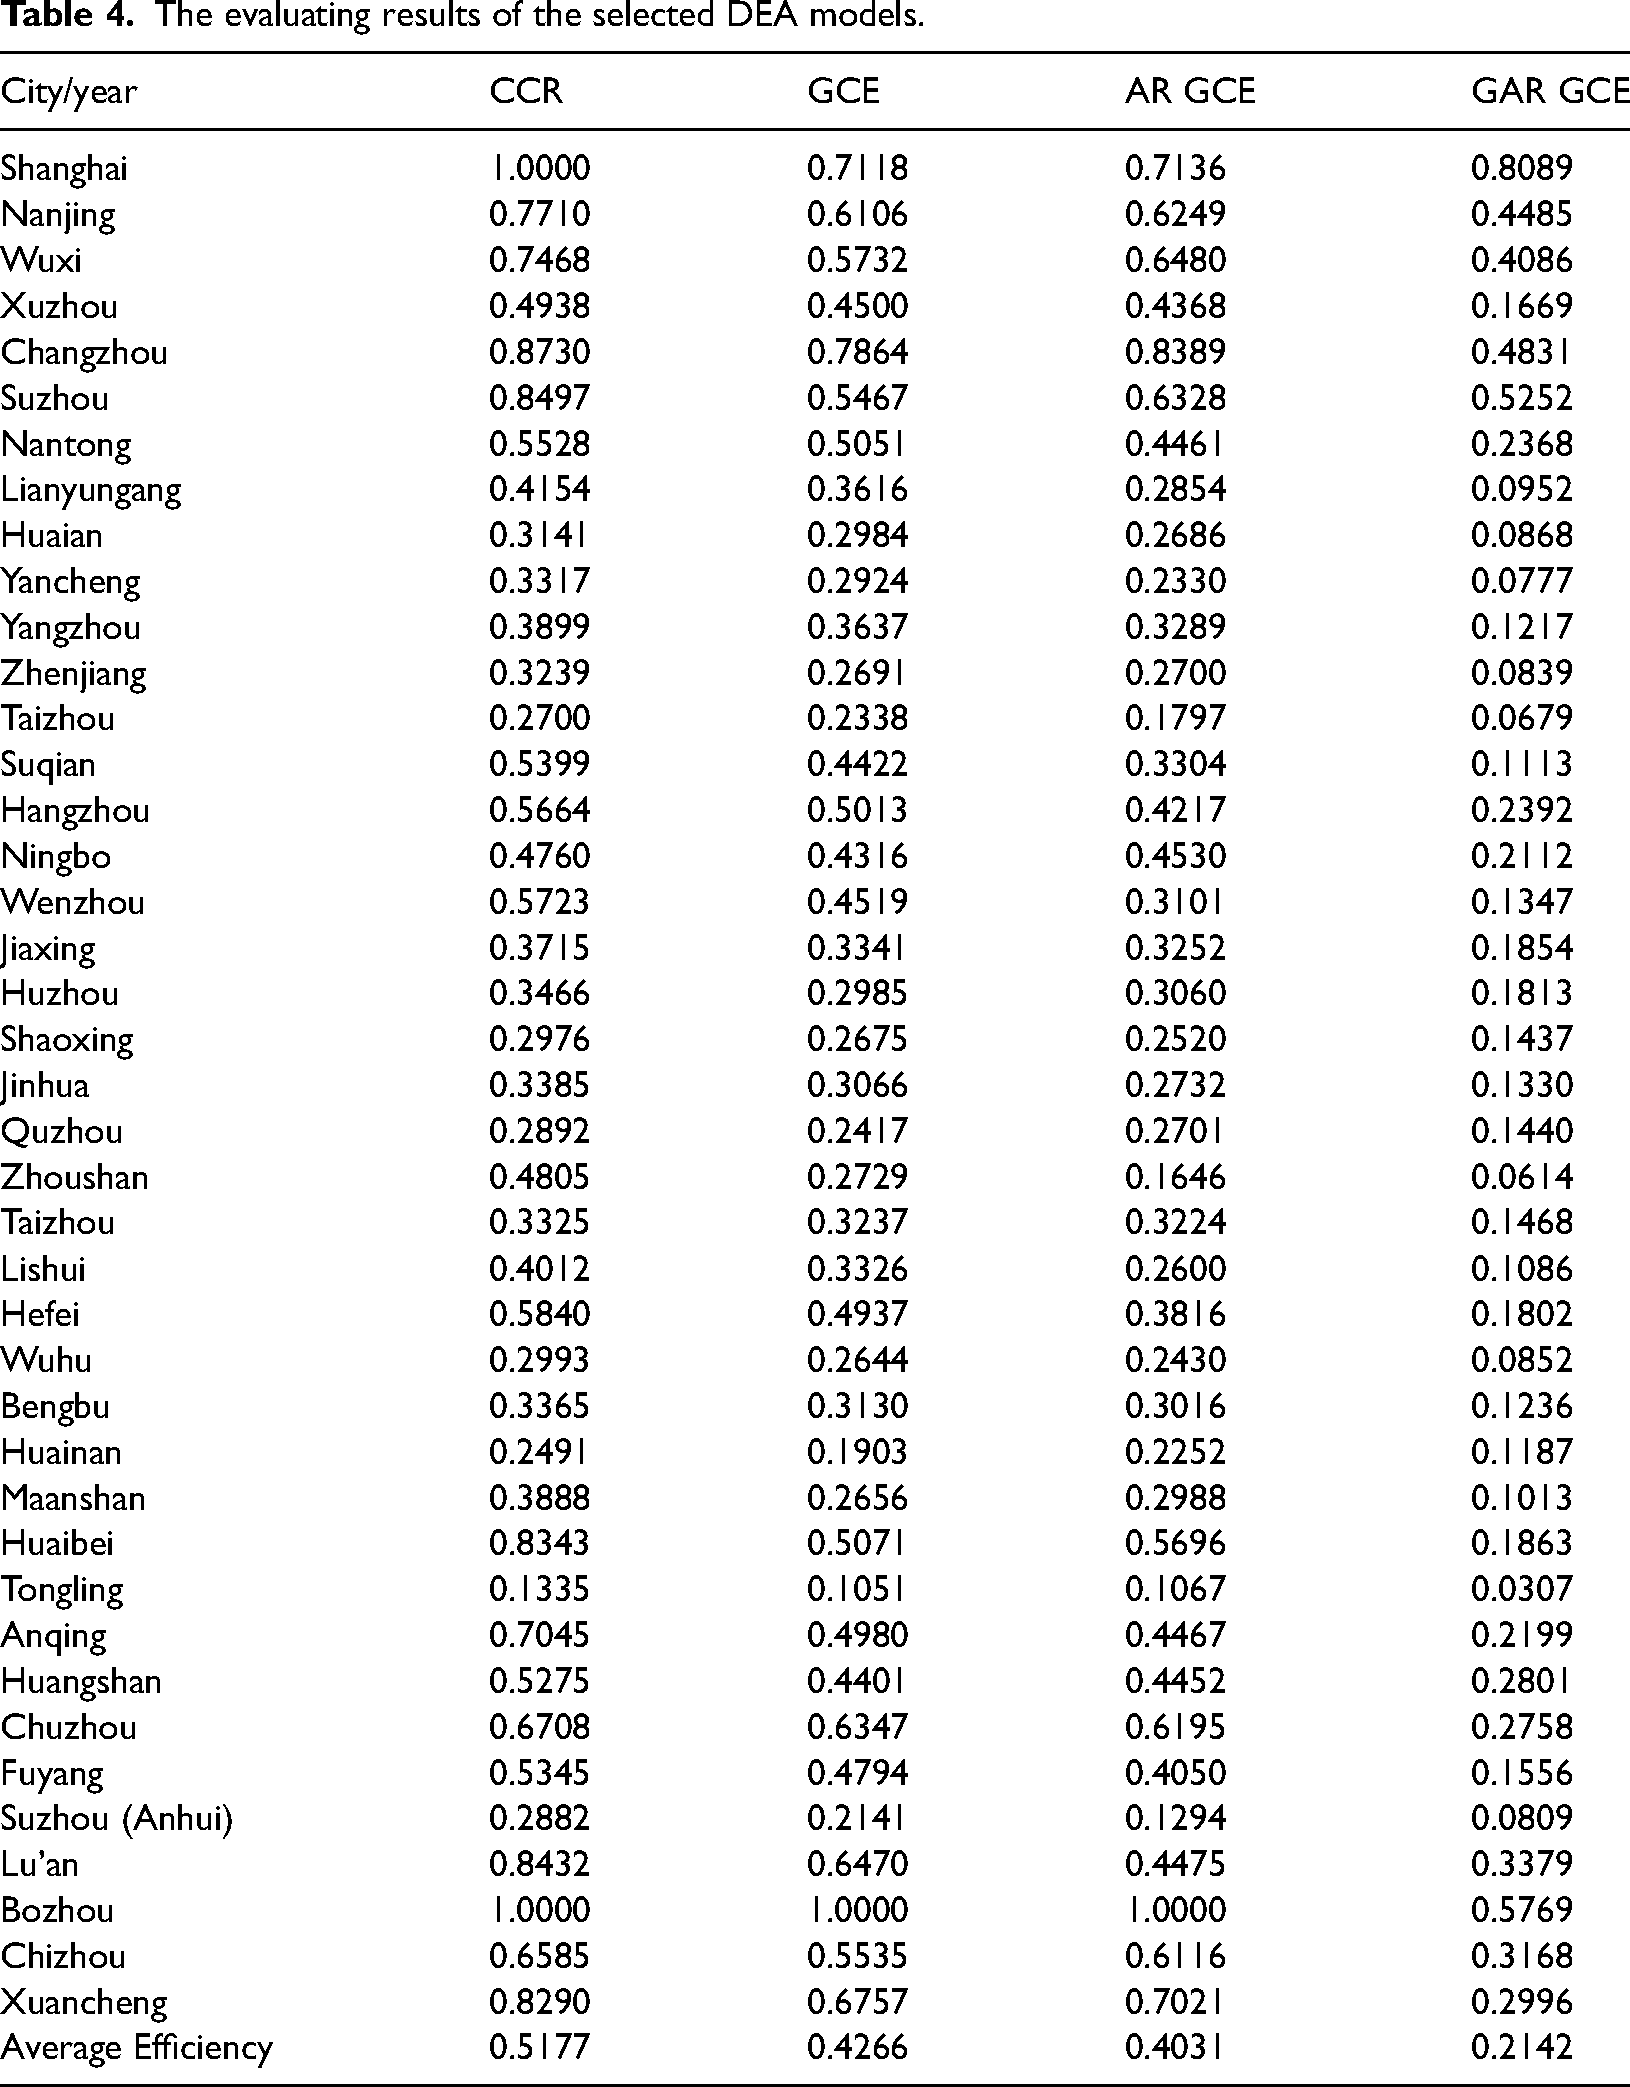
Regardless of the policy constraints of development, the productivity of the YRD can produce specific economic gains when given fixed input. However, considering the policy constraints and input levels remain unchanged, the output development may be restricted, and its efficiency value may be lower than that of the development environment without policy constraints. Among them, GAR GCE applies all-year DMUs as the reference, which leads to changes in the reference front and an increase in DMUs. In contrast to AR GCE, GAR GCE further includes DMU frontiers each year. As the projection area increases, the ratio of the distance from the origin to the DMU and the projection distance from the origin to the front surface decreases, causing the CEE to decrease. The result reveals that the industry's energy pollution and high carbon emissions have decreased the CEE. Therefore, the YRD government departments must effectively coordinate between economic development and carbon emissions and alleviate the pressure of carbon peaking development.
Figure 6 reveals that the fluctuation trend of these four models’ CEE evaluation results is similar, proving that the proposed model is generally reasonable. For each DMU, the evaluation results of traditional CCR models are usually higher than those of other models. As for the proposed GAR GCE, it can be shown that the efficiency values are relatively stable, and it also has a reasonable degree of differentiation for well-performing DMUs.
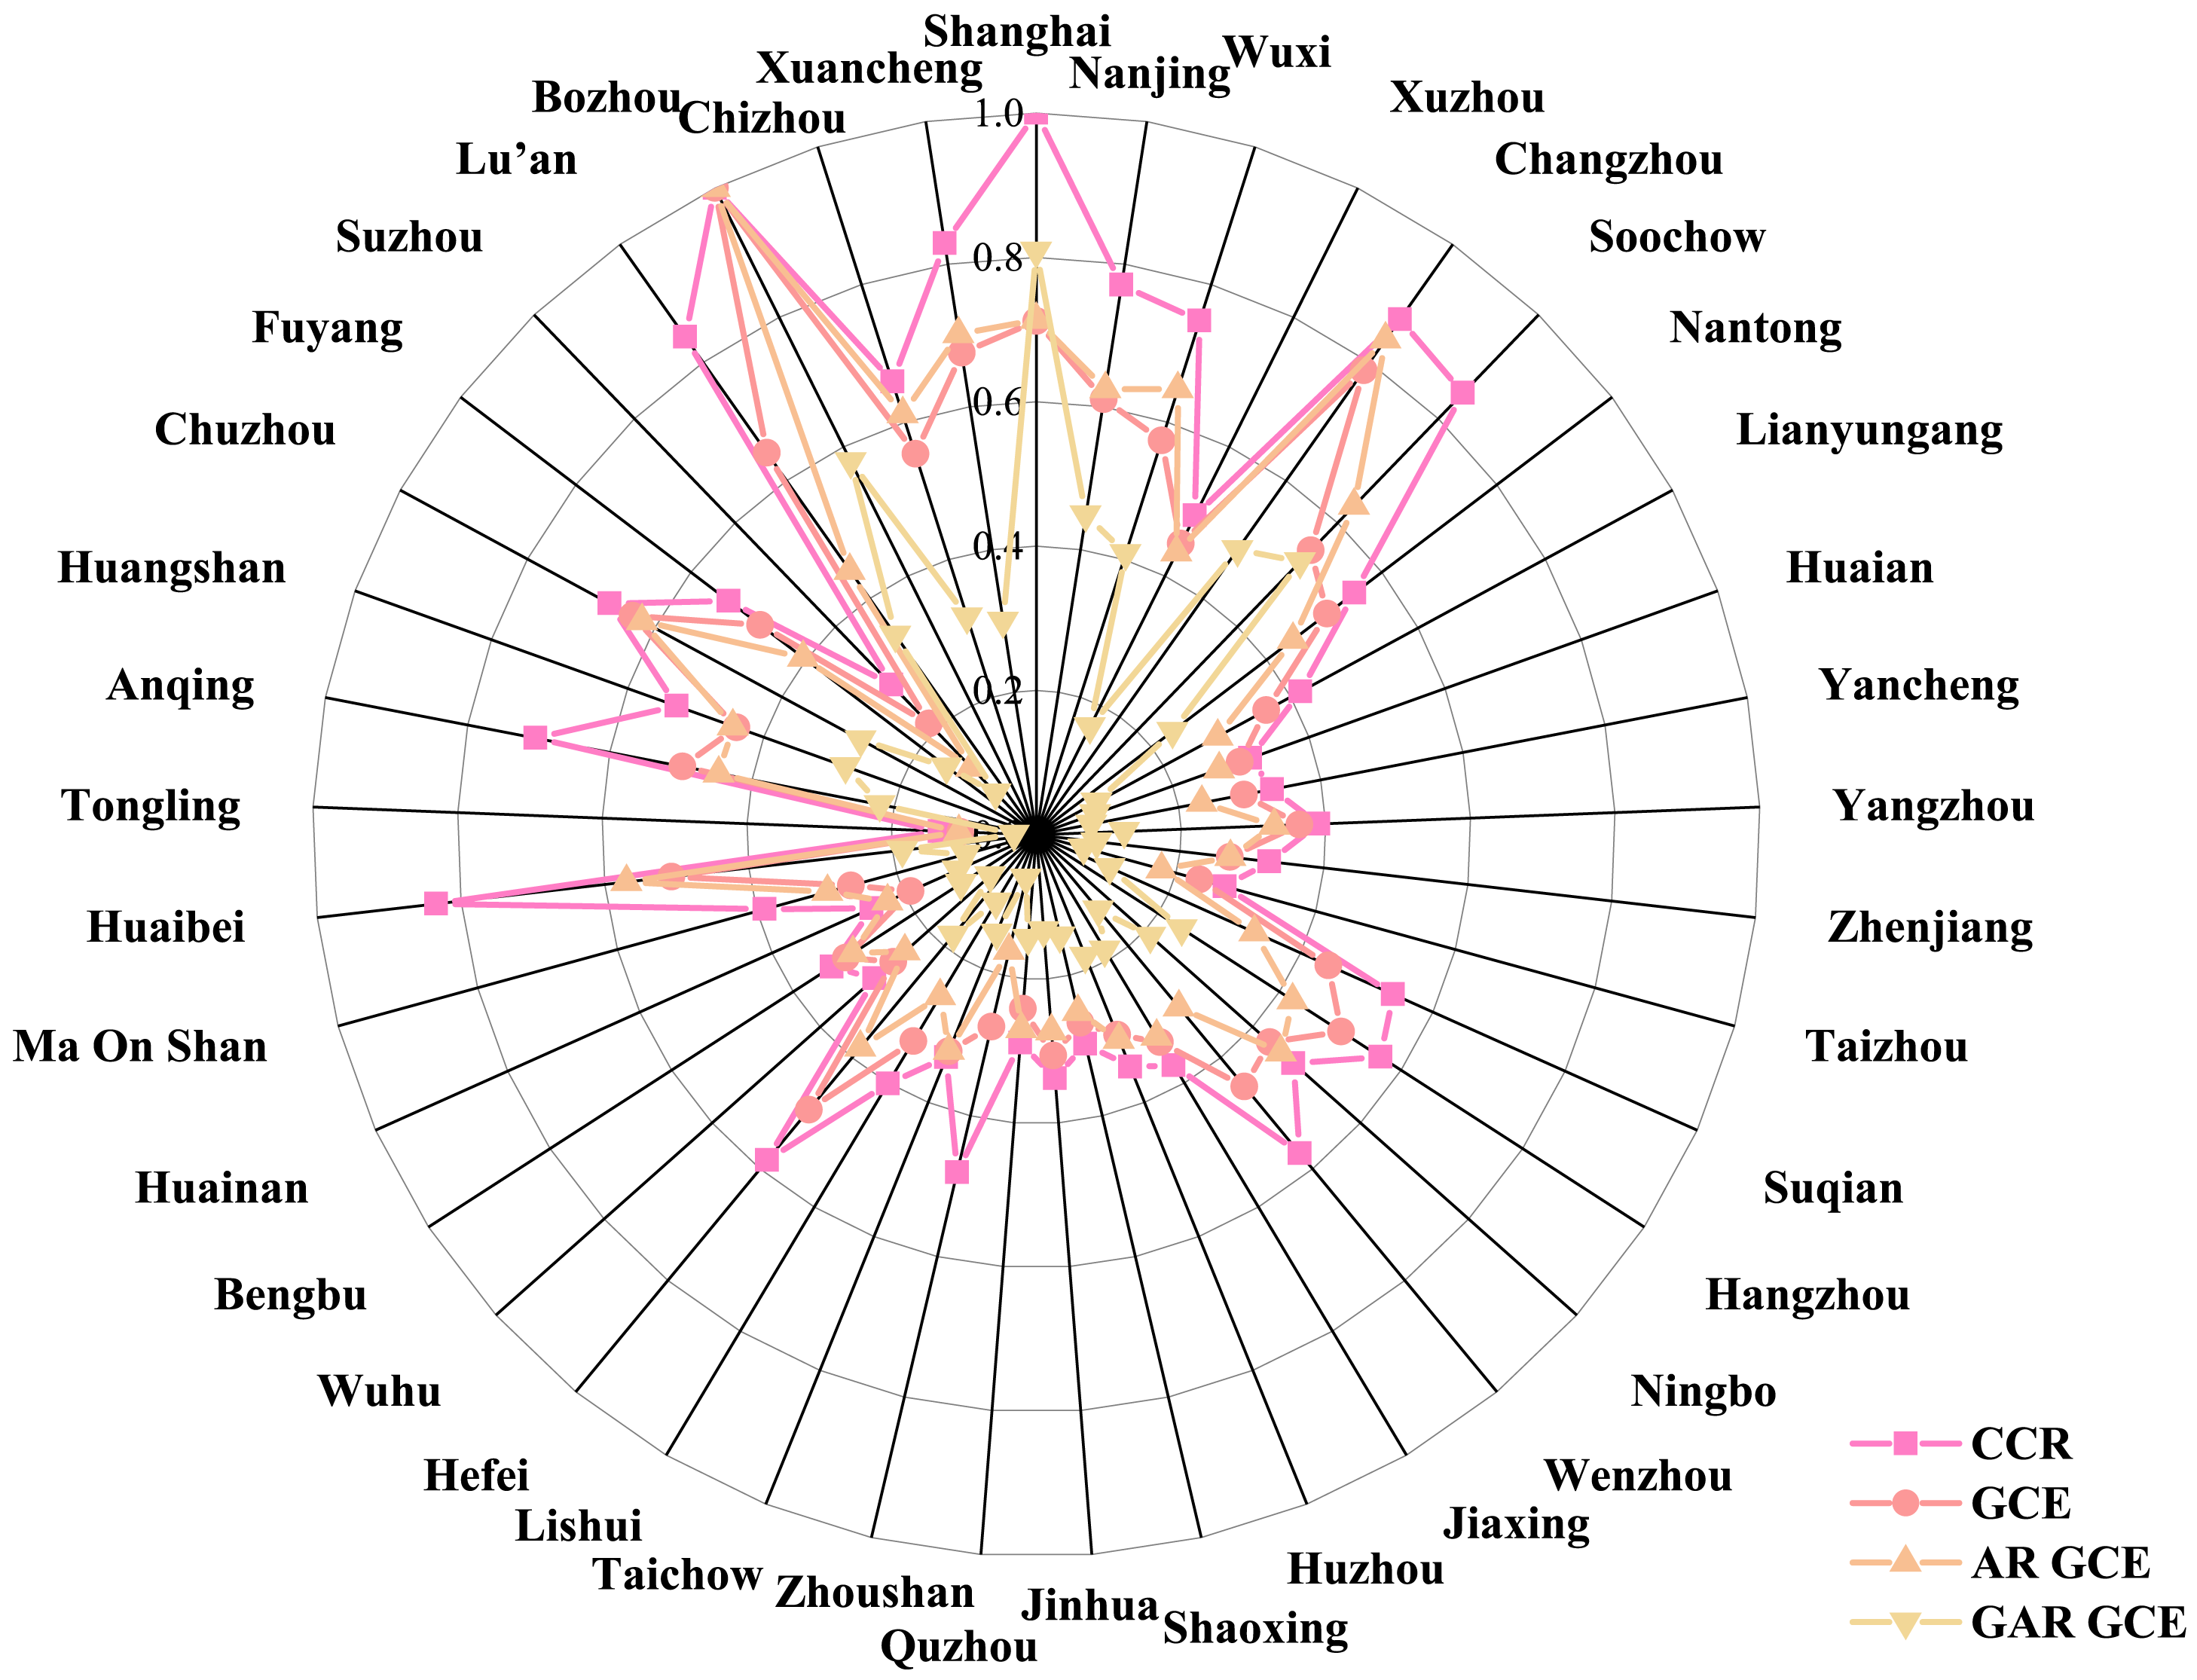
The results of the DEA models under different constraints.
The spatial–temporal analysis
This paper further combines the CEE score from 2023–2030 as measured by GAR GCE. It simulates four development scenarios under the policy restrictions. Table 5 shows the control policy constraint adjustment.
The four control policy scenarios based on the GAR GCE model.
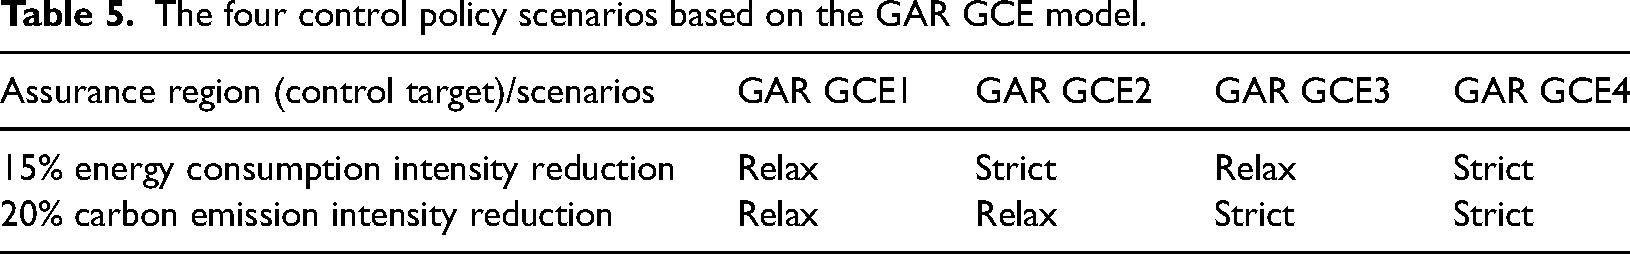
The GAR GCE1 means that from 2023 to 2030, 41 cities in the YRD will be relaxed constraints in the direct dual-control policies for 15% energy consumption and 20% carbon intensity reduction. It still focuses on the long-term economic development. The GAR GCE2 indicates that the 41 cities must comply with the 20% reduction in energy consumption and flexible reduction in carbon emission intensity. GAR GCE3 means that these cities will adopt more liberal policies on energy consumption but still maintain the 15% reduction in carbon emission intensity. GAR GCE4 is the current policy scenario.
As shown in Figure 7, under these four control policy scenarios, the CEE of the YRD city agglomeration is approximately U-shaped from 2023 to 2030. On the one hand, the figure reflects and verifies that in a hypothetical scenario with a given fixed input, when the intensity of policy constraints gradually becomes more robust, the constraints of DMUs in seeking to maximize the output may gradually increase, resulting in inefficiency, and eventually the CEE value decreases. On the other hand, the amplitude and trend of the four development curves change also show that the introduction of restrictive policies needs time to adapt and update on time. It shows room for improvement of the current dual-carbon control indexes in the YRD. As time goes by, the dual-carbon control indexes need to be flexibly optimized to meet the needs of high-quality development of the YRD.
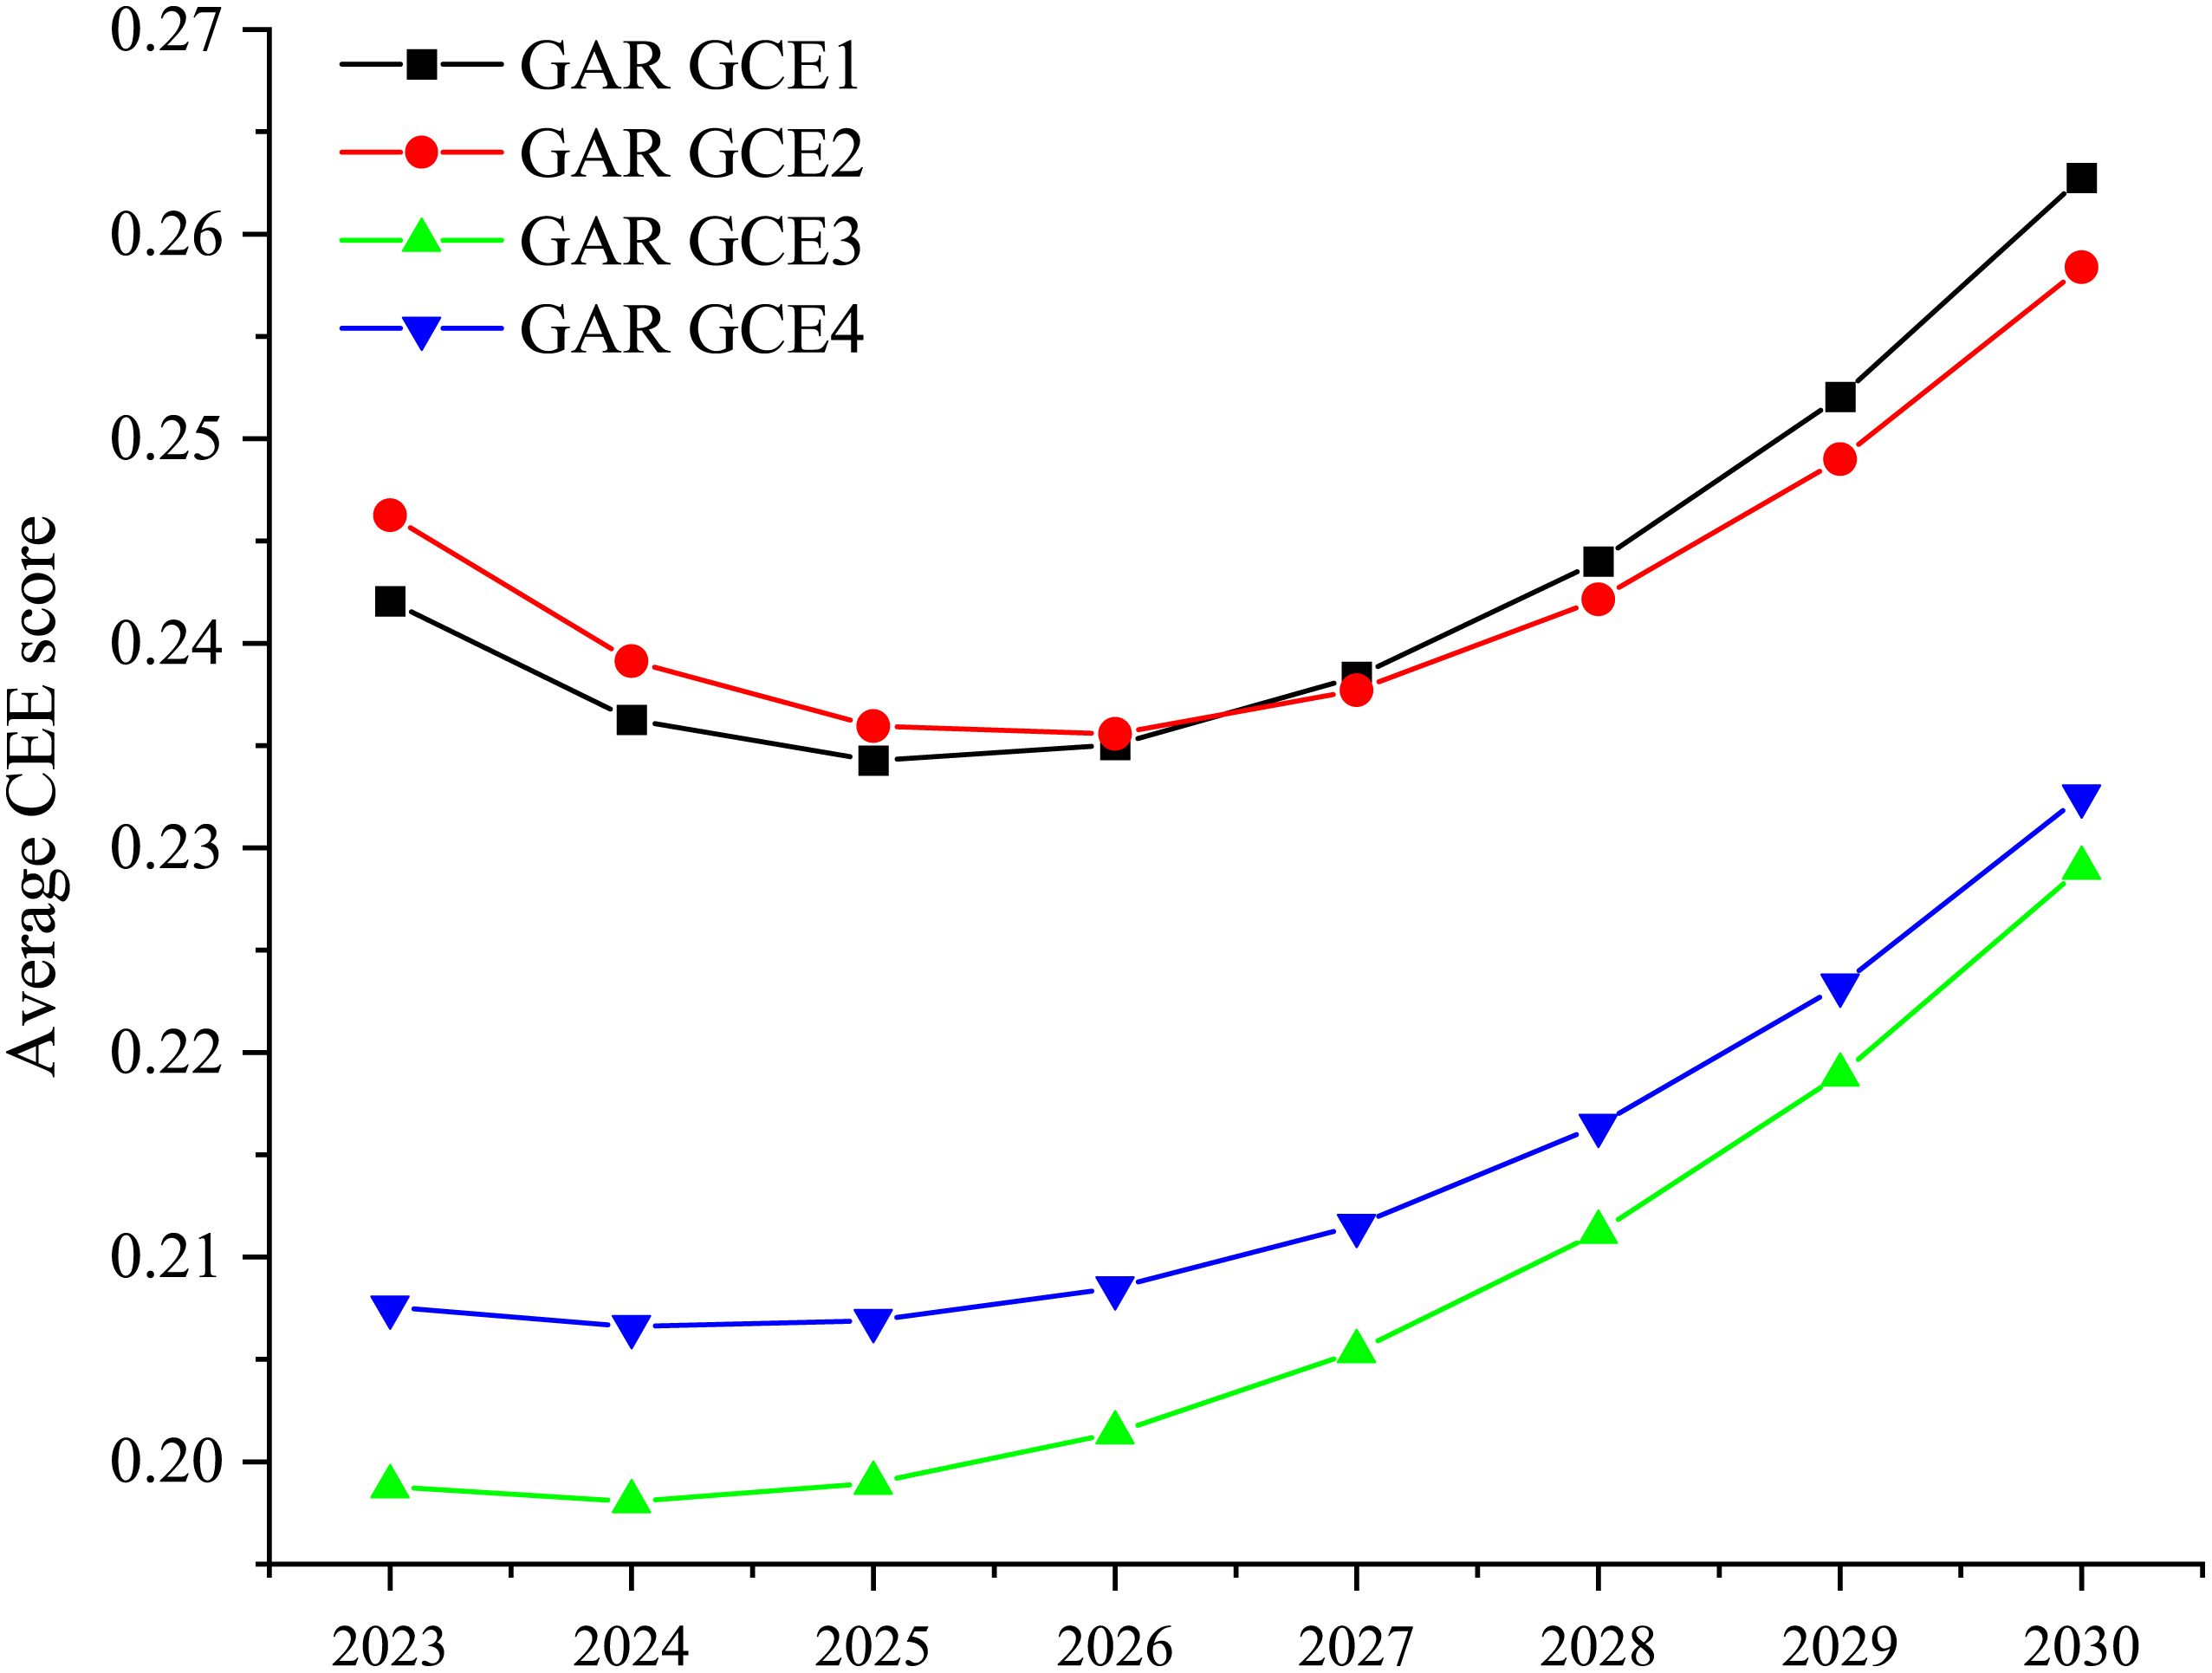
The average CEE score in the 41 cities of YRD.
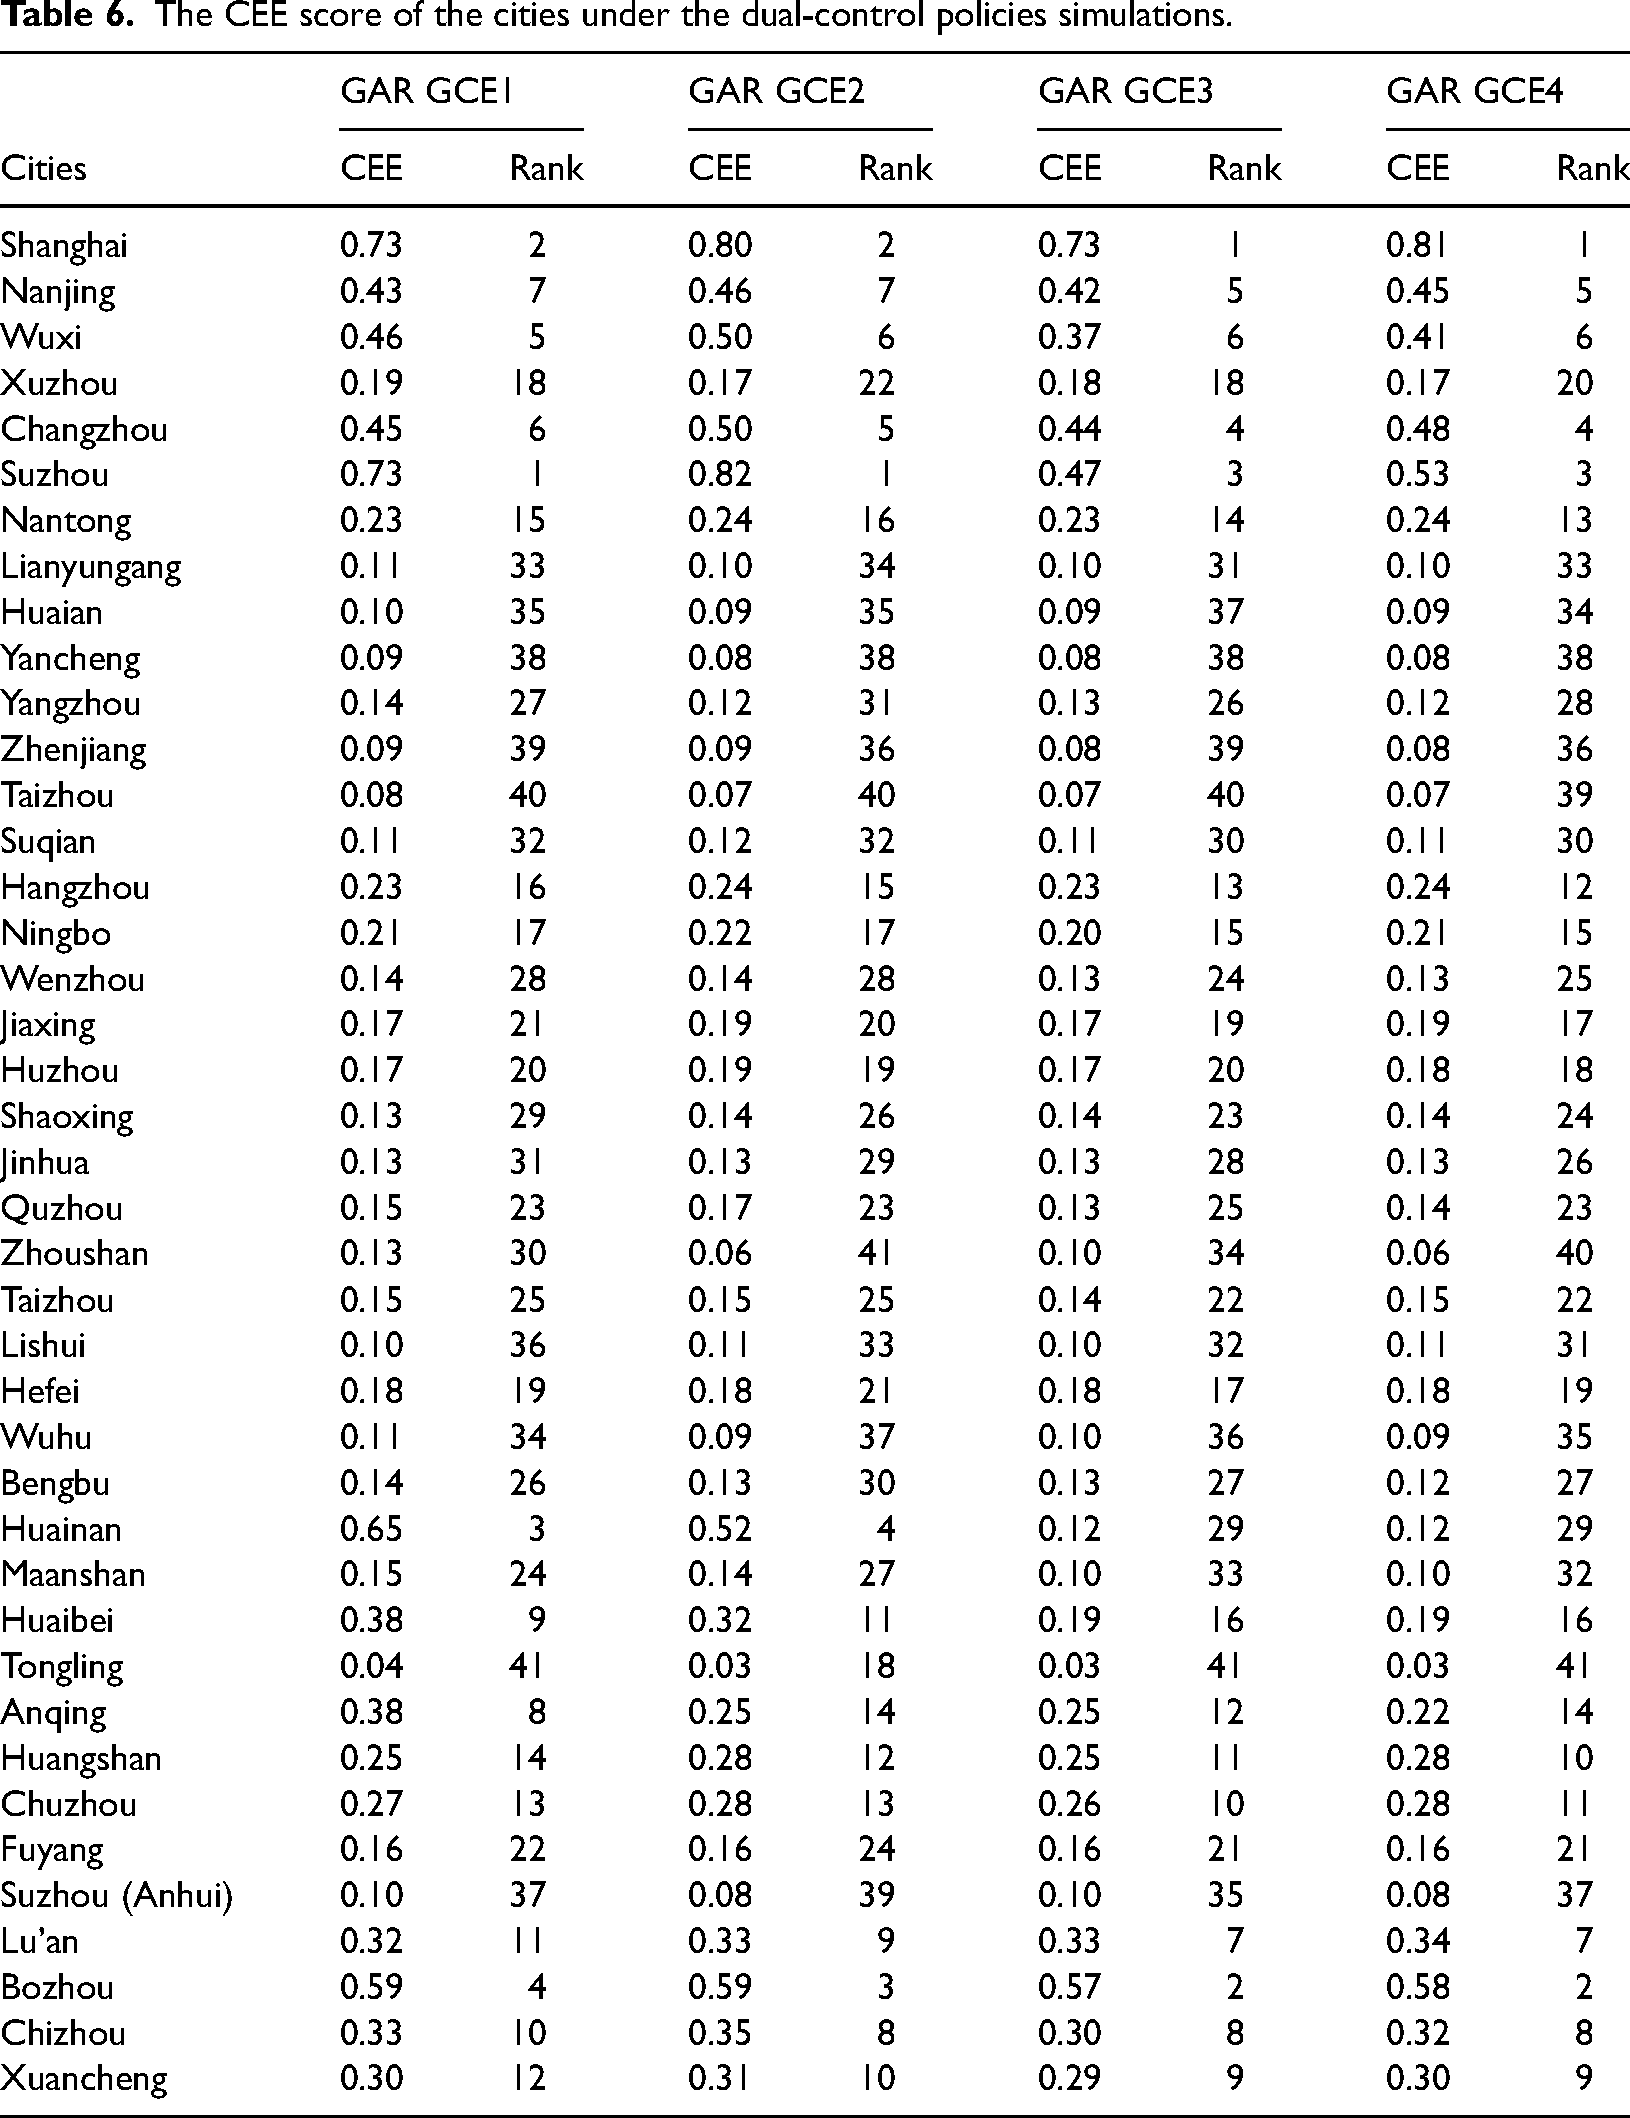
For further policy suggestions based on the results of the CEE under the gray forecasting perspective, this paper combines with the measurement results in Table 6. Table 6 shows the different CEE scores of these 41 cities’ ranks under different dual-policy simulations. Through these scenarios, Shanghai ranks first or second. Suzhou, Changzhou, Nanjing, Wuxi, and Bozhou remain among the top 10 CEE cities.
The CEE score of the cities under the dual-control policies simulations.
This paper selects the natural break point method in GIS research to divide the CEE of these cities into four levels. Table 7 shows the four different interval levels under the dual-control policies. The CEE evaluation levels are as follows: low efficiency (IV), moderately low efficiency (III), moderately high efficiency (II), and high efficiency (I).
The four different interval levels under the dual-control policies simulation.
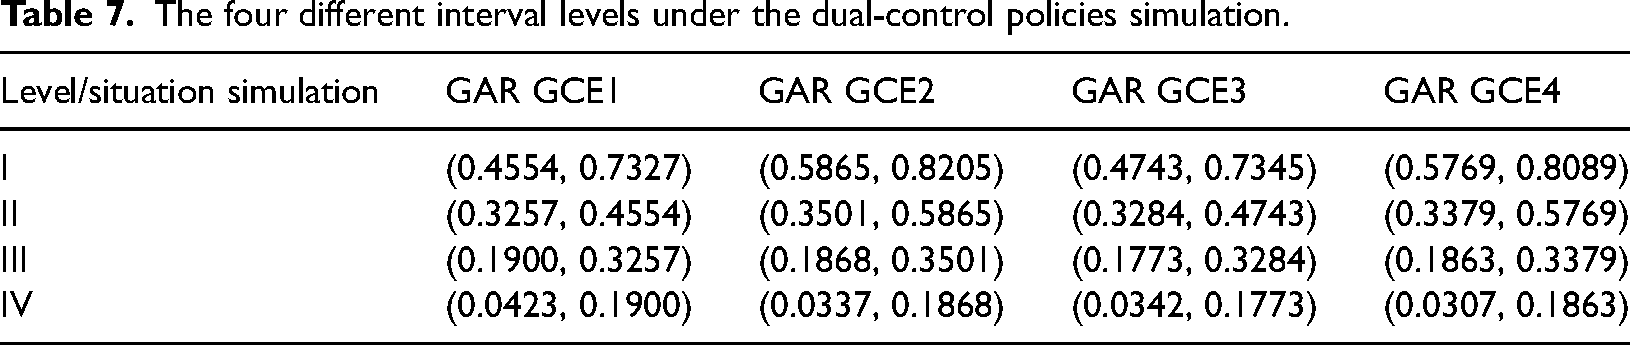
Figure 8 shows the overall CEE distribution of 41 cities in the YRD in the future. Most cities are in level III and level IV. From the perspective of overall spatial distribution, the cities with low CEE mainly concentrate on the north of Jiangsu and Zhejiang Province. In Jiangsu Province, the high CEE cities are mainly in the eastern and southern regions, and other low CEE cities are in the central and northern regions. Unlike Zhejiang Province and Jiangsu Province, Anhui Province mainly develops agriculture, and the CEE in Anhui Province is generally close to the moderately low level. However, as a significant economic province, the CEE of the cities in Zhejiang province are unsatisfied. After 2023, the Zhejiang government should gradually adjust the balance between economic and green development to suit the complex industrial structures.
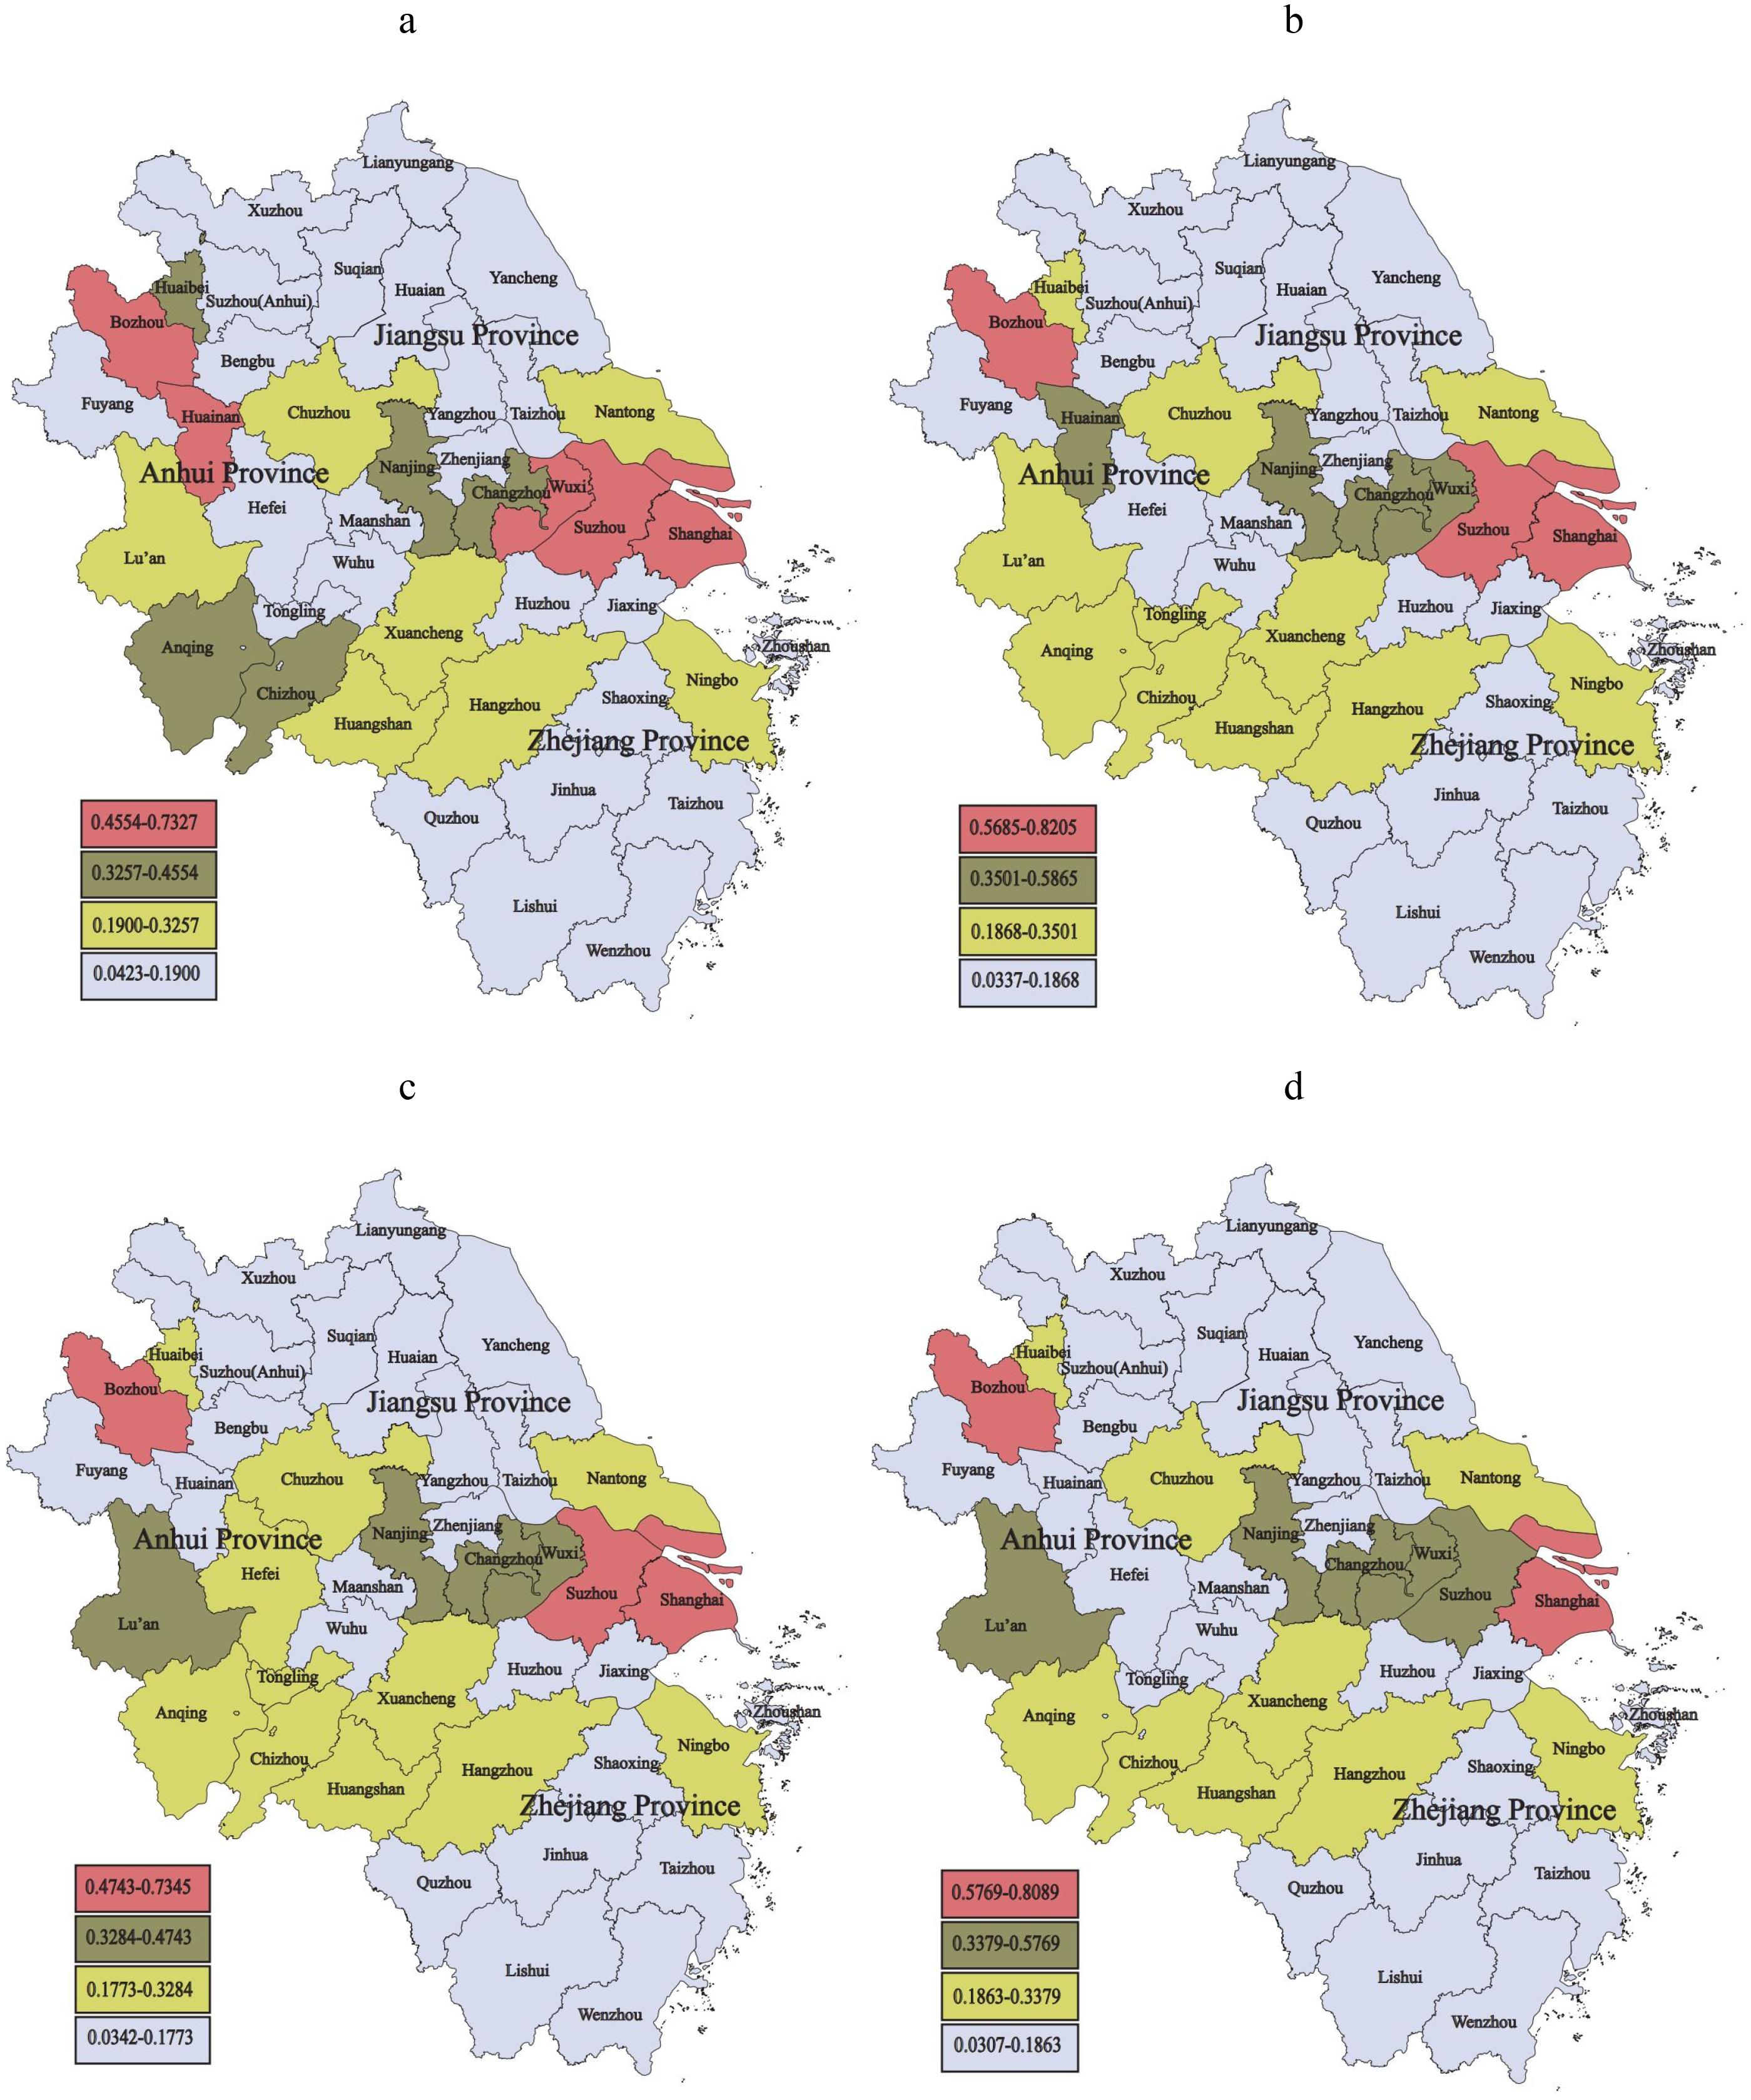
The distribution of CEE under four dual-control policies. (a) The distribution of CEE under the GAR GCE1; (b) The distribution of CEE under the GAR GCE2; (c) The distribution of CEE under the GAR GCE3; (d) The distribution of CEE under the GAR GCE4.
From the perspective of cities, Shanghai, Suzhou, and Bozhou have ideal CEE scores regarding the cities’ CEE results. Among them, Shanghai and Suzhou's overall economic development mode is leading in YRD, with developed services and high-tech industries. It reflects that their economic activities depend more on high-tech industries. Although Suzhou has relatively little heavy industry and high carbon industries, its overall CEE performance is still acceptable. Due to the previous unsatisfactory national environment assessment, Bozhou has vigorously carried out environmental protection work. Its CEE may be stable and second only to Shanghai in the future. It manifests the Bozhou government's environmental protection work's effectiveness in the current stage and verifies the simulation's effectiveness.
However, the CEE scores of Wuxi, Changzhou, Nantong, and Nanjing are above moderate. These cities are located next to each other, and the economic development of these cities exceeds most cities in Anhui Province. These cities’ industrial structures are still changing from heavy industry and traditional manufacturing industries to high-tech industries, and their CEE scores still have developed space to level I in the future. However, the industrial transfer of these cities also affected the CEE development of Xuzhou, Huaian, Zhenjiang, and Yangzhou in northern Jiangsu to a certain extent. It also led to the two-level differentiation of CEE in Jiangsu Province under the four dual-control policy simulations.
Conclusion and policy recommendations
Conclusion
Firstly, this paper selects the DDVOGM(1,N) and the WOA-GM(1,1) to forecast regional carbon emissions and other input and output datasets for economics and energy. The MAPE values demonstrate acceptable forecasting accuracy, which verifies the validity of the prospective perspective. The forecast results indicate that Shanghai's input and output data are more advanced than the other three provincial capitals. Regarding carbon emissions, all four cities exhibited a decreasing trend.
Next, in addition to the CCR and GCE models, this paper constructs the AR GCE and GAR GCE models to calculate the CEE scores. The findings reveal that without considering energy consumption and carbon emission limits, the average CEE scores for CCR and GCE are 0.5177 and 0.4266. However, considering the energy consumption and carbon emission constraints, the average CEE scores for AR GCE and GAR GCE decrease to 0.4031 and 0.2142, respectively.
Finally, this paper simulates four development scenarios under the policy restrictions. Under the four control policy scenarios, the CEE of the YRD urban agglomeration generally follows a U-shaped trend from 2023 to 2030. From the forecasting perspective, the overall CEE has a high space for growth in future development. The YRD government could dynamically adjust carbon emission limit indicators and coordinate the interaction between economic development and carbon emissions.
The proposed hybrid model could also apply a practical framework to forecast and estimate future CEE in other Chinese regions and guide the formulation of regional green development policies. However, this paper has some limitations, which could be further explored in future research endeavors. In this paper, the hybrid model construction for CEE assessment mainly focuses on the perspectives of the economy, energy, and carbon emissions. However, it does not consider the impact of natural environmental factors on CEE, especially the effect of the water quality of the Yangtze River on carbon emissions in the YRD. Considering the influence of the water quality of the Yangtze River on regional carbon emission is a promising issue worthy of attention. Some previous studies have shown that water resources in the YRD have some correlation with regional carbon emission reduction planning. 54 The organic matter and microorganisms in the water of the Yangtze River could release a certain amount of greenhouse gases, such as CO2 and CH4, which form the carbon balance of the water ecosystem with the photosynthesis of aquatic plants in the Yangtze River.55,56 It is worth the attention that the deterioration of water quality in the Yangtze River may enhance the activity of microorganisms in the water, accelerate the conversion of organic carbon to inorganic carbon, and increase carbon emissions. The pH of the water quality may also affect the carbon emission of the Yangtze River to varying degrees. Therefore, it is meaningful for this paper to introduce quantitative indicators of Yangtze River water quality based on the proposed hybrid model as future work to form a novel CEE prospective assessment system linking economy, energy, water quality, and carbon emissions. This paper could further determine the uncertain factors, replace the existing dummy variable matrix for forecasting accuracy, and strengthen the effectiveness of the foresight perspective. It may also measure the corresponding CEE of other city agglomerations and further explore CEE's improvement potential among different regions in China.
Policy recommendations
First, the dual-control ratio of energy consumption and carbon emission intensity should be appropriately adjusted, and the pressures between economic development and carbon emissions should be mitigated. In this paper, under the dual constraints of energy consumption and carbon emission limitation, the overall carbon emission in the YRD shows a decreasing trend. Governments need to achieve reasonable coordination between economic development, energy saving, and carbon emission reduction through reasonable and flexible policy regulation. As the economic development center of southeast China, The YRD has the potential to take the lead in achieving regional integrated green development in the future. Therefore, the 41 cities should choose a dynamic ratio for flexible regulation because of the sensitive effect of dual control on economic development to achieve the optimal allocation of energy consumption and carbon emission intensity control.
Second, optimize the industrial allocation in the YRD and formulate development policies centering on regional industrial and energy structures. The regional industrial structure and layout of the YRD are complex. Anhui mainly develops in agriculture, and the north of Jiangsu has many industrial enterprises. Zhejiang province has a more mixed, multi-industry structure. Therefore, the regional government should formulate suitable low-carbon policies for the leading industries in their respective regions. It is practical to carry out appropriate transformation and adjustment according to the industrial regional layout of 41 cities. Governments should appropriately guide some developed cities to achieve industrial transformation and invest in economic support for their low-carbon development. It is advisable to formulate relatively strict energy consumption intensity limits and reasonable carbon emission intensity limits for high-tech cities such as Shanghai and Suzhou.
Third, promote the integration process of green development in the YRD and further realize the coordinated and sustainable development of the regional economy. This paper shows similarities in high industrial structures in some regions of the YRD, and the industrial differences among provinces and cities are apparent. The incentive policy to accelerate the integration will effectively promote the rational allocation of cross-provincial resources, strengthen the development cooperation, and form the complementary advantages of the leading industries of each city. It is necessary to weaken the similarity of the industrial structure in the YRD and reduce the repetitive construction of infrastructure and the discharge of environmental resource waste through regional economic integration. Through the incentive policies for green industry-integrated development of the YRD, introducing high-tech green industries to provinces and regions with low CEE could enhance the development intensity of clean energy and low-carbon technology and optimize the basic construction layout.
Supplemental Material
sj-docx-1-eae-10.1177_0958305X241310201 - Supplemental material for Regional carbon emission efficiency evaluation combining gray forecasting and game cross-efficiency analysis: The case of Yangtze River Delta
Supplemental material, sj-docx-1-eae-10.1177_0958305X241310201 for Regional carbon emission efficiency evaluation combining gray forecasting and game cross-efficiency analysis: The case of Yangtze River Delta by Youyang Ren, Yuhong Wang, Dongdong Wu, Lin Xia and Qing Yan in Energy & Environment
Footnotes
Acknowledgments
The research reported was partially supported by the National Natural Science Foundation of China (71871106); National Social Science Fund later funded projects (23FGLB051); the Fundamental Research Funds for the Central Universities (JUSRP1809ZD; 2019JDZD06; JUSRP321016); the Major Projects of Philosophy and Social Science Research of Guizhou Province (21GZZB32); Project of Chinese Academic Degrees and Graduate Education (2020ZDB2); Major research project of the 14th Five-Year Plan for Higher Education Scientific Research of Jiangsu Higher Education Association (ZDGG02); 2021 Wuxi Science and Technology Association key topics (KX-21-C025); Special Research Project on Education Digitalization by the Ministry of Education (CSDP24LF1G402); Key Project in Philosophy and Social Science of Wuxi (WXSK24-A-06); 2024 Wuxi Philosophy and Social Science Bidding Project (Special Project on Social Education Development) (WXSK24-JY-A01); 2024 Jiangsu Province Social Science Applied Research Excellence Project: Special Topic on Scientific Ethics (Research Integrity) (24SLA-01); Key-funded Project of Wuxi Association for Science and Technology (KX-24-A12); International Joint Research Laboratory for Artificial Forecasting and Decision Making Optimization at Jiangnan University.
Declaration of conflicting interests
The authors declared no potential conflicts of interest with respect to the research, authorship, and/or publication of this article.
Funding
The authors disclosed receipt of the following financial support for the research, authorship, and/or publication of this article: The research reported was partially supported by the National Social Science Fund later funded projects (23FGLB051); the National Natural Science Foundation of China (71871106); the Fundamental Research Funds for the Central Universities (JUSRP1809ZD; 2019JDZD06; JUSRP321016); the Major Projects of Philosophy and Social Science Research of Guizhou Province (21GZZB32); Project of Chinese Academic Degrees and Graduate Education (2020ZDB2); Major research project of the 14th Five-Year Plan for Higher Education Scientific Research of Jiangsu Higher Education Association (ZDGG02); 2021 Wuxi Science and Technology Association key topics (KX-21-C025); Special Research Project on Education Digitalization by the Ministry of Education (CSDP24LF1G402); Key Project in Philosophy and Social Science of Wuxi (WXSK24-A-06); 2024 Wuxi Philosophy and Social Science Bidding Project (Special Project on Social Education Development) (WXSK24-JY-A01); 2024 Jiangsu Province Social Science Applied Research Excellence Project: Special Topic on Scientific Ethics (Research Integrity) (24SLA-01); Key-funded Project of Wuxi Association for Science and Technology (KX-24-A12); International Joint Research Laboratory for Artificial Forecasting and Decision Making Optimization at Jiangnan University.
Supplemental material
Supplemental material for this article is available online.
References
Supplementary Material
Please find the following supplemental material available below.
For Open Access articles published under a Creative Commons License, all supplemental material carries the same license as the article it is associated with.
For non-Open Access articles published, all supplemental material carries a non-exclusive license, and permission requests for re-use of supplemental material or any part of supplemental material shall be sent directly to the copyright owner as specified in the copyright notice associated with the article.